


Introduction
A trematode infecting its first intermediate host forms a mass of parthenogenetic worms (Galaktionov and Dobrovolskij Reference Galaktionov and Dobrovolskij2003) appropriately recognized as a colony (Hechinger Reference Hechinger2023). In a mature colony, parthenitae usually produce dispersive offspring (cercariae) and, sometimes, new parthenitae. New parthenitae permit colony growth and replacement of dying parthenitae. Senescence and death of individual parthenitae appears to be a pervasive character among trematodes (Galaktionov and Dobrovolskij Reference Galaktionov and Dobrovolskij2003). However, we have little information on the death rates or lifespans of individual parthenitae in colonies. Nor do we have a method for getting such rates for a broad diversity of trematode species. This knowledge gap is unfortunate, as having death rates and lifespans would substantially expand our understanding of the intra-colony dynamics of trematodes. That understanding itself would open the door to addressing other types of questions, including those related to the evolution of parthenita senescence and the nature of social organization for trematodes that produce defensive soldier rediae (Galaktionov et al. Reference Galaktionov, Podvyaznaya, Nikolaev and Levakin2015; Hechinger et al. Reference Hechinger, Wood and Kuris2010; Mouritsen and Halvorsen Reference Mouritsen and Halvorsen2015).
The primary challenge for estimating parthenita vital rates for most trematode species is that we cannot observe and track individual parthenitae over time. Trematode colonies are hidden inside living molluscan hosts with deep, dense, and usually opaque tissues and shells. To thoroughly observe a colony, we must dissect the host. That dissection permits taking a ‘snapshot’ of colony structure, but precludes tracking parthenitae over time because it kills the host and therefore the colony. The few studies that have estimated parthenita lifespans have done so only under special conditions of limited relevance. For instance, it is possible to morphologically distinguish mother sporocysts and sometimes the first generation of rediae from subsequent generations, which can permit tracking the lifespans of those parthenitae in replicated, experimentally established infections dissected at different known ages (e.g., Ataev et al. Reference Ataev, Dobrovolskij, Fournier and Jourdane1997; Dinnik and Dinnik Reference Dinnik and Dinnik1954, Reference Dinnik and Dinnik1956, Reference Dinnik and Dinnik1960; Lie and Basch Reference Lie and Basch1967). This approach might work for the early developing colonies of some species, but it would not work for mature colonies that are filled with reproducing rediae of subsequent, overlapping, and indistinguishable generations. There are also some cases that can permit direct estimation of worm death rates in mature colonies – for instance, those with periodic within-host dynamics, such as synchronized births of new worms (Theron Reference Theron1981) or seasonal die-offs of old worms (Nikolaev et al. Reference Nikolaev, Levakin and Galaktionov2020 and references therein). However, such conditions do not apply to perhaps the great majority of trematode species. In vitro culture of trematode parthenitae could provide a solution (e.g., Augot et al. Reference Augot, Rondelaud, Dreyfuss and Cabaret1997; Lloyd and Poulin Reference Lloyd and Poulin2012; Yoshino et al. Reference Yoshino, Dinguirard and Mourão2010) but has met with limited success; thus far, only a single species, Schistosoma mansoni Sambon, 1907, has been successfully established in long-term, proliferative culture (Coustau and Yoshino Reference Coustau and Yoshino2000; Ivanchenko et al. Reference Ivanchenko, Lerner, McCormick, Toumadje, Allen, Fischer, Hedstrom, Helmrich, Barnes and Bayne1999). Hence, an alternative approach for determining parthenita vital rates would be very useful.
Here, we provide an approach to empirically estimate reproductive parthenita death rates and lifespans for mature trematode colonies with parthenita turnover and overlapping generations. The approach involves estimating two variables that should be obtainable for numerous trematode species: (1) the proportion of parthenitae that are currently senescing in a colony and (2) the average amount of time an encountered senescent worm lasts in the colony (‘residence time’). These two variables permit direct calculation of the average reproductive parthenita death rate and life span (see below).
The proportion of senescing parthenitae in a colony will often be obtainable because senescing parthenitae are recognizable. This is particularly true during the late stages of senescence; for example, they are characteristically ‘empty’, containing few and/or degenerating embryos (Dinnik and Dinnik Reference Dinnik and Dinnik1954; Galaktionov and Dobrovolskij Reference Galaktionov and Dobrovolskij2003). For many trematodes, we can also even detect the first sign of senescence, as it is marked by the degeneration and disappearance of the ‘germinal mass’ (Cort et al. Reference Cort, Ameel and Van der Woude1950, Reference Cort, Ameel and Van der Woude1954; Dinnik and Dinnik Reference Dinnik and Dinnik1954; Galaktionov et al. Reference Galaktionov, Podvyaznaya, Nikolaev and Levakin2015). The germinal mass is a collection of germinal cells, supporting tissues, and early embryos and is partly analogous to the ovary of the sexual adult stage (Cort et al. Reference Cort, Ameel and Van der Woude1954; Galaktionov and Dobrovolskij Reference Galaktionov and Dobrovolskij2003). For species with a germinal mass, that organ produces all new embryos, which initially develop in it before being released into the brood chamber (often called a ‘body cavity’ or ‘schizocoel’) to join older developing progeny before exiting the parthenita (Galaktionov and Dobrovolskij Reference Galaktionov and Dobrovolskij2003). When the germinal mass degenerates, the parthenita creates no new embryos and senescence begins. Hence, germinal mass degeneration or loss provides a concrete, visible marker for identifying and counting senescent parthenitae in a destructive colony census.
We realized that it would be possible to get the second variable (the residence time of senescent parthenitae in a colony) because, after degeneration of the germinal mass, most of the already developing offspring in the brood chamber of a senescent parthenita finish development and are released, after which the empty parthenita quickly disintegrates (Dinnik and Dinnik Reference Dinnik and Dinnik1954; Theron Reference Theron1981) or is consumed by colony mates. The exiting of those remaining progeny therefore provides us with a ‘countdown timer’ for the death of a senescent parthenita. We simply need to count the number of viable progeny in a senescent parthenita and estimate the time it takes to release them. As the vast majority of embryos in a mature colony develop not into rediae but into cercariae, which exit the parthenita and disperse into the environment, we can estimate the egress rate of viable progeny in a senescent parthenita by applying the average per-parthenita cercaria release rate characterizing the colony as a whole. This latter rate is easy to directly quantify by standard infected snail cercaria ‘shedding’, followed by dissection and counting of the total number of mature reproductive parthenitae.
After getting those two variables, we can estimate the per-capita death rate of reproductive rediae and their lifespans. The per-capita death rate will be the proportion of parthenitae in a colony that are senescing divided by their average residence time. For instance, if 25 out of 1,000 parthenitae (2.5%) are senescing, and the average senescing parthenita disappears after 10 days, then the death rate would be 0.0025 parthenitae/day. Inverting that per-capita death rate provides us with the redia lifespan, which is 400 days in this hypothetical example.
Here, we demonstrate applying the above approach to a particularly tractable group of trematodes: the Philophthalmidae. In this family, parthenitae are rediae (that is, they possess a mouth, pharynx, and gut). Using philophthalmids of 3 genera, 3 marine species and 1 freshwater one, we provide what appears to be the first documentation that at least some philophthalmids have a germinal mass. This germinal mass is large and easy to observe. We show that redia senescence begins with degeneration of the germinal mass. We then conduct redia surveys and whole-colony cercaria shedding to use the above approach to estimate the average reproductive redia death rate and lifespan.
Methods
Study organisms
We studied philophthalmids from 2 first intermediate host species. The first host species was the long-lived marine California horn snail, Cerithideopsis californica (Haldeman, 1840) (Caenogastropoda: Potamididae). We studied 3 of the 4 philophthalmid species known to infect it (Hechinger Reference Hechinger2019; Huspeni Reference Huspeni2000; Nelson et al. Reference Nelson, Metz and Hechinger2025a, Reference Nelson, Metz and Hechingerb): Parorchis catoptrophori Dronen & Blend, 2008; Cloacitrema michiganensis McIntosh, 1938; and Cloacitrema kurisi Nelson & Hechinger, 2025. We collected snails naturally infected with mature philophthalmid colonies from Kendall-Frost Marsh in San Diego in March and October 2021 and July 2022. Selecting mature infections, which can persist for years (Kuris Reference Kuris and Esch1990; Sousa Reference Sousa1983; Sousa 1990), allowed us to avoid rapidly changing dynamics possibly associated with early colony development. We then ‘shed’ cercariae from snails by placing them individually in translucent plastic multi-compartment boxes, adding enough seawater to cover the shell, and exposing them to bright fluorescent light (~10,000 lumens) in the laboratory for 4 hours. We identified cercariae to species using Hechinger (Reference Hechinger2019) and Nelson et al. (Reference Nelson, Metz and Hechinger2025a, Reference Nelson, Metz and Hechinger2025b) at a dissecting or compound microscope. We measured shell length with Vernier calipers. To permit subsequent germinal mass surveys (see below), we isolated the snails and painted the shell spire with nail polish in a color code to trematode species. For colonies to be used for cercaria emergence (shedding) time-series experiments (see below), we affixed a wire label with a unique numerical ID to each shell, painting over the label with brush-on cyanoacrylate glue. We held all snails in outdoor tidal mudflat mesocosms at a density of 50–75 snails m-2 (10–15 per mesocosm). Each mesocosm contained approximately 0.2 m2 of mud from a local estuary (Kendall-Frost Salt Marsh). An artificial tide simulation system (adapted from Miller and Long (Reference Miller and Long2015)) supplied the mesocosms with gravel-filtered seawater on a cycle simulating contemporaneous and nearby natural inundation cycles. We defined the high tide (inundation) portion of each daily cycle as the period when the sea level at Scripps Pier was +0.92 m or higher than mean lower low water level (NOAA tide station 9410230). This is at or near the midpoint of the elevational distribution of C. californica at Kendall-Frost Salt Marsh (pers. obs.). During low tide, the mud was exposed to air. Temperatures were not monitored during routine husbandry but were monitored during experiments (see below).
The second host species was the freshwater, introduced snail, Melanoides tuberculata (Müller, 1774). This snail hosts at least 8 trematode species in the Americas, including the philophthalmid Philophthalmus gralli Mathis & Leger, 1910 (Chalkowski et al. Reference Chalkowski, Morgan, Lepczyk and Zohdy2021; Metz et al. Reference Metz, Turner, Nelson and Hechinger2023; Pinto and de Melo Reference Pinto and de Melo2011). We collected M. tuberculata from Chollas Lake in San Diego in June 2021. Similar to the above, we identified snails infected with Ph. gralli by examining cercariae released into filtered and dechlorinated tap water under bright lights. We measured shell height with Vernier calipers and housed infected M. tuberculata in groups of up to 12 in half-gallon plastic aquaria in room-temperature (approx. 20°C), filtered, and dechlorinated tap water and fed them boiled lettuce ad libitum. We housed experimental snails for a maximum of 10 days prior to dissection.
Proportion of rediae senescing
To determine the proportion of rediae in a colony that were senescing, we examined individual, reproductive rediae for the presence or absence of a germinal mass. We first isolated rediae from a snail by cracking the shell with a hammer in a Syracuse watch glass, separating the digestive gland-gonad complex (the ‘apical visceral mass’) from the body with fine forceps, and carefully teasing apart tissues to free rediae. To select rediae for survey, we then separately pooled 30–200 rediae from the anterior, middle, or posterior third of the apical visceral mass. In initial samples, we fixed the pooled rediae in hot 10% formalin to standardize morphometric measurements (n = 359 rediae across 15 colonies). We later transitioned to using live rediae for ease of processing (n = 335, 10 colonies). All Ph. gralli were examined fixed. Fixation influenced body volume calculation for 2 of the 3 marine species (see Results) but did not influence any other measurements or observations. The germinal mass and all embryos were readily quantifiable regardless of whether fixed or not.
After pooling rediae (and fixing them, if applicable), we used a random number generator to select 5–10 rediae from the pool. These we mounted on a glass slide in saline appropriate to the host species using a clean glass pipette and examined them using a compound microscope. We repeated this sampling process until we measured at least 10 rediae per region of the apical visceral mass, for a total of at least 30 rediae per colony.
We measured the length and width of rediae using an ocular micrometer, without coverslip pressure, in an excess of water. When statistically comparing redia sizes in reference to the presence or absence of a germinal mass, we separately analyzed formalin-fixed rediae and those measured live using t-tests.
We also counted the number of progeny inside each redia in the random samples. Because cercariae and embryos were often densely packed into the redia brood chamber and could obscure the germinal mass, we flattened rediae by drawing water out from beneath the cover slip. In some cases, especially with fixed rediae, this flattening was insufficient to determine whether a germinal mass was present or absent. In these cases, we popped individual rediae by applying slight pressure with a needle to the coverslip directly over the individual. Popping rediae caused them to expel the contents of their brood chamber, including the free-floating germinal mass. For each redia, we counted the number of mature cercariae, cercarial embryos, and germ balls in addition to scoring the presence or absence of a germinal mass. As progeny counts were overdispersed, we used negative binomial regressions to compare the number of embryos in non-senescing, senescent, and degenerating rediae for each species.
Cercaria release rate
While we demonstrated senescence-associated germinal mass loss in all 4 philophthalmid species, we quantified the daily release of cercariae for only the 3 C. californica philophthalmids. Following at least 7 days of snail acclimation to the mudflat mesocosms, we conducted 2 overlapping series of cercaria release experiments, each series spanning 10 days. Tidal cycles dictated both the timing and duration of each observation period during the 10-day span, as we quantified cercaria release only during the high-tide inundation period (to best replicate natural cercaria emergence patterns). As snails were unable to eat during each observation period (which lasted for a single high-tide inundation period), we allowed all snails at least 3 days of rest between observation, during which time they could graze on the mud.
Before each observation period, we removed subject snails from mesocosms during the preceding low tide. All philophthalmids infecting C. californica encyst as ectometacercariae on hard surfaces, including the shell and operculum of their first intermediate host snail (Hechinger Reference Hechinger2019; Martin Reference Martin1972). To account for pre-existing metacercariae prior to the start of observations, we briefly rinsed each snail to remove mud and counted the number of metacercariae encysted on the shell and operculum by examination under a dissecting microscope. We kept snails out of water (for a maximum of 6h) until the start of the observation period.
In the first observation period of each series, we haphazardly assigned snails to either a 60-mL glass jar or a 15-dram (55.5 mL) clear styrene plastic vial with lid (BioQuip). In all following observation periods, we used only 15-dram vials. Choice of vessel had no effect on the experiment (see Results). At least 1 hour prior to high tide and thus the start of each observation period, we added 40 mL of seawater to all vials, permitting approximately 15 mL of air (20 mL of air in the glass jars). We allowed temperature and dissolved oxygen to equilibrate. Immediately prior to the start of each observation period, we measured temperature and dissolved oxygen in control vials using a glass thermometer and an Oakton Acorn DO 6 meter, respectively.
At the start of the observation period, we placed a single snail in each (pre-labeled) vial, aperture toward the vial base. We then transported all vials to the outdoor mesocosms (approximately 5 minutes transport time from the laboratory) and pushed each vial cap-down approximately 1 cm into the mud so that the vials remained upright and would not float during the inundation period. We kept snails in their original ‘home mesocosm’ throughout all experiments.
The duration and timing of each observation period matched that of the inundation period (> +0.92 m mean lower low water level) for that date. On dates where both the high tide and the low high tide exceeded this threshold, we conducted separate observations per individual for each inundation. We recorded control vial temperature, tub water temperature, percent cloud cover, moon phase (for nighttime experiments), and (where applicable) control vial dissolved oxygen at the beginning, end, and at least once near the middle of each observation period.
At the end of the inundation cycle, we transported all snails to the lab. As quickly as possible, we removed snails from their vials and added 0.8 mL concentrated formaldehyde (yielding ~2% formalin) to fix all cercariae and metacercariae. We counted the number of encysted metacercariae on the shell and operculum of each snail before returning snails to their home mesocosm.
We quantified the number of released cercariae by combining counts of cercariae and newly encysted metacercariae. Formalin-fixed cercariae were poured into finger bowls for counting at a dissecting microscope. We also counted all metacercariae encysted on the sides and lid of the vials. As we did occasionally find metacercariae encysted under or just outside the edge of the vial cap, we conducted a follow-up experiment to verify that cercarial escape from the vials was negligible (Supp. Mat.).
Colony censuses
Following the germinal mass surveys and the cercaria shedding experiments, we counted the number of rediae in each colony. While some colonies used in the germinal mass surveys were censused live, the majority were fixed in situ in whole deshelled snails in cold 10% formalin, transferred to 70% ethanol after 24–48 hours of fixation, and censused later. We fixed all colonies used in the cercaria shedding experiments prior to censusing.
Of the 24 colonies used in germinal mass surveys, 10 were censused live using previously described protocols (Hechinger et al. Reference Hechinger, Wood and Kuris2010). We divided snails into 3 regions: head/foot and mantle, basal visceral mass (from anterior of kidney to posterior margin of stomach), and apical visceral mass. We then separately teased apart tissues of each body region under filtered sea water to free rediae and squashed each region between glass plates for examination at a dissecting microscope. We counted all rediae, assigning them to one of three stages based on reproductive state using criteria adapted from prior studies (Garcia-Vedrenne et al. Reference Garcia-Vedrenne, Quintana, DeRogatis, Martyn, Kuris and Hechinger2016; Hechinger et al. Reference Hechinger, Wood and Kuris2010). We used the term ‘minor’ to generically depict small rediae lacking free germ balls or embryos; in the philophthalmids infecting C. californica, minors correspond to the previously described soldier caste (Garcia-Vedrenne et al. Reference Garcia-Vedrenne, Quintana, DeRogatis, Martyn, Kuris and Hechinger2016; Nelson et al. Reference Nelson, Metz and Hechinger2025a, b), but whether minors serve as soldiers has not been determined for Ph. gralli. ‘Intermediates’ contained free-floating germ balls or embryos in their brood chamber but lacked mature cercariae. ‘Reproductives’ contained at least one mature cercaria. We also recognized a subset of reproductives, ‘degenerates’, which, as described in Results, typically appeared more ‘empty’ than typical reproductives and contained a mix of mature cercariae and debris of failed embryos. The remaining 15 germinal-mass survey colonies that had been fixed were censused in the same way, following an initial rehydration in distilled water.
Because processing fixed rediae following the standard census technique was very time consuming (fixed rediae were brittle and difficult to separate from the tissues of the apical visceral mass), we developed a new method for censusing the fixed colonies used in the cercaria shedding experiments (Figure S1). As we were only interested in the census of reproductive rediae for these experiments, we did not count minors or intermediates. Following rehydration in distilled water, we separated each snail into three regions as above. The head/foot and mantle region and the basal visceral mass of fixed snails contained relatively few rediae and were therefore censused as above. To census the apical visceral mass, we carefully separated this region from the basal visceral mass at the distal margin of the stomach. In a clean watch glass in distilled water, we broke each apical visceral mass into 5–15 roughly cylindrical sections, depending on length. As fixation rendered the tissues brittle, we applied gentle torque in opposing directions of rotation to either side of the desired fracture plane with fine forceps, which resulted in a clean and relatively flat-faced break. For each cylindrical section, we counted all reproductive rediae visible beneath the tunica propria. These were deemed ‘cortical’ rediae, occupying the periphery of the apical visceral mass. For each fracture face, we then recorded the number of cortical rediae and the number of ‘subcortical’ rediae occupying the space beneath the cortical layer. We calculated the ratio of subcortical to cortical rediae at each face. The total number of subcortical rediae in the section was then estimated by multiplying the total number of cortical rediae by the average subcortical-to-cortical ratio from the proximal and distal fracture face of each section. For the distal tip of the visceral mass, we scored rediae visible from the side as cortical, while any rediae visible only by looking directly down at the tip were scored as subcortical. The proximal face of this section was scored as usual. We also counted all whole reproductive rediae that fell to the bottom of the dish when segments were broken. The total number of reproductives in the entire apical visceral mass was thus the sum of the count of rediae in the bottom of the dish, the cortical counts, and the subcortical estimates of each section.
Daily per-redia cercaria production rate
We sought to characterize the expected mean number of cercariae produced by an average redia through a year under natural tidal and temperature conditions. As daily cercaria emergence in our shedding experiments was overdispersed, we used a negative binomial generalized linear mixed model with a log link function to estimate average daily production. Mid-observation-period water temperature, weather, observation date, days post-collection, snail size, number of reproductives in the infrapopulation, snail sex, trematode species, and all sensible interactions with trematode species were fixed effects in the global model (Table 1). We set tub and individual snail identity as random effects, along with their interactions with temperature and reproductive population.
Negative binomial regression of factors influencing daily cercaria production in marine philophthalmids infecting C. californica

After reducing the global model to its significant explanatory variables (p ≤ 0.05) by backwards elimination (Quinn and Keough Reference Quinn and Keough2002), the final model let us predict the mean daily cercaria emergence rate for a given colony size at a given temperature (Table 1). To provide temperatures experienced by a typical colony in the wild, we obtained mean daily water temperatures during the inundation period (defined as the water level exceeding the mean lower low water level + 0.92 m) across 7 contiguous years at Tijuana Estuary (NERRS 2022). This locality is 28.5 km south of Kendall-Frost Marsh and thus has a similar climate and tidal cycle as that experienced by our focal organisms. To provide colony sizes, we used the number of reproductives counted during censuses associated with the 20 germinal mass surveys. We then evaluated the daily cercaria release model for every day across the 7-year span of water temperature data for each of the 20 focal colonies. On days in which the daytime high tide was less than + 0.92 m, we assumed no cercariae were released.
As in previous studies in this system (Fingerut et al. Reference Fingerut, Zimmer and Zimmer2003; Zavala Lopez Reference Zavala Lopez2015), we recorded small numbers of cercariae emerging at night. Though only approximately 16 cercariae per colony were released at night on average (~5% of daytime rates), the distribution was aggregated. One to two colonies of each species released a relatively large number of cercariae at night, while others released few or none. Because our lowest recorded temperatures for the cercaria shed experiments coincided with night, our model could not separate the effect of low temperature from the effect of darkness. Attempting to evaluate the per-capita cercaria production model for both day and night inundation periods yielded unrealistically high predictions. This was because nighttime water temperatures in Tijuana Estuary tidal channels did not differ dramatically from day temperatures. Because our model did not explicitly account for the suppressive effect of darkness on cercaria release (Fingerut et al. Reference Fingerut, Zimmer and Zimmer2003), including nighttime inundation periods in the evaluation roughly doubled the predicted per-capita cercaria release rate. To be conservative, we therefore only estimated cercaria shed rates for daytime inundation periods. To account for nighttime cercaria release, we added a flat 16 cercaria to each daily estimate. This increase had a minimal effect on the results. Comparing the results reported here to a re-analysis excluding these ‘extra’ nighttime cercariae showed that all confidence intervals overlapped. Senescence period point estimates were 3–4 days lower when including average nighttime cercaria production, while per-capita daily death rates differed only at the last significant digit. To explicitly account for winter regression, during which trematodes infecting C. californica are reported to cease production of new cercariae and both host and parasite enter dormancy during the coolest 4 months of the year (Fingerut et al. Reference Fingerut, Zimmer and Zimmer2003; Hechinger et al. Reference Hechinger, Lafferty, Mancini, Warner and Kuris2009; McCloy Reference McCloy1979; Race Reference Race1981), we excluded all model estimates for each span of 15 November through 15 March (Figure S2).
We found a significant effect of date on the number of cercariae produced, with snails producing 114 fewer cercariae per day on average after 2 weeks of mesocosm husbandry, controlling for temperature and colony size. This pattern held in both independent cercaria release experiment series. We therefore excluded data from all observations occurring after 14 days post-collection.
We then calculated the average daily productive-season cercaria release rate,
 $ k, $
for each focal colony from the above daily estimates, not including the 4-month dormant period. We divided the average daily cercaria production rate by the total number of reproductive rediae in each focal colony, N (taken to be error-free), to obtain the average per-redia daily cercaria release rate, c, for each colony.
Senescence period and death rates of reproductive rediae
We estimated senescence periods using the above empirical data. As we did not encounter empty ‘husks’ of living or dead parthenitae in colony dissections, it was reasonable to assume that senescing rediae die and disappear during or shortly after releasing their last progeny, as is typically expected (see Introduction). We also assumed that the cercaria release rate by senescing rediae does not substantially deviate from the average rate of all reproducing rediae in the whole colony (see Discussion). We estimated the average residence time of senescing rediae as the average number of viable progeny, m, divided by the daily per-capita cercaria production rate, c (as defined above). We defined viable progeny as the number of post-germ-ball embryos (including the most developed cercariae) plus 75% of all germ balls. The exclusion of 25% of the germ balls from viable progeny accounted for the frequent presence of a few inviable, degenerating embryos that we almost always observed remaining in the latest-stage senescent rediae (which were disintegrating). We directly estimated this proportion for Pa. catoptrophori, where there was a significant difference (quasi-Poisson regression, p < 0.0001, n = 93) in the number of germ balls inside disintegrating rediae (~2.0) versus those in a less advanced state of senescence (averaging ~7.5). Simplifying, we assumed that 25% of the germ balls in the average senescent redia would not survive to maturity. We also applied this percentage to the 2 Cloacitrema species, for whom we had encountered too few disintegrating rediae for direct estimation.
Hence, the senescence period represented the number of days the average senescing redia takes to void its remaining viable progeny (m/c). We then calculated the per-capita death rate,
 $ \mu $
, as the proportion of senescing rediae in the colony (p) divided by the average senescence period (m/c). The central tendency of death rates among colonies was calculated as the harmonic mean, as is appropriate for rates.
Our estimate of the average daily per-capita death rate,
 $ \mu $
, has uncertainty propagated from its three estimated constituent variables (p,
 $ m,\mathrm{and}\;c $
). The strongly asymmetrical error around these estimates precluded using normal error propagation rules (e.g., Taylor Reference Taylor1997). We therefore used the following simulation method to provide approximate 95% confidence intervals for
 $ \mu $
. First, we calculated the standard 95% confidence intervals directly or from model estimates for each constituent variable for each focal colony. Then, we randomly drew a single estimated mean value for each variable from a uniform distribution spanning the variable’s 95% CI and then calculated the estimated average per-capita death rate,
 $ \hat{\mu} $
. After 10,000 iterations of this process, we selected the middle 95% of
 $ \hat{\mu} $
values to reflect the 95% confidence interval of
 $ \mu $
. We confirmed the validity of this approach by applying the technique to
 $ \mu $
calculated from dummy variables of known mean, spread, and sample size, and determined that the known
 $ \mu $
was contained in the propagated 95% confidence interval roughly 95% of the time (Supplemental Materials).
Lifespan of reproductive rediae
Inverting the per-capita death rate of a reproductive redia will provide its estimated average lifespan. These calculated lifespans will be expressed in terms of productive-season days, as it is based on the cercaria release rate during that season. To estimate lifespan in actual years, we factored in our assumption of a lack of redia death during the 4-month winter regression period (see Discussion).
Other statistics
For cases not detailed above, we employed ordinary least squares analyses for hypothesis tests. We calculated binomial 95% confidence intervals using the Wilson score interval (Newcombe Reference Newcombe1998). We calculated confidence intervals around arithmetic means using the standard error and t-distribution. For harmonic means, we generated confidence intervals by simulation; within each species, we calculated 10,000 harmonic means of random draws from a uniform distribution spanning the 95% confidence interval of each colony’s death rate, and then reported the middle 95% of this distribution as the approximation of the harmonic mean confidence interval. Linear regressions of colony size on per-capita and whole-colony death rates followed standard procedures (Quinn and Keough Reference Quinn and Keough2002).
We analyzed regression models, performed most calculations, and drafted figures in R version 4.0.3. For negative binomial mixed models, we used the lme4 package. The MASS package contains the glm.nb function, which we used to fit a fixed-effects negative binomial model. We used JMP Pro 15 for basic data exploration.
Results
The germinal mass, senescing rediae, and degenerate senescing rediae
The germinal mass was easily discernible in the minor, intermediate, and reproductive rediae of each species (barring senescent reproductives). Minors possessed a germinal mass embedded in parenchymal tissue, typically at the posterior margin of the gut. In intermediates (maturing rediae with a recently opened brood chamber), the germinal mass was typically already free-floating, often having released a few germ balls (Figure 1b). In reproductives (those that had matured to the point of having at least one fully developed cercaria), the germinal mass was free-floating in the brood chamber and morphologically distinct from all co-occurring embryos (Figure 1c, d). It consisted of an irregular clump of germ balls embedded in supportive tissue and which could often be freed with gentle coverslip pressure. Germ balls so freed were morphologically indistinguishable at 400x magnification from the smallest germ balls found floating in the brood chamber. Large cells, ostensibly germinal cells, were frequently clumped at a single locus in the germinal mass.
The germinal mass is present in actively reproducing rediae. A. Degenerating (left) and actively reproducing (right) Parorchis catoptrophori rediae at low magnification. B. A free-floating germinal mass (arrow) in a small, growing, maturing ‘intermediate’ Cloacitrema kurisi redia. C. A mature reproductive C. kurisi redia under heavy coverslip pressure. The arrow marks the germinal mass; asterisks mark three near-mature cercariae. D. Higher magnification view of C., highlighting the germinal mass (arrow).

The proportion of reproductive rediae lacking a germinal mass (senescent rediae) averaged 14% (95% CI: 9.2–20%, n = 5) for Cloacitrema kurisi, 15% (10–21%, n = 5) for C. michiganensis, 24% (20–29%, n = 10) for Parorchis catoptrophori, and 28% (18–41%, n = 5) for Philophthalmus gralli (Figure 2).
The estimate of the senescing proportion in a trematode colony is much lower when only considering degenerating rediae (red data) compared to those lacking a germinal mass (black) for multiple colonies of each species. Degenerating rediae were obviously dying and appeared relatively turgid, translucent, and empty in comparison to other worms in the colony. Error bars are 95% binomial CIs, lacking for degenerate rediae as their data came from exhaustive censuses. Horizontal bars represent the grand mean for each species, with the shaded region indicating the 95% CI of the grand mean. Clku = Cloacitrema kurisi; Clmi = C. michiganensis; Paca = Parorchis catoptrophori; Phgr = Philophthalmus gralli.

For each species, we detected a subset of senescent rediae that appeared to be obviously old and dying. These ‘degenerate’ rediae were characterized by having a relatively ‘empty’ brood chamber containing free-floating debris mixed in with active cercariae, apparent turgidity of the body, lack of germinal mass, and little to no muscular activity of the redia itself (Figure 1a). Note that the last trait is often difficult to ascertain at low magnification, as cercaria movements inside a dying redia can cause it to appear quite active. Degenerates of Cloacitrema kurisi also appeared opaque white to yellowish.
These degenerates were only a small proportion of the true number of senescing rediae in each colony (Fisher’s exact tests of data pooled by species, p << 0.0001) (Figure 2); non-degenerate senescing rediae were 5.8 times (95% CI: 1.2x–11x) more common than degenerating rediae for Cloacitrema kurisi, 5.8x (1.8x–9.9x) more common in C. michiganensis, 15x (3.7x–40x) more common for Pa. catoptrophori, and 27 (7.7x–47x) times more common for Ph. gralli. In all cases, counting only degenerates dramatically underestimated the true proportion of senescent rediae.
The body volume of senescent rediae was statistically indistinguishable from that of mature rediae possessing a germinal mass for each species (t-tests, all p > 0.07, n = 29–156; data pooled by species and whether rediae fixed or live). Location in the apical visceral mass (anterior, middle, or posterior) had no influence on redia volume (within-species ANOVAs, p > 0.10, n = 21–94).
Progeny per redia
The number of embryos in non-degenerating senescent rediae was not significantly lower than in non-senescing reproductive rediae for all 4 species (Figure 3). Pooling such rediae, the progeny count averaged 25.4 (IQR 22.0–29.8, n = 150) for Cloacitrema kurisi, 20.1 (IQR 15.0–24.0, n = 150) for C. michiganensis, and 21.8 (IQR 16.0–26.0, n = 376) for Pa. catoptrophori. There was no influence of within-host location on the number of progeny per redia for Cloacitrema kurisi or C. michiganensis (ANOVAs, p > 0.10, each n = 21), but Pa. catoptrophori rediae in the anterior region had, on average, 5 fewer progeny than those located more posteriorly (ANOVA, p = 0.023, n = 94).
The number of embryos per redia remained relatively constant until the latest stage of senescence (degeneration) for Cloacitrema kurisi (negative binomial regression, p < 0.0001) and Parorchis catoptrophori (p < 0.0001). For C. michiganensis, we only encountered a single degenerating redia during random sampling, precluding a rigorous comparison of progeny counts among stages (p = 0.195), but additional qualitative observations indicated a similar pattern of fewer embryos in degenerating rediae of this species. The slightly lower mean progeny counts of early-stage senescing rediae compared to those of mature, non-senescing mature rediae was not statistically significant (negative binomial regression controlling for trematode species and excluding degenerate rediae, p = 0.107). Boxes depict the inter-quartile range; whiskers extend to data up to 1.5x the IQR. Black bars indicate medians; red bars indicate means. Sample size indicated above each boxplot. Clku = Cloacitrema kurisi; Clmi = C. michiganensis; Paca = Parorchis catoptrophori.
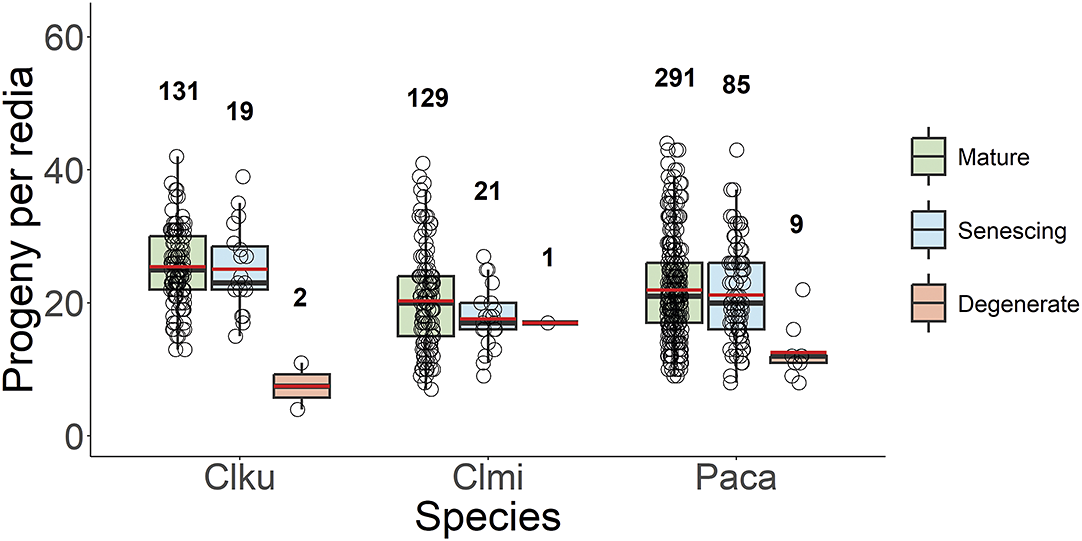
In contrast, degenerate rediae contained 17.6 (Cloacitrema kurisi) and 8.7 (Pa. catoptrophori) fewer embryos, on average, than either mature or non-degenerating senescent rediae (Figure 3). Due to low sample size, we could not assess whether C. michiganensis degenerates followed this pattern. We did not quantify the number of embryos in Ph. gralli rediae.
Cercaria shed rate
Water temperatures inside vials during the marine cercaria shedding series ranged from 11.8 to 28.4°C. Dissolved oxygen decreased throughout each observation period, from a mean initial reading of 7.45 mg mL-1 (range 7.4–7.5) to a mean final reading of 5.17 mg mL-1 (range 4.52–5.81). This final reading was within the range of dissolved oxygen naturally experienced by C. californica (McCloy Reference McCloy1979; Zavala Lopez Reference Zavala Lopez2015). In the first observation period of each series in which either 60-mL glass jars or 55.5 mL (15-dram) clear styrene vials were used, the choice of vessel had no effect on the number of cercariae shed during those days (quasi-Poisson regression of 1st observation periods only; p-value of vial type as a fixed effect = 0.831; temperature and number of reproductives were significant).
The favored model of the full dataset showed that only the total number of reproductives in a colony and water temperature at the observation period midpoint were significant predictors of cercaria production (Table 1, Figure 4a). Because the model did not explicitly incorporate information related to seasonality (e.g., host diet quality, day length, etc.), we could not confidently apply model predictions to winter months and therefore excluded that period of seasonal regression from model estimates (Figure S2). There was no significant difference between a model containing individual colony ID as a random effect and a model without that random effect (likelihood ratio test p = 0.665, ΔAIC = 1.82).
Experimental quantification of cercaria release rates permitted estimation of whole-colony and per-capita mean cercaria production. A. The rate of cercaria release was dependent on both the number of reproducing worms infecting a snail and environmental temperature. Observed counts of released cercariae are shown as points, the shapes of which correspond to the trematode species. Points are colored based on the temperature at which the experiment took place. Red lines indicate the best fit of a negative binomial regression model at three example temperatures: 15, 20, and 25°C. Shading around each line shows the confidence intervals around the predicted means. B. The mean number of cercariae released per day per infected snail was estimated using simulations that combined the above regression model, individual colony census data, and local sea surface temperature data and tide height observations. Points correspond to individual colonies, while the red horizontal bars and associated shading represent the species-level mean daily cercaria production estimate and 95% CIs. C. The daily cercaria birth rate per individual reproductive redia was estimated as in panel B, using cercaria production simulations. Points are individual colony estimates, while red horizontal bars and associated shading are species-level means and CIs. Clku = Cloacitrema kurisi; Clmi = C. michiganensis; Paca = Parorchis catoptrophori.

We evaluated the prediction equation from the regression for each focal colony for each of the 1,667 non-winter days (across 2,527 total days) during which the average snail in San Diego estuaries would be inundated. The number of cercariae released per day was overdispersed and best described by a negative binomial model (Figure 4a). Average estimated daytime cercaria emergence was 215 (95% confidence interval 184–246) for Cloacitrema kurisi, 332 (95% CI: 158–507) for C. michiganensis, and 244 (211–278) for Pa. catoptrophori (Figure 4b). Cercariae did emerge at night in relatively small numbers. Cloacitrema kurisi released an average of 17.9 cercariae per night (95% CI: 7.1–33), C. michiganensis released 16.7 (7.8–29), and Pa. catoptrophori released 13.8 (6.5–24). Per-capita cercaria production was estimated as 0.39 (95% CI: 0.33–0.45) for C. kurisi, 0.33 (0.30–0.37) for C. michiganensis, and 0.38 (0.31–0.45) for Pa. catoptrophori (Figure 4c).
Senescent period estimation
We estimated that the average senescing redia in a colony lives for approximately 2 more months (Figure 5): Cloacitrema kurisi, 54 days (95% CI: 36–72); C. michiganensis, 49 days (43–54); and Pa. catoptrophori, 54 days (42–65). The approximated 95% confidence intervals of the mean senescent period for each colony overlapped, both within and among species.
Estimated remaining residence period of senescent rediae for multiple colonies of 3 philophthalmid species infecting the horn snail. Data points represent means for individual colonies, and vertical bars represent the 95% CIs. The species means are shown by the solid red bars, while 95% CIs are shaded. Clku = Cloacitrema kurisi; Clmi = C. michiganensis; Paca = Parorchis catoptrophori.

Death rates of reproductive rediae
Knowing the average remaining residence time of senescing rediae and the proportion of reproductives that were senescing in a colony allowed us to directly calculate the per-capita daily death rate of reproductive parthenitae during the productive season (Figure 6a). The harmonic mean death rate of Cloacitrema kurisi reproductive rediae was 0.0025 deaths worm-1 day-1 (95% CI
 $ : $
0.0017–0.0052), C. michiganensis was 0.0018 deaths worm-1 day-1 (0.0008–0.0058), and Pa. catoptrophori was 0.0031 deaths worm-1 day-1 (0.0018–0.0060). These per-capita rates are equivalent to the proportion of the reproductive colony dying per day during the productive season. Hence, 1% of the reproductive rediae die approximately every 4 days for Cloacitrema kurisi, 6 days for C. michiganensis, and 3 days for Pa. catoptrophori.
Death rates of reproductive philophthalmid rediae per day. A. Per-capita death rates for individual colonies are shown as points, with 95% CIs as vertical bars. Solid red horizontal bars are harmonic means for each species, with 95% CIs (approximated by 10,000 simulation iterations) shaded. B. Whole-colony daily deaths, not including colony growth. Shaded regions show the 95% CI of the mean per species, with the solid red line indicating the best estimate of the mean death rate. Bars show 95% CIs of the death rate of individual colonies, with points indicating the per-colony best estimate. C. There is no clear relationship between per-capita death rate and colony size. D. Total deaths per day is linearly related to colony size. The red trendline is the linear regression; the shaded region around the line is the 95% confidence interval of the predicted mean. Clku = Cloacitrema kurisi; Clmi = C. michiganensis; Paca = Parorchis catoptrophori.

We could estimate the actual number of rediae dying in the average colony per productive-season day, by multiplying each colony’s estimated per-capita death rate by the total number of mature rediae in a colony (Figure 6b). The average Cloacitrema kurisi colony experienced an estimated 1.6 deaths per day (95% CI: 0.7–2.5) out of 585 reproductive rediae, C. michiganensis lost 4.3 rediae per day (95% CI: -0.2–8.8) out of 1,067 reproductive rediae, and Pa. catoptrophori lost 3.5 (95% CI: 2.3–4.6) out of 760 reproductive rediae. Note that because we calculated the confidence intervals of the species mean using the t-distribution by the Central Limit Theorem, the interval overlapped zero for C. michiganensis given its relatively large variance. In contrast, per-colony simulation intervals made no simplifying assumptions about underlying distributions and did not overlap zero (Figure 6b).
There was no sign that the per-capita death rate of marine philophthalmids changed with colony size (linear regression p = 0.72) (Figure 6c). The number of whole-colony daily deaths was linearly related to colony size, as expected (linear regression p = 0.00057, adjusted R2 = 0.464) (Figure 6d).
Lifespans of reproductive rediae
Inverting the death rates provides estimates of the average amount of productive-season days a reproductive redia should live. The estimate for Cloacitrema kurisi was 400 days (95% CI: 194–595 days), C. michiganensis was 560 days (174–1,320 days), and Pa. catoptrophori was 320 days (167–543 days).
If we assume that within-host dynamics halt during the 4 months of winter regression, translating the productive-day lifespan into the actual expected lifespan in years yielded estimates of 1.6 years for Cloacitrema kurisi (95% CI: 0.8–2.4 years), 2.3 years (0.7–5.4 years) for C. michiganensis, and 1.3 years (0.7–2.2 years) for Pa. catoptrophori.
Discussion
To our knowledge, this is the first time that parthenita death rates and lifespans have been estimated for any trematode in a mature colony with overlapping generations and parthenita death and turnover. Our new approach relied on (1) our documentation that the studied philophthalmid reproductive rediae have a germinal mass, (2) using the loss of the germinal mass marks the onset of senescence, (3) using the number of offspring in senescent rediae to set a ‘count-down timer’ to death, and the (4) calibration of that clock by estimating the average redia’s cercaria release rate under local, natural conditions. Implementation of the approach indicates that, among our 3 fully-studied philophthalmid species, the average encountered senescent redia persists in a colony for about 7 weeks, that 1% of the reproductive rediae die every 3–6 days, and that the average reproductive redia lives ~1.3–2.3 years.
Reproductive redia lifespan, senescence period, and death rate estimates
Our estimates of average reproductive redia lifespans of 1 or more years seem quite reasonable given known lifespans of some other trematodes. Adult Fasciola hepatica Linnaeus, 1758, for example, can live for several years inside a host (Andrews Reference Andrews and Dalton1999), while Clonorchis sinensis (Cobbold, 1875) Looss, 1907 can live for decades (Attwood and Chou Reference Attwood and Chou1978). While less is known about the longevity of individual parthenitae, the mother redia of Philophthalmus rhionica Tichomirov, 1976 lived at least 5–6 months in experimentally established infections (Ataev Reference Ataev1991). Similarly, rediae of Himasthla elongata (Mehlis, 1831) Dietz, 1909 can survive longer than 5 months in vitro (Gorbushin and Shaposhnikova Reference Gorbushin and Shaposhnikova2002). As noted by the latter authors, most data on the longevity of trematode rediae are from parasites of short-lived hosts, but lifespans of individual rediae may likely scale with the lifespan of the host. As Cerithideopsis californica can live for up to a decade (McCloy Reference McCloy1979) and mature trematode colonies can persist for years (Kuris Reference Kuris and Esch1990; Sousa Reference Sousa1983; Sousa 1990), it is reasonable to suggest that these trematodes could have relatively long-lived rediae. Importantly, that is exactly what is indicated by our quantitative approach that was grounded on empirical data coming from mature colonies.
We emphasize that our method provides insight into average senescence rates of parthenitae in a colony. Average senescence rates are useful for understanding central biological tendencies, but they should not be taken to preclude substantial variability in senescence rates among individual parthenitae in a colony. In fact, the asymmetrical confidence limits that we provide, although applying directly to the average’s expected distribution, do suggest that some individual rediae in a colony senesce at much younger ages and some at much older ages than the average. Such variability itself is obviously worthy of direct investigation.
The selective factors influencing the average lifespan of individual rediae may be very different than the selective factors influencing the evolution of lifespan in solitary organisms. The lifespans of solitary organisms are best understood from the evolutionary theory of aging (or senescence) (Rose Reference Rose1991). However, because rediae are clonal members of a colony, which is the genetic individual on which selection directly operates, the evolutionary biology of aging would seem to directly apply to senescence of the whole colony, not its constituent parts (rediae in this case). Senescence and replacement of rediae likely involves issues more parallel to, say, senescence and replacement of leaves or flowers on plants – that is, the replacement instead of maintenance of spent parts. This is similar to some recent considerations of the senescence of workers in other colonial organisms, like eusocial insects (Kramer and Schaible Reference Kramer and Schaible2013). How such theories apply to trematodes has not been examined. However, now that we have a method for estimating redia lifespan, the time is ripe for such work to proceed.
For the purposes of this paper, our quantification of the senescence period was important in permitting us to estimate reproductive redia death rates. The senescence period estimation assumed that senescing rediae released cercariae at the same rate as did non-senescing rediae. We found this assumption to be reasonable, as we detected no significant difference in progeny numbers between rediae with a germinal mass (non-senescing) and senescing, but not degenerating, rediae. This parity in progeny count, along with most senescent rediae having no overt signs of degeneration, suggests that release rates are roughly constant for most of a redia’s life. It seems more likely that progeny release rates would be altered during late-stage senescence (degeneration). If this is so, our estimates of residence time, and thus death rates, would have been slightly incorrect because degenerating rediae were included in our estimates of per capita birth rates and residence times. However, degenerating rediae were such a small proportion of the entire pool of reproductive rediae in each colony (~2–3%) that any such effect on death rate estimates would have been negligible.
Interestingly, our approach to reveal redia death rates could be applied using only degenerating, late-senescence parthenitae. Such parthenitae often have some viable offspring remaining that could be used to set a count-down timer for their impending death and degenerating parthenitae have an advantage in being much more readily recognizable than earlier-stage senescent parthenitae. Further, focusing on degenerating parthenitae could permit applying the approach to trematode species lacking the germinal mass disappearance as a marker of senescence. However, those benefits could be countered by three things. First, identification of degenerating parthenitae may be somewhat subjective, relying on qualitative characters such as overall appearance and relative activity (see below). Second, the number of degenerating parthenitae was quite rare relative to other senescents, which would result in relatively poor sample size and possibly greater uncertainty in residence time estimates. Lastly, the assumption of parity of cercaria release rates of degenerate rediae with the average parthenita would be more tenuous. This latter issue could be addressed, for instance, by directly quantifying relative cercaria release rates in vitro and appropriately adjusting the colony-wide mean parthenita release rate. However, trematode culture currently seems to be insufficient for long-term maintenance of healthy, productive worms (Augot et al. Reference Augot, Rondelaud, Dreyfuss and Cabaret1997; Coustau and Yoshino Reference Coustau and Yoshino2000; Garcia-Vedrenne et al. Reference Garcia-Vedrenne, Quintana, DeRogatis, Dover, Lopez, Kuris and Hechinger2017; Lloyd and Poulin Reference Lloyd and Poulin2012). As we have no reason to assume that birth rates of degenerating and non-senescent worms scale with each other identically in vitro and in vivo, improvements in trematode culture techniques would bolster the sole use of degenerating worms to calculate colony death rates.
Our death-rate estimates were valid for the productive season (mid-March through mid-November). We assumed that philophthalmid rediae infecting C. californica do not die during winter, paralleling the pattern of reduced or halted within-host demographic dynamics in other trematode species (e.g., Galaktionov and Podvyaznaya Reference Galaktionov and Podvyaznaya2019). Consistent with this expectation, we had no evidence of redia mortality in our focal philophthalmid colonies during winter: whole-colony censuses conducted throughout the year showed that season has no effect on the mean colony size when adjusted for host body size, and relative proportions of immature and mature rediae remained constant among seasons (Hechinger, unpublished data; Nelson et al. 2025a, b). We also know that, during winter, philophthalmid cercariae from C. californica are either absent from the water column (Fingerut et al. Reference Fingerut, Zimmer and Zimmer2003) or encountered very rarely (Stevens Reference Stevens1996). Assuming halted dynamics thus seems reasonable in this system. If there is bias, our calculated death rates are slightly lower than reality when expressed per year but should be unbiased during the productive season.
Degenerating rediae
It is possible to recognize degenerate rediae – those in the latest stage of senescence – in live dissections at low (dissecting microscope) magnification. Degenerating rediae typically appear more turgid and hyaline than their colony mates (Figure 1a). Despite being in a state of advanced senescence, these rediae can appear quite active due to the vigorous movements of cercarial embryos inside them, which likely explains why degenerates were not noticed in previous studies of these or other species (Garcia-Vedrenne et al. Reference Garcia-Vedrenne, Quintana, DeRogatis, Martyn, Kuris and Hechinger2016; Hechinger et al. Reference Hechinger, Wood and Kuris2010). Non-degenerating senescent rediae outnumbered these degenerates by 6 to 27 times and could not be identified at low power: verifying the presence or absence of a germinal mass was only possible at 100x to 400x magnification (Figure 1c, d). In both Cloacitrema kurisi and Pa. catoptrophori, degenerating rediae contained fewer progeny than did senescing rediae that were not yet degenerating (Figure 3), bolstering the interpretation that senescing worms were in the process of voiding their remaining viable offspring prior to death.
Rediae in advanced stages of degeneration always contained at least a few young embryos that appear to have died during the redia’s senescence. Alongside these inviable embryos, we frequently found mature or nearly mature cercariae that were still active. The presence of dead young offspring indicates that philophthalmid embryos depend on maternal care up to a certain point in development – the redia is not merely a passive ‘brood sac’. Because progeny depend on the parent redia up to some point, the youngest embryos in a senescing worm likely cannot survive to maturity once the mother ceases providing maternal services. We could not, from our data, assess at what point in the process of senescence that rediae ceased maternal care.
It is currently unknown how dead rediae are cleared from the host body. Some authors have speculated that small, ‘young’ rediae play a janitorial role in the colony by consuming dead colony mates (Galaktionov et al. Reference Galaktionov, Podvyaznaya, Nikolaev and Levakin2015). However, we have seen no evidence of this behavior in the philophthalmids we studied. Expired rediae may simply be cleared by host phagocytotic cells.
Presence of a germinal mass in philophthalmids
To our knowledge, there is no prior record of a free-floating germinal mass in philophthalmid rediae, despite there having been intensive work done on their germinal development (Ataev and Dobrovolskij Reference Ataev and Dobrovolskij1990; Cort et al. Reference Cort, Ameel and Van der Woude1954; Khalil and Cable Reference Khalil and Cable1968; Rees Reference Rees1940). Several of these authors could not detect a germinal mass at all and speculated that philophthalmid cercariae arise from germinal cells embedded in the body wall of the redia (Cort et al. Reference Cort, Ameel and Van der Woude1954; Khalil and Cable Reference Khalil and Cable1968; Rees Reference Rees1940). In contrast, a germinal mass has been detected in Philophthalmus rhionica, deeply embedded in posterior parenchyma (Ataev and Dobrovolskij Reference Ataev and Dobrovolskij1990). For the 4 philophthalmids that we studied, we found a germinal mass embedded in the posterior of the body only in young, developmentally early rediae. We never observed this embedded structure in mature rediae but did find an identical structure free-floating in the brood chamber which we interpreted as the germinal mass.
Given the seeming high quality, precision, and specific focus of the above studies, it is difficult to imagine that the authors would have overlooked or misinterpreted a germinal mass matching the size and structure of that which we report here – either the attached germinal mass in early development rediae or the free-floating one of mature rediae. So, perhaps some philophthalmid species truly lack a germinal mass, or the germinal mass is cryptic within the posterior parenchyma. However, Figure 27 of Rees (Reference Rees1940) depicts what she interpreted as a redia embryo, but which may be a germinal mass with a single apparent germ ball. It is thus possible that germinal masses were overlooked in some prior work. The lack of detecting germinal masses in previous research warrants further study, especially because we document a germinal mass in species congeneric with those studied by the above authors (namely, Philophthalmus and Parorchis).
Several lines of evidence support our interpretation of the observed structure to be the germinal mass. First, the putative germinal mass matched the morphology of other trematode germinal masses, with spherical, multicellular elements embedded in a mass of supportive tissues and putative germinal cells (Figure 1) (Cort et al. Reference Cort, Ameel and Van der Woude1954; Galaktionov and Dobrovolskij Reference Galaktionov and Dobrovolskij2003; Podvyaznaya et al. Reference Podvyaznaya, Petrov and Galaktionov2020). Second, the multicellular elements, when freed from the mass, were indistinguishable morphologically or in size from extant germ galls already free-floating in the redia brood chamber (Figure 1b). Third, we could trace the development of the structure from a compact cluster of elements embedded in the parenchyma at the posterior margin of the gut in small, minor rediae to a collection of ‘ripe’ germ balls in intermediate and older rediae, and finally to its disappearance in dying rediae. Fourth, we only observed one of these structures in each individual redia. While some trematode species possess multiple germinal masses, a single germinal mass per redia likely characterizes most redial species (Galaktionov and Dobrovolskij Reference Galaktionov and Dobrovolskij2003). As a fifth line of evidence, the parthenitae of many other trematode species also possess a free-floating germinal mass. Although current records indicate that this is more common in sporocysts than in rediae (Cort et al. Reference Cort, Ameel and Van der Woude1954; Galaktionov and Dobrovolskij Reference Galaktionov and Dobrovolskij2003), germinal masses in at least some hemiuroid rediae are nearly free-floating, being attached to the body wall by a thin stalk (Ameel et al. Reference Ameel, Cort and Van der Woude1949; Podvyaznaya et al. Reference Podvyaznaya, Petrov and Galaktionov2020). The free-floating philophthalmid germinal mass is merely a minor step away from this condition. It would be ideal to bolster these observations with detailed ultrastructural studies and/or direct observation of germinal mass development in vitro. However, with the evidence already in hand, we are quite confident that we have accurately identified the germinal mass for at least these 4 philophthalmid species.
Conclusion
Reproductive rediae of the studied philophthalmids, as is known for several other trematodes, lose their reproductive capacity as they age and senesce. At the onset of senescence, the rediae lose the ability to produce additional embryos, evidenced by loss of the germinal mass. Because senescing rediae continue to release cercariae until death, we inferred the average residency of a senescing redia as the time it would take an average senescing worm to release all its viable progeny. Combining this residence period with the proportion of senescing rediae in a colony let us calculate the per-capita daily death rate and therefore the life span of individual rediae. To our knowledge, this is the first study to quantify parthenita death rates or lifespans in mature trematode first intermediate colonies. This information sheds light on the intra-colony dynamics of trematodes and may open the door to better understanding the nature of sociality in trematode colonies and exploring the evolution of parthenita senescence.
Supplementary material
The supplementary material for this article can be found at http://doi.org/10.1017/S0022149X25000331.
Acknowledgements
We thank Isabelle Kay for providing management and access to the University of California Natural Reserve System Kendall-Frost Marsh Reserve to collect our study organisms.


 Open access

