


Introduction
Experiments have surged in popularity among political scientists as a method for generating unbiased estimates of causal relationships (Druckman et al. Reference Druckman, Green, Kuklinski, Lupia, Druckman, Green, Kuklinski and Lupia2011). Perhaps nowhere have the benefits been clearer than in survey research. Survey experiments have allowed scholars of public opinion to isolate the causal effects of the news media (Iyengar and Kinder Reference Iyengar and Kinder1987), campaign advertisements (Valentino, Hutchings, and White Reference Valentino, Hutchings and White2002), political information (Zaller Reference Zaller1992), emotions (Banks Reference Banks2014), partisan identity (Huddy, Mason, and Aarøe Reference Huddy, Mason and Aarøe2015), candidate characteristics such as race (Krupnikov and Piston Reference Krupnikov and Piston2015) and gender (Bauer Reference Bauer2017), and many more factors (see Mutz Reference Mutz2011 for a review). However, survey experiments are only valuable insofar as the estimates of treatment effects are sufficiently precise. Estimates with wide confidence intervals provide little information to researchers. Moreover, noisy estimates are often unreliable; as a result, estimated effects that narrowly reject the null hypothesis are relatively unlikely to replicate (Open Science Collaboration 2015).
In the most common design in political science, referred to here as the “post-only” design, outcomes are measured at a single point, after the treatment. This design identifies a causal effect by comparing the outcomes of groups of subjects randomly assigned to different conditions. Since precision in the post-only design relies heavily on the collection of a large number of observations, this type of experiment requires more resources than alternative designs. Precision can be improved with control variables or through blocking, but these designs often remain underpowered. Indeed, scholars have suggested that the reliance on the post-only design, especially with small sample sizes, has contributed to the replication crisis in psychology (Open Science Collaborative 2015).
Repeated measures designs, an alternative to the post-only design, yield greater precision by collecting more information about each observation (for a discussion, see Bowers Reference Bowers, Druckman, Green, Kuklinski and Lupia2011). For example, one type of repeated measures design, the pre-post design, measures the dependent variable both before and after exposure to a treatment (e.g., Campbell and Stanley Reference Campbell and Stanley1963). This design allows an examination of how subjects’ attitudes change throughout a study and whether this over-time change itself varies across subjects randomly assigned to different experimental conditions. Similarly, within-subjects designs expose subjects to multiple iterations of the same experiment. While these designs increase statistical power by providing more information about subjects, they also run the risk of altering treatment effects. As Mutz (Reference Mutz2011) points out, these types of designs are “underutilized, perhaps because of the common fear that one might arouse suspicion by asking about the same dependent variable more than once in a relatively short period of time” (94). Similarly, a recent article recommends measuring covariates in a prior survey wave, cautioning researchers to “carefully separate pretreatment questions from their experiment and outcome measures to avoid inadvertently affecting the treatment effects they seek to estimate” (Montgomery, Nyhan, and Torres Reference Montgomery, Nyhan and Torres2018, 773). Conventional wisdom, then, holds that measuring outcomes pretreatment may alter the inferences drawn from an experiment.
While there are many concerns about the use of these more powerful designs in survey experiments, there is little empirical evidence to support these worries. Still, political scientists heavily rely on post-only designs, as we show below, perhaps out of fears that alternative designs will alter treatment effects. If these fears are overblown, researchers have been forgoing more efficient and reliable designs. To help experimental researchers sort through the strengths and weaknesses of different approaches, we test alternative experimental designs against each other, randomly assigning respondents to different experimental designs that target the same estimand (e.g., Jerit, Barabas, and Clifford Reference Jerit, Barabas and Clifford2013).
We begin by reviewing alternative experimental designs, how these designs increase precision, and how they might influence treatment effects. Then, we conduct a content analysis of the experimental literature, which shows that political scientists overwhelmingly rely on the post-only design. Next, we conduct six studies on varied topics and samples that compare these designs against each other. Overall, including through an internal meta-analysis, we find little evidence that repeated measures designs yield different results from more conventional designs. We also provide some evidence that this may be, in part, because few respondents are aware of how their attitudes change throughout a survey.
In addition to producing substantively similar results, we also show that repeated measures designs consistently provide much more precise estimates of treatment effects. Finally, we also illustrate an added benefit of repeated measures designs—the ability to examine how attitudes change throughout a study, providing new insights into estimates of both treatment effect magnitude and heterogeneity. In short, our findings suggest that in many cases researchers can adopt more powerful experimental designs that require fewer resources and generate more precise and informative estimates of treatment effects.
Experimental Designs in Political Science
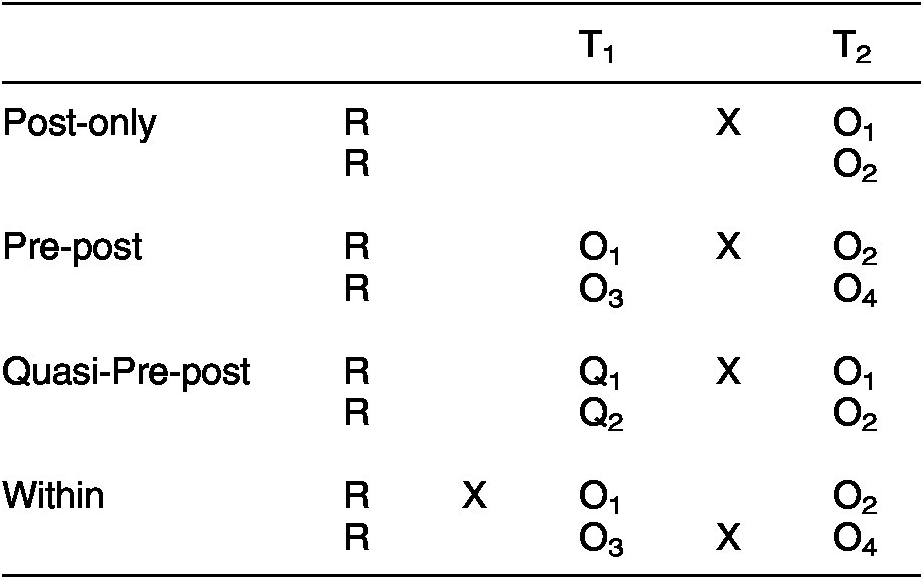
Survey experiments take a variety of forms. To clarify the differences between designs, we display them in Table 1, following the notation introduced by Campbell and Stanley (Reference Campbell and Stanley1963). The first three entries—post-only, pre-post, and quasi-pre-post—are variations of the between-subjects design. The last entry represents the within-subjects design.
Comparisons of Experimental Designs
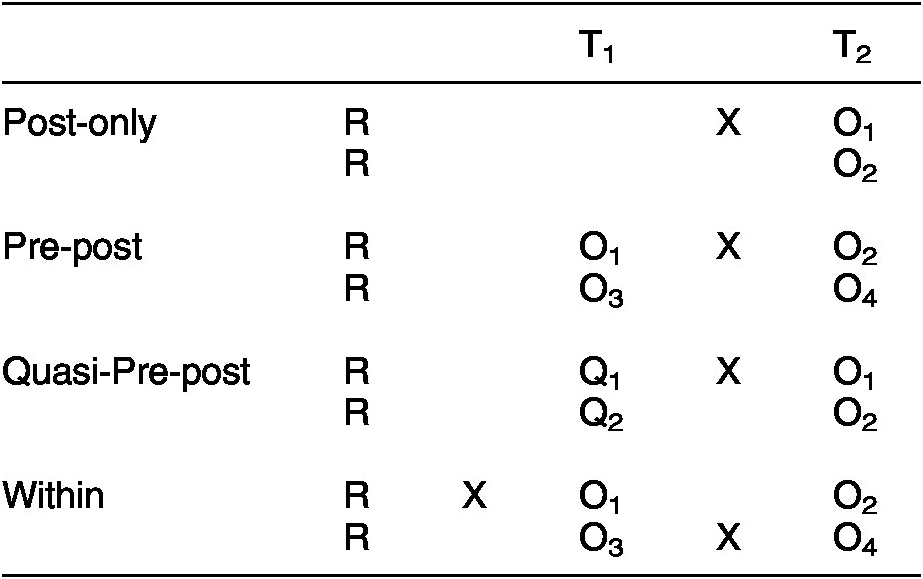
Note: R = Randomization assignment to a group. O = observation of the dependent variable. Q = observation of a variable closely related to the dependent variable. X = exposure to a treatment. T = time of implementation.
The post-only design is the simplest and most common in political science. In the most basic version, researchers assign subjects to different groups (e.g., a treatment and a control group) and, after exposure to the experimental stimulus, measure the outcome variable. This design is illustrated at the top of Table 1, where each of the two rows by the “Post-only” headline indicates an experimental condition and R indicates that respondents have been randomly assigned to that condition. Moving horizontally across these rows corresponds with time, with T representing key points. The letter O represents measurement of the outcome, X represents the implementation of the treatment, and subscripts are used to differentiate measurements taken at different times among different groups. The average treatment effect is estimated by comparing the average value of the outcome variable for the control group with that of the treatment group. For example, a researcher might ask respondents about their support for a policy, but first expose a random half of the respondents to learn about a group’s endorsement of the policy (e.g., Nicholson Reference Nicholson2011). In practice, researchers often use more complicated versions of these designs, which might contain more than one treatment (e.g., Druckman, Peterson, and Slothuus Reference Druckman, Peterson and Slothuus2013), omit a control (e.g., Nelson, Clawson, and Oxley Reference Nelson, Clawson and Oxley1997), or employ factorial designs that combine multiple treatments at the same time (e.g., Chong and Druckman Reference Chong and Druckman2007). What the post-only designs have in common is that they draw inferences by comparing levels of the dependent variable measured posttreatment.
The major shortcoming of post-only designs is relatively low precision. This shortcoming can be magnified with more complex designs that involve multiple treatment conditions, moderators, or treatment effects of small magnitudes. Additionally, treatment effects can be more difficult to estimate precisely in demographically diverse samples (Mutz Reference Mutz2011) or when using abbreviated measures of the dependent variable that introduce measurement error (Ansolabehere, Rodden, and Snyder Reference Ansolabehere, Rodden and Snyder2008). Thus, post-only designs necessitate recruiting a large number of subjects to achieve adequate precision.
Researchers can increase statistical power in the post-only design by adding information about individuals in the study. For example, researchers can include controls for covariates (Bloom Reference Bloom, Alasuutari, Bickman and Brannen2008; Bowers Reference Bowers, Druckman, Green, Kuklinski and Lupia2011). The gains from covariates are limited, however, by the strength of the relationship between the covariates and the dependent variable. If the covariates are weakly related or entirely unrelated to the outcome of interest, then adding them may lead to little to no gain in reducing error (Gerber and Green Reference Gerber and Green2012), and may even undermine precision (Mutz Reference Mutz2011). Additionally, covariates that are not independent of treatment assignment can bias estimates of treatment effects, leading some to argue that the best practice is to include only covariates that were measured pretreatment (Montgomery, Nyhan, and Torres Reference Montgomery, Nyhan and Torres2018; though see Klar, Leeper, and Robison Reference Klar, Leeper and Robison2019).
Researchers can make larger gains in precision through repeated measures designs that involve measuring the outcome variable at more than one point during a study. One such design is the “pre-post” design, a between-subjects experiment that is identical to the post-only design save for one key difference: the dependent variable is also measured prior to the experimental manipulation at point T1. The design is displayed in the “Pre-post” heading in Table 1. The pre-post design increases precision through repeated measurement of the dependent variable. The experiment can then be analyzed either by using a difference in change scores (O2 – O1 compared with O4 – O3) or by controlling for the T1 measure of O when comparing O2 with O4.Footnote 1 Critically, the pre-post design remains a between-subjects design because some respondents are never exposed to the treatment; respondents’ difference scores (e.g., O2 – O1) are therefore compared between groups.
Pre-post designs promise gains in statistical power, but some scholars worry that measuring the outcome prior to the experiment could alter estimated treatment effects, as discussed in detail below. This has led some researchers to propose a middle ground between standard covariate control methods and the pre-post design, which is sometimes referred to as the quasi-pretest-posttest design (from here on, the “quasi” design; Mutz Reference Mutz2011). This design, displayed in the third entry of Table 1, follows the same structure of the pre-post design with one difference: rather than directly measuring the dependent variable at T1 (before the treatment), the researcher instead measures a closely related variable or set of variables (Q). The goal here is to avoid the potential problems of repeated measurement of the dependent variable (e.g., changes in responses due to consistency pressures), while attempting to retain the gains in statistical power. Thus, researchers select a variable in advance that is strongly related to O and can therefore serve as a proxy variable. For example, in an experiment on attitudes toward stem cell research, the researcher could measure attitudes toward cloning, which should strongly predict attitudes toward stem cell research. Similar to the pre-post design, the quasi design increases statistical power by collecting more information about each respondent, though the gains depend on how strongly Q relates to the outcome, O. Here too it is possible that the quasi design influences treatment effects, such as by priming considerations relevant to the dependent variable or creating some form of consistency pressure.
The quasi design is like the post-only design in that it uses variables as controls in a statistical model. However, the quasi design has advantages over the typical use of post-only designs with covariates. First, by intentionally selecting and measuring a variable that is closely related to the dependent variable, the quasi design should increase precision more than whatever set of pretreatment covariates happens to be available. Second, identifying good quasi measures requires planning on the part of researchers and can help encourage principled and transparent modeling choices.
The final alternative design is the within-subjects experiment. While also a repeated measures design, the within-subjects design differs from the post-only and pre-post designs in that each subject is exposed to all experimental conditions and the dependent variable is measured after each condition (Aronson et al. Reference Aronson, Ellsworth, Merrill Carlsmith and Gonzales1976). The design is displayed at the bottom of Table 1. In this illustration, the dependent variable is measured twice for both groups and both groups receive the treatment and the control condition. The only difference is the order in which the conditions are administered, which allows researchers to rule out confounds between time and treatment.Footnote 2 For example, in a study of the effects of incivility on political trust, Mutz and Reeves (Reference Mutz and Reeves2005) exposed respondents to both a civil and an uncivil version of a debate and measured respondents’ physiological reactions to each. The within-subjects design maximizes statistical power by comparing respondents with themselves under different conditions. Thus, all individual differences are held constant in the analysis.
Within-subjects designs have two main limitations. First, they have the potential to alter the effect of treatments. Second, within-subjects designs may not always be applicable to a particular research question. A within-subjects design demands that the manipulation can be “undone.” Take, for example, common information experiments in political science. In the standard between-subjects design, respondents are randomly assigned to either receive a fact or not, then all are asked the dependent variable. A within-subjects design would require that treated subjects be made unaware of a relevant fact, prior to a second measurement of the dependent variable. For obvious reasons, this is not possible for information experiments or for a number of other manipulations.
A final form of repeated measures design, which is not displayed in Table 1, is the conjoint design. Because this design has been studied extensively in recent years (e.g., Bansak et al. Reference Bansak, Hainmueller, Hopkins and Yamamoto2018; Reference Bansak, Hainmueller, Hopkins, Yamamoto, Druckman and Green2021; Hainmueller, Hangartner, and Yamamoto Reference Hainmueller, Hangartner and Yamamoto2015; Hainmueller, Hopkins, and Yamamoto Reference Hainmueller, Hopkins and Yamamoto2013; Jenke et al. Reference Jenke, Bansak, Hainmueller and Hangartner2020), we do not include it in our studies below, but it is worth discussing here. The typical conjoint design asks respondents to choose between two profiles, each with a set of randomized attributes, and then repeats this choice task for many pairs of profiles. For example, a respondent might review information about two politicians, complete with randomized information on the candidates’ demographics and issue stances (e.g., Goggin, Henderson, and Theodoridis Reference Goggin, Henderson and Theodoridis2020). While conjoint experiments are a form of repeated measures designs, they differ from the within-subjects design in that respondents are not typically exposed to all treatment conditions. Conjoints are also distinct from pre-post designs in that there is no pretest attitude with which posttreatment attitudes are compared.
Conjoint experiments have several strengths that have been well-documented in recent research, including high external validity (Hainmueller, Hangartner, and Yamamoto Reference Hainmueller, Hangartner and Yamamoto2015), reduced social desirability bias (Horiuchi, Markovich, and Yamamoto Reference Horiuchi, Markovich and Yamamoto2019), and the ability to estimate a large number of treatment effects (for a review, see Bansak et al. Reference Bansak, Hainmueller, Hopkins, Yamamoto, Druckman and Green2021). However, like the within-subjects design, conjoint designs are somewhat limited in their application. Conjoint designs assume no carryover between choice tasks. That is, it must be possible for the treatment to be “undone.” This seems to be a barrier to studying many topics, such as partisan cues, information effects, framing effects, and question-wording effects—all topics that we examine below. Thus, while conjoint designs have clear strengths for studying topics like candidate evaluation, we focus here on other forms of repeated measures designs.
Overall, the pre-post and within-subjects designs offer an improvement over standard post-only designs by increasing statistical precision through the collection of additional information about subjects (Bowers Reference Bowers, Druckman, Green, Kuklinski and Lupia2011). Pre-post designs, in particular, offer a wide variety of applications. However, these designs have the potential to alter treatment effects due to the measurement of key outcomes or other covariates pretreatment.
How Alternative Designs Might Influence Treatment Effects
Based on the discussion above, repeated measures designs should be attractive methods for increasing statistical precision. However, the post-only design remains the most popular choice due to a variety of concerns about how repeated measures designs might influence estimated treatment effects. In this section, we discuss some of the common concerns and available evidence.
The overarching concern with repeated measures designs is that the initial measures or stimuli will influence how subjects react to later experimental stimuli, potentially producing a different treatment effect than if a post-only design had been used. Public opinion researchers have long been aware that surveys set the context in which attitudes are reported, thus shaping responses (Zaller and Feldman Reference Zaller and Feldman1992). Similarly, the survey context may also influence how people respond to new information or stimuli. If different designs yield different results, then researchers need to consider which survey context better generalizes to the target context. However, if different designs yield largely the same results, researchers can be more confident in the external validity of these findings and choose designs based on other features, like precision.
There are two general ways in which repeated measures designs might influence treatment effects. First, in both pre-post designs and within-subjects designs, the repeated measurement of the dependent variable may alter treatment effects for a number of reasons discussed below. Second, in the within-subjects design, there is the possibility that previous treatment conditions carry over and influence subsequent treatments. For example, in the canonical welfare question-wording experiment, this implies that being asked about support for “aid to the poor” at T1 has no effect on how a subject later responds to a question about support for “welfare.” Below, we discuss in more detail several reasons why repeated measures designs might produce different treatment effect estimates than post-only designs.
Demand Effects
One commonly cited threat to the inferences drawn from survey experiments is demand effects, a concern that was raised over 50 years ago (Orne Reference Orne1962). As originally laid out by Orne, subjects attempt to make sense of the study they are participating in and the expectations for their behavior. An agreeable subject might then try to behave in line with the researcher’s expectations, shifting treatment effects in the direction of the researcher’s hypotheses. In other words, the design of the study creates a demand for hypothesis-supporting behavior. Thus, researchers should “mask” the intent of the experiment (McDermott Reference McDermott, Green, Druckman, Lupia and Kuklinski2011).
Both pre-post and within-subjects designs may increase the possibility of demand effects. Outside of an experimental design, there is little reason to ask a respondent the same question twice within a single interview. As a result, repeated measures of the dependent variable may stand out to respondents, drawing their attention to the design and goals of the experiment. The researcher’s hypotheses are likely to be even more transparent when respondents are shown multiple versions of the same stimuli, as in a within-subjects design. For example, if a respondent were asked to evaluate two hypothetical scenarios involving war with a foreign country and only one detail differed between the two scenarios, the respondent might infer the researcher’s hypothesis.Footnote 3 Thus, concerns over demand effects are often cited when considering repeated measures designs (e.g., Charness, Gneezy, and Kuhn Reference Charness, Gneezy and Kuhn2012; Zizzo Reference Zizzo2010).
However, the most comprehensive study on this topic provides little evidence for demand effects (Mummolo and Peterson Reference Mummolo and Peterson2019). These authors replicated a series of experiments while manipulating the amount of information provided to respondents about the researcher’s hypotheses. They find that “revealing the purpose of experiments to survey respondents leads to highly similar treatment effects relative to those generated when the purpose of the experiment was not provided” (528). Overall, while demand effects seem to be a reasonable concern, evidence for their influence in political science experiments is minimal.
Consistency Pressures
Another concern with repeated measures designs is that subjects may be motivated to provide responses that are consistent over time. Psychological theories hold that people want to maintain consistent beliefs and attitudes and for others (e.g., the researcher) to perceive them as such (Cialdini, Trost, and Newsom Reference Cialdini, Trost and Newsom1995). As a result, an influential review on attitude measurement warns that “answers may undergo an editing process in which the answer is checked for consistency with prior answers” (Tourangeau and Rasinski Reference Tourangeau and Rasinski1988, 300). Consistency effects may be limited by subjects’ memory for prior questions, however. Overall, concerns about consistency pressure are widespread, but it is less clear how often they occur and how long they last.
Interaction between Testing and the Treatment
A general concern with measuring covariates or outcomes pretreatment centers on the potential for these measures to interact with the treatment. For example, repeatedly measuring an attitude may increase its extremity (Downing, Judd, and Brauer Reference Downing, Judd and Brauer1992) and subjective importance (Roese and Olson Reference Roese and Olson1994). Thus, in a pre-post design, the measurement of the dependent variable at T1 may strengthen the focal attitude, making it more resistant to change in response to a treatment (see also Druckman and Leeper Reference Druckman and Leeper2012). However, the effects of repeated measurement on attitude strength tend to emerge when an attitude is measured many times rather than just twice. Another related concern is that the pretest measurement may increase the accessibility of certain considerations, which may affect how a subject responds to the treatment.
These concerns are often discussed in canonical texts on experimental design. For example, Aronson et al. (Reference Aronson, Ellsworth, Merrill Carlsmith and Gonzales1976, 141) note that, “research on pretest sensitization indicates that its usual effect is to reduce the power of the independent variable to create change, so that investigators may erroneously conclude that their variable has no effect.” Campbell and Stanley (Reference Campbell and Stanley1963) discuss these concerns as well, emphasizing that researchers should avoid pretests when studying questions related to attitude change, as the pretest may affect respondents’ susceptibility to treatment. However, contrary to concerns that repeated measurement might alter treatment effects, estimated effects in conjoint designs seem to be unaffected by the order in which the profiles are displayed (Hainmueller, Hopkins, and Yamamoto Reference Hainmueller, Hopkins and Yamamoto2013).
That scholars avoid using repeated measures designs makes sense given these concerns. Scholars often prioritize the validity of treatment effects above all other concerns when selecting an experimental design. However, the most recent evidence on demand effects fails to find any evidence of their presence across a variety of experimental contexts (Mummolo and Peterson Reference Mummolo and Peterson2019). Furthermore, while there is certainly potential for consistency effects and interaction effects, there is also scant evidence for these effects in the types of studies commonly conducted by political scientists. In short, it is not yet clear whether repeated measures designs alter treatment effects—an important issue to address given the benefits these designs offer for precision.
Experimental Design Practices in Political Science
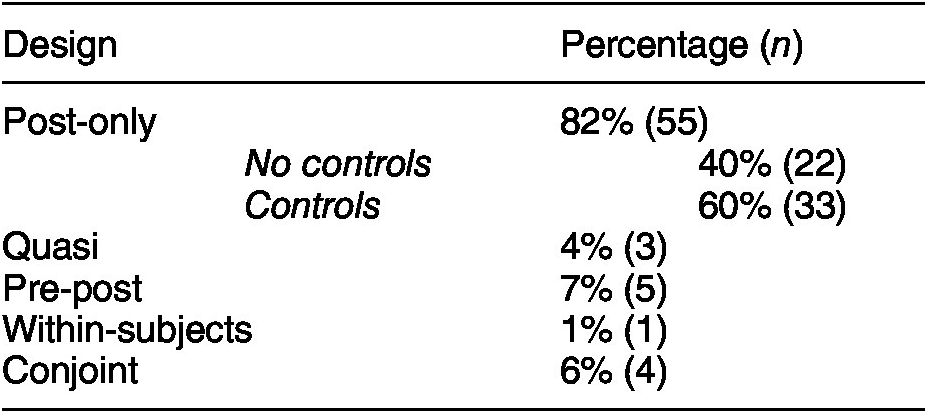
Having identified the possible costs and benefits of each type of design, we now turn to how common these designs are in political science. To do so, a research assistant identified all articles using experimental methods published between 2015 and April of 2020 in five major journals: American Political Science Review, American Journal of Political Science, Journal of Politics, Political Behavior, and Political Psychology. This yielded a population of 457 articles. We then selected a random sample of 55 articles to code in detail and retained only those using survey experiments, leaving 41 articles with 67 studies. The authors coded each study for the type of design used (post-only, quasi, pre-post, or within-subjects) and the use of covariates (see Appendix for coding details). Results are shown in Table 2.
Frequency of Experimental Designs
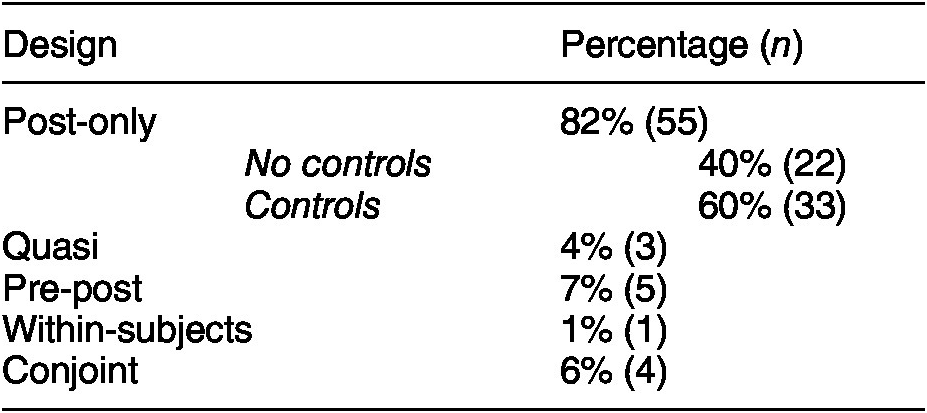
Note: Does not add up to 100% because one study was classified as both pre-post and within-subjects. Number of studies in parentheses. Total N = 67.
Of the studies in our sample, 82% were post-only designs, demonstrating the dominance of this design in political science. Of these studies, 60% used control variables in at least some analyses. This suggests that many political scientists using post-only designs do take some steps to leverage additional information about observations. Only five studies (7%) used pre-post designs. Of these five, three included the pretest measure in a prior survey wave, presumably to avoid influencing the experiment. One of the two studies using a pre-post design within a single wave included a heavy caveat, stating that “Due to the limited amount of time between pretest and posttest measurements, it is possible that some subjects anchored their posttest response on their pretest response resulting in no change” in the dependent variable (Andrews et al. Reference Andrews, Clawson, Gramig and Raymond2017, 266). In short, pre-post designs are rare and typically used in panel surveys, and researchers are clearly concerned about potentially influencing treatment effects.
Furthermore, only three studies (4%) used quasi designs, even though this method promises to increase precision while reducing the potential risks posed by repeated measures designs (Mutz Reference Mutz2011). While researchers seem concerned about the use of pre-post designs, few seem to be taking up a close alternative.
Finally, only one study (1%) used a true within-subjects design, suggesting these designs are rarely used in political science. However, four studies (6%) used a closely related conjoint design with a repeated choice task. Thus, conjoint designs are more popular than within-subjects designs, but still make up a small fraction of experiments being conducted in political science. Overall, the content analysis affirms our claim that the post-only design is dominant in the discipline and that conventional wisdom holds that alternative designs will alter treatment effects.
Testing the Effects of Repeated Measures Designs
To test how repeated measures designs influence the size and precision of estimated treatment effects, we conducted six experiments that involve randomly assigning respondents to alternative designs. Each experiment roughly replicates a past study on topics that cover a range of common experimental paradigms, including question-wording effects, information effects, partisan cues, and framing. In each study, respondents are randomly assigned to one of up to three experimental designs. Every study includes a post-only design as the baseline for comparison because it is the most common survey experimental design in extant scholarship.
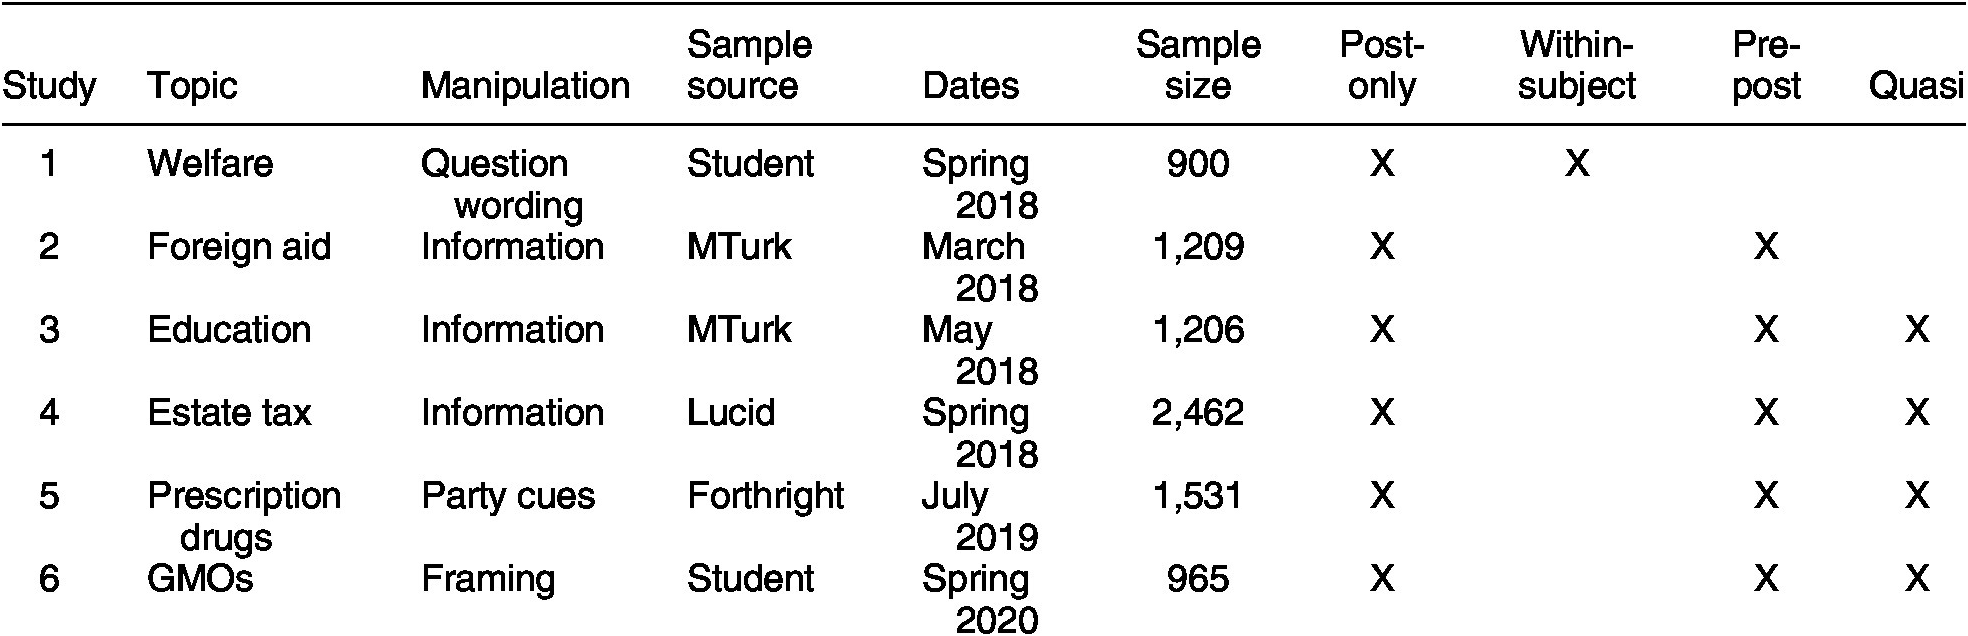
Beyond the post-only design, respondents were randomly assigned to one of three alternatives: a pre-post, quasi, or within-subjects design. In all studies, the experiments were placed near the end of a larger survey and all pretest and quasi-pretest measures were placed near the beginning of the survey. We sought to maximize the distance between repeated measurements to the extent possible in a standard survey. The six studies are summarized in Table 3. We review each below, and additional details are available in the Appendix. Replication materials, including each dataset and the code necessary to reproduce each analysis, are included in the Dataverse repository for this article (Clifford, Sheagley, Piston Reference Clifford, Sheagley and Piston2021).
Overview of Experimental Studies
Study 1—Welfare Question-Wording Experiment
Our first study replicated the canonical welfare question-wording experiment (Smith Reference Smith1987). Respondents were randomly assigned to a question asking about spending levels either on “welfare” or “assistance to the poor” on a three-point scale (“too much,” “about the right amount,” “too little”). Further, respondents were randomized into either a post-only design or a within-subjects design. In the post-only design, respondents were randomly assigned to either the welfare or the poor condition near the end of the survey. In the within-subjects design, respondents were randomly assigned to the welfare or the poor condition early in the survey, then they received the other question near the end of the survey.
Study 2—Foreign Aid Information Experiment
Our second study replicates a landmark information experiment about foreign aid (Gilens Reference Gilens2001). In the treatment, respondents were informed that spending on foreign aid makes up less than 1% of the federal budget. All respondents were then asked whether spending on foreign aid should be increased or decreased (on a five-point scale). Respondents were randomly assigned to the post-only or pretest design.
Study 3—Education Spending Information Experiment
Here we conducted another information experiment; a random half of respondents were informed of the average annual per pupil spending on public schools. All respondents were then asked whether taxes to support public schools should be increased or decreased on five-point scale (for a similar experiment, see Schueler and West Reference Schueler and West2016). In this study, respondents were randomized into either the post-only, pretest, or quasi design. For the quasi measure, respondents were asked whether they supported increasing or decreasing teacher salaries.
Study 4—Estate Tax Information Experiment
The manipulation in our fourth study involved informing a random half of respondents that the federal estate tax applies only to those with an estate over $11.18 million: the wealthiest 0.0006% of Americans (cf., Piston Reference Piston2018). All respondents were then asked whether they favor or oppose the estate tax on a seven-point scale. Respondents were randomized into a post-only, pre-post, or quasi design. The quasi design included two pretest measures: whether to reduce the budget deficit through spending cuts or tax increases and whether the country would be better off if we worried less about how equal people are.
Study 5—Prescription Drugs Party Cue Experiment
Our fifth study focused on party cues. In this study, we expected a greater likelihood that the design may affect the results, relative to information experiments. This is because respondents likely see changing one’s mind in response to new information as more normatively desirable than changing one’s mind in response to a party cue. Indeed, many people want to avoid being seen as partisan (Klar and Krupnikov Reference Klar and Krupnikov2016) and report that partisanship has a relatively small influence on their opinions (Cohen Reference Cohen2003). Thus, if following a party cue is normatively undesirable, respondents should experience consistency pressures and be less likely to follow the cue, leading to muted treatment effects. In contrast, in the post-only design, respondents have not reported a prior attitude that would create any consistency pressure.
The party cue experiment focused on support for allowing the importation of prescription drugs from Canada, measured on a seven-point scale (Clifford, Leeper, and Rainey Reference Clifford, Leeper and Rainey2019). The treatment informed respondents that “Democrats tend to favor and Republicans tend to oppose” the policy, while this information was omitted from the control condition. Respondents were randomized into one of three designs: post-only, pre-post, or quasi. For the quasi measure, respondents were asked whether they support or oppose making it easier for people to import prescription drugs from other countries.
This experiment was embedded in the second wave of a panel study, allowing additional tests. First, we measured the dependent variable in the first wave of the survey for respondents in all experimental conditions. The first wave was administered approximately one month prior to the second wave, making it unlikely this measurement had any effect on the experiment. Thus, respondents in the pre-post condition answered the same question about prescription drugs three times: once in wave 1, once at the start of wave 2, and again at the end of wave 2. This allows us to control for wave-1 attitudes in all conditions to increase statistical power while presumably avoiding influencing treatment effects. Additionally, the panel design enables us to test whether the presumed gains in precision due to using the pre-post design differ based on when the dependent variable is measured (i.e., in Wave 1 or Wave 2).
Study 6—GMOs Framing Experiment
Our sixth study focused on framing effects on the topic of GMOs (e.g., Druckman and Bolsen Reference Druckman and Bolsen2011). Respondents were randomized to receive either a pro-GMO frame focusing on how foods can be modified to be more nutritious or an anti-GMO frame focusing on harmful health effects. The dependent variable measured support for the production and consumption of GMOs on a seven-point scale. Respondents were randomized into the post-only, pre-post, or quasi design. The quasi variables consisted of two questions about their support for banning chemical pesticides and banning the use of antibiotics on livestock, both of which tend to be related to attitudes toward GMOs (Clifford and Wendell Reference Clifford and Wendell2016). Additionally, to test for the possibility of consistency effects, we included an item at the end of the study asking respondents in the pre-post condition to report how they believed their attitude had changed throughout the study.
How Design Influences Estimates of the Magnitude of Treatment Effects
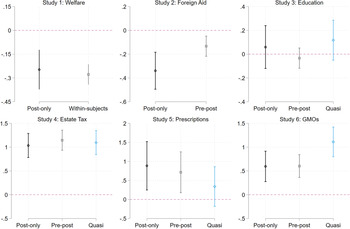
In this section, we analyze each experiment with a focus on the magnitude of treatment effects, taking on the topic of precision in the next section. Within each study we analyze each design separately, using covariates to increase statistical power. To maintain similarity, we analyze pre-post designs by controlling for T1 measures rather than modeling difference scores (for discussion, see Blair et al. Reference Blair, Cooper, Coppock and Humphreys2019; Gerber and Green Reference Gerber and Green2012). Specifically, we control for partisanship and ideology in all designs, as well as pretest and quasi measures, as available. All effects are plotted in Figure 1. We compare the magnitude of the effects across models using a Wald test.
Treatment Effects by Experimental Design
Note: The figures display estimated average treatment effect within each design in each study. In Study 5, the displayed effect is the interaction term between the treatment and respondent partisan identity. The effects in each panel are unstandardized and plotted on the scale of the dependent variable. The bars around the estimates are 95% confidence intervals.

Study 1—Welfare Question-Wording Experiment
This study replicates a design in which respondents receive a question that asks whether they support increased spending on “welfare” or “assistance to the poor.” In the post-only design, respondents receiving the “welfare” wording were significantly less supportive of spending (b = −0.25, p < 0.001) than respondents receiving the “poor” wording. In the within-subjects design, respondents again expressed less support for increased spending in the “welfare” condition than in the “poor” condition (b = −0.28, p < 0.001). Thus, the two designs yielded effects of similar magnitude that are statistically indistinguishable (p = 0.718).Footnote 4
Study 2—Foreign Aid Information Experiment
In this study, respondents were randomly assigned either to receive information that spending on foreign aid makes up less than one-half of one percentage of the U.S. budget or to not receive this information. In the post-only design, respondents receiving the treatment were significantly less supportive of cutting foreign aid (b = −0.34, p < 0.001) than respondents not receiving the treatment. In the pre-post design, the treatment again significantly reduces support for cutting foreign aid (b = −0.13, p = 0.002). However, the treatment effect is significantly smaller in the pre-post design than in the standard post-only only design (p = 0.021).
Study 3—Education Spending Information Experiment
Here half of the respondents were assigned to receive information about per-pupil spending on education. The standard post-only design yielded a substantively small treatment effect that is not distinguishable from zero (b = 0.06, p = 0.517). Because we are typically concerned that the pre-post and quasi designs might reduce the magnitude of treatment effects, this study is less informative. Nonetheless, treatment effects were similarly null in both the pre-post (b = −0.03, p = 0.439) and quasi designs (b = 0.12, p = 0.170), and neither of these effects differed from the effect in the post-only design (p = 0.354, p = 0.642, respectively). In any case, as we discuss below, this study is still informative for how designs affect the precision of estimates.
Study 4—Estate Tax Information Experiment
In this experiment, half of the respondents were randomly assigned to be exposed to information about the small number of very wealthy people affected by the federal estate tax. In the post-only design, the treatment increased support for the estate tax (b = 1.03, p < 0.001). The treatment had a similar effect in both the pre-post design (b = 1.15, p < 0.001) and the quasi design (b = 1.10, p < 0.001). In contrast to Study 2, the effect in the post-only design did not differ from the effect in the pre-post design (p = 0.500) or the quasi design (p = 0.737).
Study 5—Prescription Drugs Party Cue Experiment
Half of respondents were informed that “Democrats tend to favor and Republicans tend to oppose” the policy, while the other half did not receive this information. Because the effects of party cues should be moderated by partisan identity, we take a different modeling approach for Study 5. We regress policy support on a treatment indicator, a dichotomous indicator of partisan identity (with pure independents excluded from the analysis), and an interaction between the two. To simplify discussion, we focus on the interaction term, which indicates how much the treatment increased partisan differences in policy support (see Appendix for further details).Footnote 5 As expected, the treatment significantly increased partisan disagreement in the post-only design (b = 0.88, p = 0.007) and the pre-post design (b = 0.71, p = 0.009). In the quasi design, the effect on partisan disagreement was also in the expected direction, but it was not statistically significant (b = 0.34, p = 0.203). Finally, the effect in the post-only condition was not distinguishable from the effect in the other conditions (pre-post: p = 0.682; quasi: p = 0.182).
Study 6—Framing GMOs Experiment
In this study, respondents were randomly assigned to read either a pro-GMO frame focusing on how foods can be modified to be more nutritious or an anti-GMO frame focusing on potential harmful health effects. In the post-only design, the pro-GMO frame increased support for GMOs, relative to the anti-GMO frame (b = 0.60, p < 0.001). The effect was quite similar in the pre-post design (b = 0.60, p < 0.001) but somewhat larger in the quasi design (b = 1.11, p < 0.001). While the effects in the post-only and pre-post designs did not significantly differ from each other (p = 0.975), the effect was significantly larger in the quasi design (post-only: p = 0.023, pre-post: p = 0.010).
Internal Meta-Analysis
Across six studies, we found little evidence that repeated measures designs distort treatment effects. But it is possible that there is a relatively small and systematic effect that could not be detected in any single study. We address this issue with an internal meta-analysis, which provides a precision-weighted estimate of the average effect of experimental design across all six studies (see Goh, Hall, and Rosenthal Reference Goh, Hall and Rosenthal2016). First, we rescaled the dependent variable in each study to range from zero to one and recoded the direction of the variable so that all treatment effects carry the same sign. Then, within each study, we estimated the difference in treatment effects between the post-only design and the repeated measures design. These six differences in treatment effects represent the observations in our internal meta-analysis.Footnote 6
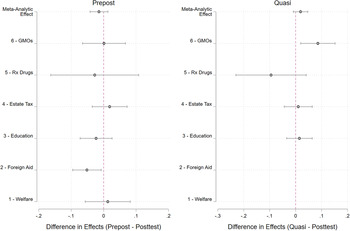
Figure 2 summarizes the differences in treatment effects. The left panel plots the difference between the treatment effect in the post-only design and the treatment effect in the pre-post design. The right-hand panel displays the equivalent comparison between the quasi design and the post-only design. In both panels, negative values indicate that the repeated measures design led to smaller treatment effects than the post-only design, which would be consistent with common concerns. The top row of both panels displays the meta-analytic effect.Footnote 7 For the pre-post design, the meta-analytic difference in treatment effects is −0.014, which does not significantly differ from zero (p = 0.355).Footnote 8 For reference, by comparing this difference in treatment effects with the magnitude of the treatment effect within the post-only design, we can get a rough estimate of how much the pre-post design might reduce treatment effects. A separate meta-analysis of the post-only design yields a meta-analytic treatment effect of 0.104. Thus, the difference in treatment effects suggests that the pre-post design may reduce the effect size to 87% of the effect in the post-only design, though this small effect cannot be distinguished from zero.Footnote 9
Meta-Analysis of Design Effects
Note: The left panel displays the difference between the estimated effect in the pre-post design and the corresponding post-only study. The right panel displays the difference between the quasi and post-only study. All dependent variables were rescaled to range 0–1 and coded so that all treatment effects are positive. The meta-analytic effect (top row) represents the precision-weighted average of all studies. The bars around the point estimates correspond to 95% confidence intervals.
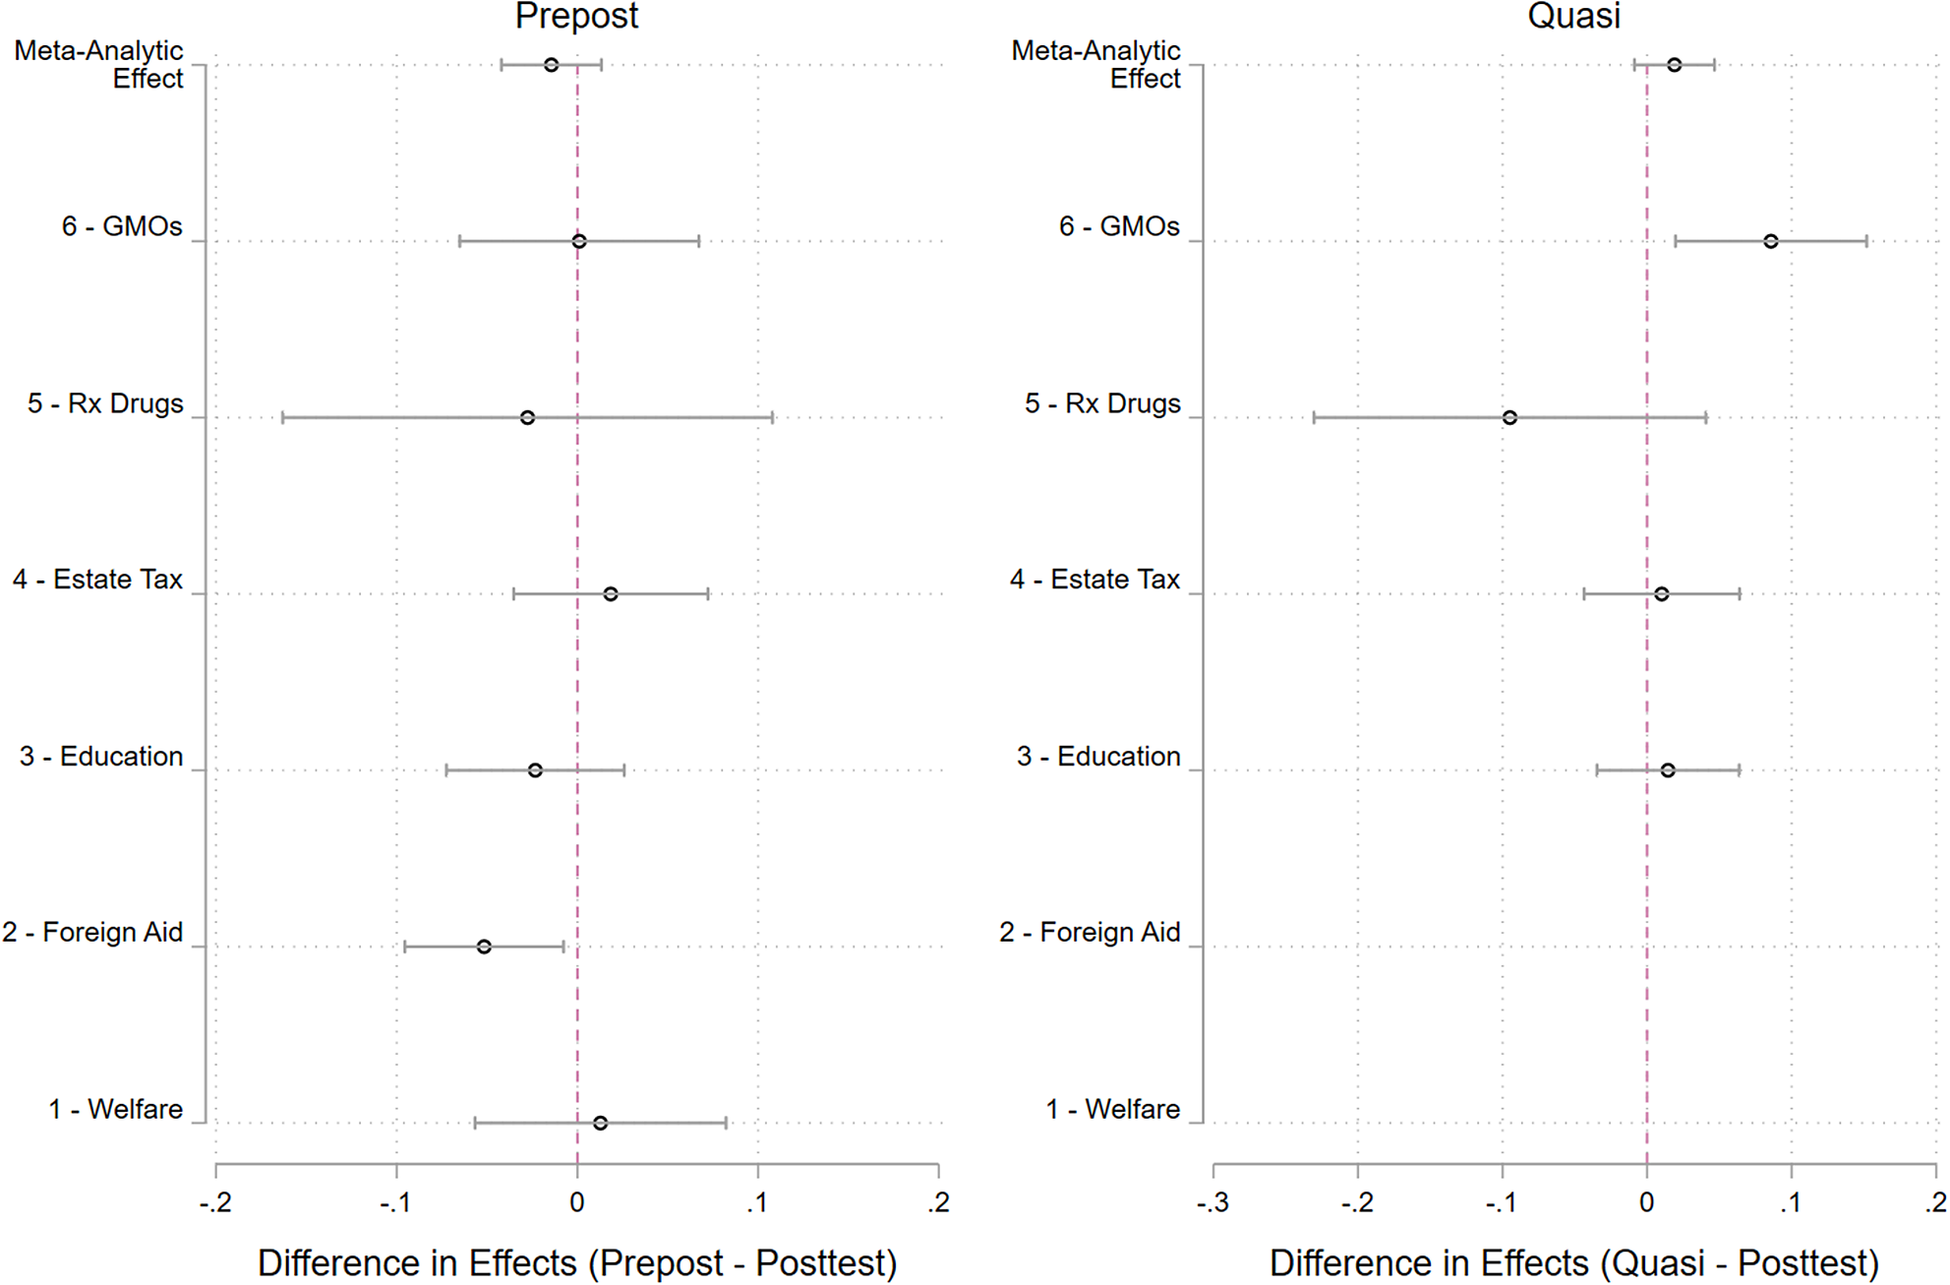
Turning to the quasi design, the difference in treatment effects is positive (0.019), implying that the quasi design leads to larger effects than the post-only design. But it cannot be distinguished from zero either (p = 0.569). Overall, these results suggest that repeated measures designs tend to yield the same substantive results.
Are Respondents Aware of their Attitude Change?
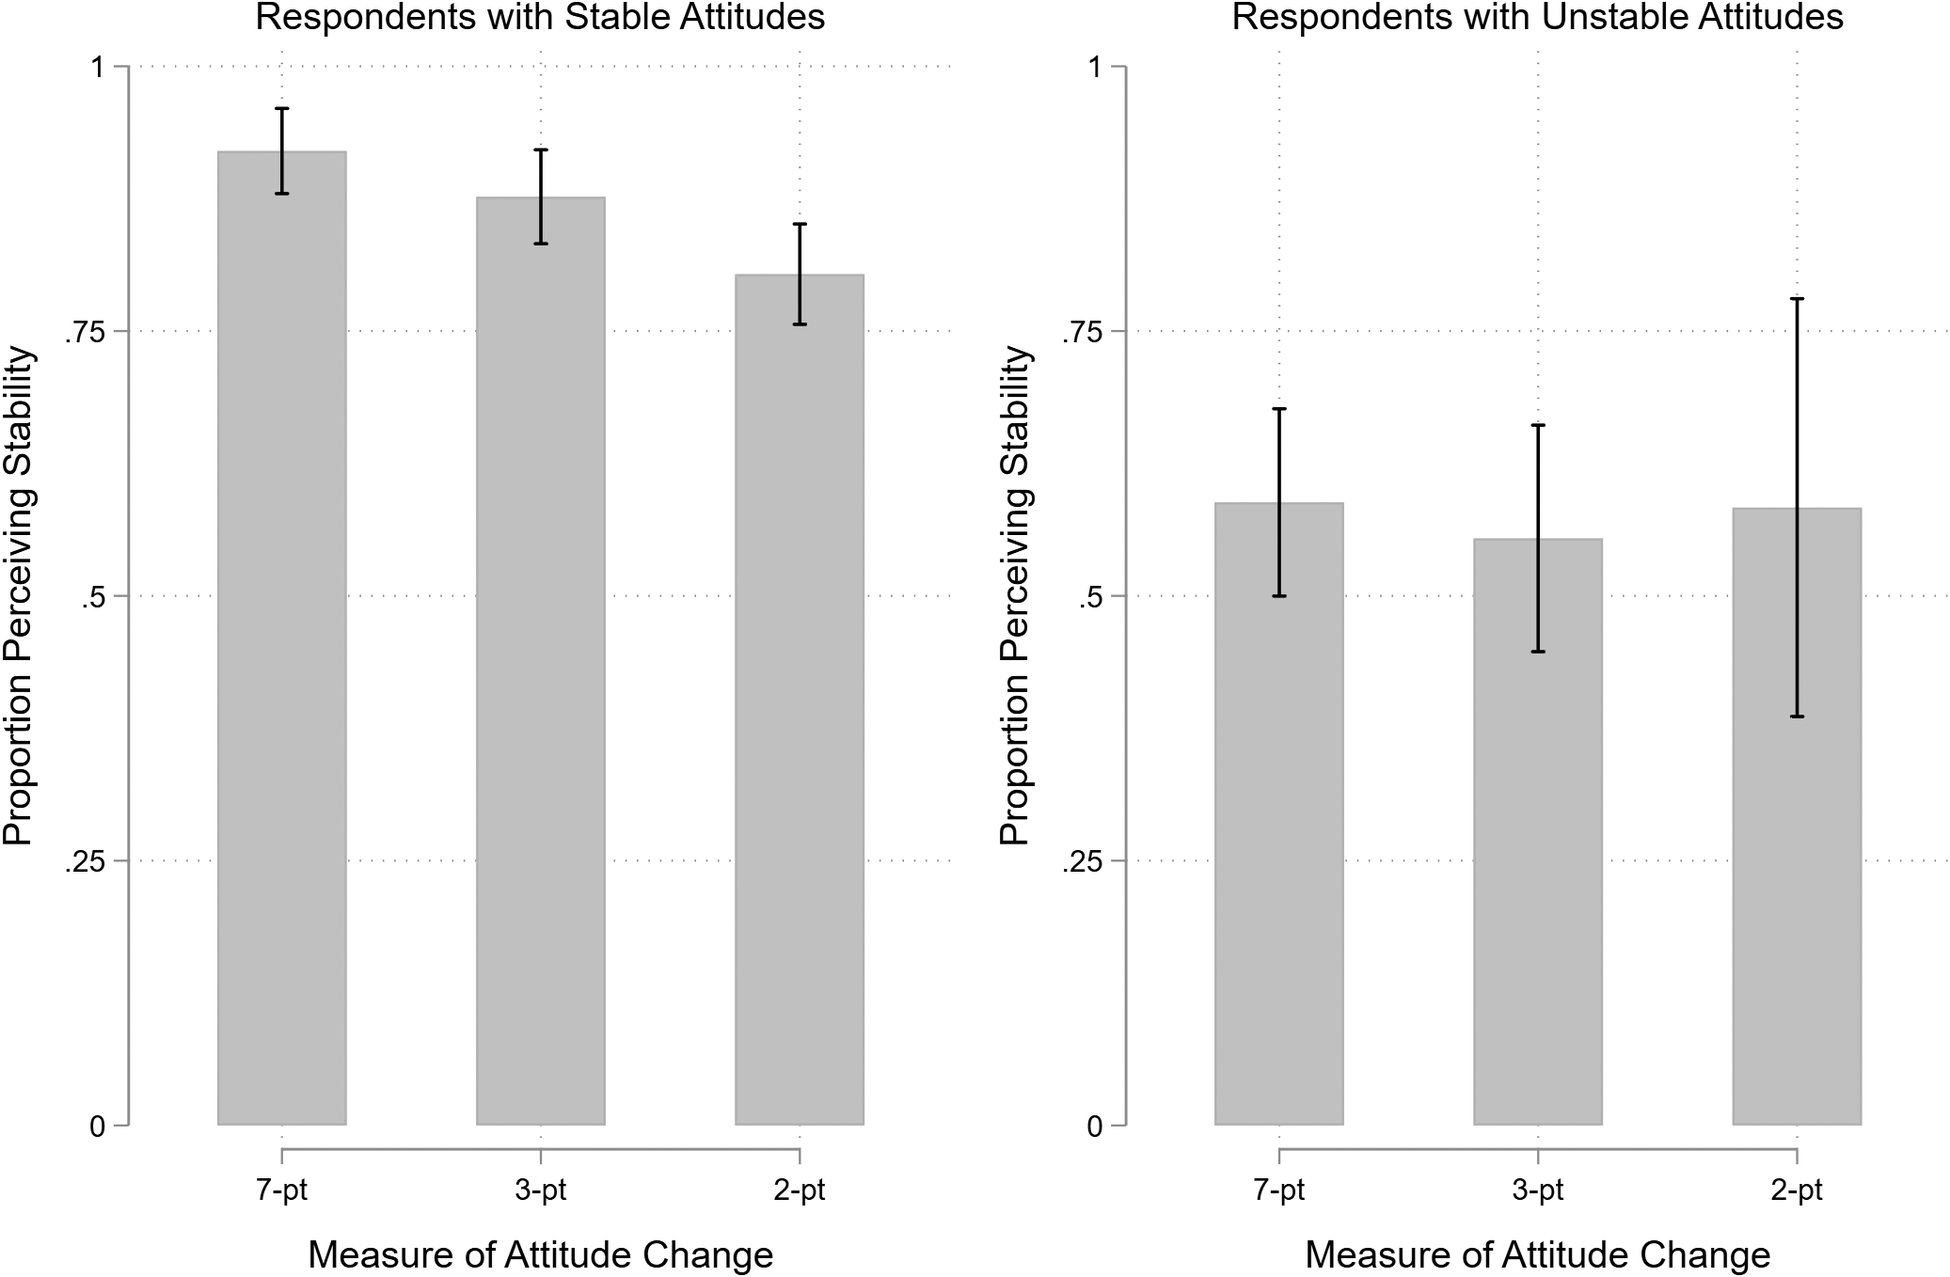
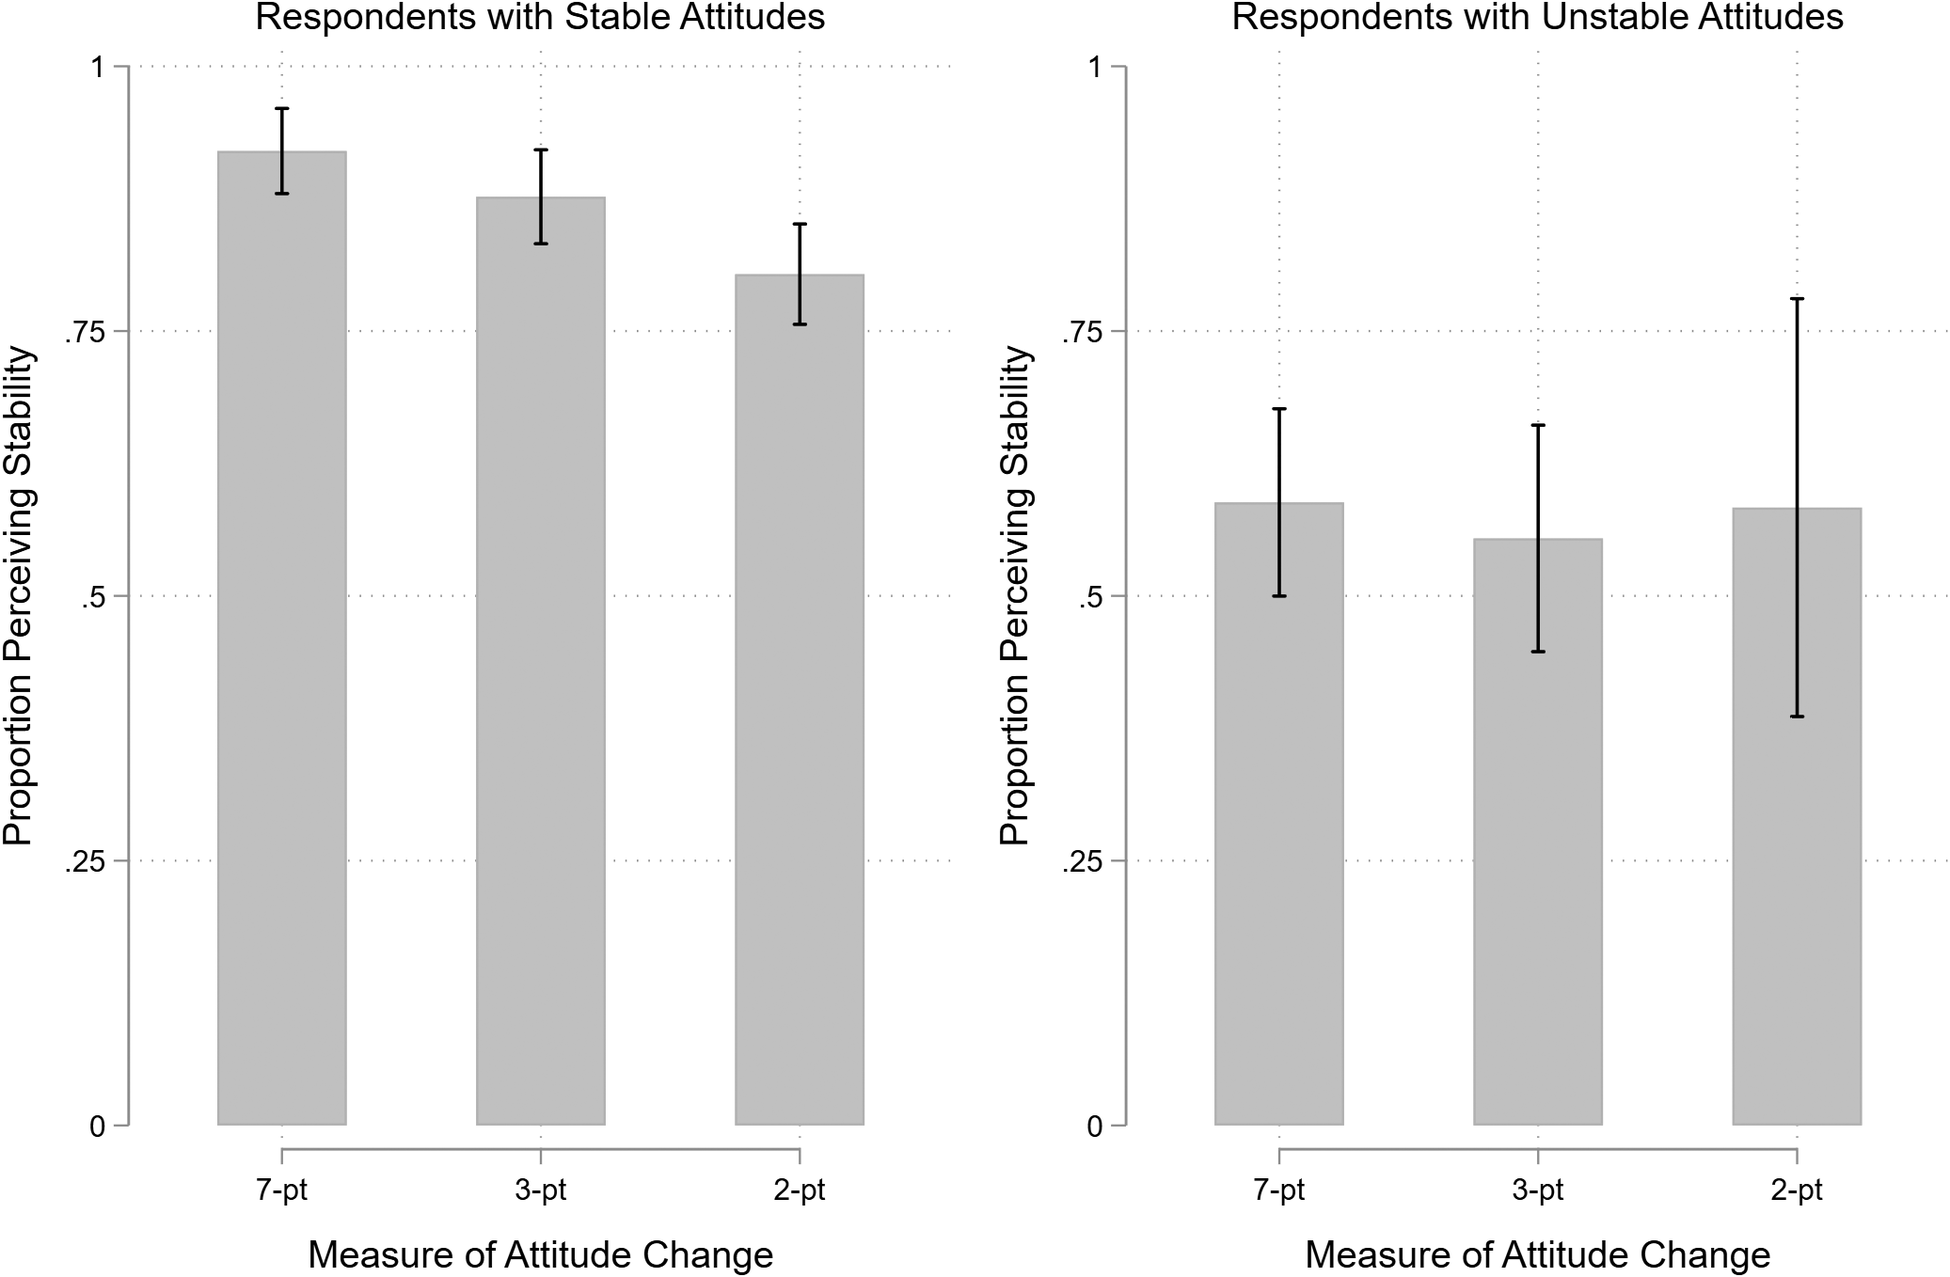
Perhaps repeated measurement of the dependent variable does not influence treatment effects because respondents do not remember their initial stance, eliminating consistency pressures. We tested this possibility in the pre-post condition of Study 6, which included a measure of respondents’ perceptions of their attitude change throughout the course of the study. Immediately following the second measurement of the dependent variable, all respondents in the pre-post condition received the following question: “As you may remember, we also asked you about your support for genetically modified foods at the beginning of the survey. To the best of your memory, how has your support for genetically modified foods changed since the beginning of the survey?” Response options were increased (1), decreased (-1), or stayed the same (0) since the beginning of the survey. We compared self-reported change with actual change from the pretest to posttest measure. Because respondents might interpret change in different ways, we operationalized attitude change in three different ways: (1) any change on the seven-point scale (40% of respondents changed); (2) any shift between favor, oppose, and the scale midpoint (28% of respondents); and (3) any change from favor to oppose or vice-versa (8% of respondents).Footnote 10
Figure 3 displays the proportion of respondents who perceived their attitudes as stable among those whose attitudes were actually stable (left panel) and among those whose attitudes actually changed (right panel). The three bars in each panel represent the three different operationalizations of attitude change described above. Among those with stable attitudes, between 80% and 92% correctly perceived their attitudes as stable, depending on the particular measure. However, among respondents whose attitudes did change, between 55% and 59% also perceived their attitudes as stable. Overall, most respondents believed their opinions did not change, even when they did. This weak relationship between perceptions and actual change indicates an upper limit on consistency effects.
Perceptions of Attitude Change by Actual Change
Note: The figure displays the proportion of respondents who reported that their opinion did not change throughout the study among those who had stable attitudes (left panel) and those whose attitudes changed (right panel). In each panel, we operationalize actual attitude change in three different ways: any change on the seven-point scale; any change between favor, oppose, and the midpoint; and any change between favor and oppose. The lines through the bars correspond to 95% confidence intervals.
How Design Influences Precision
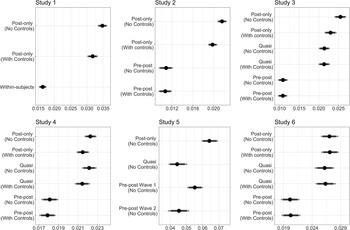
In this section we assess how different experimental designs and analysis strategies affect the precision with which we estimate treatment effects. To facilitate comparison, we rescale all dependent variables to range from 0 to 1. In Figure 4, we plot the standard error of the estimated treatment effect for each design and for alternative analysis strategies for each study. To illustrate the uncertainty in estimates of the standard error, we plot 1,000 bootstrapped estimates of the standard error (gray bars) and the median estimate (black point).
Standard Errors of the Estimate by Study, Design, and Analysis
Note: The figure plots the standard error of the treatment effect for each experimental group generated from 1,000 bootstrap estimates. The points correspond to the median of these samples. The dark gray bars correspond to the interval that contains 90% of the samples, and the light gray bars correspond to the interval that contains 95% of the samples.

Across all six studies, we observe a substantially smaller standard error in the pre-post condition compared with the post-only condition, including when the treatment effect is estimated with additional controls.Footnote 11 The increases in precision are dramatic, with repeated measures designs yielding standard error estimates that are 20% (Study 4) to 58% smaller (Study 3) than those from the comparable post-only designs. Including control variables (partisan identity and self-placement ideology) typically results in smaller standard errors, although the reduction is small and depends on the study. The reductions are effectively zero in Study 4 and Study 6, but more apparent in the other studies. Quasi designs tend to result in smaller standard errors than the post-only designs, even when including controls, although the reductions also vary by study. In Studies 3 and 5, the quasi design yields sizable reductions in the standard error. However, the gains are more modest in Study 6, and in Study 4 the size of the standard error in the quasi design is larger than in the post-only design with controls.
Study 5 allows a comparison between measuring the pretest variable in a prior wave (Wave 1) or in the same wave as the experiment (Wave 2). This question is important, as the majority of pre-post designs in our content analysis of the literature used a panel design, which is costly and raises concerns about attrition. Our results show that measurement within the same wave leads to clear gains in precision, suggesting that panel designs yield weaker benefits. Overall, clear patterns emerge. Standard political controls can lead to small gains in precision, and quasi controls sometimes improve upon these gains. However, repeated measures designs consistently yield substantially more precise estimates.
How Design Choice Affects the Treatment Effects Researchers Can Detect
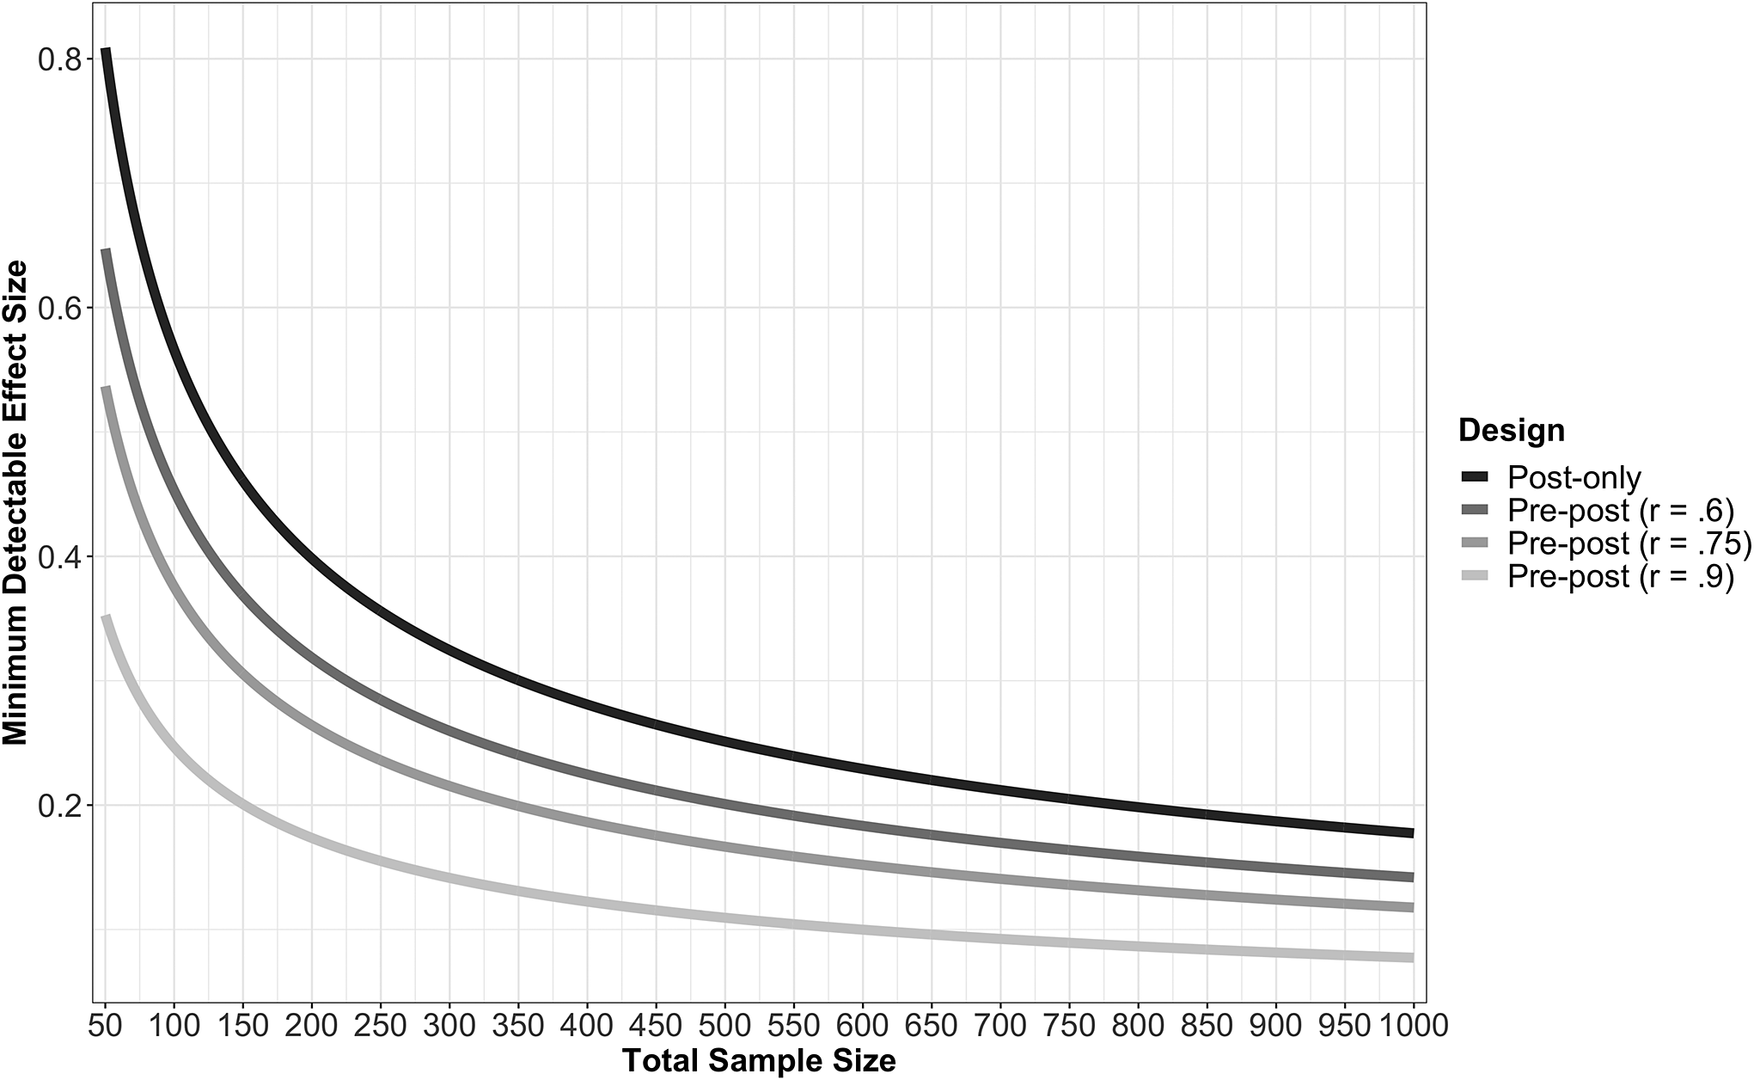
There are clear gains in precision from the pre-post design, while the benefits are less consistent for the quasi design, and minimal for basic political controls. In this section, we further examine how the use of the pre-post design affects the ability of researchers to detect treatment effects when they are present in the data. Here we focus on how design choice affects the minimum detectable effect (MDE). The MDE of an experiment is the smallest effect which, if true, will produce a statistically significant treatment effect at a given level of statistical power and type of significance test (Bloom Reference Bloom1995). Traditionally, the MDE is calculated for a significance level of 0.05 (two-sided test) and a statistical power of 80%. Given these parameters and information provided by our six studies, we calculate values of MDE for various designs at multiple sample sizes.
For these calculations, we adopt the common thresholds for statistical significance and power described above. We then vary two factors when calculating MDE: sample size and the correlation between the pre- and posttreatment measures of the outcome. Sample size corresponds to the total number of respondents in an experiment, and we set it such that half of the sample is assigned to the control and the other half to the treatment. Total sample size ranges from 50 to 1,000. MDE is calculated for a post-only design and three pre-post designs with different correlations between the pre and posttreatment outcomes. For the pre-post designs, the observed correlations between the pre- and posttreatment outcomes ranged from 0.61 (Study 4) to 0.90 (Study 3), so we calculate MDE for three pre-post designs: a weak (r = 0.6), moderate (r = 0.75), or strong (r = 0.9) correlation between the pretreatment and posttreatment outcome measures.Footnote 12 The values we report are standardized treatment effects; thus, smaller values correspond to the ability of a design to detect a smaller effect size. As a reference and to facilitate interpretation, Study 2 yielded a standardized treatment effect of d = 0.2 (0.28 scale points), while the effect in Study 4 was d = 0.72 (1.2 scale points). Calculations are displayed in Figure 5.
Minimum Detectable Effect (MDE) by Sample Size and Design Type
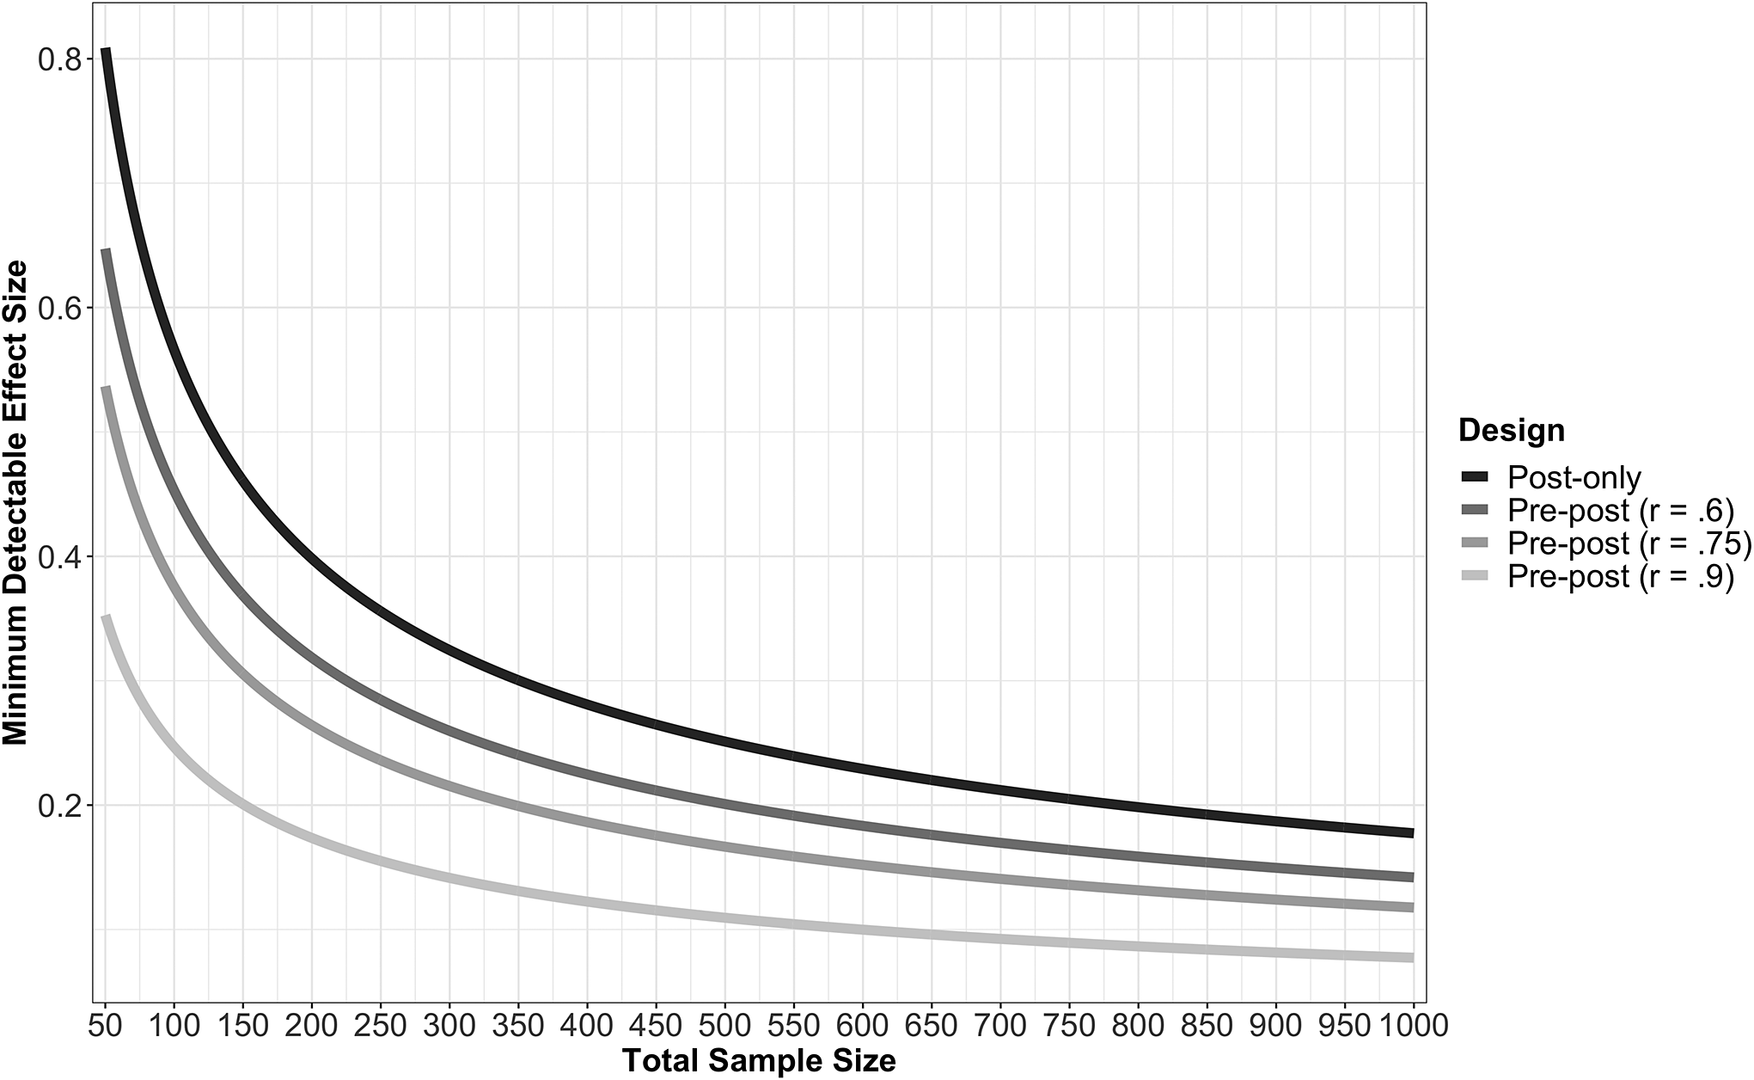
The MDE calculations reveal the dramatic improvement that repeated measures designs can provide in the ability of an experiment to detect a true difference between the treatment and control. To illustrate, consider the four scenarios in our calculations. With an experiment in which the control and treatment each had 50 participants (thus a total of N = 100), the post-only design would only be able to reliably detect an effect of at least 0.57. In contrast, even under the assumption of the weakest pre-post design we observed in our six studies (r = 0.6), the MDE is only 0.45. The MDE for the pre-post design shrinks even further under the assumption of a moderate (MDE = 0.38) or strong pretreatment measure (MDE = 0.25). Thus, a pre-post design with a highly correlated pretreatment measure of the outcome can reliably detect a difference between the control and treatment that is less than half the magnitude of the effect that the traditional post-only design would uncover.
It is also instructive to frame the results in terms of the minimum sample size required to detect an effect, given a design. To detect an effect of 0.2, which corresponds with roughly the smallest statistically significant standardized effect we observed in our six studies (Study 2), a post-only design would require a sample size of 787, while a pre-post design would require only 151 respondents with a strong pretest measure, or 504 respondents with a weak pretest measure. Even with a larger treatment effect of 0.5, which is roughly the average effect size of our six studies, the differences are still dramatic. While a post-only design would require 128 respondents, a pre-post design with a weak pretest measure would require only 83.
If the pre-post design yields smaller treatment effects than the post-only design, then this may undermine the benefits in precision. Figure 5 is also useful for illustrating this potential trade-off. For example, imagine a researcher who plans to run a post-only design and recruit 400 respondents in order to reliably detect an effect as small as 0.28. If the same resources were instead devoted to a pre-post design with a moderate pretest measure (r = 0.75), the analysis could reliably detect an effect as small as 0.19. In other words, the pre-post design would have to reduce the treatment effect by more than 33% to cause a loss in statistical power. Under the assumption of a strong pretest measure (r = 0.9), the reduction in effect size would have to be 57% to cause a net loss in power.Footnote 13
Overall, these results make the potential gains from pre-post designs clear; pre-post designs can reliably detect much smaller treatment effects with the same number of respondents. The gains in precision are particularly dramatic at small sample sizes. Finally, even if pre-post designs were to induce consistency pressures or otherwise reduce treatment effects, the reduction in effect size would have to be substantial to offset the gains in precision.
Additional Benefits of the Pre-post Design
In addition to greater statistical precision, pre-post designs allow the opportunity to gain further insight into treatment effect heterogeneity. For example, researchers often examine moderators of treatment effects under the expectation that the magnitude or direction of effects depend on respondent characteristics (e.g., Kam and Trussler Reference Kam and Trussler2016). Treatment effect heterogeneity has also been central to debates over the generalizability of convenience samples (e.g., Druckman et al. Reference Druckman, Green, Kuklinski, Lupia, Druckman, Green, Kuklinski and Lupia2011). Finally, the literature on motivated reasoning has proposed a backlash effect in which some respondents move in the opposite direction of the treatment (e.g., Nyhan and Reifler Reference Nyhan and Reifler2010), which is fundamentally an issue of treatment effect heterogeneity (Coppock, Leeper, and Mullinix Reference Coppock, Leeper and Mullinix2018). Pre-post designs offer a closer look at treatment effect heterogeneity by allowing an analysis of how respondents change their opinions throughout an experiment (for a related discussion, see Swire-Thompson, DeGutis, and Lazer Reference Swire-Thompson, DeGutis and Lazer2020).
We illustrate these benefits with an analysis of the pre-post arm of our party cues experiment (Study 5). In the section above, we reported evidence that partisans, on average, move toward their party’s position. This average effect is consistent with a pattern of homogeneous treatment effects, in which most or all partisans undergo a small change in opinion. However, it is also consistent with a variety of patterns of heterogeneous effects, such as a large movement among a small number of partisans and no movement among most partisans. In short, the standard post-only design cannot tell us how broadly party cues affect partisans and how large the effect is among those who are responsive.
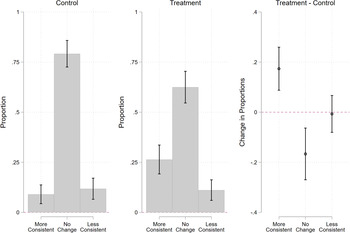
To examine treatment effect heterogeneity, we turn to analyzing difference scores (post-only minus pretest). Using respondents’ own measure of party identification, we then classify respondents into three groups based on their difference score: those whose opinions became more consistent with the party’s position, those whose opinions became less consistent with the party’s position, and those whose opinions did not change throughout the study. The proportion of respondents falling into each group in the control condition is shown in the left-hand panel of Figure 3. Most respondents, 79%, did not change their opinions over the course of their study, but 9% become more party-consistent and 12% became less party-consistent, likely due in part to measurement error or satisficing. The middle panel of Figure 3 shows the results for the treatment condition. Here, 63% did not change their opinion, but 26% moved toward the party’s position and 11% moved away. Of course, these latter patterns are a combination of the treatment effect, measurement error, and any effects of time and other survey content. However, we can estimate the proportion of respondents that the treatment caused to undergo each type of attitude change by differencing the proportions between the treatment and control condition, which is shown in the right-hand panel of Figure 6. The party cue treatment increased the percentage of respondents moving toward their party’s position by 17 percentage points. In other words, only 17% of respondents followed the party cue! The treatment also decreased the percentage of respondents with stable attitudes by about 17 points, and it had no discernible effect on the percentage of respondents moving away from their party’s position. This latter finding suggests (unsurprisingly) that there was no backlash to the treatment in this case; we also find no evidence of backlash effects in the foreign aid or estate tax information experiments.
Most Respondents are Unaffected by Party Cues
Note: The left two panels show how partisans’ attitudes changed between the pretest and posttest measures of the dependent variable. Results are shown separately for the control condition (left panel) and treatment condition (right panel). “More consistent” indicates that, over the course of the study, the respondent shifted their opinion toward their party’s position, “less consistent” means they moved away, and “no change” indicates their opinion did not change. The right panel shows the differences in these three proportions across the experimental conditions. The lines through estimates are 95% confidence intervals.
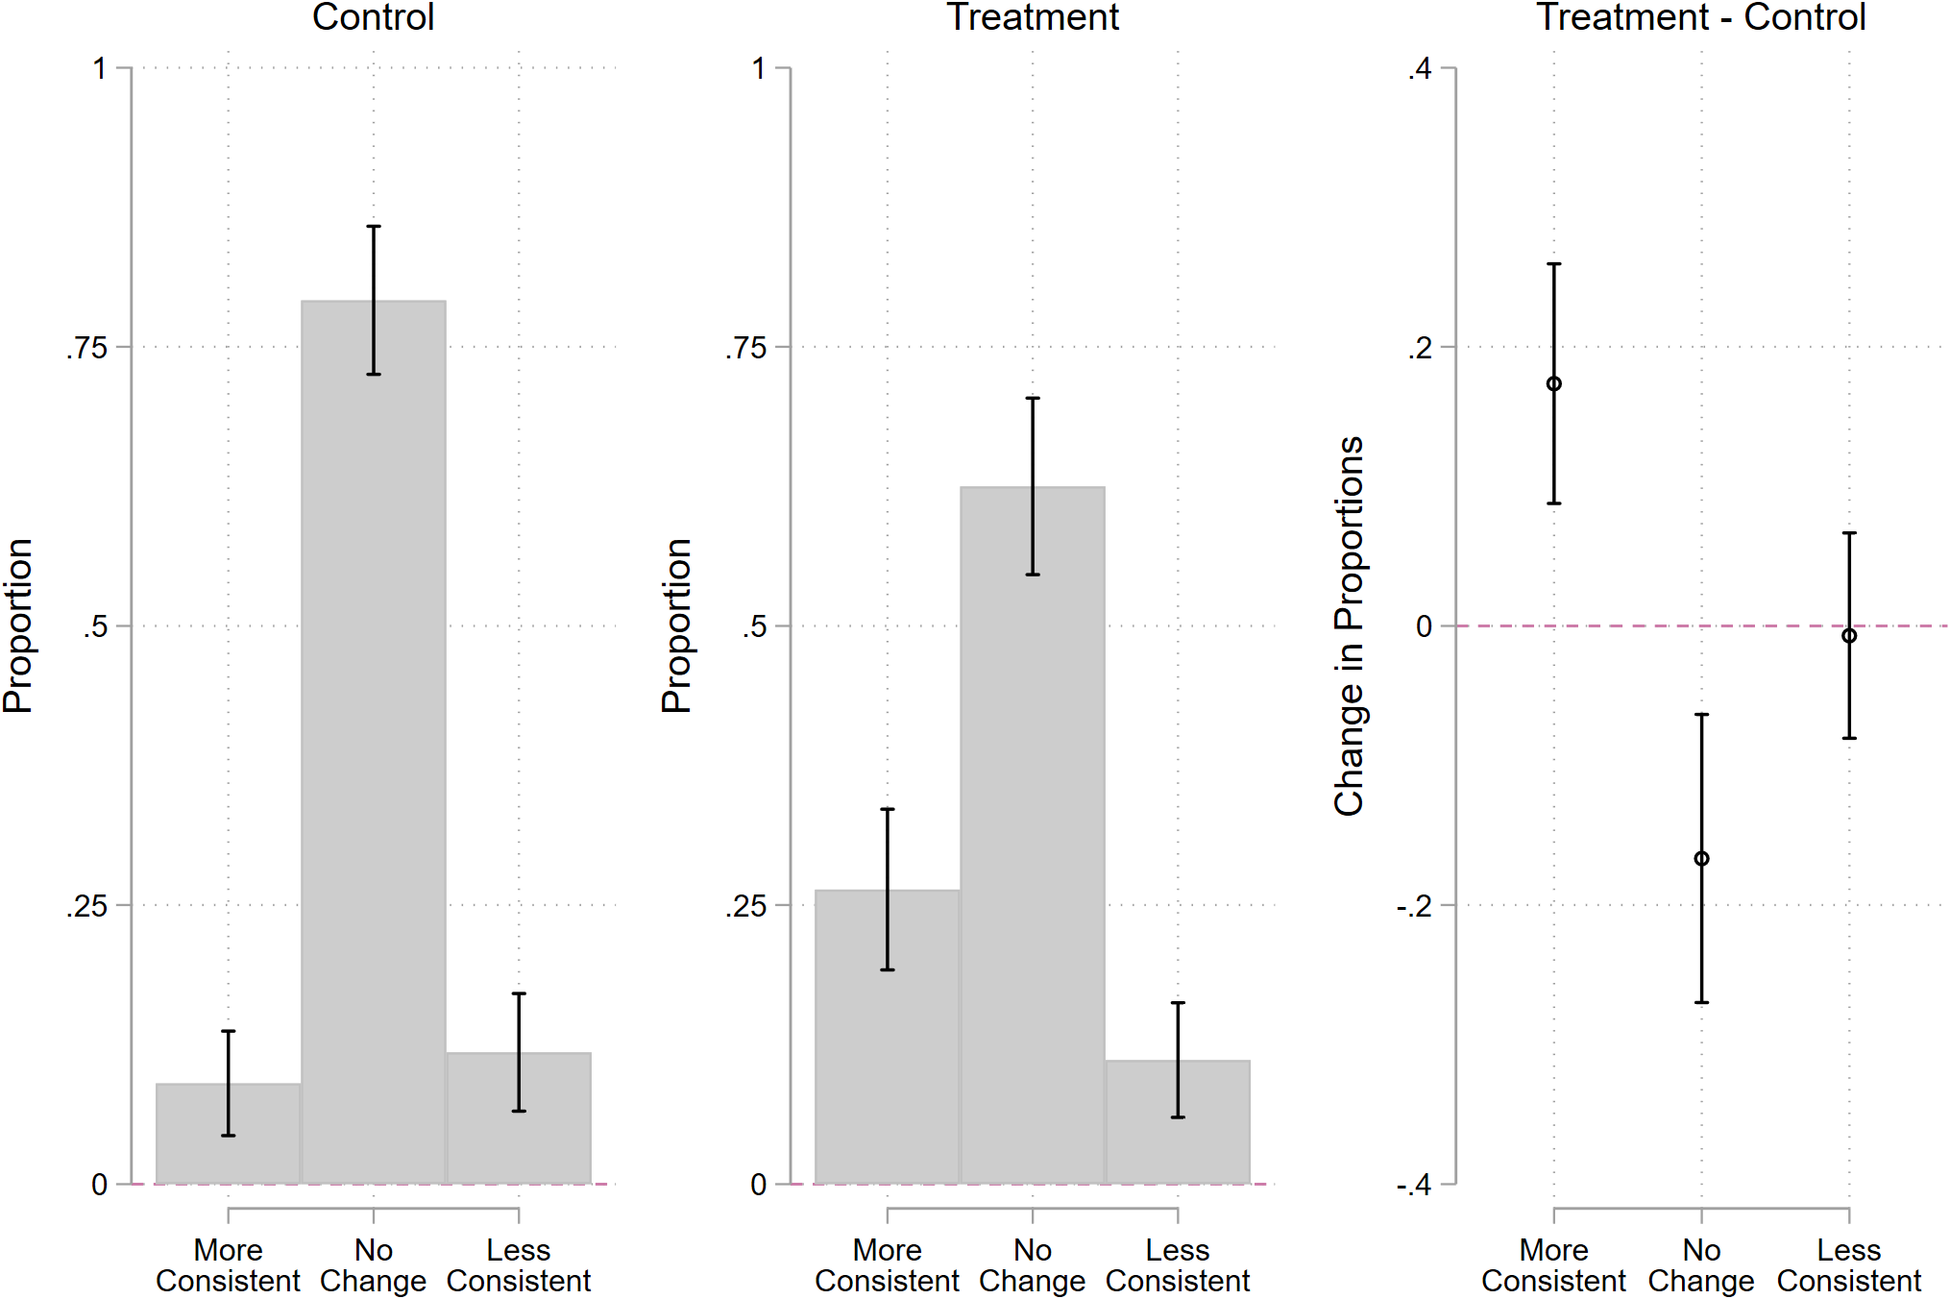
It could be that few partisans shifted their opinions in response to the treatment because they already supported their party’s position. As it turns out, 45% of respondents strongly favored the policy in the pretest measure, removing the possibility of becoming more supportive. Following the procedure described above, we can estimate that among respondents who initially opposed their party’s position (nearly entirely Republicans), the treatment increased the percentage of respondents moving toward their party’s position by 33 points (p < 0.001). In other words, a majority of those who initially disagreed with their party were completely unmoved by the cue. Moreover, most of the attitude change is in intensity rather than position. Among those initially opposing their party’s stance, the treatment caused only about 8% (CI: −5% to 20%) to move to the midpoint and 5% (CI: −4% to 13%) to switch to supporting their party’s stance. Overall, the results suggest that, even on a relatively complex and low-salience issue, most partisans do not change their opinions when exposed to a party cue. Furthermore, most of the opinion change that does occur is in intensity, while very few partisans actually change positions. Of course, this is hardly the last word on the subject of party cues. But our analysis demonstrates that pre-post designs offer new insights into treatment effects that would be missed in a standard post-only design.
Conclusion
Scholars conducting survey experimental research should seek to maximize the precision of their estimates. Researchers, however, have overwhelmingly opted for a post-only design that relies heavily on large sample sizes, ignoring concerns about precision in order to avoid altering treatment effects. This design choice is supported by conventional wisdom that designs offering more statistical precision are likely to alter treatment effects. Yet this conventional wisdom has not been thoroughly tested. Across six experimental studies, each of which was based on a common framework used in applied political behavior research, we find that pre-post and within-subjects designs offer dramatic improvements in statistical power, with little evidence that these designs alter estimated treatment effects. That our findings generalize well across alternative designs speaks to the external validity of common political science experiments. As a result, it seems that conventional wisdom has been too conservative, leading researchers to devote more resources to weaker designs.
While researchers have long relied on covariate controls to increase the precision of treatment effect estimates, this practice does not seem to pay off consistently. Across six studies, controls for partisanship and ideology led to gains in precision that were small in magnitude; these gains were dramatically outperformed by the gains from pre-post and within-subjects designs. The evidence was less consistent for quasi control variables that were designed to closely relate to the dependent variable. The benefits ranged in magnitude from similar to the gains from standard controls (Study 4) to being on par with the large gains from a pre-post design (Study 5). Thus, the gains from controls seem to depend heavily on the quality of the measures selected and the specific design. We recommend that researchers employing a quasi design select multiple items for controls and that they use preexisting datasets to identify a set of controls that maximizes predictive power over the dependent variable.
Given the clear gains in precision and weak evidence that repeated measures designs change treatment effects, we recommend that researchers use pre-post and within-subjects designs whenever possible. These designs are not only more powerful; they also offer deeper insight into the topic of study by allowing a detailed examination of treatment effect heterogeneity, as illustrated with our study on party cues. Of course, our results are limited to only six studies, and we cannot be sure how they generalize to other topics. However, our studies covered several common experimental paradigms and were applied to many different substantive topics. Additionally, our studies used a variety of subject pools, including respondents from Mechanical Turk, who may be particularly suspicious of researchers’ intentions (Krupnikov and Levine Reference Krupnikov and Levine2014). Taken together, our evidence suggests repeated measures designs can offer dramatic gains in precision and require fewer resources.
Of course, there are some instances in which a standard post-only design may be the best option. Within-subjects designs are limited to cases in which the effect of the independent variable can be removed. As a result, research on information effects, for example, is not easily amenable to a within-subjects design. There may also be cases in which pre-post designs do in fact lead to different treatment effects than post-only designs. In all of our studies, we sought to maximize the distance between the pretest measure and the experiment. As a result, we cannot be sure that our findings would hold if the pretest measure of the dependent variable had to be placed immediately before the experiment. We also suspect that respondents may change how they react to treatments when studies are being conducted on sensitive topics or when respondents perceive treatment effects as normatively undesirable. For example, researchers are often wary of measuring racial attitudes prior to an experiment out of fear that it may prime racial considerations (Klar, Leeper, and Robison Reference Klar, Leeper and Robison2019), though some scholarship finds no support for this concern (Valentino, Neuner, and Vandenbroek Reference Valentino, Neuner and Matthew Vandenbroek2018). In our view, future research would do well to investigate the conditions under which consistency pressures are most likely to operate.
When researchers are particularly concerned about repeated measures designs influencing treatment effects, quasi designs appear to be the best option. In these cases, there is no need for the covariates to be causally related to the dependent variable. As such, preexisting data can be mined to identify variables that have tight relationships with the outcome of interest. For example, in our replication and extension of the estate tax experiment conducted by Piston (Reference Piston2018), we used his publicly available data to find two independent variables that jointly maximized predictive power over the dependent variable. While our quasi controls varied in their effectiveness across studies, overall the results suggest that carefully selected controls can substantially increase statistical power relative to standard controls for partisanship and ideology.
Ultimately, we believe that researchers would do well to acknowledge that it is important to design experiments that not only avoid undue influence on treatment effects but also maximize precision. Unfortunately, current design practices are rooted in fears, without much evidence when it comes to treatment effects, and they rarely acknowledge precision, requiring researchers to justify any deviation from the standard post-only design. In contrast, we believe researchers must justify their design choice in terms of both, regardless of which design they choose. Fortunately, our results suggest that there is often little trade-off between the two. In our view, therefore, the default should shift away from the post-only design and toward repeated measures designs.
Supplementary Materials
To view supplementary material for this article, please visit http://dx.doi.org/10.1017/S0003055421000241.
DATA AVAILABILITY STATEMENT
Research documentation and data that support the findings in this manuscript are openly available at the APSR Dataverse: DOI:10.7910/DVN/9MQDK7.
ACKNOWLEGMENTS
The authors thank Alexa Bankert, Roberto Carlos, Mollie Cohen, Alexander Coppock, Jamie Druckman, Christina Farhart, Jennifer Jerit, Ryan Kennedy, Yanna Krupnikov, Thomas Leeper, Brendan Nyhan, and Erik Peterson for helpful comments and suggestions. We are grateful to the editors and the anonymous reviewers for their helpful feedback. We thank Alexandria Putnam and Songhyun Park for valuable research assistance.
CONFLICTS OF INTEREST
The authors declare no ethical issues or conflicts of interest in this research.
ETHICAL STANDARDS
The authors declare that the human subjects research in this article was reviewed and approved by the University of Houston Committee for the Protection of Human Subjects and the University of Georgia Institutional Review Board, and certificate numbers are provided in the appendix. The authors affirm that this article adheres to the APSA’s Principles and Guidance on Human Subject Research.





Comments
No Comments have been published for this article.