INTRODUCTION
Rapeseed is the common name used for four Brassica species (B. napus, B. rapa, B. juncea and B. carinata), grown for their high seed oil content (Walker & Booth Reference Walker and Booth2001). Rape oil ranks third in production among vegetable oils and its meal (what remains after oil extraction) supplies about 0·12 of feed protein (Berry & Spink Reference Berry and Spink2006). Of the four species, B. napus L. is the most widely grown worldwide. The term canola was coined to apply to ‘00’ rapeseed cultivars having seeds with low erucic acid (<0 g/kg) and glucosinolates (<30 µmol/g) (Asare & Scarisbrick Reference Asare and Scarisbrick1995).
In Greece, rapeseed is a new crop as the winter type of B. napus was introduced a decade ago to supply oil for biodiesel production, the main biofuel to meet the state requirements of 2003/30/EC European Directive (Panoutsou et al. Reference Panoutsou, Namatov, Lychnaras and Nikolaou2008). From an agronomic point of view, rapeseed was welcomed in Greece as a ‘break’ crop in the rainfed, winter-cereal cropping system, dominated by durum wheat (Triticum durum Desf.), in which no crop rotation is practised. Rapeseed is expected to contribute to stabilizing or even increasing cereal yields by mitigating drought, weed and disease problems (Turner Reference Turner2004; Seymour et al. Reference Seymour, Kirkegaard, Peoples, White and French2012). However, after a decade, rapeseed struggles to find its place among the other winter crops, occupying merely 5 000–18 600 ha, a very small area compared with the 800 000 ha seeded to winter cereals (Greek Ministry of Rural Development and Food, personal communication).
Brassica napus is best adapted to and grown mainly in temperate regions but it is expanding in semi-arid environments such as the Mediterranean region (Bona et al. Reference Bona, Mosca and Vamerali1999; Berry & Spink Reference Berry and Spink2006). However, in semi-arid regions, rapeseed is considered a risky crop with often poor yields and economic output (Robertson & Holland Reference Robertson and Holland2004; Farré et al. Reference Farré, Robertson and Asseng2007).
In Greece, the fragmented terrain shapes different pedo-climatic environments and light-textured to clayey soils, and semi-arid to mild continental conditions alternate within a small spatial span. This is important since environment (E) greatly affects rapeseed yield accounting for 0·65–0·82 of yield variation (Escobar et al. Reference Escobar, Berti, Matus, Tapia and Johnson2011; Nowosad et al. Reference Nowosad, Liersch, Popławska and Bocianowski2016). Genotype × environment interaction (G × E) is high, making the selection of high-yielding and stable cultivars difficult (Shafii et al. Reference Shafii, Mahler, Price and Auld1992; Escobar et al. Reference Escobar, Berti, Matus, Tapia and Johnson2011; Moghaddam & Pourdad Reference Moghaddam and Pourdad2011; Nowosad et al. Reference Nowosad, Liersch, Popławska and Bocianowski2016). Both open-pollinated and hybrid cultivars are grown but the latter generally gives better and more stable yields (Brandt et al. Reference Brandt, Malhi, Ulrich, Lafond, Kutcher and Johnston2007; Gehringer et al. Reference Gehringer, Snowdon, Spiller, Basunanda and Friedt2007) with lower optimal plant densities (Roques & Berry Reference Roques and Berry2016).
The pursuit of the ‘ideal’ cultivar, with higher and more stable yield, is a great challenge for both breeders and agronomists. It requires the unveiling of hidden information residing in multi-environment trials and data interpretation before their exploitation. In this context, the genotype (G) plus G × E (GGE) biplot constitutes a powerful technique to display graphically the two-way (genotype–environment) data and visualize the inter-relationships between G, E and G × E (Yan Reference Yan2001). The GGE biplot model removes noise generated by E leading to effective cultivar selection, especially when locations constitute different mega-environments. Biplot analysis, showing the polygon view of the pattern (which cultivar had the highest yield in which environment), is useful for studying the interaction pattern (Yan & Tinker Reference Yan and Tinker2006; Dehghani et al. Reference Dehghani, Omidi and Sabaghnia2008).
Theoretically, rapeseed has a seed yield potential as high as 6·5–7·0 t/ha, but attainable yields hardly reach 3·0 t/ha (Berry & Spink Reference Berry and Spink2006; Takashima et al. Reference Takashima, Rondanini, Puhl and Miralles2013). Many factors are to blame for this yield gap.
Rapeseed can compensate for yield losses in cases of poor establishment or high overwintering damages because of its plasticity to adjust pod bearing between the main raceme and branches. In any case, in spring, a plant density (PD) of 40–150 plants/m2 is generally required for high yields (Moore & Guy Reference Moore and Guy1997; Leach et al. Reference Leach, Stevenson, Rainbow and Mullen1999; Roques & Berry Reference Roques and Berry2016). Lower plant densities are unable to compensate for yield losses, while higher ones (>200 plants/m2), despite better weed suppression, yield less due to high intra-species competition (Angadi et al. Reference Angadi, Cutforth, McConkey and Gan2003; Lamb & Johnson Reference Lamb and Johnson2004). Brassica napus demands high nitrogen (N) uptake and consequently high N fertilization, especially compared with winter cereals. A total N uptake of >300 kg N/ha is needed for maximum yields because of the crop low N use efficiency and the requirement to build up a large above-ground biomass, which can lead to high seed yield (Rood et al. Reference Rood, Major, Carefoot and Bole1984; Rathke et al. Reference Rathke, Behrens and Diepenbrock2006). Moreover, rapeseed has relatively high demands for sulphur (S; Brennan & Bolland Reference Brennan and Bolland2006). Heat and concomitant water stress are possibly the most influential restrictors of seed yield and quality in semi-arid regions. Temperatures higher than 27 °C from flowering onwards are responsible for floral sterility, abortions and poor pod filling resulting in low yield and quality (Yaniv et al. Reference Yaniv, Schafferman and Zur1995; Morrison & Stewart Reference Morrison and Stewart2002). Similarly, detrimental effects on yield and quality have been reported for water stress when occurring from flowering to seed filling stages (Bouchereau et al. Reference Bouchereau, Clossais-Besnard, Bensaoud, Leport and Renard1996; Champolivier & Merrien Reference Champolivier and Merrien1996; Gunasekera et al. Reference Gunasekera, Martin, Siddique and Walton2006; Tesfamariam et al. Reference Tesfamariam, Annadale and Steyn2010). Insects and diseases can be serious yield restrictors, especially when a proper rotation (e.g. 4–5 years) is not followed (Berry & Spink Reference Berry and Spink2006; Lisson et al. Reference Lisson, Kirkegaard, Robertson and Zwart2007).
Since rapeseed is a new crop in Greece, the objective of the current study was to determine the productivity and quality of four cultivars of B. napus in various pedo-climatic environments in Greece and identify agronomic characteristics associated with high seed yield and quality.
MATERIALS AND METHODS
Locations and experiment set up
Four cultivars of winter rapeseed (B. napus L.) were tested during the 2005–2006 and 2006–2007 growing seasons (hereafter 2005 and 2006, respectively). Of the four cultivars, three were hybrids (Royal, Exact, Excalibur) and one a conventional inbred line (Fortis). The cultivars were selected on the basis of their popularity among growers and their differentiation in flowering and maturity earliness according to breeders’ suggestions.
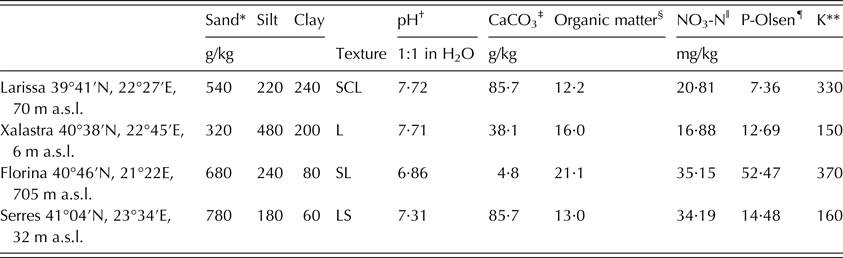
The study was conducted at four locations, one in central (Larissa) and three in northern Greece (Xalastra, Florina and Serres), which have major differences in their pedo-climatic features. Three out of four locations (Larissa, Florina and Serres) had light-textured soils with sand content higher than 500 g/kg, only Xalastra had a loamy soil. pH was alkaline in Larissa, Xalastra and Serres ranging from 7·31 to 7·72 and only Florina had a pH <7 (Table 1).
Soil properties of the four locations at 0–30 cm depth before the establishment of the experiments in 2005–2006 growth season

CaCO3, calcium carbonate; NO3-N, nitrogen as nitrate; P, phosphorus; K, potassium; H2O, water.
* Hydrometer method.
† By pH meter.
‡ Volumetrically.
§ Wet oxidation method.
ǁ Extractable with 2 M potassium chloride (KCl).
¶ Olsen method.
** Extractable with 1 M ammonium acetate (CH3COONH4).
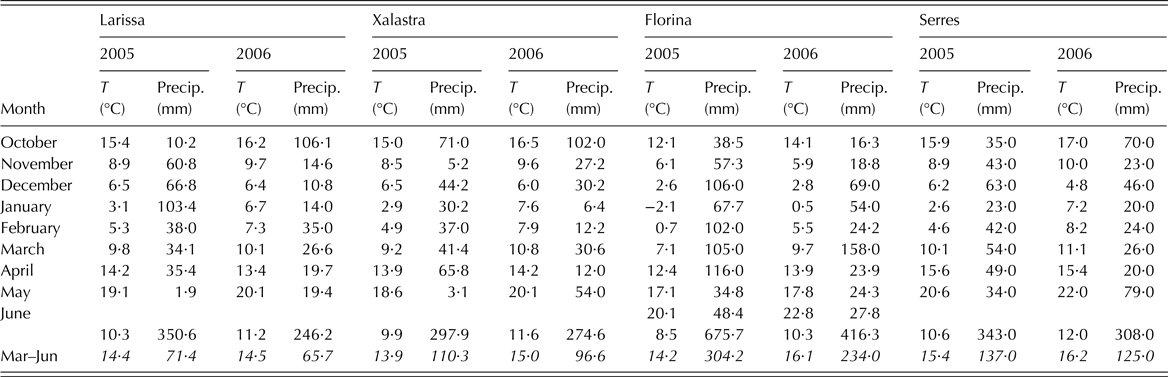
The preceding crops were fallow in Larissa and Florina 2006, maize in Xalastra and Florina 2005, and winter wheat (T. durum) in Serres. Soil characteristics of the experimental sites and meteorological data for the two growing seasons are presented in Tables 1 and 2, respectively.
Monthly mean air temperature (T, °C) and precipitation (Precip., mm) during the growing season for the 2 years of experimentation and the four locations

The over-season mean air temperature and precipitation along with the sum of precipitation from March to June (Mar–Jun) are also given in italics at the bottom of the respective columns.
All the experiments were hand-seeded between 21 and 27 October. The experimental design was a randomized complete block (RCB) design with four replications. Plots were 8 m long and consisted of five rows, 0·3 m apart. Within each row, seeds were placed ca. 3 cm apart and when necessary, hand-thinned at the four-leaf stage [BBCH 14 stage, Lancashire et al. (Reference Lancashire, Bleiholder, Van Den Boom, Langeluddeke, Stauss, Weber and Witzenberger1991)] leaving approximately 80 plants/m2 before winter. Despite reports that hybrids maximize yields at lower rates compared with inbred lines (Roques & Berry Reference Roques and Berry2016), PD was set to a high rate because there are no data on optimal plant densities under local conditions.
Basal fertilization was uniformly applied at rates of 100 kg N/ha, 50 kg phosphorus pentoxide (P2O5)/ha and 50 kg potassium oxide (K2O)/ha and incorporated into the soil before seeding. Trifluralin [2,6-dinitro-N,N-dipropyl-4-(trifluoromethyl)aniline] was sprayed pre-emergence and was supplemented with hand weeding after emergence to suppress the weeds till row closure. No spraying for insects or diseases was applied since no serious infestations occurred.
Measurements and determinations
Crops were harvested at maturity with 10% seed moisture content, when seeds were brown or dark brown to black (Elias & Copeland Reference Elias and Copeland2001).
From each plot, 4 m of the three inner rows were harvested by hand, comprising a harvest area of 3·6 m2. The number of harvested plants was counted from which five typical plants from each plot were selected; their height was recorded and the pods on the main raceme (PMR) and branches (PB) were counted. The sum of PMR and PB gave the total number of pods per plant which was then used to derive pods/m2. The lower five pods of the main raceme and first branch of each of the five selected plants were collected and the number of seeds per pod was measured (SPMR and SPB, respectively). The lower pods were selected as they are less impacted by the availability of assimilates, which affects strongly the higher pods along the inflorescence, leading to large variations in seed number per pod (Wang et al. Reference Wang, Mathieu, Cournède, Allirand, Jullien, De Reffye and Zhang2011; Labra et al. Reference Labra, Struik, Evers and Calderini2017).
The five selected plants were separated into component parts, pods were threshed and seeds separated. The plant parts (stems, leaves and pod walls) were oven-dried at 75 °C till constant weight. One hundred randomly selected seeds of the main racemes and branches were dried, and the weights were used to determine seed moisture content and the 1000-seed weight on the main raceme (TSWMR) and first branch (TSWB), respectively. The TSWB was not assessed at Florina. Harvest index (HI) was calculated as the ratio of seed weight to total crop dry weight. Seed yield (t/ha) was determined at 10% moisture content.
Quality assessments
A randomly selected sample of ca. 100 g per plot was used for seed quality assessments, i.e. oil content at 10% seed moisture content, protein content in seed meal, glucosinolates, oleic, linolenic and erucic acid concentrations in the oil. Seed samples were shipped to Syngenta Germany and the analyses were performed by standard methods. Oil content was measured by hexane extraction and the meal N concentration (N) was assessed by the Kjeldahl method. Protein content was calculated as the product 6·25 × N. Then the sum of oil and protein content was calculated, and oil and protein yield determined. The fatty acid composition and glucosinolate concentrations were determined by high-performance liquid chromatography. Seed quality traits were all expressed at 10% seed moisture content.
Statistical analysis
The analysis of variance (ANOVA) model 4 (Annicchiarico Reference Annicchiarico2002) was performed for estimation of variance components for trials in a RCB design considering cultivars (G) and locations (L) as fixed factors, and years (Y) as random (i.e. L and Y crossed factors). The ANOVA treatment sum of squares (SSTRMT = SSG + SSL + SSY + SSG × L + SSY × G + SSL × Y + SSG × L × Y), including G, L, Y, and their respective two- and three-way interactions, was partitioned into its components (SSG, SSL, SSY, SSG × L, SSY × G, SSL × Y, SSG × L × Y) as percentage of sum of squares of the SSTRMT. Thus, it was possible to estimate the contribution of each source of variation to the variability of each trait studied. The trial means were compared using the least significant difference test (L.S.D.) at P < 0·05, whereas Pearson phenotypic correlation coefficients (r) between agronomic traits, yield and quality were calculated to identify the most prominent correlations. To avoid spurious self-correlations (Kenney Reference Kenney1982; Auerswald et al. Reference Auerswald, Wittmer, Zazzo, Schäufele and Schnyder2010), coefficients were not estimated for interconnected traits, e.g. seed and oil yields or protein content and protein yield. The Shapiro–Wilk W test for normality showed that most of the parameters were normally distributed, whereas the pods on branches, pods/plant, protein content, Oil + Prot and erucic acid concentration departed only slightly from normality (W index 0·93–0·98). All statistical analyses were conducted using the statistical software JMP 5·1·2 (SAS Institute Inc, Cary, NC, USA).
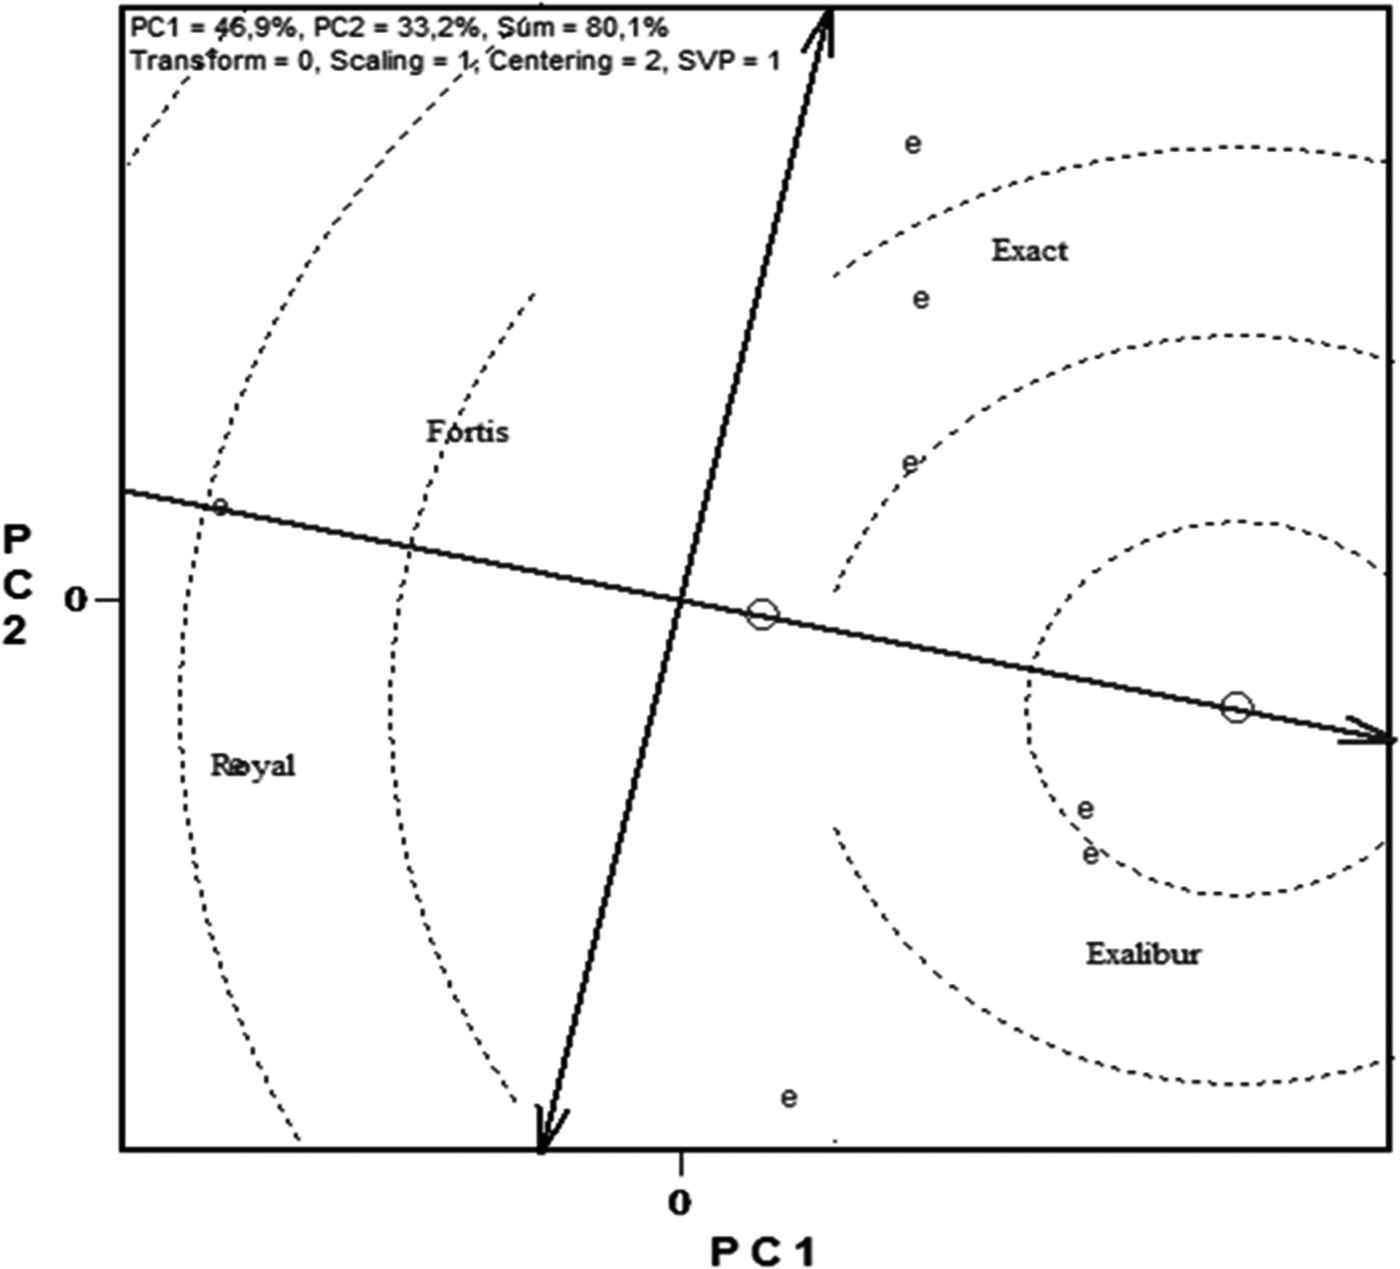
The GGE biplot pattern explorer software was used to generate graphs showing the polygon view of the pattern (i.e. which cultivar had the highest yield in which environment) (Yan Reference Yan2001; Yan & Tinker Reference Yan and Tinker2006). Thus, year × location combinations were grouped based on the best genotype and revealed cross-over cultivar × location interactions as well the relationships between locations regarding cultivar adaptation. To determine stability across environments, a GGE biplot analysis was conducted using a line passing through the biplot origin called the average tester coordinate (ATC), which approximates the average scores of cultivars across environments, and a line that passes through the origin and is perpendicular to the ATC approximates cultivar stability or G × E. The two lines determine the position of the ‘ideal’ cultivar that is the most desirable for yield and stability and determined by the centre of concentric circles. The lower the distance of a cultivar from the centre of concentric circles, the closer it is to the ‘ideal’ (Yan Reference Yan2001).
RESULTS
Climatic parameters
Florina had the longest growing season (October to July) with the lowest mean temperature and the highest precipitation. It was the only location showing negative or close to 0 °C mean temperature in January (Table 2). The southern-most site, Larissa, was the most stressful environment combining low precipitation and high temperature, especially from the early reproductive phase till maturity (March to May). Serres and Xalastra in 2006 were warmer, and Xalastra in 2005 was cooler compared with Larissa but they were much wetter, especially during the March–May period (Table 2).
Yield and quality
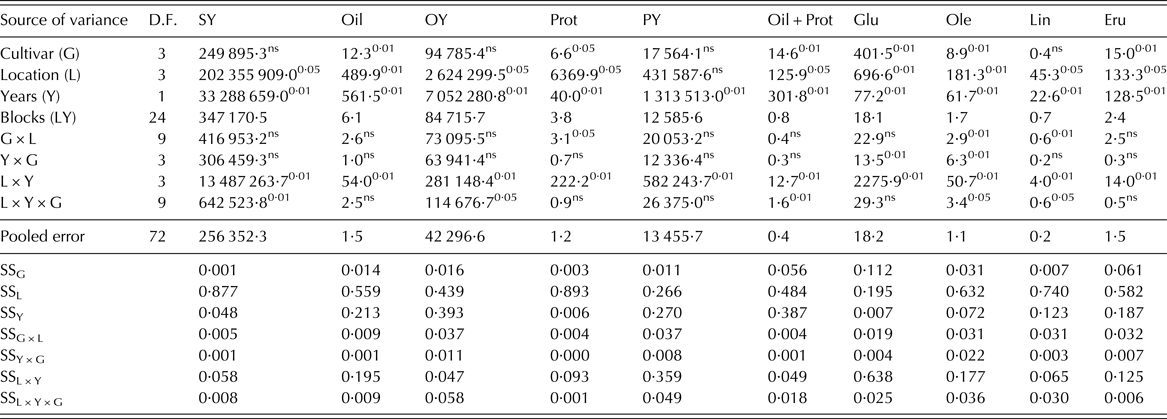
Location (L) and year (Y) affected yield and quality traits significantly (P ⩽ 0·05), excluding L for protein yield, while cultivar (G) had no significant effect on seed, oil and protein yields or linolenic acid concentration (Table 3). The G × L interaction was significant for protein content, oleic and linolenic acid concentrations; the Y × G interaction affected glucosinolates and oleic acid, and the L × Y interaction was significant (P ⩽ 0·01) for all traits. The triple interaction (L × Y × G) had a significant effect on seed (P ⩽ 0·01) and oil yield (P ⩽ 0·05), the sum of oil and protein content (P ⩽ 0·01), and oleic and linolenic acid (P ⩽ 0·05). For all the traits, L contributed to most of the variation, whereas G accounted for as low as 0·001 in seed yield to as high as 0·061% in erucic acid concentration (Table 3). However, the SSGL/SSG ratio was 5·0-fold for seed yield, 2·3-fold for oil yield and 3·4-fold for protein yield, and for this reason, the GGE biplot with the polygon view could be useful to study the interaction pattern observed.
Mean squares analysis of variance (ANOVA) and sum of squares (SS) partitioning regarding the treatment SS (SSTRMT ) for yield and quality traits at 10% seed moisture content

D.F., degrees of freedom; SY, seed yield; Oil, seed oil content; OY, oil yield; Prot, protein content in meal; PY, protein yield; Oil + Prot, sum of Oil and Prot; Glu, glucosinolates in meal; Ole, oleic acid concentration; Lin, linolenic acid concentration; Eru, erucic acid concentration.
Significance level of SS is given as a superscript. ns, non-significant.
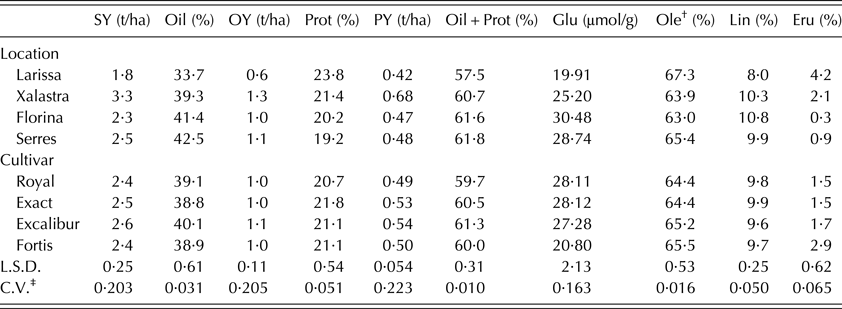
Over Y and G, Xalastra was the most productive site with a seed yield of 3·29 t/ha followed by Serres and Florina (2·53 and 2·33 t/ha, respectively); the southern-most site, Larissa, ranked last with 1·79 t/ha (Table 4). The same ranking was evident for oil and protein yields. The less productive site, Larissa, had also the lowest oil content (33·7%) with Serres being the highest (42·5%) followed by Florina and Xalastra (41·4 and 39·3%, respectively). Larissa had the highest protein content (23·8%), oleic (67·3%) and erucic acid concentrations (4·2%), while Serres and Florina showed the highest sum of oil and protein content (61·8 and 61·6% respectively) and glucosinolates (28·74 and 30·48 µmol/g, respectively). Florina had the highest linolenic acid (10·8%).
Mean comparisons for yield and quality traits at 10% seed moisture content

SY, seed yield; Oil, seed oil content; OY, oil yield; Prot, protein content in meal; PY, protein yield; Oil + Prot, sum of Oil and Prot; Glu, glucosinolates in meal; Ole, oleic acid concentration; Lin, linolenic acid concentration; Eru, erucic acid concentration.
For each trait, means were compared with the least significance test (L.S.D.) at P < 0·05.
† Ole, Lin and Eru are given as percentage of the total fatty acid concentration.
‡ C.V., coefficient of variation.
Regarding cultivars, the high CV possibly masked the yield advantage of Excalibur over the other three genotypes (Table 4). Excalibur out-yielded Exact by 0·04 and the other two cultivars (Royal and Fortis) by 0·074 on seed yield. It also outperformed the others for oil content (40·1%) and the sum of oil and protein content (61·3%). Exact had the highest protein content (21·8%), while Fortis showed the lowest glucosinolates (20·80 µmol/g) and the highest erucic (2·9%) and oleic acid concentrations (65·5%) with no significant difference compared with Excalibur (65·2%).
The evaluation of cultivar adaptation and the investigation of the relationships between locations necessitated the use of GGE biplot analysis with the polygon view based on the best-performing cultivars. The data set (2 years and four locations) used was adequate to depict the relationships among locations regarding cultivar performance.
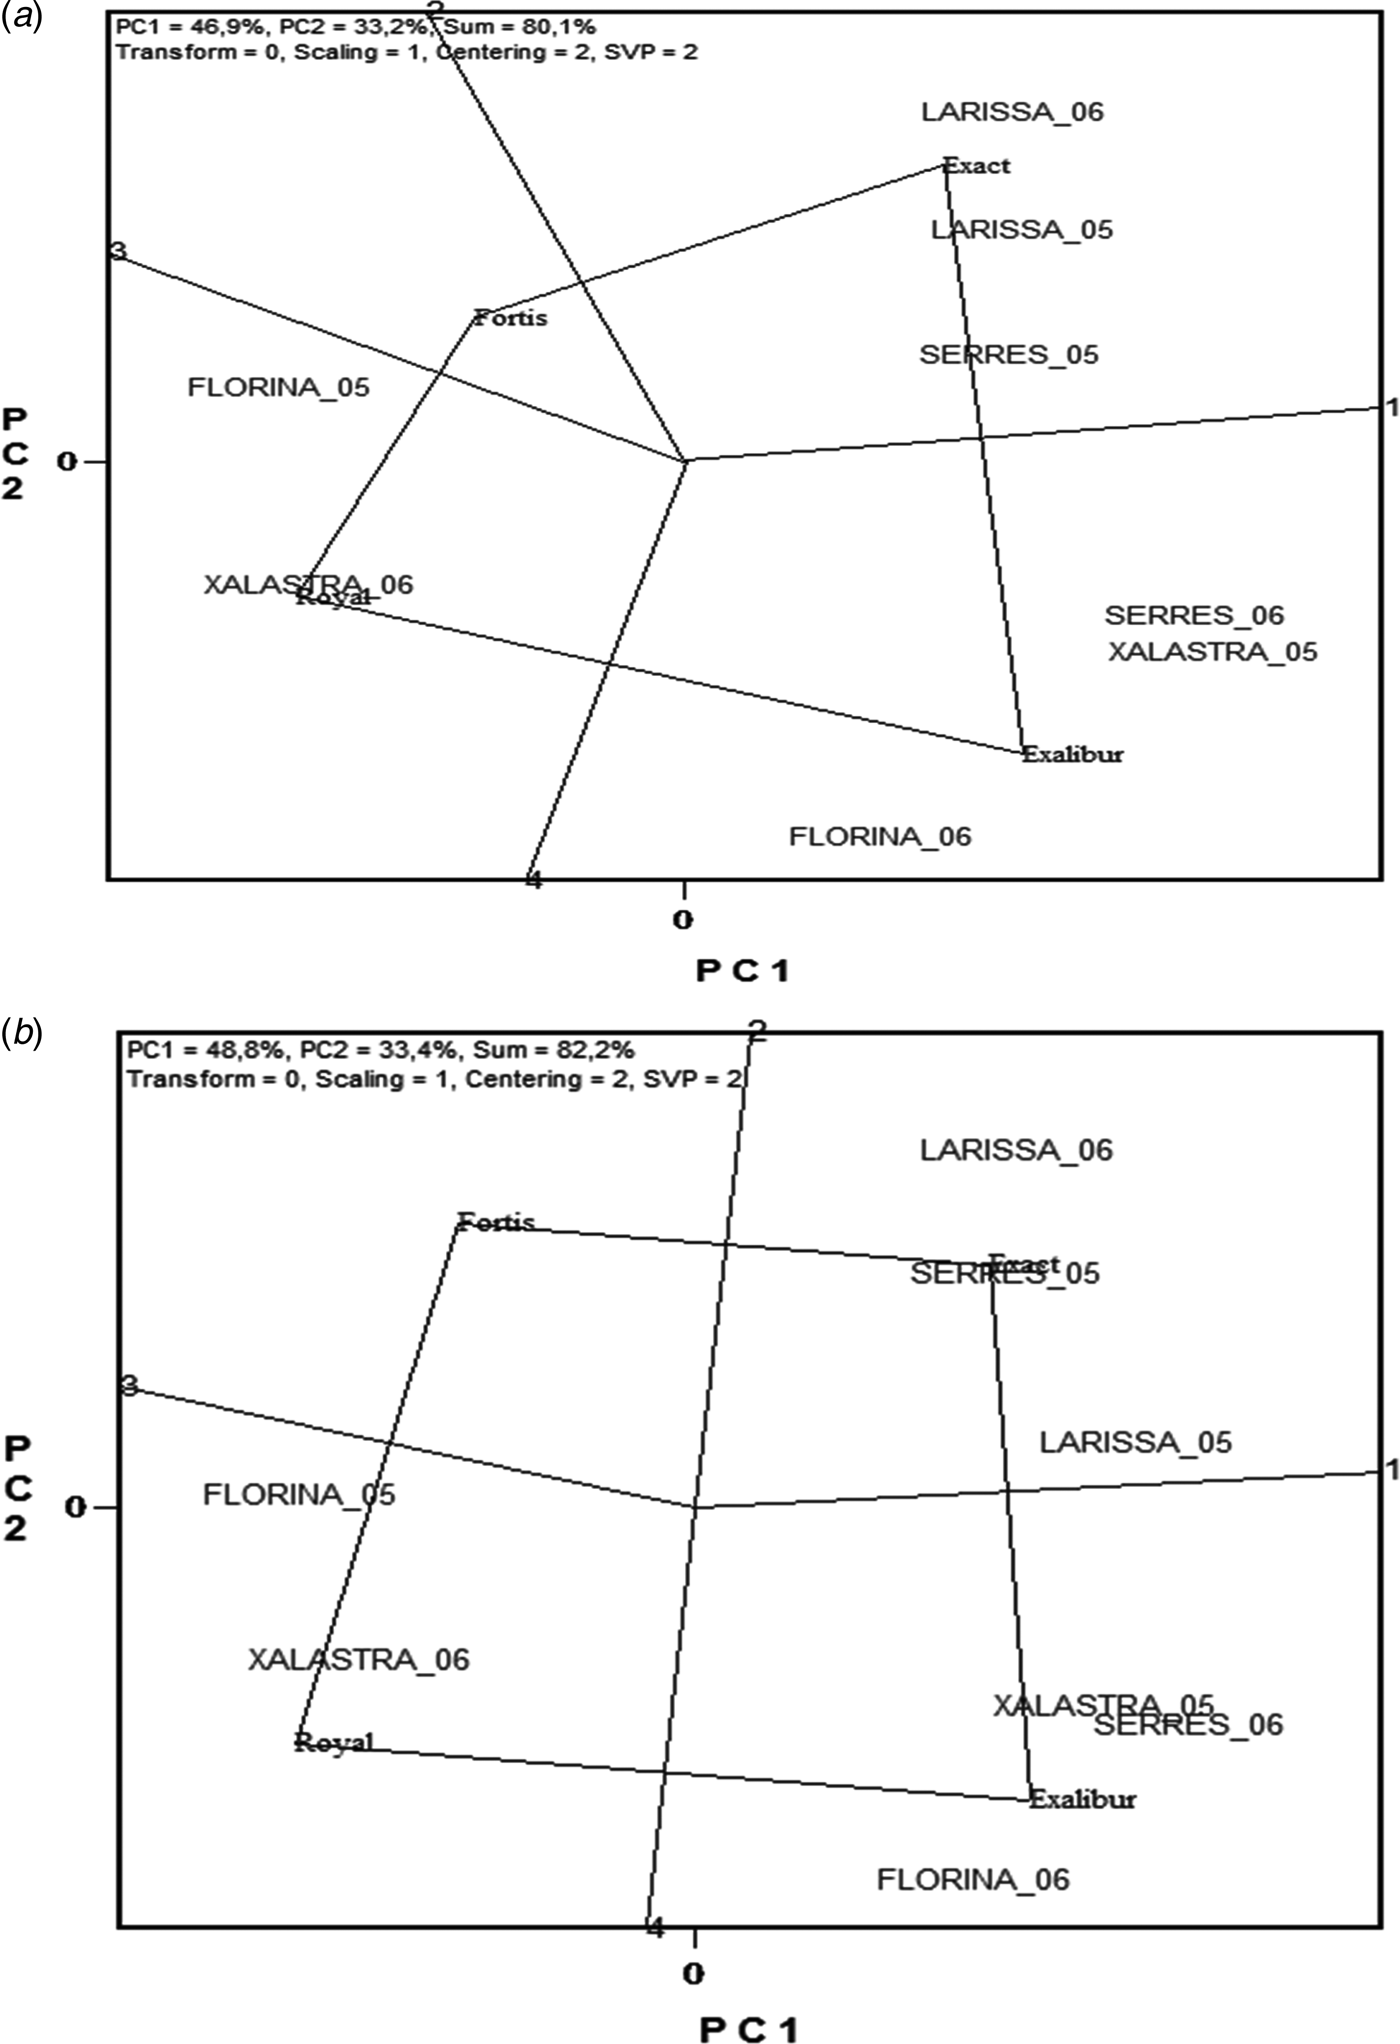
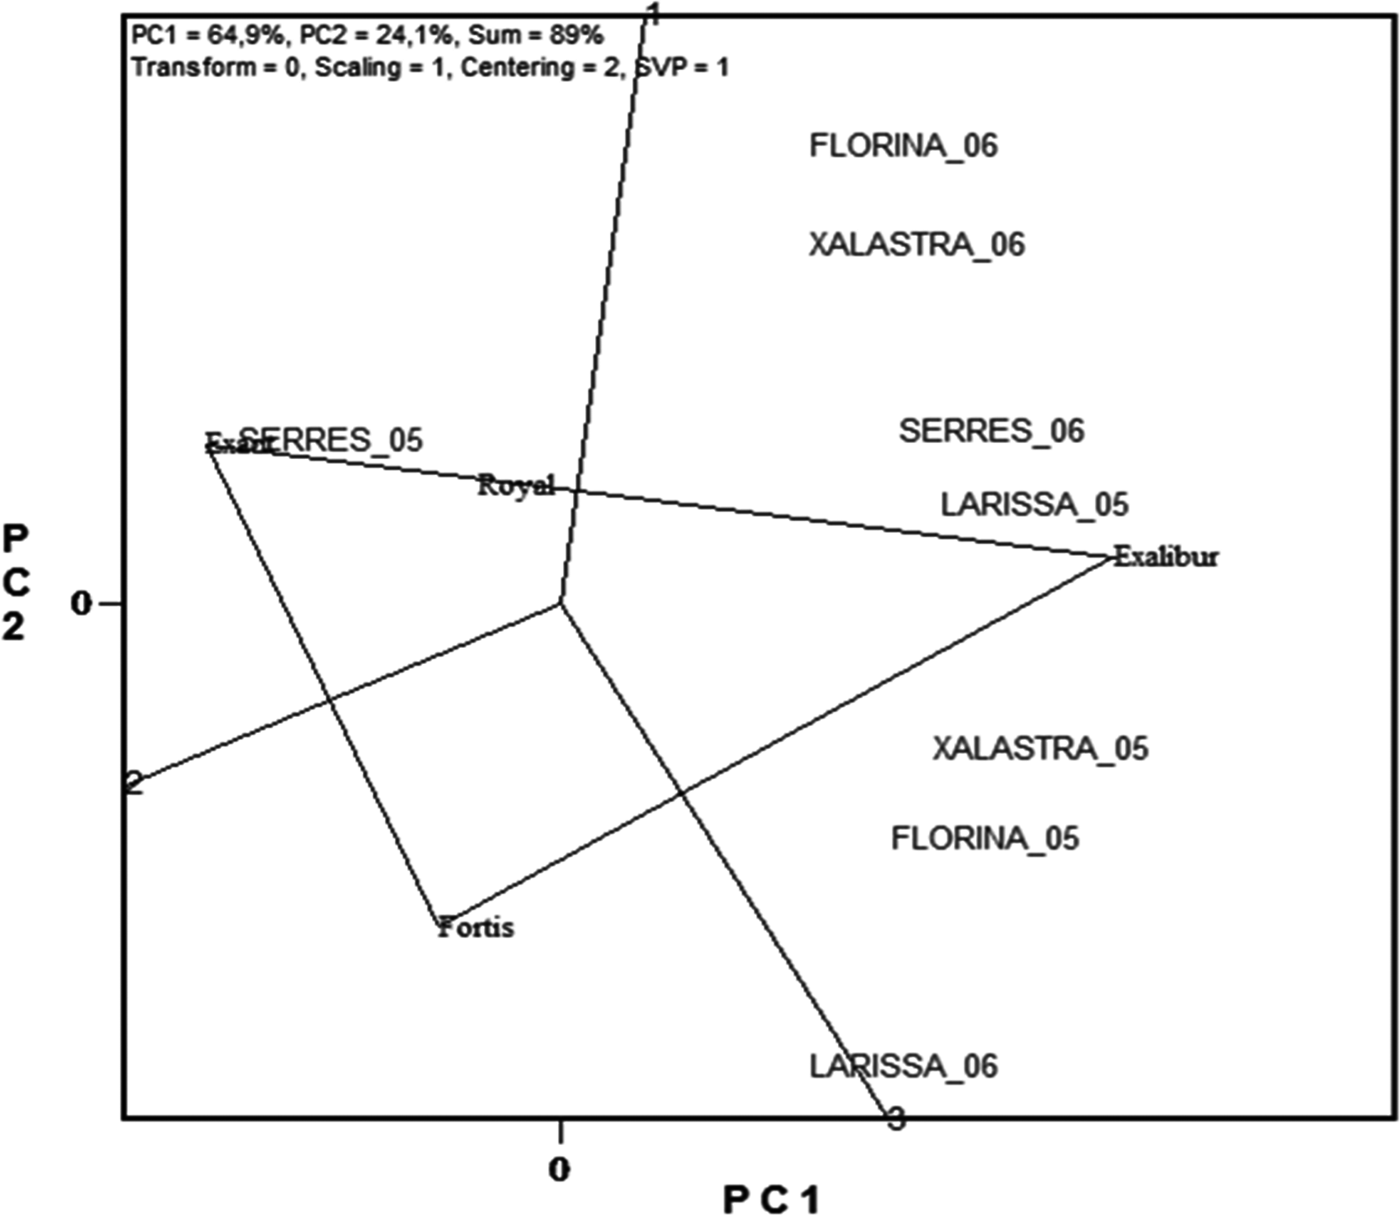
For both seed and oil yield, Xalastra and Florina were grouped together, having the same best-performing cultivars in contrast to the southern-most, less productive and low-quality site, Larissa. Serres was placed at the middle of these two extremes, grouped in 2005 with Larissa and in 2006 with Florina and Xalastra (Fig. 1). The inbred line Fortis had no yield advantage in any trial while Exact seemed to be well adapted at Larissa. Cultivar Excalibur showed a yield advantage at three locations (Xalastra, Serres and Florina), but this was year-dependent. This was also evident for Royal at Xalastra (2006) and Florina (2005). Excalibur had the highest oil content since it was highest at six out of eight trials, exceeded only by Exact at Serres in 2005 and marginally by Fortis at Larissa in 2006 (Fig. 2). The high oil content and yield advantage by 0·04–0·074 of Excalibur compared with the competitors placed it as the best cultivar for oil yield (Fig. 3).
Polygon view of genotype and genotype × environment (GGE) biplot analysis for seed yield (a) and oil yield (b) for the best-performing cultivar across four locations and 2 years.

Polygon view of genotype and genotype × environment (GGE) biplot analysis for seed oil content (Oil) for the best-performing cultivar across four locations and 2 years.

Genotype and genotype × environment (GGE) biplot analysis for the four cultivars based on oil yield and stability, tested across 2 years and four locations. Entries with vertical projections farther right in the one arrow horizontal axis are the highest yielding and the ones with furthest vertical projections up or down on the two arrow (vertical to the horizontal) stability line are considered less stable. E, environment; PC, principal component; SVP, singular value partitioning.

Agronomic traits
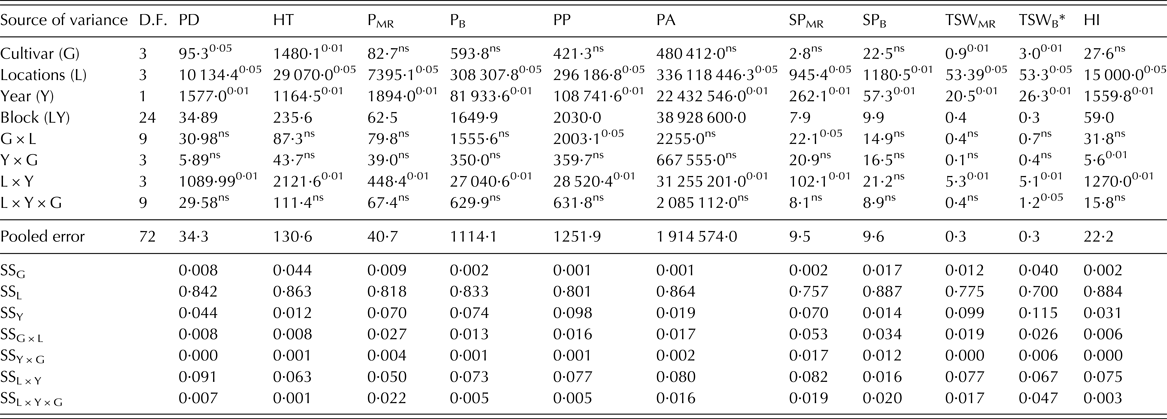
The combined ANOVA revealed that all agronomic traits were affected significantly (at P ⩽ 0·05 or 0·01) by L and Y. Cultivar (G) had a significant effect only on PD (P ⩽ 0·05), plant height (HT; P ⩽ 0·05), TSWMR and TSWB (P ⩽ 0·01). The Y × G interaction was not significant for any trait, while the G × L interaction had a significant effect on PP and SPMR. The L × Y interaction was significant for all traits but SPB in discordance with the triple interaction (L × Y × G), which was found significant only for TSWB (Table 5).
Mean squares analysis of variance (ANOVA) and sum of squares (SS) partitioning regarding the treatment SS (SSTRMT) for the agronomic traits determined

D.F., degrees of freedom; PD, plant density; HT, plant height; PMR, pods on the main raceme; PB, pods on branches; PP, pods/plant; PA, pods/m2; SPMR, seeds/pod on the main raceme; SPB, seeds/pod on the first branch; TSWMR, 1000-seed weight on the main raceme; TSWB, 1000-seed weight on the first branch; HI, harvest index.
Significance level of SS is given as a superscript. ns, non-significant.
* For TSWB, D.F. for locations were two since this trait was not determined in Florina.
Location and the L × Y interaction accounted for most of the variation (up to 0·933 for PD) as revealed by ANOVA. Cultivar accounted for 0·001 of the variation for PP and PA up to 0·044 for HT (Table 5).
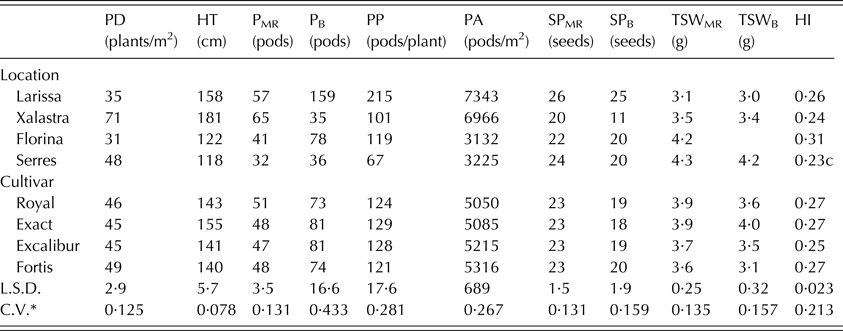
Over G and Y, Xalastra had the highest PD (71 plants/m2) followed by Serres (48 plants/m2), while Larissa and Florina showed very low PD (35 and 31 plants/m2). The inbred line Fortis established the densest stands (49 plants/m2) with cv. Royal (46 plants/m2) ranked second (Table 6). Xalastra had the tallest plants (181 cm), and the southern-most, less productive Larissa was ranked second (158 cm).
Mean comparisons for the agronomic traits determined over the 2 years of experimentation

PD, plant density; HT, plant height; PMR, pods on the main raceme; PB, pods on branches; PP, pods/plant; PA, pods/m2; SPMR, seeds/pod on the main raceme; SPB, seeds/pod on the first branch; TSWMR, 1000-seed weight on the main raceme; TSWB, 1000-seed weight on the first branch; HI, harvest index.
For each trait, means were compared with the least significance test (L.S.D.) at P < 0·05.
* C.V., coefficient of variation.
The tallest plants were those of the hybrid Exact (155 cm). Xalastra also had the highest PMR (65 pods/plant) and the lowest PB (35 pods/plant) along with Serres (36 pods/plant). However, Xalastra had high PA (6966 pods/m2) due to the dense stands. On the contrary, Larissa had the highest PB and PP (159 and 215 pods/plant, respectively) and thus, despite the low-density stands, it showed, along with Xalastra, the highest PA (7343 pods/m2). Larissa also had the highest number of seeds per pod (26 for SPMR and 25 for SPB) but the smallest seeds (3·1 g for TSWMR and 3·0 g for TSWB).
Florina, the location with the longest growth period, and Serres were characterized by short plants (122 and 118 cm, respectively) and low PMR (41 and 32 pods/plant, respectively). Serres had one of the lower PB (36 pods/plant), while Florina showed moderate PB (78 pods/plant) and thus, it ranked second to Larissa regarding PP (119 pods/plant). Both Serres and Florina had the lowest PA (3225 and 3132 pods/plant) with moderate to low seed numbers per pod (SPMR, SPB). However, these two locations had the best seed filling conditions as revealed by the highest TSWMR and TSWB (Table 6). This was translated to the highest HI recorded in Florina (0·31).
Cultivars showed significant differences in seed size with the hybrid Exact to outperform the others in both TSWMR and TSWB (Table 6). On the contrary, the inbred line Fortis had the lowest seed weights (3·6 and 3·1 g, respectively).
Pearson phenotypic correlations between agronomic traits, yield and quality
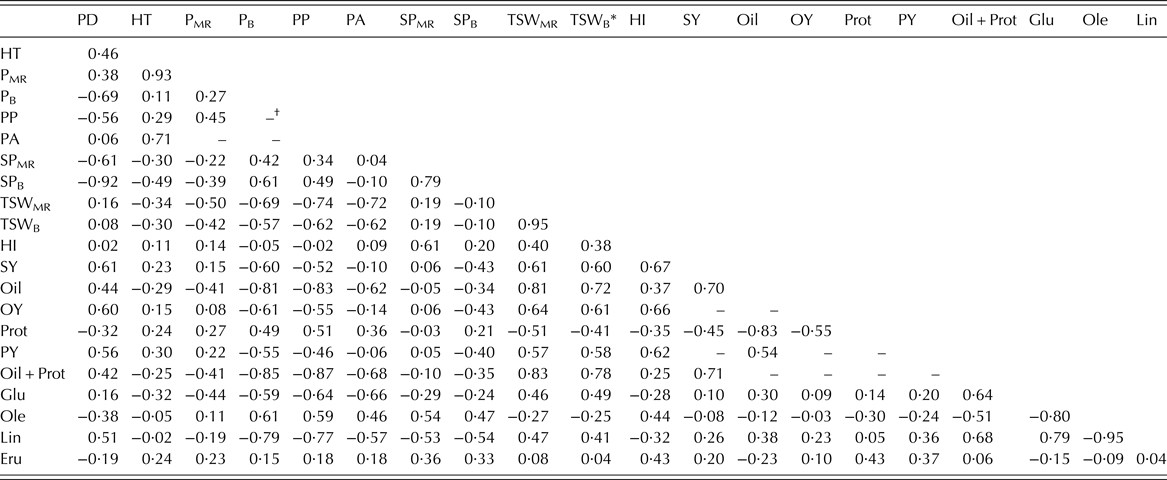
As Table 7 shows, dense stands (PD) resulted in decreased PB and seed number in pods (SPMR and SPB) with the PD–SPB correlation being the strongest (r = −0·92). The effect of PD on HT and PMR was positive but weak (r = 0·46 and r = 0·38, respectively). However, HT was highly and positively correlated to either PMR (r = 0·93) or PA (r = 0·71). A moderate, negative correlation (r = −0·49) associated HT and SPB with the latter being strongly affected by PB and SPMR (r = 0·61 and r = 0·79, respectively) and moderately by PP (r = 0·49). Seed weights (TSWMR and TSWB) were interconnected (r = 0·95) and they were negatively (strongly the TSWMR and moderately the TSWB) correlated to PP and PA (Table 7). The only agronomic trait having a significant effect on HI was SPMR (r = 0·61).
Pearson phenotypic correlation coefficients (r) between agronomic traits, yield and quality for the four oilseed rape cultivars tested across 2 years and four locations (n = 32)

PD, plant density; HT, plant height; PMR, pods on the main raceme; PB, pods on branches; PP, pods/plant; PA, pods/m2; SPMR, seeds/pod on the main raceme; SPB, seeds/pod on the first branch; TSWMR, 1000-seed weight on the main raceme; TSWB, 1000-seed weight on the first branch; HI, harvest index; SY, seed yield; Oil, seed oil content; OY, oil yield; Prot, protein content in meal; PY, protein yield; Oil + Prot, sum of Oil and Prot; Glu, glucosinolates in meal; Ole, oleic acid concentration; Lin, linolenic acid concentration; Eru, erucic acid concentration.
* For TSWB, n = 24 since this trait was not determined in Florina.
† Not estimated to avoid spurious self-correlation.
Yields (seed, oil and protein) were positively affected by PD with seed and oil yields being highly influenced (r = 0·61 and r = 0·60, respectively). Pod number per plant and per area (PP and PA) and especially PB were negatively associated with yield. Seed size (TSWMR and TSWB) and HI were positively correlated to yield (Table 7).
Pod numbers (PB, PP, PA) had also a strong, negative effect on oil, which was also strongly and positively influenced by TSWMR and TSWB (r = 0·81 and r = 0·72, respectively). Protein and oil contents were negatively correlated (r = −0·83) with the former to be positively correlated to PB and PP (r = 0·49 and r = 0·51, respectively) and negatively with TSWMR (r = −0·51). The sum Oil + Prot was negatively affected by pod number (PB, PP, PA) and positively by seed weight (Table 7). Likewise, pod numbers were negatively and strongly correlated to glucosinolates, which also had a positive association with Oil + Prot (r = 0·64) and a weak one with TSWB (r = 0·49). Pod (PB, PP) and seed number (SPMR, SPB) had a positive effect (strong for pods and moderate for seeds) on oleic acid, which was negatively correlated to glucosinolates (r = −0·80). Though erucic acid showed weak, positive correlations with only HI, protein content, protein yield and linolenic acid was associated with many agronomic and quality traits (Table 7). Specifically, linolenic acid showed positive correlations with PD and TSWMR (r = 0·51 and r = 0·47, respectively) and negative ones with pod (PB, PP, PA) and seed numbers (SPMR, SPB) (Table 7). It was also strongly and negatively correlated to oleic acid (r = −0·95) while positive correlations were found with Oil + Prot (r = 0·68) and glucosinolates (r = 0·79).
DISCUSSION
Environment, cultivar and their interaction
In accordance to previous findings, the present results stressed the strong influence environment exerts on rapeseed yield. Yield variation owing to G was as low as 0·001 for seed yield (being generally >0·016 for oil yield and 0·011 for protein yield), a minuscule contribution compared with 0·137 reported from Poland (Nowosad et al. Reference Nowosad, Liersch, Popławska and Bocianowski2016). In the highly diverse pedo-climatic conditions in Greece, the seed yield variation allotted to environment was estimated at 0·925, higher than the reports from Poland and Chile (>0·650); yet the G × E accounted for 0·072, a proportion similar to previous reports (Escobar et al. Reference Escobar, Berti, Matus, Tapia and Johnson2011; Nowosad et al. Reference Nowosad, Liersch, Popławska and Bocianowski2016). Location was the main contributor to the environmental effect on seed yield (0·877). On the other hand, protein yield was affected strongly by both location (0·266) and year (0·112). However, the size of G × E in comparison to G was large for yields (seed and oil yield), indicating that interactions should be considered in the present study and cultivars with specific adaptation could be possibly proposed.
Regarding seed quality traits, protein content was primarily affected by location (0·893), while oil content was affected both by location (0·559) and year (0·213). Cultivar contributed relatively highly to the variation of glucosinolates (0·112) and erucic acid (0·061); G × E accounted for 0·686 of the variation in glucosinolates.
The effect of location on agronomic traits was also high, exceeding 0·800 for PD, HT PMR, PB, PP, PA and HI. PD was also affected by the L × Y interaction. These findings support previous reports on the high variability of yield components in rapeseed with the number of seeds/m2 being the most variable among them (Wang et al. Reference Wang, Mathieu, Cournède, Allirand, Jullien, De Reffye and Zhang2011).
The four locations were grouped to three certain environments as regards seed and oil yields (Fig. 1). The most productive site, Xalastra, was grouped with Florina, which had the longest, coolest and wettest growth season. The high productivity of Xalastra, which is located on clayey soil, was ascribed to the dense stands housing the tallest plants with the highest PMR and consequently high PA; all these factors have been previously found to contribute to rapeseed productivity (Leach et al. Reference Leach, Stevenson, Rainbow and Mullen1999; Momoh & Zhou Reference Momoh and Zhou2001; Angadi et al. Reference Angadi, Cutforth, McConkey and Gan2003). On the contrary, Florina had the lowest PD (ca. 30 plants/m2), rather below the 40 plants/m2, which is considered as the lowest limit for achieving 80% of maximum yield (Van Deynze et al. Reference Van Deynze, McVetty, Scarth and Rimmer1992). The low PD was the combined effect of late sowing and overwintering losses of rapeseed grown at the harshest environment with mean temperature ca. 0 °C in January. However, the seed yield was moderate, indicating the crop's ability to compensate for low densities due to its non-determinate growth and plasticity. This yield compensation is achievable only under favourable growing conditions (Morrison et al. Reference Morrison, McVetty and Scarth1990a , Reference Morrison, McVetty and Scarth b ); a condition met at Florina (high rainfall and low temperature during the long reproductive phase).
The southern-most site, Larissa, with a short, stressful growth season, had low seed yield (1·79 t/ha) and very low oil content (33·7%), typical of growing rapeseed under high temperatures and dry conditions (Shafii et al. Reference Shafii, Mahler, Price and Auld1992; Champolivier & Merrien Reference Champolivier and Merrien1996; Lamb & Johnson Reference Lamb and Johnson2004; Tesfamariam et al. Reference Tesfamariam, Annadale and Steyn2010). At this location, plants were tall with high PB and consequently high PA. Pods had numerous seeds, but seed filling was poor due to the adverse environmental conditions during pod filling and the competition between the numerous reproductive organs (Morrison & Stewart Reference Morrison and Stewart2002; Wang et al. Reference Wang, Mathieu, Cournède, Allirand, Jullien, De Reffye and Zhang2011). Those conditions led Larissa to show the lowest seed weight (TSWMR and TSWB) and oil content among locations. Such an association between seed weight and oil content has already been reported (Yaniv et al. Reference Yaniv, Schafferman and Zur1995; Shirani Rad et al. Reference Shirani Rad, Shashavari and Jais2012), but was contrary to Labra et al. (Reference Labra, Struik, Evers and Calderini2017) who reported that seed weight did not compromise oil content. At Larissa, rapeseed showed low PD, possibly as a result of poor establishment due to inadequate soil moisture at seeding despite the delayed sowing date (Unger Reference Unger2001). The high protein content, erucic and oleic acid concentrations but low linolenic acid were indicative of the stressful thermal and water conditions (Bouchereau et al. Reference Bouchereau, Clossais-Besnard, Bensaoud, Leport and Renard1996; Pritchard et al. Reference Pritchard, Eagles, Norton, Salisbury and Nicolas2000; Werteker et al. Reference Werteker, Lorenz, Johannes, Berghofer and Findlay2010). Larissa, encompassing light-textured soil, short growing season, high temperature and low rainfall during reproduction, pays high yield and quality penalties due to delayed sowing and thus, rapeseed production is risky there (Robertson & Holland Reference Robertson and Holland2004; Farré et al. Reference Farré, Robertson and Asseng2007). This risk is expected to increase in the years to come due to imminent climate change (Tuck et al. Reference Tuck, Glendining, Smith, House and Wattenbach2006). However, Exact, the tallest cultivar with the largest seeds, seemed to overcome the local adversities being adapted to the conditions at Larissa (Fig. 1).
The northern-most location, Serres, was placed at the middle of the two extremes (Larissa and Xalastra-Florina). It had the highest oil content and Oil + Prot but the lowest protein content, while it ranked second to Xalastra regarding yields. This was despite plants being shortest and having the lowest pod number (PMR, PB), resulting in low PP and PA. The lower pod numbers (SPMR, SPB) were counterbalanced by better seed filling, which translated to larger seeds and consequently to higher oil content (Gomez & Miralles Reference Gomez and Miralles2011; Shirani Rad et al. Reference Shirani Rad, Shashavari and Jais2012).
Both geneticists and agronomists aim at breeding and identifying ‘ideal’ cultivars in terms of achieving high yields across various environments. Often, this is a hard target to attain. The cultivar Exact in Larissa's environment is an example of specific cultivar adaptation. As of its outperformance for oil content in six out of eight trials, Excalibur emerged as the best cultivar for oil yield (high and stable oil yield across the trials). This adds to the findings of Del Gatto et al. (Reference Del Gatto, Melilli, Raccuia, Pieri, Mangoni, Pacifico, Signor, Duca, Pedretti and Mengarelli2015) who reported that cv. Excalibur was among the outperforming cultivars in central and southern Italy. It is noteworthy that the inbred line, Fortis, was not the best in any trial, possibly indicating the inferiority of open pollinated cultivars compared with hybrids (Brandt et al. Reference Brandt, Malhi, Ulrich, Lafond, Kutcher and Johnston2007; Gehringer et al. Reference Gehringer, Snowdon, Spiller, Basunanda and Friedt2007). Inbred lines compared with hybrids require denser stands to maximize yield and for this reason seeding rate of hybrids are generally lower compared with those of conventional cultivars (Roques & Berry Reference Roques and Berry2016), but this was not the case in the present study. Over Y and L, the inbred line Fortis established the densest stands (49 plants/m2) with the shortest plants (140 cm), which produced the smallest seeds (low SPMR and SPB), with low oil content (38·9%) and glucosinolates (20·80 µmol/g). On the contrary, it had the highest oleic (65·5%) and erucic acid concentrations (2·9%).
Relationships between agronomic traits, yield and quality
Across trials, yield, especially seed and oil yields, were determined by PD in accordance with previous work under various environments and growth conditions (Leach et al. Reference Leach, Stevenson, Rainbow and Mullen1999; Diepenbrock Reference Diepenbrock2000; Momoh & Zhou Reference Momoh and Zhou2001; Ozer Reference Ozer2003; Sidlauskas & Bernotas Reference Sidlauskas and Bernotas2003). In contrast to spring rapeseed (Ozer Reference Ozer2003), denser stands had taller plants with lower number of pods and seeds per pod. HT has been associated with pod-bearing branches in rapeseed, and both are the determinants of crop architecture (Li et al. Reference Li, Chen, Xu, Gao, Yan, Qiao, Li, Li, Li, Xiao, Zhang, Nishio and Wu2016). However, HT was not related to PB but showed a strong correlation with PMR and PA. Moreover, taller plants failed to properly supply assimilates to branches leading to low SPB. The present work did not confirm the correlation of seed yield with HT previously reported under semi-arid conditions (Gunasekera et al. Reference Gunasekera, Martin, Siddique and Walton2006; Shirani Rad et al. Reference Shirani Rad, Shashavari and Jais2012).
Pod number per plant and/or per area have been previously reported as determinants of seed yield (Asare & Scarisbrick Reference Asare and Scarisbrick1995; Diepenbrock Reference Diepenbrock2000; Angadi et al. Reference Angadi, Cutforth, McConkey and Gan2003; Berry & Spink Reference Berry and Spink2006), a finding not confirmed by the current results. On the contrary, yields (seed, oil and protein yields) were negatively correlated with PB and PP, a relationship driven by the high PB recorded in the southern-most, low-yielding site, Larissa. In commercial fields in Central Macedonia (the wider area of Xalastra and Serres), seed yield was found to correlate strongly with the total number of pods and mainly with PB (Gaki et al. Reference Gaki, Tsialtas, Papakosta and Polidoros2012).
Apart from PD, yields were associated with HI in line with previous findings in semi-arid environments (Niknam et al. Reference Niknam, Ma and Turner2003; Gunasekera et al. Reference Gunasekera, Martin, Siddique and Walton2006; Shirani Rad et al. Reference Shirani Rad, Shashavari and Jais2012). According to Diepenbrock (Reference Diepenbrock2000), low HI constitutes a yield restrictor and is identified as a key breeding target. In the present work, its positive association with SPMR indicated that the prevailing conditions during pod filling and the availability of photo-assimilates determined the biomass allocation and finally yield (Wang et al. Reference Wang, Mathieu, Cournède, Allirand, Jullien, De Reffye and Zhang2011).
Seed size (TSWMR, TSWB) was also a factor related positively to yield in accordance with previous work (Asare & Scarisbrick Reference Asare and Scarisbrick1995; Gunasekera et al. Reference Gunasekera, Martin, Siddique and Walton2006; Dehghani et al. Reference Dehghani, Omidi and Sabaghnia2008; Shirani Rad et al. Reference Shirani Rad, Shashavari and Jais2012); the heavier the seeds, the higher the oil content. This association was also found by Shirani Rad et al. (Reference Shirani Rad, Shashavari and Jais2012) under semi-arid conditions in Iran but not by Dehghani et al. (Reference Dehghani, Omidi and Sabaghnia2008). Fortescue & Turner (Reference Fortescue and Turner2007) manipulated source-sink ratio to regulate seed size and concluded that seed size had a small effect on seed oil accumulation. In the current work, the association of these two traits is possibly indirect deriving from the fact that both are strongly influenced by the available photosynthate supply to support growth and oil accumulation in seeds. This is underpinned by the positive correlation between oil content and seed yield in accordance with Robertson & Holland (Reference Robertson and Holland2004).
A strong, negative correlation was evident between oil and protein content, as has already been reported for various growth conditions (Champolivier & Merrien Reference Champolivier and Merrien1996; Pritchard et al. Reference Pritchard, Eagles, Norton, Salisbury and Nicolas2000; Zhao et al. Reference Zhao, Becker, Zhang, Zhang and Ecke2006). The sum of oil and protein contents is ca. 60% and the factors that favour oil accumulation have a negative impact on protein content and vice versa. In general, higher oil contents are related with lower levels of thermal and drought stress across Y and L (Champolivier & Merrien Reference Champolivier and Merrien1996; Pritchard et al. Reference Pritchard, Eagles, Norton, Salisbury and Nicolas2000).
The large seeds but not the high pod numbers (PMR, PB, PP, PA) seemed to favour the glucosinolate accumulation, a secondary metabolite with high importance for rapeseed meal inclusion in livestock feed. Increased glucosinolates are related to high soil N and S concentrations, water stress and high temperatures (Bouchereau et al. Reference Bouchereau, Clossais-Besnard, Bensaoud, Leport and Renard1996). In accordance with Pritchard et al. (Reference Pritchard, Eagles, Norton, Salisbury and Nicolas2000), oleic acid was negatively correlated to linolenic acid. This is an expected correlation since high linolenic acid is associated with high rainfall and cooler temperatures, conditions affecting oleic acid adversely (Pritchard et al. Reference Pritchard, Eagles, Norton, Salisbury and Nicolas2000; Werteker et al. Reference Werteker, Lorenz, Johannes, Berghofer and Findlay2010; Baux et al. Reference Baux, Colbach, Allirand, Jullien, Ney and Pellet2013). In the present work, the same conditions seemed to favour glucosinolate accumulation since a strong, positive correlation between glucosinolates and linolenic acid was evident. Finally, erucic acid was correlated to protein content, which was highest at Larissa with the most stressful conditions.
In summary, under the diverse pedo-climatic conditions studied, yields (seed and oil yields), seed quality and agronomic traits were greatly affected by location and to a lesser degree by year and G × E. However, the size of G × E in comparison to G was large for yield, indicating the need for selecting cultivars with specific adaptation. Rapeseed can be a risky crop with low yields and oil content when grown below 40°N, due to high temperatures and low rainfall during reproduction along with the short growing season. High yields were related to dense stands, large seeds and high HI. The highest oil content was attained at the northern-most location and it was associated with large seeds. The southern-most, low-yielding location had the highest protein content, oleic and erucic acid concentrations. Milder temperatures during reproduction resulted in high oil content along with high linolenic acid and glucosinolates.
The authors thank Syngenta Hellas SA, Anthoussa Attikis, Greece and BIOS AGROSYSTEMS SA, Sindos, Greece for providing the seeds for the experimentation. The authors are grateful to Mr Κ. Oikonomides, Syngenta Hellas SA for his contribution to seed quality determinations.