I. INTRODUCTION
There have been a number of applications of transparent conducting oxides (TCOs) within the fields of electrical devices, displays, and solar cell fabrication reported in recent years.Reference Zhang, Zhu, Liu, Liu and Ramakrishna1, Reference Vaufrey, Ben Khalifa, Besland, Sandu, Blanchin, Teodorescu, Roger and Tardy2 TCOs generally require high optical transmittance and electrical conductivity for use in commercial applications. Therefore, indium tin oxide (ITO) is typically used for TCO applications due to its excellent transmittance and electrical conductivity.Reference Wager, Keszler and Presley3 However, the use of ITO introduces problems such as high cost due to the rarity of indium, expensive deposition techniques, environmental pollution, and the instability of indium in hydrogen plasma.Reference Kim, Horowitz, Kim, Makinen, Kafafi and Chrisey4, Reference Minami, Nanto and Takata5 Because of these disadvantages, tin dioxide (SnO2) and zinc oxide (ZnO) have been actively explored as promising alternative materials to ITO. In particular, SnO2, which is an n-type, wide band-gap semiconductor (E g = 3.6–3.97 eV), has attracted attention for applications involving transparent electrodes, solar cells, and gas sensors because it is nontoxic, inexpensive, highly abundant, and stable in hydrogen plasma relative to ITO.Reference Wager, Keszler and Presley3, Reference Fan and Reid6, Reference Tiburcio-Silver and Sanchez-Juarez7 However, because of the low conductivity of SnO2 compared to ITO, doping and hybridization with metallic nanoparticles have also been investigated.Reference Zhi, Zhao, Zhu and Li8
Metallic nanoparticles hold promise for use in advanced materials with new electronic, magnetic, optic, and thermal properties.Reference Volokitin, Sinzig, De Jongh, Schmid, Vargaftik and Moiseev9–Reference Pileni11 In particular, platinum (Pt) nanoparticles have been widely used in the electronics industry for the manufacture of conductive thick film circuits and internal electrodes in multilayer ceramic capacitors. Furthermore, it has been reported that the incorporation of nanoparticles imparts unique electrical and optical properties to composite materials compared with pristine matrix materials.Reference Kreibig and Vollmer12, Reference Stepanov, Hole and Pandalai13
There have been many reports of the formation of Pt-doped SnO2 thin films using chemical vapor deposition (CVD),Reference Houlton, Jones, Haycock, Williams, Bull and Critchlow14, Reference Amjoud and Maury15 sputtering,Reference Kim, Lee, Moon and Lee16, Reference Ivanov, Llobet, Vilanova, Brezmes, Hubalek and Correig17 and sol-gel methods,Reference D’Arienzo, Armelao, Cacciamani, Mari, Polizzi, Ruffo, Scotti, Testino, Wahba and Morazzoni18–Reference Tadeev, Delabouglise and Labeau20 but they are primarily concerned with applying to gas sensors. In these studies, Pt was shown to enhance the sensitivity and responsivity of SnO2 thin films due to its catalytic effects. The most common deposition method for SnO2 thin films is CVD or sputtering, because the dry-deposition process always produces better functional properties of the films than the wet-deposition process. However, the solution deposition technique is simple and inexpensive, as there is no need for expensive target materials or equipment, and it can be easily adapted to accommodate the introduction of additives like metallic nanoparticles for property enhancement.Reference Pierre21 But in the case of Pt-doping, the chemical doping state of Pt is normally dependent on the process condition, either ionic stateReference D’Arienzo, Armelao, Cacciamani, Mari, Polizzi, Ruffo, Scotti, Testino, Wahba and Morazzoni18 or Pt metallic agglomerate.Reference Tadeev, Delabouglise and Labeau20 In this experiment, to investigate the effects of introducing Pt nanoparticles into SnO2 thin films, we first prepared Pt nanoparticles and then incorporated them into SnO2 precursor solution. We were able to adapt direct-patterning for Pt-containing SnO2 thin films by using photosensitive solution precursors for photochemical metal-organic deposition (PMOD).
PMOD can be used in the patterning of thin films with photosensitive precursors in solution deposition techniques. After the deposition of films, patterning is conventionally performed using a dry etching process. However, conventional dry etching can result in physical and chemical damage to the target film surface due to the actions of the reactive free radicals and ions in the plasma.Reference Lee, Kim, Chung and Desu22 With PMOD, undesirable etching damage can be minimized because PMOD-based lithography can produce a patterned structure without using photoresist or dry etching.Reference Choi, Park, Kim, Park, Chang and Jeon23, Reference Park, Jung, Park, Kim and Hill24 After lithographic exposure, film development can readily be performed by rinsing in a solvent to remove the unexposed part of the coated film, leaving a patterned structure.
In this article, we describe the fabrication of direct-patternable SnO2 nanocomposite films containing Pt nanoparticles by the solution deposition processing method, PMOD. We synthesized Pt nanoparticles using a methanol reduction method and incorporated various contents of Pt nanoparticles into the photosensitive SnO2 solution to enhance the electrical properties of the SnO2 film while maintaining good optical transmittance. To overcome the disadvantages of dry etching for the fabrication of fine patterns for solid geometric devices, we carried out a direct-patterning process using a photosensitive precursor and ultraviolet (UV) light by PMOD.
II. EXPERIMENTAL PROCEDURES
We used tin 2-ethylhexanoate, Sn(O2CCH(C2H5)C4H9)2, as a photosensitive precursor for the production of SnO2 films. The solvent and sol stabilizer were 4-methyl-2-pentanone and monoethanolamine, respectively. Tin 2-ethylhexanoate was dissolved in 4-methyl-2-pentanone at 0.3 M, and monoethanolamine was added for stabilization at a molar ratio of 1.0. The dissolved photosensitive solution was stirred at room temperature for 5 h.
Pt nanoparticles with an average diameter of 3 nm were synthesized according to a previously described protocol.Reference Teranishi, Hosoe, Tanaka and Miyake25 Hexachloroplatinic acid hexahydrate (H2PtCl6·6H2O, Sigma-Aldrich Inc., St. Louis, MO) was used as received. Poly(N-vinyl-2-pyrrolidone) [PVP, average molecular weight (M w) of 55,000, Sigma-Aldrich Inc.] was used as a standard protective polymer for the Pt nanoparticles. Methanol of 99.8% purity was used without further purification.
Transmission electron microscopy (TEM: JEOL JEM-2100F, Tokyo, Japan) and energy dispersive spectroscopy (EDS) were used to observe the presence of Pt nanoparticles in the SnO2 matrix. The solution was mixed and spin coated on glass substrate using a Fusion 1737 (Samsung Corning Precision Materials Co., Seoul, Korea) at 2000 rpm for 20 s. For direct patterning of the film, the spin-coated film was exposed to UV light (1000 W mercury lamp, λmax = 365 nm). Then, the film was washed with 4-methyl-2-pentanone to develop the unexposed areas of the film. For crystallization, the direct-patterned thin films were heated at 300 °C in a tube furnace under oxygen atmosphere for 10 min, and then the heated films were annealed at 600 °C in a tube furnace under nitrogen atmosphere for 1 h. The final thickness of the nanocomposite films was measured using an ellipsometer; the thickness of the films was determined within a range of 78–85 nm.
Crystallinity was analyzed using an x-ray diffraction (XRD) beam line 10B at Pohang Light Source (PLS, Pohang, Korea) with λ = 1.5409 Å, E = 8.04621 keV. The sheet resistance of the films was measured using a four-point probe (CMT-SR2000N, Changmin Tech Co., Seongnam, Korea). Optical transmittance measurements were carried out using an ultraviolet–visible–near infrared (UV–vis–NIR) spectrophotometer (V-570, JASCO, Tokyo, Japan), and images of the direct-patterned films were obtained using an optical microscope. Photoemission spectroscopy (PES) using the 4B1 beam line at PLS was used to confirm the presence of Pt nanoparticles in the SnO2 matrix. Au foil was used as a reference material to calibrate the kinetic energy shift.
III. RESULTS AND DISCUSSION
A. Synthesis of Pt nanoparticles
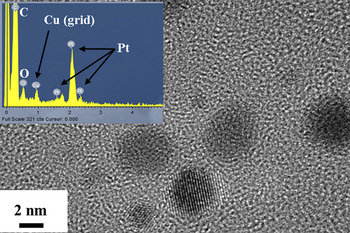
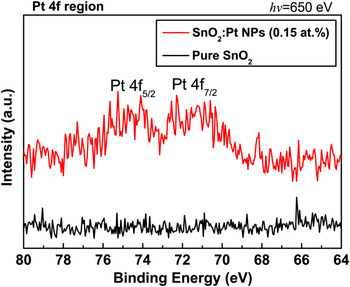
We were able to synthesize Pt nanoparticles with average size of 3 nm by an ion-reduction method with protection by PVP. Details of the synthesis procedure and mechanism have been previously described.Reference Choi, Park, Golledge, Johnson, Chang and Jeon26 To confirm the synthesis of Pt nanoparticles, TEM and EDS analyses of Pt nanoparticles on a carbon-coated cupper grid were conducted as shown in Fig. 1. Pt nanoparticles about 3 nm in size were observed, and the observation of L series Pt peaks in the EDS results also confirmed the synthesis of Pt nanoparticles. To confirm the existence of Pt nanoparticles in the SnO2 matrix, PES analyses with Pt 4f region of pure SnO2 and SnO2:Pt (0.15 at.%) nanocomposite films were performed (see Fig. 2). The SnO2:Pt (0.15 at.%) nanocomposite film, which was treated as a representative sample in this article, showed a spin–orbital coupling of Pt 4f in the metallic bonding states: Pt 4f7/2 and Pt 4f5/2.
Transmission electron microscopy image of Pt nanoparticles on carbon-coated copper grid; inset is the energy dispersive spectroscopy spectrum of the selected region (red dotted circle in the image).

The photoemission spectroscopy spectra of pure SnO2 and SnO2:Pt (0.15 at.%) nanocomposite film in the Pt 4f region.

B. Structural properties
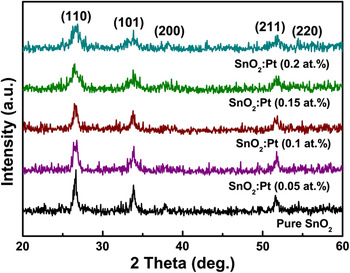
Figure 3 shows the XRD patterns of SnO2 thin films with and without Pt nanoparticles annealed at 600 °C in a nitrogen atmosphere for 1 h after heating at 300 °C in an oxygen atmosphere. All films presented the cassiterite phase with a tetragonal rutile structure. The positions of the diffraction peaks for the SnO2 nanocomposite films were exactly the same as those of pure SnO2. Therefore, it was confirmed that the incorporated Pt nanoparticles were not dissolved directly into the SnO2 structure. However, diffraction peak broadening was observed with increasing Pt nanoparticle content, and the grain sizes of the films were calculated with (110) diffraction peaks using the Debye–Scherrer equationReference Cullity and Stock27 (Table I). As expected, the grain sizes of the films decreased as the Pt nanoparticle content increased. In general, PVP starts to decompose at about 380 °C (pure PVP), whereas decomposition occurs at 350 °C in PVP-coated Pt nanoparticlesReference Du, Yang, Mou, Hua and Jiang28 and SnO2 films start to crystallize with a cassiterite phase after annealing above 400 °C. Therefore, at 600 °C, PVP-covered Pt nanoparticles in the SnO2 films could constrain the growth of crystalline SnO2.Reference Labeau, Gautheron, Cellier, Vallet-Regi, Garcia and Calbet29 Through the above observation results, we believe that incorporation of Pt nanoparticles into SnO2 matrix does not involve the atomic substitution of Sn and O with Pt.
X-ray diffraction patterns of SnO2 with and without Pt nanoparticles.

Crystallite size, thickness (t), sheet resistance (R S), resistivity (ρ), conductivity (σ), and figure of merit (FOM).

C. Optical properties
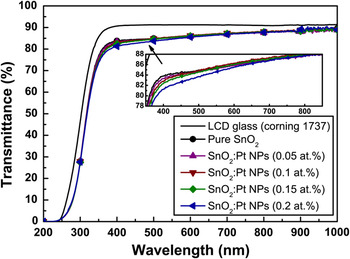
Figure 4 shows the optical transmittance of SnO2:Pt nanocomposite films after annealing at 600 °C. The average transmittance values in the visible region (from 380 to 780 nm) of the SnO2 films with 0, 0.05, 0.1, 0.15, and 0.2 at.% Pt nanoparticles were 85.70, 85.50, 85.75, 86.61, and 84.81%, respectively. Under our experimental conditions, the optical transmittance of the SnO2 films degraded slightly with the incorporation of Pt nanoparticles in the range from 380 to 480 nm. This result could be explained by facile electron transition to absorb the photon energy in the short wavelength region according to an increase in the Pt nanoparticle amount in the SnO2 matrix.Reference Qu, Song, Liu, Wang, Gao, Liu, Zhang, Li and Zhu30 However, the effect is not significant when using the SnO2 nanocomposite films in a transparent electrode because the average transmittance values were always greater than 85%.Reference Kryshtab, Palacios Gómez and Mazin31
The transmittance of SnO2 with and without Pt nanoparticles.

The absorption coefficient was calculated using Lambert’s formula,

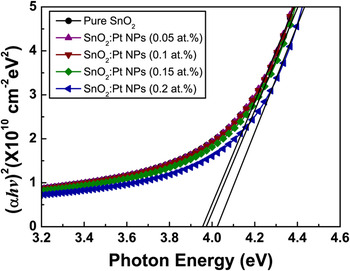
where T r and t are the transmittance and film thickness, respectively.Reference Tan, Chen, Sun, Fan, Kwok, Zhang and Chua32 The direct band gaps of pure SnO2 and SnO2 with 0.05, 0.1, 0.15, and 0.2 at.% Pt nanoparticles were estimated from the (αhv)2 versus hv (Tauc relation) plot by extrapolating the linear fit given to the linear region to α = 0 (Fig. 5). The estimated optical band gap values were almost the same as the value of 3.95 eV for pure SnO2 and SnO2:Pt 0.05, 0.1 at.%, 3.97 eV for SnO2:Pt 0.15 at.%, and 4.03 eV for SnO2:Pt 0.2 at.%. The absorption edge shift was slightly increased with increasing amounts of Pt nanoparticles. In the case of pure SnO2 film, the direct optical band gap, which is widely known to be of direct transition, varied from 3.87 to 4.45 eV.Reference Spence33 This increase in the optical band gap is normally explained by the Burstein–Moss effect.Reference Burstein34, Reference Moss35 The increases in the optical band gap and the charge-carrier (electron) density of the SnO2:Pt (0.15 and 0.2 at.%) nanocomposite films could influence the electrical properties of the films.
The plot for the evaluated optical band gap of SnO2 with and without Pt nanoparticles.

D. Electrical properties
The sheet resistance was measured using a four-point probe. The resistivity and conductivity values were calculated based on the results of the sheet resistance measurement and are summarized in Table I. Under our experimental conditions, the lowest sheet resistance (1.74 kΩ/□) and resistivity (1.36 × 10⁻² Ω·cm) were obtained for SnO2:0.15 at.% Pt nanocomposite film, and the resistivity values were calculated by converting the sheet resistance to the resistivity by simple multiplication of the sheet resistance and the thickness of the film. These results were comparable to the reported sheet resistance values of ∼0.1 kΩ/□ for SnO2 films deposited at 600 °C by conventional metal-organic CVD (Ansari et al.Reference Ansari, Dar, Dhage, Kim, Ansari, Al-Hajry and Shin36) and ∼1 kΩ/□ for SnO2 films deposited temperatures higher than 400 °C by plasma-enhanced CVD (Liu et al.Reference Liu, Chen and Sun37).
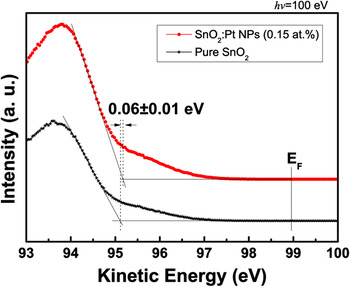
To investigate the incorporation effects of 0.15 at.% Pt nanoparticles, the valence bands spectra were analyzed as shown in Fig. 6. The Fermi energy (E F) of each film was the same as that indicated by the onset energy of the intensity.Reference Itoh, Iwamoto, Burghard and Roth38 The valence band maximum (E VBM) of SnO2 film with incorporated Pt nanoparticles was 0.06 ± 0.01 eV higher than that of pure SnO2 film due to an increase in electron density of the SnO2 from Pt nanoparticles. This result agrees with the Burstein–Moss shift caused by the increase of optical band gap. SnO2:Pt (0.2 at.%) film did not show the lowest resistivity value, although it had the highest optical band gap and valence band maximum. In the case of SnO2 films embedded with Pt nanoparticles, the resistivity values decreased up to 0.15 at.% Pt contents due to an increase in carrier concentration from the introduction of Pt nanoparticles despite the fact that the grain sizes were slightly decreased according to the increase of Pt contents. However, the grain size was significantly decreased when the Pt content was 0.2 at.% in the SnO2 film, and then the resistivity was increased to 2.70 × 10⁻² Ω·cm due to a low mobility from the smallest grain size of about 8 nm and an induced electron scattering by the increase in carrier concentration.Reference Gupta and Tyagi39 These results might suggest that the grain size effect on the electron mobility was dominated in 0.2 at.% Pt-incorporated SnO2 film.
The valence band spectra of SnO2 with and without Pt nanoparticles.

From these above results, we can suggest the most effective concentration to enhance the balance between the mobility and electron concentrations with sufficient oxygen deficiency and injection of charge carriers from the surface plasmon phenomenon offered by Pt nanoparticles.
E. Direct-patterning of SnO2:Pt nanocomposite films and their figure of merit
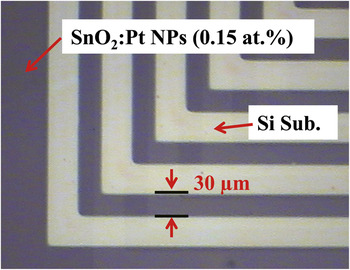
We successfully demonstrated a direct patterned SnO2:0.15 at.% Pt nanocomposite film after annealing at 600 °C for 1 h, as shown in Fig. 7. The direct patterning process was performed by removing the area that was not exposed to UV light by rinsing with solvent after exposure of the films through a photomask for 10 min. In the optical micrograph, the dark area indicates the SnO2 film region containing 0.15 at.% Pt nanoparticles, and the relatively bright area corresponds to the Si substrate. As shown in the line patterned region, micron-size direct-patterning was well defined by lithographic patterning using PMOD. For our experimental conditions, we established that UV exposure of only 10 min was enough for the fabrication of direct-patterned SnO2 films with Pt nanoparticles. Because of the formation of a cross-linked network of SnO2 after exposure to UV light, the exposed region of the film was no longer in a fluid state (spin-coated wet state), and it was not removed by dissolution in successive solvent rinsing steps.
Optical image of direct-patterned SnO2:Pt (0.15 at.%) nanocomposite film.

Furthermore, the figure of merit is an important evaluating factor in TCO applications for electronic devices such as thin film solar cells. To compare the performances of various transparent electrodes, the most commonly used figure of merit, as first defined by Haacke,Reference Haacke40 is

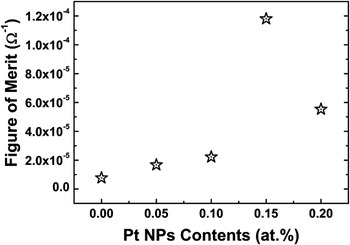
where T r is the transmittance at λ=550 nm (the wave length at which solar power conversion is maximized) and R s is the sheet resistance. The evaluated value of figure of merit (φ) as a function of Pt nanoparticle content was plotted and is shown in Fig. 8, and summarized in Table I. The highest figure of merit in this work was 1.18 × 10⁻⁴ Ω−1 for the representative sample, SnO2:Pt (0.15 at.%) nanocomposite film, and this value was less than that of fluorine-doped SnO2 (FTO: 2.5 × 10⁻⁴ Ω−1)Reference Thangaraju41 by an order of magnitude.
Figure of merit plot for SnO2 with and without Pt nanoparticles.

IV. CONCLUSIONS
We successfully fabricated direct-patterned SnO2:Pt nanoparticle composite films by PMOD at 30-μm scale using photosensitive precursors and reported the changes in the electrical properties of the films for various annealing temperatures without observing changes in the optical transmittance of the films. Direct patterning of SnO2 films embedded with Pt nanoparticles was accomplished after UV exposure for 10 min and removal of the unexposed area of the films by rinsing with solvent. The sizes of the Pt nanoparticles, which were synthesized by a methanol reduction method, were restricted to an average of 3 nm. The average transmittance value of the SnO2 nanocomposite films in the visible region was 85%. The resistance and resistivity values decreased as the Pt nanoparticle content increased from 0 to 0.15 at.% and increased slightly in the case of the SnO2 film with 0.2 at.% Pt nanoparticles. The resistivity values of the SnO2 films with Pt nanoparticles were about one order of magnitude smaller than those of pure SnO2 films. Our results demonstrate the possibility of direct patterning of SnO2:Pt nanocomposite films with enhanced electrical properties while maintaining good optical transmittance. Such films can effectively be applied to fabricate micropatterned systems such as transparent electrodes for electronic devices through a simple solution-based process, PMOD. We also evaluated the figures of merit for direct-patternable SnO2:Pt nanocomposite films, and the highest value was 1.18 × 10⁻⁴ Ω−1 for SnO2 film with 0.15 at.% Pt nanoparticles. Based on the results of this study, we suggest that direct-patternable SnO2 films with Pt nanoparticles have potential for use in transparent electrodes in electrical devices without requiring expensive and toxic processes such as dry etching.
ACKNOWLEDGMENTS
This research was supported by Future-based Technology Development Program (Nano Fields) through the National Research Foundation of Korea (NRF) funded by the Ministry of Education, Science and Technology (2009-0082604). Experiments at PLS (Pohang Light Source) were supported by MEST and POSTECH.