

Introduction
Bees play a significant role in the pollination of wild and cultivated crops in natural and agricultural ecosystems. Bee/pollinator declines in Europe and North America have been attributed to habitat loss and fragmentation, pesticide use, the impact of non-native invasive species, competition with managed populations of bees, climate change, pathogen spread and heavy metal pollution (Munyuli, 2010). In Uganda, economic value attributable to pollination services delivered by bees to the crop production sector is estimated to be 0.53 billion US$ per year (Munyuli, 2010; Munyuli, Reference Munyuli2011e). However, the current status of wild bees in sub-Saharan Africa is not well known and needs to be documented. Therefore, it is important to monitor bee communities (Munyuli, 2010; Moron et al., Reference Moron, Grzes, Skórka, Szentgyörgyi, Laskowski, Potts and Woyciechowski2012) and evaluate the effectiveness of different monitoring methods in this region.
Since the status of bees in Africa is not well known, it is important to develop methods to monitor bees. These methods may help in preventing future declines in bee populations. Adequate monitoring plans are needed to assess the status of bee populations. Several bee sampling methods have been developed and are used in different countries of the world (Inoue and Endo, Reference Inoue and Endo2006; Campbell and Hanula, Reference Campbell and Hanula2007; Souza and Campos, Reference Souza and Campos2008; Obrist and Duelli, Reference Obrist and Duelli2010), particularly in temperate regions (Westphal et al., Reference Westphal, Bommarco, Carré, Lamborn, Morison, Petanidou, Potts, Roberts, Szentgyörgyi, Tscheulin, Vaissière, Woyciechowski, Biesmeijer, Kunin, Settele and Steffan-Dewenter2008; Wilson et al., Reference Wilson, Messinger and Griswold2009). The methods include trap nests, pan-trapping, hand-netting and visual counts along line transects or within quadrats. Pan-trapping is more effective than hand-netting and line-transect-count sampling in temperate regions (Potts et al., Reference Potts, Kevan, Boone, Dafni and Kevan2005; Munyuli, 2010). Characteristics of the trap may influence its effectiveness or bias results (Gollan et al., Reference Gollan, Ashcroft and Batley2011). Bees are likely to respond to colours associated with floral rewards such as pollen and nectar (Potts et al., Reference Potts, Kevan, Boone, Dafni and Kevan2005; Munyuli, 2010). Previous studies in the Northern Hemisphere and Australia have evaluated the effect of trap colour on the abundance and species composition of captured bees (Leong and Thorp, Reference Leong and Thorp1999; Gollan et al., Reference Gollan, Ashcroft and Batley2011). However, studies testing the suitability of the methods are lacking for sub-Saharan Africa, yet the majority of cultivated crops in this region rely on bees to set fruit and seeds.
Most studies on bee communities in tropical regions use line-transect and hand-net sampling methods (Munyuli, 2010). However, these methods require trained personnel to spend time actively sampling sites. In contrast, pan-trapping may be a more time- and cost-efficient alternative because of its passivity (Potts et al., Reference Potts, Kevan, Boone, Dafni and Kevan2005). For example, one person can set pan traps at multiple sites on a single sampling day, thus increasing sample size with minimal time investment.
The general objective of this study was to identify sampling techniques associated with the detection of highest bee diversity and abundance in rural landscapes of Uganda.
The specific objectives were to: (1) assess the efficiency of hand-net, pan-trap and line-transect-count sampling methods in terms of species richness and population density and (2) identify the response of different bee species to different pan trap colours.
Materials and methods
Study area and sites
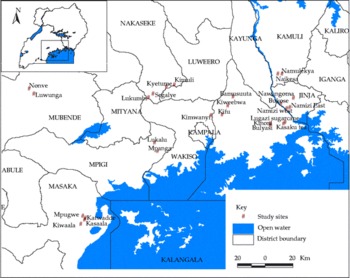
This study was conducted in the banana–coffee agroecosystem of the Lake Victoria Arc (Fig. 1) covering several districts (Munyuli, Reference Munyuli2011d) of central Uganda. The Lake Victoria Arc is characterized by ferrisols with high to medium fertility and receives on average 1000–1800 mm of rain in a bimodal pattern (rainy seasons: March–May, September–November; semi-dry to dry seasons: June–August, December–February) with heavy yet unpredictable rainfall events. Temperatures typically range from 22 to 37°C with relative humidity ranging from 60 to 75% (Munyuli, Reference Munyuli2011a). The landscape of rural central Uganda is a mosaic of natural habitats, such as forest reserves, wetlands and woodlands, which are found scattered within an agricultural and semi-natural matrix (Munyuli, Reference Munyuli2011b). The study was conducted in 26 different sites (1 km2 each) with various landscape and environmental gradients, anthropogenic disturbances and farm management intensities. Detailed land-use and vegetation characteristics (Munyuli, Reference Munyuli2012a, b, c; Munyuli et al. 2012) of the 26 sites are presented in Munyuli (Reference Munyuli2011c).
Location of districts in which study sites surveyed were selected in the banana–coffee growing area around Lake Victoria in Uganda (A colour version of this figure can be found online at: journals.cambridge.org/jti).

Sampling design and bee sampling methods
Transects were used as the basic sampling unit for all bees, land uses, habitats and vegetation data (Munyuli, Reference Munyuli2011e). Bees were sampled on one central transect (200 m wide × 1000 m long) per study site. A sampling belt (20 m wide × 1000 m long) was selected in the middle of each central transect as recommended (Banaszak, Reference Banaszak1980; Munyuli et al., 2011) for sampling bees in agricultural landscapes. Using a tape measure, the sampling belt of each selected central transect was divided into 10 sections (sampling plots) of the same size (20 m wide × 100 m long each). The 10 sampling plots of each sampling belt were visited at each sampling date. For each of the three sampling methods, transect walks, hand-netting and pan-trapping, bees were sampled during five consecutive rounds from January 2006 to December 2006 (round 1: January–April; round 2: May–June; round 3: July–August; round 4: September–October; round 5: November–December). The simultaneous application of different sampling methods was aimed at determining the optimal method for inventorying bee biodiversity in agricultural systems in Uganda. Sampling was conducted across crop growing seasons to compare sample yields (bee species and individuals) and between rainy (wet) and dry seasons (Banaszak, Reference Banaszak1980; Potts et al., Reference Potts, Kevan, Boone, Dafni and Kevan2005).
Bee fauna surveys were conducted across the months of highest (September–May) and lowest (June–August) bee abundance and species richness (Munyuli, 2010). Each round of data collection lasted 5–7 weeks. The interval between two consecutive rounds of data collection was 2–3 weeks. Approximately 25 min were spent to set up three pan traps (yellow, blue and white) at each sampling point, and this resulted in 250 min spent per observer per transect on each sampling day. Also, 300 min were spent on hand-net sampling and 300 min for visual sampling along transects. Across the sampling methods, bees were sampled for a 30 min period per sampling plot as recommended (Potts et al., Reference Potts, Kevan, Boone, Dafni and Kevan2005) between 08.00 and 17.00 h.
A 30 min time period is classically recommended when sampling in agricultural areas (Potts et al., Reference Potts, Kevan, Boone, Dafni and Kevan2005). It seems that this 30 min period is significant for yielding good results (Potts et al., Reference Potts, Kevan, Boone, Dafni and Kevan2005; Westphal et al., Reference Westphal, Bommarco, Carré, Lamborn, Morison, Petanidou, Potts, Roberts, Szentgyörgyi, Tscheulin, Vaissière, Woyciechowski, Biesmeijer, Kunin, Settele and Steffan-Dewenter2008). Although the temporal scale matters for bee sampling, spatial equivalence may not matter for bee sampling in agricultural areas when compared with natural areas (Munyuli, 2010).
Bee specimens from each sampling method (hand nets and pan traps) were strained into plastic vials containing alcohol (70% ethanol) and taken to the laboratory for identification to the highest possible taxonomic level.
Transect walks-and-counts
This method was used to sample foraging bees in the sampling belt by two observers per site (Banaszak, Reference Banaszak1980). Observations of foraging activities and bee counts were done on flowering patches found within different habitats and land uses while walking along transects at a slow speed ( < 0.25 km per hour). Observations were made under conditions favourable for bee flights: sunny or cool weather, weak wind and maximum temperature.
Hand-netting method
Sampling of bees with a hand net (30 cm in diameter) was conducted in patches of fresh flowers in each plot immediately after visual censuses. Transects were sampled from 08.00 to 17.00 h to capture bees on blooming plants (Wilson et al., Reference Wilson, Messinger and Griswold2009). Hand-net bee samples were transferred to ziplock plastic bags and placed in a portable cooler.
Pan-trapping method
A single trapping point was established within each plot. Pan traps were constructed from 236.5 ml white, blue and yellow plastic bowls (Potts et al., Reference Potts, Kevan, Boone, Dafni and Kevan2005; Roulston et al., Reference Roulston, Smith and Brewster2007). The bowls (brand ‘Solo’ supplied by Simon Potts from the University of Reading, UK) were sprayed with ultraviolet bright paint colours (blue, yellow and white). Pan traps were filled with water and a small amount of detergent to reduce surface tension to help insect sink and increase UV light reflection (Munyuli, 2012a,b,c; Munyuli et al. 2012), thereby attracting insects, including bees which fly into the water and drown (Aizen and Feinsinger, Reference Aizen and Feinsinger1994). At each sampling point, three pan traps (blue, yellow and white) were spaced 5 m apart on the ground (Droege et al., Reference Droege, Tepedino, Lebuhn, Link, Minckley, Chen and Conrad2010). Pan traps were placed elevated in the plant canopy at the height of flowers easily visible by flying insects. Bowls were hung on plant branches or on stakes fixed in the soil. In each pan trap, unscented, biodegradable liquid detergent was poured into pan traps (2.5 ml detergent/litre water). Pan traps were left in place for about 2 days before collecting samples (Potts et al., Reference Potts, Kevan, Boone, Dafni and Kevan2005).
Most pans used were generally placed far from tracks to reduce disturbance by curious and uninformed villagers or school children. A limited number of traps were found disturbed (i.e. empty pan traps, pan traps taken away, etc.) during the second and fourth rounds of data collection, resulting in a few missing data points. During the rainy seasons, holes were added in the upper zone of each pan trap to allow excess water to drain without washing away the bee samples.
Laboratory processing and identification of bee samples
Collected specimens were processed at Makerere University Zoology Museum. Preliminary identification of bees to the family or genus level was conducted using published dichotomous keys (Michener, Reference Michener2007) and online keys available through www.discoverlife.org. Bee identifications up to species were conducted at the biosystematic division of the Plant Protection Research Institute (Agricultural Research Council (ARC), Pretoria, South Africa), at the Natural History Museum in London (UK) and at the Smithsonian Tropical Research Institute (Panama). Identification of bee samples was also validated at the University of Reading (UK). Voucher specimens are deposited at the laboratory at Makerere University Zoology Museum.
Data analysis
Bee diversity measurement
Species richness was estimated as the total number of bee species recorded at each sampling round. Bee abundance was quantified as the total number of individuals recorded each sampling round. Bee diversity was measured using Shannon–Wiener's diversity index (Gotelli and Colwell, Reference Gotelli and Colwell2001; Magurran, Reference Magurran2004). Species dominance (D) per study site was calculated according to Buschini and Woiski (Reference Buschini and Woiski2008): D= (abundance of a species/total abundances recorded) × 100. If D>5%, the species was considered as a dominant species; if 2.5% < D< 5%, the species was considered as an accessory species or species of intermediate abundance; if D< 2.5%, the species was considered as an incidental species.
Efficiency of the different sampling methods
A χ2 test was used to test for differences in the number of species captured by the three sampling methods. Comparisons among the sampling methods were based on the assumption that collection times were statistically more or less the same (250–300 min) across the sampling methods.
Bee variability
The Kolmogorov–Smirnov test was used to check for normality of the distribution of raw data using Minitab 15. Whenever necessary, data were transformed to meet the assumptions of normality and homogeneity of variances prior to performing data analysis. The number of species and individuals were log-transformed using natural log (ln(x+1)), whereas diversity index values were not transformed. Across the sampling methods, variations in abundance, species richness and diversity were analysed using an analysis of variance (ANOVA) following a repeated-measures design with sampling round and sites entered into models as fixed factors and clusters as random factors. When F ratios for main effects were significant, means were separated using the Tukey test at the 5% probability level. All analyses were performed in Minitab 15, English version.
Responses to pan trap colours
Using frequency data matrices, a χ2 test was performed, to examine the response of different bee species to trap colours (white, blue and yellow). Data were the number of individuals belonging to each bee species that were captured by pan trap colour types across the 26 study sites during the five sampling rounds.
Results
Bee communities
In total, 80,883 bee individuals representing 652 native bee species (see the species list in Appendix 1; Munyuli, Reference Munyuli2011c) from six families, 14 subfamilies, 34 tribes and 79 genera were collected. Up to 645 species were new records for Uganda (in the post-colonial time) from the overall bee fauna diversity, since the bee fauna of Uganda was previously very poorly described.
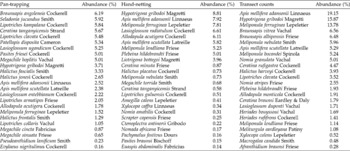
The farmland bee community was characterized by a few dominant species that accounted for the majority of specimens collected (Table 1). For example, in the transect count samples, the most abundant species were Apis mellifera adansonii Linnaeus, Hypotrigona gribodoi Magretti and Meliponula ferruginea Lepeletier (Table 1).
The 24 most abundant bee species found in farmlands of central Uganda during faunistic surveys of 2006+

+ The abundance is classified according to the different sampling methods applied (pan traps, hand nets and transect counts); only the bee species for which individuals represent >0.14 of total population densities recorded are shown.
Pan-trapped bee families differed significantly in species richness (χ2= 56.1, degree of freedom (df) = 5, P< 0.001) and abundance (χ2= 75.87, df = 5, P< 0.001). Apidae was the most species-rich family (41.4% of species recorded in pan traps) followed by Halictidae (30.1%), Megachilidae (15.9%) and Colletidae (6.2%). Similarly, the bee family with the highest number of individuals was Apidae (46.5% of total bee individuals recorded) followed by Halictidae (38.5%), Andrenidae (5.8%) and Colletidae (4.1%). The most species-rich bee genus captured by pan traps was Halictus followed by Lipotriches, Patellapis, Ceratina, Allodapula and Braunsapis.
Sampling method effectiveness
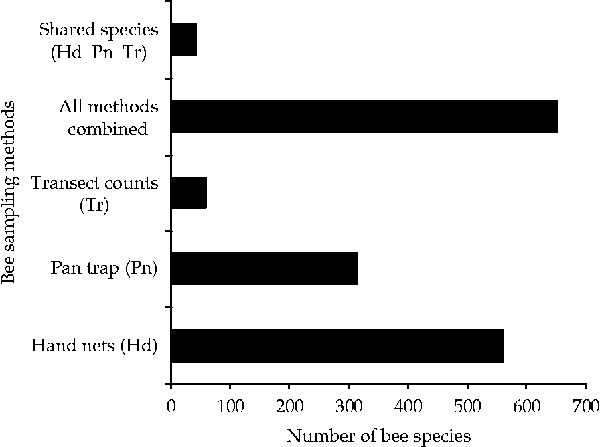
A significantly (χ2= 402.4, df = 2, P< 0.001) higher number of bee species was captured using hand-net (559 bee species) than transect-count (59 bee species) and pan-trap (314 bee species) sampling methods (Fig. 2). There were differences in the number of species captured but the overlap was relatively high among the species found by the different methods. There were also significant differences (χ2= 120.1, df = 2, P< 0.001) among the sampling methods applied in the total abundance of bees captured. From a total of 80,883 bee individuals recorded, most individuals were observed through line transect counts (85% of total individuals). Very few individuals were captured (collected) by hand nets (8%) and pan traps (7%). The inability to identify most bee species during observations affected the number of species observed during transect counts, although a great number of individuals were recorded by this method.
Efficiency of different sampling approaches in detecting the number of species belonging to a bee fauna occurring in the coffee–banana agroforestry systems of central Uganda in 2006.

The relative performance of the sampling method (Munyuli, 2010) was also analysed with respect to sample coverage. Sample coverage was defined as the number of species that were detected per individual method divided by the cumulative number of species per study site (i.e. the total number of species that was detected with all methods on a site combined). The results indicated that the sample coverage was 62.1, 6.5 and 34.9% for hand nets, transect counts and pan traps, respectively.
Bee variability
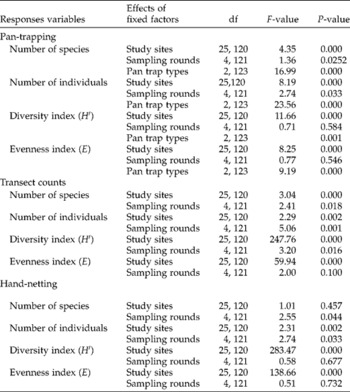
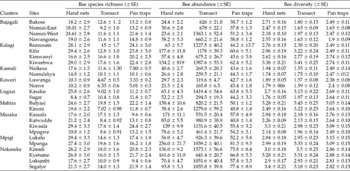
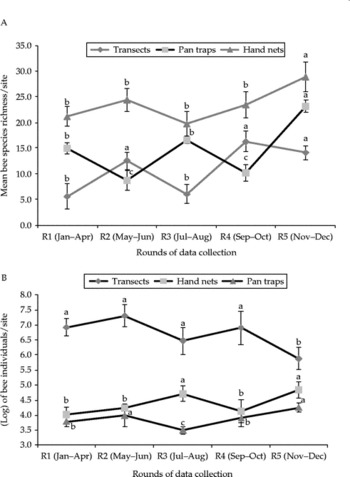
There were significant (P< 0.05) effects of the study sites, sampling rounds and pan trap types on species richness and abundance of bees (Table 2). Across the three sampling methods applied, there was variability in the number of bee species and individuals recorded in the 26 study sites (Table 3). Also, there were variations between the five sampling rounds in bee species richness and abundance across the sampling methods (Fig. 3). From the hand-netting bee data, species richness was at its maximum value during sampling period 5 (November–December), when conditions of temperature and moisture were best for bee activities and when higher floral resources were likely available (Fig. 3A). Bees were abundantly recorded on transect counts (Fig. 3B) during sampling round 2 (May–June) and sampling round 3 (September–October).
General linear model ANOVA for exploring, per sampling method (pan-trapping method; transect counts; hand-netting), the effects of study sites, pan trap types and sampling rounds on species richness, abundance, diversity and evenness of bees from farmlands of central Uganda in 2006+

df, degree of freedom.
+ Across the sampling methods, no two-, three- and four-way interacting factors had significant effects on the abundance, species richness and diversity of bees; they are removed from the tables; only the effects of main factors are shown.
Species richness, abundance and diversity of bee assemblages in coffee–banana farming systems in Uganda

Temporal variation in (A) bee species richness and (B) abundance captured using the different sampling methods. Means ( ± SE) followed by the same letters are not significantly different at P< 0.05 (Tukey's test).

Response of bee species to trap colours
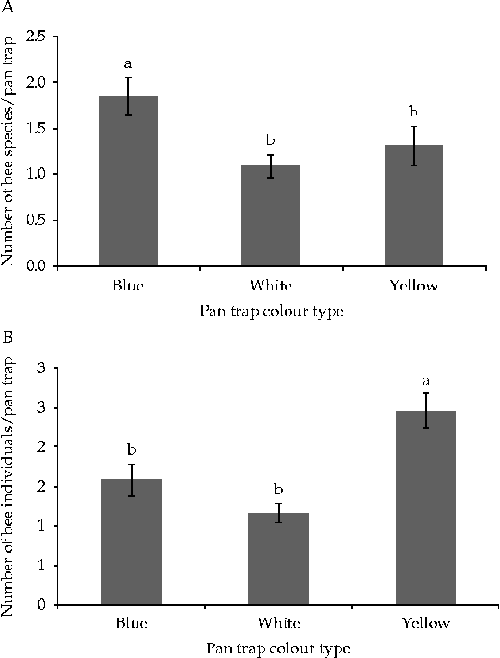
There were differences among the three pan trap colours in the number of bees captured. The highest number of bees was caught in yellow pan traps compared with white or blue pan traps (Fig. 4B). Pan-trapped bee community species richness had a contrasting pattern to that of the abundance with blue pan traps capturing a higher number of bee species than did white and yellow pan traps (Fig. 4A).
Mean (A) bee species richness and (B) bee abundance captured using different pan trap colours. Means ( ± SE) followed by the same letters are not significantly different at P< 0.05 (Tukey's test).
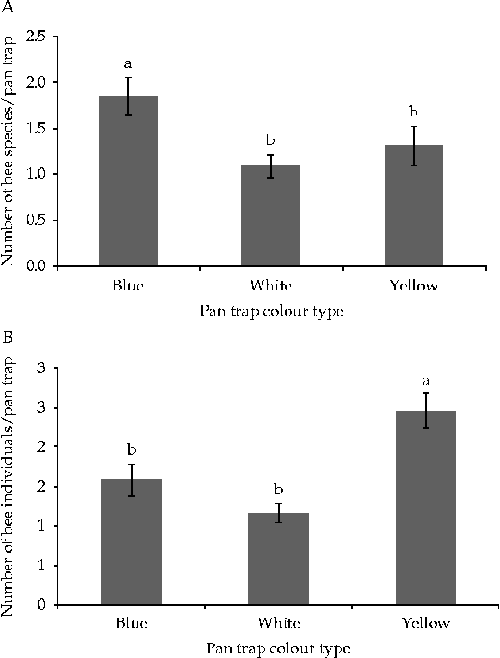
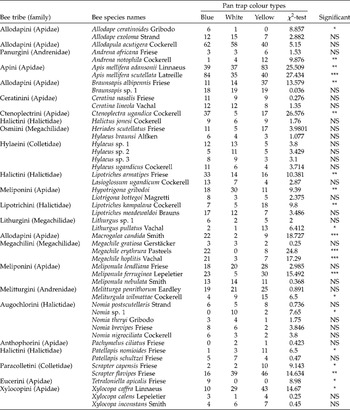
On average, each pan trap attracted 1.26–2.69 bees per day per study site. Although, most bees were more likely to be caught in yellow traps than in white or blue pan traps, this trend varied by species. The abundance of other species and functional groups varied among coloured pan trap types. Thus, across rounds of data collection and study sites, members of the Apini and Meliponini bee tribes were likely to be caught in yellow and blue traps than in white ones. For example, among the three pan trap colours tested, Braunsapis albipennis Friese was significantly more (P< 0.001) captured in yellow pan traps, while Braunsapis albitarsis Friese did not show any particular preference for trap colour (P>0.05). Hypotrigona gribodoi (P <0.05) and Xylocopa caffra L. (P <0.05) were most often captured in white pan traps than in blue and yellow ones, while M. ferruginea Lepeletier was more often captured in blue (P <0.001) than in yellow and white pan traps (Table 4). Other species that were most often captured in blue pan traps than in white and yellow ones included Allodape ceratinoides Gribodo (P <0.001), Macrogalea candida Smith (P <0.001), Ctenoplectra ugandica Cockerell (P <0.001), Tetraloniella apicalis Friese (P <0.05), Lipotriches kampalana (P <0.05), Megachile erythrura Pasteels (P <0.001) and Megachile hoplitis Vachal (P <0.001) (see Table 4 for the attraction pattern of other species by different pan trap colours).
Variation in the frequency of bee species attraction to different pan trap colours+

NS, not significant.
Statistical significance levels (χ2 test): * P< 0.05, ** P< 0.01, *** P< 0.001.
+ The frequency values are the number of times the specimen of the bee species was recorded in the type of pan trap colour over the five rounds of data collection conducted in 2006. Only the bee species with frequency above 3 across the three pan traps are presented.
Discussion
The results indicated differences in the effectiveness of the three sampling methods applied. A high number of bee species was detected with the hand-net sampling method followed by the pan-trapping method (Table 3). There was little overlap in the kinds of species that were found with each sampling method (Table 3). Earlier, Banaszak (Reference Banaszak1980) and Banaszak and Manole (Reference Banaszak and Manole1994) recommended the transect count method as the most reliable method for counting, monitoring and assessing bee population density in agricultural landscapes. Later, Westphal et al. (Reference Westphal, Bommarco, Carré, Lamborn, Morison, Petanidou, Potts, Roberts, Szentgyörgyi, Tscheulin, Vaissière, Woyciechowski, Biesmeijer, Kunin, Settele and Steffan-Dewenter2008) and Moroń et al. (Reference Moroń, Szentgyörgyi, Wantuch, Celary, Westphal, Settele and Woyciechowski2008) recommended pan traps as the most efficient and unbiased sampling method for sampling bees in agricultural landscapes in the European environment. Results from central Uganda did not concur with the findings of Moroń et al. (Reference Moroń, Szentgyörgyi, Wantuch, Celary, Westphal, Settele and Woyciechowski2008). Pan traps were not efficient in central Uganda. In fact, in the latter, the significantly highest number of bee species was captured in hand nets followed by pan traps and then transect counts. Exact reasons for the difference in sampling method effectiveness are presently unknown, though differences in biogeography and ecology of the study areas, particularly the occurrence and co-existence of various flowering plant communities, could possibly attract different bee species to pan traps.
Pan traps efficiency may depend on the diversity/cover of flowering plants. The efficiency decreases as the diversity/cover increases, because pan traps at flower-rich sites encounter more ‘competitors’ (flowers) for bees. This may partially explain these results. Also, this may be because semi-natural habitat patches found in agricultural matrices in Uganda are more floristically rich than in temperate regions.
Interestingly, the findings from Uganda were similar to the findings of a recent study conducted in farmlands in the USA, where it was observed that the number of bee species and individuals captured by pan traps was significantly lower compared with the hand-net method (Droege et al., Reference Droege, Tepedino, Lebuhn, Link, Minckley, Chen and Conrad2010). Few other case studies have indicated that the hand-net method performs better than pan-trapping (Krug and Alves-Dos-Santos, Reference Krug and Alves-Dos-Santos2008; Giles and Ascher, Reference Giles and Ascher2006). Also, pan traps (aerial set of pan traps at heights of up to 30 m) were found to be efficient in collecting a great bee abundance in agricultural land and a higher bee abundance and species richness in undisturbed forest compared with secondary forest in Ghana (Nuttman et al., Reference Nuttman, Otieno, Kwapong, Combey, Willmer and Potts2012).
The results of this study indicated diversity in response of different bee species to different pan trap colours. Thus higher bee species richness was observed with blue pan traps than with white and yellow ones. Also, there was a tendency for yellow pan traps to capture more bees than blue and white ones. Other workers from different regions of the world have also recorded similar patterns (Aguiar et al., Reference Aguiar, Garofalo and Alemidae2005; Toler et al., Reference Toler, Evans and Tepedino2005; Hendrix, Reference Kwaiser and Hendrix2008; Frimpong et al., Reference Frimpong, Gordon, Kwapong and Gemmill-Herren2009; Kwaiser and Tuell et al., Reference Tuell, Ascher and Isaacs2009; Melo et al., Reference Melo, Gimens and Neto2009; Ulyshen et al., Reference Ulyshen, Soon and Hanula2010; Gollan et al., Reference Gollan, Ashcroft and Batley2011). In addition, Stephen and Rao (Reference Stephen and Rao2007) reported fewer bee species in yellow traps in their studies. The results obtained in the present study are in accordance with those of previous studies because more bee species were caught in blue pan traps than in yellow pan traps. Hence, pan traps could provide reasonable estimates of relative species richness of bees over time and space (Toler et al., Reference Toler, Evans and Tepedino2005).
Another survey was conducted to detect the time of the day when more farmland bees forage (Munyuli, 2010). The results indicated that more foraging trips were made in early morning hours (from 09.00 to 12.00 h). These observations indicated that some bee species occurring in farmlands of central Uganda were nocturnally–crepuscularly active species. Some of these species are active in the early morning hours (05.00–07.00 h), although most Afrotropical bee species are normally thought to be diurnal organisms (C. Eardley, personal communication, ARC, Pretoria).
There are potential biases associated with sampling methods that can be chosen during an arthropod pollinator monitoring programme. Most recommended sampling methods for biological monitoring of arthropod communities include passive (i.e. pan traps) and non-passive methods (i.e. transect counts and hand nets). However, if one of the goals of biological monitoring is assessing the long-term effects of ecosystem changes on multiple bee assemblages, then the relative affinities of particular taxa for particular methods need to be quantified for a sound interpretation of monitoring data. In other words, interpretation of census results must explicitly acknowledge biases associated with sampling methods (Obrist and Duelli, Reference Obrist and Duelli2010). Differences in yield and sample composition during a survey can be influenced by various factors such as the landscape composition (e.g. per cent cover in semi-natural habitats) and weather factors (e.g. temperature, light intensity, rainfall). All other variables remaining constant, ‘sampling method’, ‘collector knowledge and skills’, number of ‘sampling days’ and ‘time of the day’’ can significantly influence both richness and abundance of bees per sample (Munyuli, 2010). Overall, sampling methods and time of the day are among the most important factors that can influence the yield during monitoring programmes of Apoidea communities in agricultural landscapes.
Each of the three sampling methods in this study has advantages and disadvantages (Munyuli, 2010) and associated bias (Baum and Wallen, Reference Baum and Wallen2011). Hand-netting and line transect counts are the traditional methods (with standardized protocols) of sampling bees directly from flowers. As an example of a disadvantage, hand-netting requires a greater number of man-hours in the field. Pan traps are suggested by some authors as the best methods because of their independence (collector bias avoided) and their passivity in data collection (Westphal et al., Reference Westphal, Bommarco, Carré, Lamborn, Morison, Petanidou, Potts, Roberts, Szentgyörgyi, Tscheulin, Vaissière, Woyciechowski, Biesmeijer, Kunin, Settele and Steffan-Dewenter2008). It is presumed that the bowls present a strong visual stimulus, even if the lack of appropriate natural chemical stimuli may detract bees from the bowls when flowers are present (Westphal et al., Reference Westphal, Bommarco, Carré, Lamborn, Morison, Petanidou, Potts, Roberts, Szentgyörgyi, Tscheulin, Vaissière, Woyciechowski, Biesmeijer, Kunin, Settele and Steffan-Dewenter2008). Although pan trap-based collection techniques are believed to be critically robust and reliable in measuring pollinator assemblages in crop fields in agricultural landscapes, variation in trap colour efficiency can vary between bee taxa, such as species of the same tribe that do not necessarily prefer the same pan trap colour. It is likely that using several colours in a sampling design may help to eliminate this bias.
Pan-trapping is viewed by some scientists as an attractive alternative to traditional net collecting because it is cheaper, requires fewer man-hours, does not depend on trained collectors and presumably eliminates collector bias (Westphal et al., Reference Westphal, Bommarco, Carré, Lamborn, Morison, Petanidou, Potts, Roberts, Szentgyörgyi, Tscheulin, Vaissière, Woyciechowski, Biesmeijer, Kunin, Settele and Steffan-Dewenter2008; Grundel et al., Reference Grundel, Frohnapple, Jean and Pavlovic2011). However, findings from central Uganda, similar to those of Wilson et al. (Reference Wilson, Griswold and Messinger2008), evidenced strong biases in capture rate at the generic level. In addition, the pan trap collection method may not accurately represent relative abundances of bee species since few numbers per species were collected in pan traps in this study. In fact, assemblages collected in pan traps had greater dominance by certain bee groups (halictids and andrenids) than others. When compared with hand nets, pan traps were biased towards capturing specialized bee groups in two families (Halictidae and Andrenidae) and tended to under-sample bees in the Apidae and Megachilidae families. Relative abundances in pan traps are not necessarily good indicators of relative abundances in the field. In fact, a recent study conducted in agricultural landscapes in the mid-Atlantic region of the USA indicated the preponderance of halictid bees in pan traps when compared with netting (Droege et al., Reference Droege, Tepedino, Lebuhn, Link, Minckley, Chen and Conrad2010).
Hand net was found to be effective at capturing several species and individuals in the Apidae, Colletidae and Megachilidae families. However, hand net was also biased towards species and individuals of the Halictidae and Melittidae families that were only sparsely captured by this method. Thus, the hand-netting method may yield inaccurate estimates of the relative abundance of bee species (Potts et al., Reference Potts, Kevan, Boone, Dafni and Kevan2005). Across the five sampling rounds conducted in this study, hand net consistently recorded lower abundances of most bee species compared with transect counts, even if it detected the highest species richness. Overall, the data showed that the three methods were complementary because each was effective at sampling a different combination of species at different abundances.
Conclusion
Based on the results of this study, the pan trap method (Toler et al., Reference Toler, Evans and Tepedino2005) seems to be a useful method for estimating abundance and diversity of the bee community in the coffee–banana agroforests of central Uganda. Pan traps captured bee species that the hand-net and visual count methods missed. Practically, pan traps captured over 300 species compared with over 500 species captured using hand nets, which is inconsistent with other studies (Westphal et al., Reference Westphal, Bommarco, Carré, Lamborn, Morison, Petanidou, Potts, Roberts, Szentgyörgyi, Tscheulin, Vaissière, Woyciechowski, Biesmeijer, Kunin, Settele and Steffan-Dewenter2008) that have recommended pan traps as the best sampling method. Based on the pan trapped bee community, species richness curves indicated that 67% of the bee species in the study area were recorded, meaning that around 33% of species were not recorded in pan traps (Munyuli, 2010). If time, money and other resources are available, the use of different but complementary sampling methods is recommended for Afrotropical agricultural landscapes to detect the highest number of species rather than the use of one sampling method alone. Ecological monitoring programmes in Uganda are implemented at three stages: short term (1–2 years), medium term (>2–5 years) and long term (>5–10 years). Short-term surveys are generally conducted to check the status of species. However, medium- and long-term surveys are regularly conducted to collect data that can be used in trend analysis to generate information for policy-makers (Munyuli, Reference Munyuli2011c).
Acknowledgements
I am very grateful to Darwin Initiative for funding the project that supported this study. Mr Maurice Mutabazi (research assistant) is acknowledged for his assistance in the field. My gratitude goes also to project leaders and technical advisors, mainly to Dr Juliet Vickery from RSPB-Cambridge University, Dr Phil Atkinson from British Trust for Ornithology and Professor Derek Pomeroy from Makerere University. I am extremely very grateful to my scientific supervisors, in particular, Professor Dr Simon Potts from the University of Reading and Professor Philip Nyeko from Makerere University. I am also very grateful to the taxonomic services offered by Dr Connal Eardley (biosystematic division of ARC, Republic of South Africa), Dr David Notton (curator, Hymenoptera section, Natural History Museum, London), Dr David Roubik (Smithsonian Tropical Research Institute, Panama) and Mr Roberts Stuarts (University of Reading, UK). The warm and kind collaboration of other project advisors is acknowledged. I am also very grateful to Dr Eric Sande, Dr Anne Akol, Dr Robert Kajobe, Dr Robert Kityo, Dr Vincent Muwanika, Professor William Banage, Dr Paul Ssegawa, Dr Herbert Talwana, Professor Tabuti and Prof. Frank Kansiime (Makerere University, Kampala, Uganda), and to Dr Bwinja, Dr Baluka Bajope and Professor Bashwira Sanvura (CRSN-Lwiro). I am also very grateful to small-scale farmers from central Uganda for allowing research to be conducted in their gardens and for their kind cooperation during data collection. I acknowledge early comments on this manuscript by Dr Daniel Cariveau (Rutgers University, USA). I am very grateful to the comments from anonymous reviewers of this journal. Their comments helped in improving the manuscript.
List of bee species collected in coffee–banana agroforestry systems in central Uganda in 2006