


To hear Americans talk about immigration, you might think their views developed mostly while shopping. For former Arizona State Representative Randy Graf, it was seeing a Spanish-speaking family using Food Stamps that triggered a personal crusade against illegal immigration (Lelyveld Reference Lelyveld2006). In Los Angeles, a focus group participant explained his attitudes through an anecdote about having ordered a hamburger from someone with limited English and having received eight (Paxton Reference Paxton2006, 554). One Georgia resident came to dread Wal-Mart trips after realizing that at one point, she had been the only non-Latino customer (Aizenman Reference Aizenman2007). But are these local encounters actually shaping attitudes, or are they merely helping Americans to express them? More generally, under what conditions do people's local experiences influence their political attitudes?
In recent years, these questions have grown in importance in the study of immigration. As of 2005, 12% of U.S. residents were foreign born, a number that is higher than at any time since 1920. With many jobs available outside the traditional gateway cities, today's immigrants are settling in both smaller towns and large coastal cities (e.g., Frey Reference Frey2006). If theories of racial threat apply to today's immigrants, these demographic changes foreshadow an anti-immigrant turn in American politics. Already, there is some evidence of such a turn. In 2006 alone, at least 101 communities considered or passed anti-immigrant ordinances (Fair Immigration Reform Movement [FIRM] 2007). And the Senate's 2007 immigration bill was defeated amid outspoken opposition, much of it from states with growing immigrant populations (Aizenman Reference Aizenman2007).
According to theories of racial threat, the rising number of immigrants will threaten long-time residents' political power and economic status, and thus will generate political hostility in heavily immigrant areas. But as its name implies, this theory was developed in an earlier era to explain black–white relations. To date, the empirical evidence applying this theory to immigrant populations has been inconsistent, with some studies finding evidence of threat and others finding null effects or even positive ones. As an alternative, this article develops the politicized places hypothesis to explain how and when local demographics influence attitudes and local politics. Immigrants are often unable to vote, and they tend to work in segmented labor markets and live in segregated communities. All three factors minimize the threat they pose to long-time residents' interests, and even their visibility to native-born Americans. Supermarket encounters might be the exception, not the rule.
The key challenge for theories of racial or ethnic threat, then, is to specify the conditions that lead an outgroup to be perceived as threatening. In response, the politicized places hypothesis contends that when communities are undergoing sudden demographic changes at the same time that salient national rhetoric politicizes immigration, immigrants can quickly become the targets of local political hostility. Sudden demographic changes generate uncertainty and attention. Coverage of immigration in the media can inform people about demographic changes and can politicize those changes in people's minds. Acting in tandem, local demographics and nationally salient issues can produce anti-immigrant attitudes and outcomes. One advantage of this approach is that it does not assume that individuals necessarily politicize their day-to-day encounters—or that they even pay much attention to their demographic surroundings. Also, by specifying when an outgroup will be perceived as threatening, the politicized places approach adds a dynamic component to theoretical approaches that are typically static.
As this article demonstrates, the politicized places hypothesis finds consistent support from many data sources, including twelve national surveys and a new data set of local anti-immigrant ordinances. The hypothesis, outlined in the next section, can account for the inconsistency of past results, and can also help explain why local anti-immigrant proposals are clustered in time. The third section describes the survey data and methods. Comparisons of geocoded data from the General Social Survey (GSS; 1994, 1996, 2000), the National Election Study (NES; 1992, 1994, 1996, 1998, 2000, 2004), the Social Capital Community Benchmark Survey (SCCBS; 2000, 2006), and a Knowledge Networks (KN; 2009) survey illustrate that living in communities with rising numbers of immigrants can reduce support for immigrants and immigration. But as the following section shows, that is true chiefly when immigration is a salient national issue. From statistical models, we learn that respondents in quickly changing counties are 10 percentage points (or 18%) more likely to want to restrict immigration when the issue is nationally salient than those in static counties. Here, rapidly changing means a county that has seen its percent foreign born rise by 7 percentage points in the past decade. The results come from an analysis of surveys administered at different times by different organizations, ensuring that they are not artifacts of house effects, mode effects, or the priming effects of any particular survey instrument.
The subsequent section extends this finding by using panel data over the September 11 terrorist attacks. The influence of local contexts can appear and disappear in a matter of months, a fact that weighs against traditional theories of threat positing consistent local influences. The panel data used here are especially valuable, as they allow us to dismiss two persistent alternative explanations: that the salient national frames are endogenous to local attitudes, and that the people who select into changing communities differ in unobserved ways from those who do not.
Many analyses of threat look only at individual-level attitudes, but theories of threat also generate predictions about which communities should consider anti-immigrant policies. In fact, in all likelihood, interethnic attitudes have been of interest to so many scholars precisely because of their connection to intergroup relations and policy outcomes. Here, too, the politicized places approach proves helpful. This article's second-to-last section illustrates that a sudden increase in the number of immigrants is the most powerful predictor of which localities consider anti-immigrant ordinances. That holds even when comparing communities that were identical in key ways as of 1990. The confluence of national salience and sudden demographic changes triggered not only attitudinal changes, but a wave of local ordinances as well.
Certainly, we can be more confident in the cross-sectional claims based on thousands of survey respondents or hundreds of communities than the longitudinal claims based on just thirty-nine months. Thus, the cross-sectional evidence on the influence of local demographic changes—a factor that has received little attention to date—seems especially powerful. But in all cases, politicized places better explains the observed patterns than other explanations, including those based on endogeneity or selection bias. The concluding section outlines what the politicized places hypothesis could mean for the study of local and national immigration politics as well as for our thinking about how local experience shapes attitudes. It also highlights the approach's boundaries.
BEYOND REALISTIC CONFLICT
Theories of racial threat or “power threat” are a subset of theories of realistic group conflict (Wong and Drake Reference Wong and Drake2006, 5) with intellectual origins in the research of Key (Reference Key1949) and Blalock (Reference Blalock1967). The central claim is that the presence of an outgroup in sufficient numbers will generate competition for scarce resources and thus local hostility.Footnote 1 Since the mechanisms are exclusively local, the effect should be a function of local population shares and vary over time only to the extent that population shares do. Threat might be especially acute in places of relative or increasing resource deprivation (Branton and Jones Reference Branton and Jones2005; Gay Reference Gay2006; Olzak Reference Olzak1992), or of rising outgroup political power (Dancygier Reference Dancygier2007; Key Reference Key1949). After a brief discussion of theories of racial threat, this section shows that such theories do not hold consistently when applied to immigrants. It then develops the politicized places hypothesis as one explanation for the mixed empirical results and outlines the key predictions that differentiate politicized places from other approaches.
In recent theorizing, research on racial threat has tended toward one of four positions. The first holds that geographic proximity acts primarily by triggering political competition (e.g., Glaser Reference Glaser1994). The second contends that proximity triggers a more diffuse, undifferentiated prejudice (e.g., Taylor Reference Taylor1998). The third contends that ethnic and racial diversity can dampen both outgroup and ingroup cohesion (Putnam Reference Putnam2007). And the fourth disputes the relevance of racial threat altogether (Voss Reference Voss1996), highlighting instead the role of socioeconomic contexts in shaping racial attitudes (Oliver and Mendelberg Reference Oliver and Mendelberg2000).
Scholars have put considerable effort into adapting contextual theories to explain attitudes toward immigration. The dependent variables are typically Americans' attitudes toward immigration policy; their support for policies that assist immigrants and ethnic minorities; their assessments of immigrants' likely impact on the country; and their affect toward immigrants, Hispanics, and Asian Americans.Footnote 2 Exhibiting more anti-immigrant attitudes in more immigrant-heavy communities is the hallmark of a threatened response. Yet, so far, the empirical results have been inconclusive. Some of the research has found threatened responses in attitudes and voting behavior (Stein, Post, and Rindin Reference Stein, Post and Rinden2000; Tolbert and Grummel Reference Tolbert and Grummel2003)—and it is reinforced by parallel findings from the UK. (Dancygier Reference Dancygier2007; Dustmann and Preston Reference Dustmann and Preston2001). Other work finds little direct evidence of threat from Asian Americans and Hispanics (Cain, Citrin, and Wong Reference Cain, Citrin and Wong2000; Dixon and Rosenbaum Reference Dixon and Rosenbaum2004; Taylor Reference Taylor1998; Wong and Drake Reference Wong and Drake2006) or finds threat only under specific economic, political, or spatial conditions (Branton and Jones Reference Branton and Jones2005; Campbell, Wong, and Citrin Reference Campbell, Wong and Citrin2006; Gay Reference Gay2006; Oliver and Wong Reference Oliver and Wong2003). Still other studies have found that living near immigrants or Hispanics can actually reduce negative stereotyping (Fox Reference Fox2004; Hood and Morris Reference Hood and Morris1997, Reference Hood and Morris1998). Threat operates in some cases, but certainly not in all. Given these cross-cutting results, a central theoretical challenge is to identify the conditions that are most conducive to threatened responses.
By considering the preconditions of intergroup threat, we can begin to understand why threat might not influence responses to immigrants. For classical threat to operate, people must perceive their ethnic and racial contexts (Wong Reference Wong2007). They must also perceive the outgroup as a threat to resources needed for themselves or their group, whether those resources are economic or political. For the pre–Civil Rights Era South, these assumptions seem plausible. But they are less straightforward when applied to immigrants today. First, Americans are surprisingly unaware of their demographic surroundings. Chiricos, Hogan, and Gertz (Reference Chiricos, Hogan and Gertz1997) show that the correlation between actual and perceived neighborhood racial composition for whites is just 0.16, a finding confirmed by by Wong (Reference Wong2007). Neighborhood segregation (Fischer Reference Fischer2003) and workplace segregation (Hellerstein and Neumark Reference Hellerstein and Neumark2005) together insulate immigrants from the native-born Americans, limiting their visibility.
Even if immigrants do attract attention from their neighbors, it is not clear that their presence will generate political opposition. Depending in part on one's ideology, one could as easily conclude that immigrants are contributing to the local economy as that they are stealing jobs. To the extent that contact theory holds (Pettigrew Reference Pettigrew1998; Stein, Post, and Rinden Reference Stein, Post and Rinden2000), encounters with immigrants might reduce negative outgroup attitudes. Or one might simply avoid thinking about the ramifications of the immigrants' presence—which in the lexicon of this article means that local encounters remain depoliticized. That immigrants cannot vote until they are naturalized might further reduce the threat they pose, since those who have most recently arrived are not competitors for political power (Lewis and Ramakrishnan Reference Lewis and Ramakrishnan2007). At the same time, since immigrants are a fast-growing constituency, elected officials may be loathe to mobilize anti-immigrant sentiment (Schildkraut Reference Schildkraut2001). In short, there are good reasons to suspect that threat might not always operate with respect to immigrants. For many Americans, the presence of immigrants within the locality might lead to grocery store encounters but little more.
Politicized Places
To be sure, realistic group conflict is not the only lens through which to view Americans' responses to local demographic changes. Scholars have also paid considerable attention to theories of identity, and to the possibility that local demographics might reinforce or undermine group identities (Bledsoe, Welch, and Sigelman Reference Bledsoe, Welch and Sigelman1995; Cain, Citrin, and Wong Reference Cain, Citrin and Wong2000; Wong and Drake Reference Wong and Drake2006). A related vein of work contends that attitudes toward immigration are shaped by sociotropic perceptions about its impact on the nation as a whole (Citrin et al. Reference Citrin, Green, Muste and Wong1997; Deufel Reference Deufel2006; Sides and Citrin Reference Sides and Citrin2007; Sniderman, Hagendoorn, and Prior Reference Sniderman, Hagendoorn and Prior2004) as well as by differing conceptions of what it means to be an American (Citrin, Reingold, and Green Reference Citrin, Reingold and Green1990; Schildkraut Reference Schildkraut2005). Identity-based approaches can explain why many local debates about immigration invoke the language of ownership, values, and dispossession (Horton Reference Horton1995) rather than the language of resources or economic advantage. They can also make sense of the weakness of self-interest in predicting attitudes (Citrin et al. Reference Citrin, Green, Muste and Wong1997), and of the varying levels of European opposition to groups from different countries of origin (Dustmann and Preston Reference Dustmann and Preston2000). However, as applied to immigration politics, these approaches have not emphasized variation over time (e.g., Cain, Citrin, and Wong Reference Cain, Citrin and Wong2000; Citrin et al. Reference Citrin, Green, Muste and Wong1997; Schildkraut Reference Schildkraut2005; Sides and Citrin Reference Sides and Citrin2007). They have not yet explained the wide variety of empirical results, or why demographics would reinforce identities in some instances but not others.
The politicized places approach assumes that people are highly selective in incorporating environmental information and that information acquisition needs to be explained. The hypothesis couples two core assertions. First, it resolves the issue of local inattention to demographics by arguing that while levels of ethnic heterogeneity might escape notice, changes are less likely to do so. Two communities that have equal numbers of immigrants today might still differ, depending on how recently those immigrants arrived. When people filter the vast quantities of information available, they pay special attention to change (Kahneman and Tversky Reference Kahneman and Tversky1979). Case studies suggest that this might have an analog in community politics. They illustrate again and again how sudden ethnic changes can reshape local politics, destabilizing shared conceptions of the community's identity and future (Hopkins Reference Hopkins2009; Horton Reference Horton1995; Kruse Reference Kruse2005; Lassiter Reference Lassiter2006; Rieder Reference Rieder1985). In part, recent changes might mean low levels of inter-group networking, since such networks are likely to develop only over time (Pettigrew Reference Pettigrew1998).Footnote 3 Recent ethnic and racial changes can also signal a potential shift in the housing market (Gould Reference Gould2000; Kruse Reference Kruse2005). That is no small factor in a country where 69% of adults are homeowners and where homes typically represent one's largest investment (Fischel Reference Fischel2001). The potency of ethnic change is not limited to the political class or to homeowners: a study of interethnic violence in New York City finds ethnic and racial change to be a key predictor (Green, Strolovitch, and Wong Reference Green, Strolovitch and Wong1998). Thus, at the local level, sudden demographic changes might undermine long-time residents' expectations about the community and capture their attention in ways that levels of diversity do not.Footnote 4
Still, changing demographics only catch local residents' attention. They do not necessarily connect those changes to politics. For that, people need salient frames that “define what the problem is and how to think about it” (Kinder Reference Kinder1998, 170). In other words, the demographic change might not be seen as having political ramifications unless frames are available that make those ramifications clear. One source of such frames is individuals' ideologies and long-standing beliefs: conservatives might naturally connect immigrants to questions of law and order, for example, while liberals might understand them with respect to social inequality or civil rights. Yet, this, too, does not explain why we observe threatened responses only at certain moments in time.
Another source of frames—this one more obviously dynamic—is the mass media. Past work presents compelling evidence that framing effects can shape the extent to which Americans' attitudes toward public policies are racialized (Gilens Reference Gilens1999; Kellstedt Reference Kellstedt2003). This work fits with the more general theory of symbolic politics, which explains attitudes by pointing to the presence or absence of symbols in political discourse (e.g., Sears Reference Sears, Iyengar and McGuire1993; Sears and Savalei Reference Sears and Savalei2006). It holds that the most salient symbols in a political controversy determine which predispositions are evoked. By highlighting the use of salient symbols in shaping attitudes, theories of symbolic politics provide one building block for the politicized places hypothesis developed here.
At the same time, the politicized places hypothesis contributes to past theorizing by specifying the conditions of everyday life that make symbols or rhetoric more or less influential.Footnote 5 Past research has also shown that the media can play a key role in politicizing day-to-day experiences (Iyengar and Kinder Reference Iyengar and Kinder1987; Kinder Reference Kinder1998; Mutz Reference Mutz1994). Given that, the central claim of the politicized places hypothesis is that at times when rhetoric related to immigrants is highly salient nationally, those witnessing influxes of immigrants locally will find it easier to draw political conclusions from their experiences. This approach seems especially applicable in this case since Americans may not have well-developed attitudes on immigrants a priori, and might thus be susceptible to framing (Chong and Druckman Reference Chong and Druckman2007). And it can explain how a relatively steady stream of immigrants produces anti-immigrant actions clustered in time and space. Typically, media effects are thought of as separate from contextual effects rooted in day-to-day experiences, since they operate through quite distinctive channels (e.g., Gamson Reference Gamson1992; Mutz Reference Mutz1992). Yet the politicized places hypothesis undercuts that dualism by contending that the media can play a key role in politicizing local demographic changes.
As opposed to theories of realistic group conflict, the politicized places hypothesis posits that changes in demographics will lead to political hostility in affected places. The overwhelming majority of past work has focused on levels of local immigrant populations. Yet one challenge with studying levels is that contact theory, self-selection, and intergroup threat yield cross-cutting predictions (e.g., Stein, Post, and Rinden Reference Stein, Post and Rinden2000). If we observe that living near a large immigrant population is uncorrelated with a respondent's attitudes, is that because the contextual measure does not matter or because these mechanisms offset one another? Theorizing based on change is less prone to cross-cutting effects. While it is conceivable that sudden demographic changes could induce intergroup contact (Pettigrew Reference Pettigrew1998), the historical record is quite consistent in showing negative responses to the sudden arrival of an outgroup (e.g., Horton Reference Horton1995; Kruse Reference Kruse2005; Lassiter Reference Lassiter2006; Self Reference Self2003; Sugrue Reference Sugrue1996). The politicized places approach further predicts temporal variation in contextual effects where past approaches have predicted effects that are consistent, at least over the span of several years. And instead of looking to national economic conditions as a key source of temporal variation (Barkan Reference Barkan2003; Higham Reference Higham1992), it posits that contextual effects will vary with the national salience of immigration. For Schmitt (Reference Schmitt1976), the friend–enemy distinction defines politics; for the hypothesis advanced here, national politics indicates who one's local friends and enemies might be. We turn now to testing these propositions, first with survey data and then with community-level data on anti-immigrant ordinances in U.S. localities.
MEASURING CONTEXTS AND ATTITUDES
The politicized places hypothesis indicates how local and national conditions might interact to change attitudes. National political rhetoric could call attention to certain aspects of people's day-to-day environments, effectively politicizing them. Testing that possibility requires data from many sources, including surveys, newspapers, television transcripts, and local political processes. This section begins the empirical analysis by discussing the survey data.
Scholars of contextual effects typically choose between data sets that contain detailed contextual information for respondents in a small number of communities (e.g., Huckfeldt and Sprague Reference Huckfeldt and Sprague1995) or else geocoded national data sets with fewer contextual measures. Yet the latter provide more contextual variation, and—critically for this article—they allow for comparisons of contextual effects over time. The first analysis makes use of all available, nationally representative surveys about politics and public affairs which included the same question about levels of immigration. To be included, surveys had to make county-level geocodes available as well. This encompasses eleven surveys: the 1994, 1996, and 2000 GSS; the 1992, 1994, 1996, 1998, 2000, and 2004 NES; the 2006 SCCBS; and the 2009 KN. The first two are cross-sections of U.S. adults conducted face to face. The GSS is administered in the late winter, whereas the NES is administered in the fall. The SCCBS is a phone survey that was conducted twice: once in the late summer and fall of 2000, and again in the first half of 2006.Footnote 6 Only the 2006 SCCBS asked the comparable question about preferred levels of immigration. Here, we use the nationally representative subsample of 2,741 respondents.
The KN survey was conducted specifically to add additional longitudinal variation to these analyses. It embedded a single question about immigration in a broader omnibus survey conducted on a subset of the KN panel from February 19 to February 23, 2009.Footnote 7 All variables were checked to ensure comparability across surveys, and were recoded to have the same range and polarity. Table A.1 in the Appendix describes key variables in the most recent year available for each survey.Footnote 8
The choice of the relevant contextual unit is a perpetual question. Some contextual processes are likely to act in very small geographic areas, while others might act over a county, a metropolitan area, or even a state (Oliver and Wong Reference Oliver and Wong2003). Given that the key mechanisms identified previously are based on local perceptions and casual encounters, this analysis uses the smallest contextual units available, which are counties (in most cases) and ZIP codes (for the September 11 analyses).Footnote 9 For the 2006 national sample, the median respondent lived in a ZIP code of 26,140 people and a county of 255,842 people. The “Measuring Context” section probes the sensitivity of the results to different measures of the local environment.
SALIENCE AND CONTEXT: 1992–2009
The core hypothesis is that people living in changing communities will have more negative attitudes on immigration provided that immigration is nationally salient, and thus that frames related to immigration are available to politicize people's day-to-day experiences. This section provides initial evidence for those claims using a pooled data set of eleven surveys conducted from 1992 to 2009. It shows that the results hold across a wide variety of salience measures and model specifications. It is interested not in overall levels of anti-immigrant sentiment, but instead in how the distribution of anti-immigration sentiment across U.S. communities varies over time.
To measure the salience of immigration, we created an index of monthly mentions of immigration by two network news programs (ABC News and CBS News) and the country's most widely circulated newspaper (USA Today).Footnote 10 Specifically, we used the Vanderbilt Television News Archive and the LexisNexis database to identify all stories mentioning “immigration” or “immigrants” for each month from January 1992 through February 2009. The average number of immigration-related stories per month for ABC during the 1992–2009 period is 1.8. For CBS, the figure is 2.0, and for USA Today it is 38.1. The analysis constructs a salience measure for each month t as follows: (number of ABC stories)/1.8 + (number of CBS stories)/2.0 + (number of USA Today stories)/38.1. This index equally weights the three outlets. Its average is thus 3.0 by construction, with a standard deviation of 2.77 and a one-month maximum of 19.0. Alternate measures of salience and measures of the frames surrounding immigration are detailed below and in the Appendix.
Figure 1 plots the index to illustrate how closely it matches our expectations for this volatile issue. Immigration issues were highly salient in the early and mid-1990s (Barkan Reference Barkan2003; Tichenor Reference Tichenor2002, 14), at the time of the North American Free Trade Agreement, a Haitian refugee crisis, a Cuban refugee crisis, and California's Proposition 187 (which barred undocumented immigrants from public assistance). Newspapers during this period commonly referred to the “wave of anti-immigrant sentiment”(Flores Reference Flores1993). Immigration then disappeared from public attention in the late 1990s, with the New York Times calling the 1998 mood “muted” (Barkan Reference Barkan2003, 268). The issue returned to prominence briefly in early 2000 (owing to the Elian Gonzalez controversy) and in late 2001 (owing to the September 11 terrorist attacks), and then more powerfully in 2006 and 2007. Those final bursts of salience were driven by Congressional consideration of immigration proposals as well as the highly publicized rallies of immigrants. By 2008, the issue had again returned to the backburner. The salience of immigration varies considerably over this period, providing a clear opportunity to test the “politicized places” approach. By studying this period, we can also differentiate national salience from national economic conditions, as the bottom panel of Figure 1 makes clear. It presents the national unemployment rate by month. Although theoretical approaches grounded in realistic conflict predict that the salience of immigration is closely related to national economic conditions, during this 18-year span, the Pearson's correlation is actually −0.13.
(Top) National salience of immigration; (Bottom) National unemployment rate

Measuring Local Demographics
To measure whether local contextual influence varied along with national salience, this section models support for immigration in a pooled data set with 15,851 respondents living in 1,908 different counties. Together, the eleven surveys used here include interviews conducted in 39 separate months.Footnote 11 The key contextual variable is the change in the county's percent immigrant. Here, we discuss how best to measure it.
The vast majority of analyses of local context rely on the decennial U.S. Census. Yet even if we add the 2006 American Community Survey, which provides estimates for 78% of the U.S. population, we still observe county-level immigration at just four points in time: 1980, 1990, 2000, and 2006. In the following analyses, surveys taken in years zero through six of the Census cycle use the prior two Census years to measure demographics and changes. For example, the 2004 survey is matched to local demographics in 1990 and 2000. Surveys taken in years eight or nine use the subsequent Census (or American Community Survey data), so the 1998 NES measures the change from 1990 to 2000 as well. The results reported here are not sensitive to these specific thresholds. Still, this empirical strategy raises a key question: can observations from these four years provide an accurate representation of local demographic changes? This question takes on special importance when studying recent years, as immigrants have increasingly bypassed the traditional gateway cities in favor of new immigrant destinations (Frey Reference Frey2006; McConnell Reference McConnell2008). The potential measurement error might lead us to understate the full impact of demographic changes.
Our ability to measure local demographic changes using Census data hinges on the year-to-year variation in these changes. If counties show rapid fluctuations in year-to-year immigrant inflows, Census-based measures will prove inadequate. However, the initial evidence shows the reverse: even over decades, inflows show impressive stability. Weighting counties by population, we find that the correlation between county-level immigrant inflow in the 1980s and 1990s is 0.62. Put another way, of the 782 U.S. counties that saw inflows above the 75th percentile in the 1980s, 57% of them remained above the 75th percentile in the 1990s, and 74% were above the median. Even for the 1990s and the six years from 2000 to 2006, a period of dispersion to new immigrant destinations, the correlation is 0.47. Given research on chain migration and the role of immigrant social networks in facilitating migration (e.g., Massey et al. Reference Massey, Alarcon, Dura and Gonzalez1987; McConnell Reference McConnell2008), these strong correlations across decades are not surprising. For both economic and social reasons, today's immigrants follow in the footsteps of yesterday's immigrants, making use of preexisting networks to find homes and jobs. This induces stable patterns of change over time.
Of course, the threat to validity here is the possibility of low correlations within a decade, so the results on cross-decade correlations provide a conservative test of the stability of immigrant inflows. The Appendix thus turns to annual data for 157 large counties compiled from the Current Population Survey (CPS) to further validate the Census-based approach adopted here. The critical result: an interpolation using just three years of county-level immigration data correlates with an annual time series covering all 13 years of CPS data at 0.78 on average.Footnote 12 Measuring county-level immigrant populations using observations every six to ten years is clearly an approximation, but it still captures the key trends within counties.
The fact that county-level change is stable over time reduces our concerns about mismeasurement, but it raises a second potential problem—can we differentiate large immigrant populations from growing immigrant populations? Across U.S. counties, the Pearson's correlation between the 1990 percent immigrant and the change over the 1990s is 0.43. For 2000 and the change between 2000 and 2006, the comparable correlation is 0.25. In short, counties with large immigrant populations tend to see those populations grow over the period in question, but the relationship is weaker than the relationship between changes over time, and it is far from deterministic. At first glance, these results might seem to undercut the notions of chain migration just invoked. But during this period, chain migration seems to operate more in flows than in stocks. Put differently, the places that facilitated immigrant growth in one year typically continued to do so in the next, but not all communities with large immigrant populations attracted continued migration. For example, Washington County in northwest Arkansas saw its immigrant population grow briskly from a baseline of 1.6% in both the 1990s and the early 2000s. It remained a popular destination throughout this period. In contrast, 36.2% of Los Angeles residents were foreign born in 2000, but that number actually declined slightly in the subsequent six years.Footnote 13
Figure 2 presents a U.S. map emphasizing those fast-changing counties that drive the results that follow. By using the residuals from a regression of 1990s changes on the 1990 share of immigrants, it illustrates the counties where the immigrant population grew more rapidly than expected based on their initial share of immigrants. If we consider the largest 5% of residuals, for example, we see that the counties where the immigrant growth exceeds baseline levels by the most are concentrated in the South and West. Twelve percent of these counties are in Texas, 11% are in Florida, 10% are in North Carolina, 10% are in Kansas, and 8% are in Colorado. Foreign-born immigrants respond to the same incentives as migrants overall: the Pearson's correlation between the change in the percent foreign born and the logged total change in population is 0.37. As with all county-level maps, it is important to note that counties vary markedly in population and size, and that states vary in their number of counties.
U.S. Counties Where 1990–2000 Growth in Immigrant Population Outpaced Expectations

Models
As an initial measure of immigration's salience, the analysis matches each respondent to the average level of immigration coverage in the six months prior to the respondent's interview. Missing data were multiply imputed (King et al. Reference King, Honaker, Joseph and Scheve2001; Schafer Reference Schafer1997), although the results are not sensitive to this choice.Footnote 14
The dependent variable is 0 for the 54% of respondents who want to decrease immigration and 1 for others. This dependent variable is measured in all surveys (except the 2000 SCCBS) with the question: “Do you think the number of immigrants to America nowadays should be increased a lot, increased a little, remain the same as it is, reduced a little, or reduced a lot?”Footnote 15 As others have noted (Schildkraut Reference Schildkraut2009), the five-category variable is quite skewed, with only 2.9% of respondents advocating increasing immigration “a lot” and another 5.6% advocating increasing immigration “a little.” For the following analyses, if the person reports “increased a lot,” “increased a little,” or “remain the same,” the dependent variable is 1. If the person reports “reduced a little” or “reduced a lot,” the dependent variable is 0.
Δ indicates the change from time t − 1 to time t, where the survey is administered at or after time t. Immig is share of immigrants in the respondent's county at the time of the survey. Formally, we model the attitude of respondent i in survey j as

where πi,j is the conditional expectation of the dependent variable. The parameters are typically indexed by j, indicating that the model estimates a separate coefficient for each survey. This is a general modeling approaching that is similar to estimating separate models for each survey j. Since all of the models allow the impact of local levels of immigration to vary by survey, these separate β4j help differentiate the changing impact of demographic changes from any over-time heterogeneity in the impact of levels. However, β3—the parameter measuring the interaction of national salience and the county's immigrant inflow—is fixed across surveys. The final term, X ij × β5j, incorporates any additional covariates. The dependent variable is binary, so we use a logistic function. All models cluster the standard errors by county-year (Wooldridge Reference Wooldridge2003).Footnote 16
Attentive to concerns about highly saturated models (Achen Reference Achen2005), the analysis first estimated the previous model with a small number of key covariates: the county's immigrant population, the change in its immigrant population, its share of residents with a bachelor's degree, and the individual's years of education. Although the analyses do not focus on levels of immigration, they certainly should condition on them in light of the past theorizing as well as the correlation between levels and changes.Footnote 17 Education and aggregate education are perhaps the most consistent predictors of immigration attitudes across analyses (e.g., Hainmueller and Hiscox Reference Hainmueller and Hiscox2007; Mayda Reference Mayda2006). Given that we estimate a separate coefficient for each variable in each of the eleven surveys, even this sparse model uses 47 degrees of freedom. Table 1's first row presents the estimated interaction effect, along with the p value that the interaction is zero (p = .01). There is a strong negative interaction between salience and residence in a changing county. When immigration is a high-profile issue nationally, living in a changing local context is more strongly related to anti-immigration attitudes. The model specification includes separate intercepts for each survey, ruling out the possibility that these results are driven by question order or house effects specific to one type of survey. The full estimated model is available in Table A.2 in the Appendix. It demonstrates the unstable relationship between levels of local immigrants and attitudes alongside the powerful interaction effect.
Interaction Effects and Their Corresponding Predicted Probabilities

Notes: This table presents the interaction effects and their corresponding predicted probabilities extracted from several logistic regressions. The predicted probabilities indicate the increased chance that a respondent opposes additional immigration. For example, the first row shows a significant negative interaction between immigration's salience and local immigrant inflows. When immigration is a prominent national issue, the gap in attitudes toward immigration between respondents in changing counties and those in static counties grows by 9.8 percentage points.
The analysis then simulated the impact of shifting from the 5th percentile respondent's county to the 95th percentile respondent's county at a time when immigration was receiving little national attention.Footnote 18 Averaging across the years, we see that when immigration is not generating many headlines, the attitudes of people in changing counties are almost identical. People in rapidly changing counties are just one-tenth of a percentage point more likely to want to decrease immigration. Yet, during a period of high salience, the same contextual difference is associated with a much larger attitudinal difference of 9.9 percentage points. The 95% confidence interval now runs from 3.6 to 16.2 percentage points. That mean effect is 20% of the dependent variable's standard deviation (49.8 percentage points), and is a sizable impact. During high salience periods, the influence of living in a changing county increases by 9.8 percentage points, a figure given in the final column of Table 1.Footnote 19 In fact, the impact is noteworthy even when compared to the 21.3 percentage point swing in average national proimmigration sentiment from its minimum (34.6% in late 1994) to its maximum (55.9% in late 2000).
To further explore the substantive impacts, the analysis then used the model to calculate predicted probabilities for twenty scenarios, varying both the level of salience and the size of the demographic change. To ensure that the scenarios are plausible, we consider the minimum and maximum levels of salience observed in two discrete years: 1994 and 2006. In 1994, salience in the prior six months spiked from its 50th (2.8) to its 95th percentile (6.4); in 2006, it moved from its 30th percentile (1.7) to its maximum (9.2). The analysis also estimated predicted probabilities for a range of demographic shocks, from the 5th percentile respondent's county (e.g., Allegheny County, Pennsylvania, with a very slight decline of 0.7 percentage points in its immigrant share) to the 95th percentile respondent's county (e.g., Durham County, North Carolina, with a 7.4 percentage point increase).Footnote 20 The results are given in Table 2.
Probabilitites of Proimmigration Views for Different Scenarios

Notes: Using the basic logistic regression model fit for 15,851 respondents, this table provides simulated probabilities of giving proimmigration views under a range of scenarios for the change in the immigrant share (columns) and the salience of immigration (rows). Examples of counties with demographic shifts of that size are given in parentheses.
As Table 2 makes clear, the expected difference between changing and static counties grows far larger when immigration is salient in national politics.Footnote 21 For example, in the 1994 low-salience scenario, people in fast-changing counties are 7.3 percentage points less likely to hold proimmigration views than those in static counties. But when its salience is high, the gap becomes 15.1 percentage points. These estimates, combined with the map in Figure 2, suggest that national attention to immigration will catalyze anti-immigration sentiment in rapidly changing areas like North Carolina, Florida, and Colorado, while having an offsetting effect in Ohio, upstate New York, and other places without comparable influxes.
Concerns about selection bias commonly plague estimates of local contextual effects. When observing a correlation between someone's local environment and his or individual attitudes, it is often impossible to know whether that correlation was induced by the local context or associated with the factors that led her to live in that context. But since we estimate the change in a contextual effect given a sudden shift in salience, ongoing processes of residential selection are effectively held constant. Selection biases cannot explain why a context would be correlated with attitudes at one point in time but not soon after.
Alternative Measures and Models
Are these estimates sensitive to the choices outlined previously? To probe their robustness, the analyses reestimated the model using differing lagged lengths of the original salience measure, as shown in the subsequent rows of Table 1. Although the variance of the estimated interaction effect increases relative to its magnitude, leading to slightly higher p values, the results remain substantively and statistically significant with varying lags. For example, when the lag is three months, the impact grows by an estimated is 9.3 percentage points, with a 95% confidence interval from 0.3 percentage points to 18.2 percentage points. The broad conclusions drawn previously are not sensitive to assumptions about lags.Footnote 22
One might also wonder if the effect is driven by particular immigrant groups. Local changes in immigrant populations overall are highly correlated with both Hispanic inflows (Pearson's r = 0.81) and Asian American inflows (Pearson's r = 0.69). As of 2003, these groups accounted for 53% and 25% of the U.S. foreign-born population, respectively, making them key groups with which to start. When we modify the sparse model to include separate terms for the local Hispanic and Asian-descended populations, both show negative, near-significant interactions with the salience of immigration.Footnote 23 Both ethnic groups appear to produce reactions in line with the notion of politicized places, but given the limits of the data, we cannot know if the impact of salience differs systematically by group. However, the same approach does illustrate that the effect is not driven by general population loss or gains: the core interaction remains (p = .03, two-sided test) when we also interact the county's population change with immigration's national salience.
By looking at changes in contextual effects over time, we eliminate the threat from omitted variables with constant effects, but not from omitted variables with time-varying impacts. We thus estimated a model with considerably more independent variables. The new model adds individual-level variables that are commonly employed in survey analyses, including the respondent's gender, logged income, party identification, ideology, Hispanic ethnicity, black identification, age, age squared, and residence in a metropolitan area. In addition, at the aggregate level, the model conditions on the county's logged population, its change in logged population, its logged population density, its percent black, its logged median household income, and its unemployment rate in the surveyed year. All of these coefficients are allowed to vary by survey, creating a highly flexible model. Together, these covariates cover a wide range of alternative explanations, including the possibility that local economic conditions are driving the results. They also allow us to rule out the possibility that the results are driven by disproportionate numbers of conservatives or Republicans in rapidly changing counties. The interaction effect from this full model is given in Table 1, and again shows strong evidence of an interaction between national salience and local demographic changes. The resulting estimate is an increased impact of 8.3 percentage points in high salience periods, with a 95% confidence interval from −1.9 percentage points to 18.5 percentage points.Footnote 24 The central interaction holds even conditional on county-level fixed effects that isolate within-county variation (β = −1.07, SE = 0.57, p = .06, two-sided test).Footnote 25 The appendix shows that the interaction also holds when measuring the content of immigration coverage. Again and again, we see that changing contexts have variable impacts.
Alternative Explanations
The national salience of immigration is certainly not the only factor that varies across the 39 surveyed months, so the analysis also considered alternative, time-varying explanations. Drawing on theories of economic conflict (e.g., Scheve and Slaughter Reference Scheve and Slaughter2001) and of sociotropic economic thinking (e.g., Citrin et al. Reference Citrin, Green, Muste and Wong1997), one might suspect that when national economic conditions are poor, people will be more concerned about local demographic changes. We thus estimated an alternate version of the full model above including an interaction between county-level immigrant inflows and the national unemployment rate, measured monthly by the Bureau of Labor Statistics. The national unemployment rate itself proves a strong predictor of wanting to decrease immigration, but the interaction between the unemployment rate and local changes never approaches significance (β = −0.48, SE = 1.27). Nor does the change in national gross domestic product (GDP) over the past year interact with local immigrant inflows: there, the estimated coefficient is −0.13, with a standard error of 0.09. Another threat to validity is that the surveys differ in the time that has elapsed since the Census or American Community Survey. But even if we measure that gap and interact it with the change in the percent immigrant, we find no strong interaction effect (β = 3.6, SE = 2.6). Moreover, in none of these cases do we observe significant changes in the interaction between salience and local demographic changes.
Levels and changes in the local immigrant population share are correlated, so an additional analysis investigates whether salience interacts with levels of local immigrant populations rather than with changes in those populations. To address this possibility, the analysis reestimated the basic model by including an interaction between local immigration levels and national salience instead of the interaction with changes, and by allowing the change coefficients to vary by survey.Footnote 26 In this model, we again find a negative interaction, albeit one that is not quite statistically significant (β = −0.26, SE = 0.14, two-sided p value = 0.07).Footnote 27 However, this result is far more sensitive to specification than the change interaction: it becomes both substantively and statistically insignificant if we instead measure frames (β = −0.007, SE = 0.27) or use a three-month lag in the salience measure (β = −0.09, SE = 0.09). In short, in this particular example, there is some evidence that levels of immigration can be politicized, but that evidence is less certain and less consistent than the evidence on changes.
One additional threat to validity comes from the possibility of endogeneity in the salience of immigration. If immigration becomes salient because changing communities express concern about it, the causal arrow would be reversed. However, the six-month lag structure employed previously makes it highly unlikely that this form of endogeneity explains those results: salience is measured months prior to reported attitudes. This form of endogeneity becomes even less credible when we consider the difference between what is being explained here and what is likely to feed the salience of immigration as a national issue. This article is concerned not with overall levels of proimmigrant sentiment, but instead with the extent to which places with changing demographics generate distinctive attitudes toward immigrants. It seems far more likely that if coverage were following trends in public opinion, it would track public opinion overall, rather than the opinions of those in fast-changing communities. None of the time-varying alternative explanations considered here is compelling.
THE SHORT-LIVED SEPTEMBER 11 EFFECT
A combination of national salience and local demographic change can lead to increased support for restrictionism. This section reinforces that finding by using the 2000–2002 SCCBS panel to demonstrate the marked but short-lived effect of September 11. This analysis is especially valuable because the shift in national rhetoric was obviously exogenous and because the panel data allow us to eliminate residential selection as an alternative explanation.
The September 11 terrorist attacks transformed American public debates about immigration and were clearly unrelated to what was going on in national or local politics. In the wake of the attacks, immigration returned to the national agenda, as many commentators and politicians linked immigration to issues of national security. The index of immigration's salience was below its mean for the first eight months of 2001, before spiking to its 94th percentile in September 2001. USA Today mentioned the word “immigration” an average of 13 times in the first eight months of 2001, with 35 mentions on average in the three months immediately after the attacks. Variants of the word “security” appeared in 16% of USA Today articles about immigration from January to August 2001, but 47% of articles for the remainder of the year, a clear indication of the corresponding shift in frame. Immigration suddenly became an issue of student visas, porous borders, and domestic threats. Yet, the effect was also short lived, with immigration then beginning to recede from the agenda early in 2002. By the first three months of 2002, the salience index had fallen back below its mean.
In the previous pooled analyses, the critical events from the Fall of 2000 until the Fall of 2004 are not covered due to lack of comparable survey data. But with follow-up panels in October 2001 and March 2002, the national sample of the 2000 SCCBS is uniquely situated to fill in these gaps and test the impact of the exogenous changes in salience. As we saw previously, over-time or panel data are especially valuable because they allow us to eliminate the alternative explanation of residential selection. If there are underlying factors that are related to both people's choice of community and their attitudes toward immigration, those factors will be captured in the first survey. In fact, the same logic holds for any alternative explanation that points to events that occurred prior to the first wave of the survey.
In addition, these surveys help us differentiate the impact of immigration's general salience from national economic conditions, another potential national-level influence commonly linked to immigration attitudes (Barkan Reference Barkan2003; Citrin et al. Reference Citrin, Green, Muste and Wong1997, Higham Reference Higham1992). Over this period, salience and national economic conditions move in different directions, since unemployment remained relatively high throughout 2002, peaking at 6.3% in June 2003, whereas the salience of immigration declined after its December 2001 high. Attitude changes that were strongest in Fall 2001 would suggest that salience is the relevant national factor, whereas attitude changes that persisted into 2002 would suggest that national economic conditions are key.
The 2000 SCCBS included only one question about immigration, in which respondents were asked to agree or disagree that “immigrants are getting too demanding in their push for rights.” This question, which measures the political threat posed by immigrants, correlates with favoring immigration restriction at 0.41 in 2006. To the extent that the politicized places approach can explain variation in political threat as well as preferred levels of immigration, it is yet more evidence of the broad applicability of the hypothesis. In Fall 2000, 2,649 respondents provided an initial opinion. In October 2001, 699 respondents answered this question, 448 of whom were reinterviews. In March 2002, 758 respondents answered this question, 368 of whom had also been surveyed in Fall 2000. The data offer a rare opportunity to track the changing correlates of public opinion over the attacks. The analysis used three separate ordered probit models to predict responses in Fall 2000, October 2001, and March 2002. The covariates are almost identical to those used in the previous full model.Footnote 28
The left side of Figure 3 presents the resulting predicted probabilities from separate models, given a shift in the key independent variable from its 5th to its 95th percentile. That independent variable is the change in the county's percent immigrant from 1990 to 2000. Its 5th percentile is a county that is essentially static, with a 0.07 percentage point decline in its foreign-born share. The 95th percentile indicates a county where the percent foreign born increased by 8.5 percentage points. For each of the three estimated effects, Figure 3 provides the probability that the effect is positive. In October 2001, with September 11 just a month before, those respondents in changing communities were dramatically more likely to strongly agree that immigrants are too demanding. The average effect is 23.7 percentage points, with a 95% confidence interval from 9.2 to 39.5 percentage points. At baseline in Fall 2000, there was no such effect. In fact, the estimated impact increases by 26.5 percentage points, with a 95% confidence interval from 11.0 to 43.1 percentage points. By subtracting one estimated impact from another, we remove residential self-selection and other biases that are fixed across surveys. We can reject the null hypothesis of a constant effect from Fall 2000 to October 2001 (p < .01, two-sided test). This result proves insensitive to a wide range of more sparse model specifications as well. Figure A.1 in the appendix provides graphical representations of the three full fitted models.
Predicting Agreement That Immigrants Are Getting Too Demanding Before and After September 11

The politicizing effect of September 11 was brief as well as big. As the immigration-related frames receded from public view, so, too, did the contextual effect. Just five months after September 11, after immigration's salience had declined, the median effect was a statistically insignificant 1.9 percentage points. This is shown in Figure 3. The corresponding estimate is a decreased impact of 21.5 percentage points on average: the effect is different in March 2002 than in October 2001, with a p value of .04 (two-sided test).Footnote 29
This pattern of findings is not consistent with the claim that national economic conditions are fueling the contextual effect, since the economy was no better in Spring 2002 than in Fall 2001. Instead, the national salience of immigration appears to have produced attitude changes in October 2001 that abated just five months later. All evidence indicates that we are observing a genuine if temporary attitude change that results from a confluence of local and national conditions. Contextual effects can appear and disappear quickly, in response to the changing salience of relevant frames.
Measuring Context
One common question facing contextual analyses is the appropriate geographic level of measurement. Different theories posit mechanisms acting at different geographic levels, from the neighborhood to the polity, the labor market, or the media market (Oliver and Wong Reference Oliver and Wong2003). On account of data availability across surveys, this article primarily focuses on counties. Still, the median respondent's county had 255,842 people in 2006, making counties a coarse measure of a local context. For the 2000–2002 SCCBS panel, however, we can test the sensitivity of the results to this choice. At the tract level, the 2000 share of immigrants is correlated with the county-level measure at 0.78. The correlation between tract and ZIP code is even higher, at 0.93.Footnote 30 These figures reflect immigrants' relative concentration in certain parts of the country and their lower levels of segregation within a given area (Fischer Reference Fischer2003). Given the high correlations for immigrants across geographic units, it is perhaps not surprising that when we replicate the previous results at the ZIP code level, we reach substantively similar conclusions. The right side of Figure 3 illustrates this finding. In October 2001, respondents living in rapidly changing ZIP codes were 13.4 percentage points more likely to strongly agree that immigrants are too demanding in their push for rights. The p value that this effect differs from Fall 2000 is less than .01, and the p value that the effect differs from March 2002 is .08. The median ZIP code has 26,140 residents, providing strong evidence that these conclusions are not sensitive to the choice of geographic unit.Footnote 31 Irrespective of how they are measured, places are more strongly predictive of attitudes when they have been politicized.
ANALYZING LOCAL ACTIONS
The politicized places hypothesis provides leverage on when localities consider anti-immigrant actions as well as individual attitude change. This section uses data on local anti-immigrant actions to further establish the role of demographic change in catalyzing anti-immigrant politics. Even conditional on the proportion of immigrants currently in the community, an increasing share of immigrants is a powerful predictor of which localities consider anti-immigrant policies. Certainly, the federal government retains sole responsibility for setting levels of immigration, but in recent years localities have taken unilateral action on a variety of immigrant-related issues, from schooling to zoning. Although we do not observe all of the politics of these proposals, they undoubtedly reflect the changing strategic landscape for local leaders on the issue of immigration.
The key dependent variable in these analyses is the consideration or passage of a local anti-immigrant ordinance by a U.S. municipality.Footnote 32 We identified these localities by searching LexisNexis for the joint appearance of “local” and “anti-immigrant” anywhere in articles appearing in 258 regional newspapers from 2000 to 2006. We then conducted a separate search for articles using “English only” in their headline or lead paragraph, a phrase common in articles describing localities considering making English their only or official language. We skimmed the resulting 3,378 articles to identify anti-immigrant proposals. For instance, towns such as Hazleton, Pennsylvania, passed measures mandating fines for those who employ or rent to undocumented immigrants, whereas others considered using zoning or policing to target undocumented immigrants. We also included symbolic measures, such as a mayor's request for a McDonald's to remove a Spanish-language billboard.
In all, this preliminary procedure led to the identification of 52 Census-designated places that had considered anti-immigrant proposals during this period. Fifty-eight percent of these ordinances were first discussed during or after Summer 2006, just after the issue had appeared on the national agenda. This timing offers another piece of evidence of the local aftershocks of a nationally salient issue. We can augment the first list for 2006 by adding a second list of 76 communities, available through FIRM (2007).Footnote 33Table 3 first compares the 108 localities to the other 22,758 U.S. localities in the data set. Those towns that considered anti-immigrant ordinances had more than three times as many immigrants proportional to the population—7% as opposed to 2%. They also appear to be wealthier, larger, and more transient, with fewer residents living in the same house in 1995 and 2000.
Descriptive Statistics for U.S. Localities

Notes: This table compares the 108 communities that considered anti-immigrant ordinances to all other census-designated places, as well as to 216 communities matched on 1990 demographics which did not consider anti-immigrant ordinances. The values reported are medians.
This comparison includes every Census-designated place in the U.S. To focus attention on those localities that are most comparable, to make the collection of additional data more efficient, and to avoid model dependence (Ho et al. Reference Ho, King, Imai and Stuart2007), the analysis then used genetic matching (Diamond and Sekhon Reference Diamond and Sekhon2008) to match the 108 localities that did take anti-immigrant actions to 216 highly similar communities that did not. Specifically, starting with the 108 communities, the analysis used a genetic algorithm to search for two matched communities that appear nearly identical on key independent variables but that did not go on to take anti-immigrant actions.Footnote 34 Such a matched comparison, also known as a case-control design (King and Zeng Reference King and Zeng2002), focuses our attention on the dynamic precursors of anti-immigrant actions, and it also allows us to collect additional political measures for this new, smaller sample. Table 3 compares the matched groups as of 2000, and demonstrates that they are generally similar even a decade after the matching.Footnote 35 This analysis holds constant 1990 levels of immigrants, meaning that it does not allow for tests of the relative predictive power of levels and changes. Instead, it provides an opportunity to confirm that changes influence local political outcomes as well as local attitudes.
To identify the dynamic factors that encourage anti-immigrant actions, the analysis then used logistic regression on the matched sample with each locality weighted by its probability of inclusion. The independent variables test common approaches to explaining local anti-immigrant outcomes. For instance, to test the prediction that anti-immigrant proposals stem from local competition over resources (Olzak Reference Olzak1992, 37), the model included measures of logged median household income and unemployment rates, as well as their changes from 1990 to 2000. The politicized places approach, in contrast, posits that in periods of high salience, sudden demographic change can influence attitudes on related issues. The model thus includes both the level and change in the percent immigrant. The model also conditions on the percent and change in the percent African American, as well as home ownership, population density, and partisanship (Ramakrishnan and Wong Reference Ramakrishnan, Wong and Varsanyi2010).Footnote 36 Since we might expect economic decline to generate anti-immigrant fervor only in places where there are sufficient immigrants, the model also includes an interaction between changing unemployment and the baseline percent immigrant.Footnote 37 This is a data set matched on 1990 measures, so the impact of changes since 1990 is of primary interest.
Table 4 presents the results. The first two columns present the coefficient and standard error from the logistic regression. The third and fourth columns provide the mean in-sample probability of considering an anti-immigrant measure given that the independent variable in question is set at its 10th percentile or 90th percentile, respectively, with all others set at their means.Footnote 38 The final two columns provide the predicted probabilities of considering an anti-immigrant proposal for the population of all U.S. localities, which involves correcting to account for the population incidence as outlined in King and Zeng Reference King and Zeng2002. Communities that saw relative declines in household income from 1990 to 2000 were more likely to consider anti-immigrant proposals, in keeping with the notion that resource scarcity might turn native-born Americans against immigrants. The impact of rising relative unemployment rates from 1991 to 2000 is contingent on the local percent immigrant, as shown by the interaction term.Footnote 39 Where there are no immigrants, rising relative unemployment decreases the probability of considering anti-immigrant action sharply. As depicted in Table 4, in a community with an average level of immigrants for this sample (11%), rising relative unemployment has a slight dampening effect, reducing the probability of considering an anti-immigrant action from .52 to .45. In communities where more than 20% of the residents are immigrants, rising relative unemployment increases the probability of considering an anti-immigrant ordinance. Rising unemployment has a stronger positive relationship with anti-immigrant ordinances in the presence of immigrants. Yet, we should not conclude that resource scarcity alone explains anti-immigrant ordinances, since on net, communities with few immigrants and falling unemployment consider ordinances 0.72 of the time, whereas those with many immigrants and stable unemployment levels consider ordinances 0.54 of the time.
Logistic Regression Predicting Local Anti-immigrant Ordinances

Note: This table presents the results of a single logistic regression estimated for the matched sample of 108 towns that considered anti-immigrant proposals and 216 towns that did not. The first two columns present the coefficients and standard errors. The second two columns are mean predicted probabilities when we shift the key variable from its 10th to its 90th. The final columns correct the predicted probabilities given the overall prevalence of anti-immigrant proposals.
When the change in unemployment is held at its mean, higher levels of immigrants actually depress anti-immigrant ordinances, reducing the probability of considering an ordinance from .55 to .37 within this sample. Looking instead at changing demographics, we see that communities with comparable shares of immigrants in 2000 still differ based on the speed with which those immigrants arrived. Shifting from a community with no change in its share of immigrants to one with an eight percentage point increase, we should expect the probability of considering an anti-immigrant proposal to double, from .34 to .66. Changes again prove conducive to threatened responses, providing yet more evidence for the politicized places approach.
How robust are these results? They hold up when estimated with a multilevel logistic regression allowing for state-level random effects, ensuring that these results are not artifacts of state-level variation or clustering. Another consideration is community associations, since they might facilitate community integration and reduce the tensions associated with an influx of immigrants (Deufel Reference Deufel2006, chapter 9). Yet, models not shown also included measures of county-level associational density in 1990 and the change from 1990 to 1997, demonstrating no substantive difference in the results.Footnote 40
Another possibility is that anti-immigrant ordinances are motivated by rising crime rates, an argument that has been advanced by defenders of Hazleton's recent ordinance. Yet, strikingly, places with higher crime rates as of 1999 prove less likely to consider anti-immigrant ordinances. Localities in counties with 1,940 crimes per 100,000 people in 1999 had a .54 probability of considering an anti-immigrant ordinance, whereas localities with 6,347 crimes per 100,000 people had a .43 probability. Those are the 10th and 90th percentiles, respectively. Far from encouraging anti-immigrant ordinances, high county-level crime rates do the opposite, perhaps by reconfiguring local agendas. Overall, the locality-level results echo key findings from the individual-level analysis. Under certain conditions, demographic changes can induce anti-immigrant politics.
As a final test, the analysis considers whether these relationships grew stronger during a high salience period. The data analyzed previously combine two sources of information on local anti-immigrant ordinances. The second of those sources—the FIRM subset—covers only a single year, and lacks variation in both time and immigration's national salience. Still, for the 52 localities in the subset gathered through LexisNexis, breaking out the impact of demographic changes by year is informative, since immigration became a hotly contested issue in the early months of 2006. Of the 52 local ordinances in the LexisNexis subset, 25 were proposed before 2006. Consider the impact of a shift from the 10th to the 90th percentile on these pre-2006 places that considered ordinances and their matched controls.Footnote 41 In that subgroup of 75 observations—25 treated, 50 control—such a shift in the immigrant population's growth leads to a 23.8 percentage point increase in the probability of considering an anti-immigrant ordinance. Using the same procedure for the 27 places that considered ordinances in 2006 and their matched controls, however, we see a much stronger relationship of 48.9 percentage points. In 2006, localities with fast-growing immigrant populations were far more likely to consider anti-immigrant ordinances. The estimated effect during 2006 is larger than that for the previous years in 91% of simulations, yielding a 95% confidence interval for the increased effect from −13.8 to 59.4 percentage points. To be sure, there are limits to what we can learn from a handful of ordinances, as the wide confidence intervals make clear. But again, we see that local anti-immigrant political activity comes from rapidly changing places, especially at times when immigration is capturing national headlines.
CONCLUSION
Scholars have often concluded that Americans' ethnic and racial surroundings influence their attitudes and political behavior. Yet, the politicized places hypothesis provides a different approach, one that suggests that contextual effects are far less ubiquitous. Those who live near larger proportions of immigrants do not consistently exhibit more negative attitudes. Instead, at least as far as immigrants are concerned, people respond to the demographics of their communities only under specific circumstances. When faced with a sudden, destabilizing change in local demographics, and when salient national rhetoric politicizes that demographic change, people's views turn anti-immigrant. In other conditions, local demographics might go largely unnoticed, or else might remain depoliticized. This study departs from past work on local encounters primarily in its emphasis on the pace of demographic change and on the availability of external, politicizing agents. It also departs from past work by its characterization that as far as immigrants are concerned, threatened responses are best thought of as a product of exceptional times, and not as the norm.
This approach could be useful in explaining local responses to other social groups. The hypothesis advanced here operates on the assumption that local encounters are not political unless available frames help make them so. Racial cleavages have varied markedly in their framing over time (e.g., Kellstedt Reference Kellstedt2003), making them an obvious potential extension. Class cleavages are another. Yet, in extending the hypothesis, it is important to acknowledge that it is likely to be differentially applicable. Some social cleavages might not follow these patterns because they lack prominent nationwide frames or because those frames have no obvious connections to local demographics. Others, perhaps including racial cleavages, might not follow this pattern because the accompanying frames are so prevalent as to not need any priming by the media. For politicized places to operate, the cleavage needs to be amenable to framing but not consistently framed. We should also acknowledge the possibility that in some cases, it is not social cleavages but specific issues that might be politicized. For instance, it is quite conceivable that the local politics of taxation differ during periods when taxes are salient nationally versus when they are not.
Scholars of the local politics of immigration have focused on explaining cross-sectional variation, whereas those interested in the national level have paid more attention to over-time variation (e.g., Tichenor Reference Tichenor2002). By incorporating both, the politicized places approach provides a way to engage national and local trends simultaneously. For example, the results presented here seem to contradict Freeman (Reference Freeman1995), a national-level study that contends that opposition to immigration develops long after the immigrants' arrival. In this view, immigration's costs are diffuse and its benefits concentrated, making it difficult and time consuming for those opposed to immigration to mobilize. Yet, Freeman is discussing how immigration is incorporated into national politics, whereas this study focuses on when immigration becomes politicized locally. If anti-immigrant forces take years to mobilize and respond to immigration nationally, then immigration might become salient only decades after the arrival of the initial immigrants. We might thus expect increases in anti-immigrant politics when immigration has been high for some time nationally but geographically dispersed only recently.
Such is exactly the constellation of factors facing the contemporary U.S. Over time, immigration rises in national salience as the size of the immigrant population reaches a critical mass, as immigration's opponents become organized and vocal, and as political elites sense an opportunity. With the available political rhetoric, residents in changing communities can then respond to those demographic changes. Coupling national and local approaches in this way, we can also understand why some of the countries with the largest increases in their share of immigrants are not disproportionately anti-immigrant (Card, Dustmann, and Preston Reference Card, Dustmann and Preston2005). Often, national and local politics are conceptualized as separate and independent political arenas. The core claim underpinning the politicized places hypothesis is that the two interact: even day-to-day encounters can be shaped by salient national issues.
APPENDIX
Validating the Local Measures of Immigrants
For larger U.S. counties, we can further validate the proposed measures of changing local immigrant populations through the Current Population Survey (CPS). The monthly survey includes questions on place of birth and citizenship, and it provides county-level measures for respondents in larger counties beginning in 1996. In all, we observe county of residence and place of birth for 7.3 million respondents over this period, allowing researchers to estimate year-to-year variations for 157 counties covering 32% of the U.S. population. Since these are survey-based estimates of the percent immigrant, they come with sampling uncertainty averaging 0.5 percentage points per county-year. They also exhibit considerable noise: the correlations between changes in one year and changes in the subsequent year are typically negative, as we would expect with a noisy, mean-reverting measure.
One approach to validation is to compare the immigration estimates for each year when using the annual CPS time series to an interpolation based on only three data points—the earliest available (1996), a midpoint (2000), and the latest available (2008). If the three data points contain much of the information in the full time series for each county, we should expect a strong correlation between a loess smoothing line fit to the three points and another fit to all 13 points. Across the 157 counties, the median correlation between the smoothed lines is 0.78. Systematically, year-to-year fluctuations do not account for much of the variation in immigration populations over time. There are occasional counties where sizable year-to-year trends are missed by looking only at a few years (e.g., Sonoma County, California; Pinal County, Arizona), but such examples are significantly outweighed by the cases where the approximation works quite well.Footnote 42
Change in Agreement That Immigrants Are Too Demanding

Descriptive Statistics for Selected Surveys

Note: This table presents descriptive statistics for four exemplary data sets: the 2000 General Social Survey (n = 2,803); the 2004 National Election Study (n = 1,212); the nationally representative subset of the 2006 survey (n = 2,741); and the 2009 Knowledge Networks Survey (n = 1,155).
Logistic Regression Predicting Support for Immigration

Notes: This table presents the full-fitted logistic regression predicting whether a respondent wants to decrease immigration (0) or not (1). The data set pools 15,851 respondents from 11 nationally representative surveys conducted over 39 months. Standard errors are clustered by county and survey. “immig.” indicates the percent immigrant in the county.
Measuring Frames
The politicized places approach contends that people use salient frames to make sense of demographic changes in their communities. But the previous analyses focused exclusively on the salience of immigration, ignoring the question of how the issue was being framed. To address this issue, coders read the 1,090 USA Today articles indexed in LexisNexis, which used the terms “immigrants” or “immigration” in the six months preceding any month in which survey interviews took place. They identified which articles were relevant—that is, “centrally about contemporary immigration to the U.S. or immigrants within the U.S.”— and were then asked to identify each article's tone.Footnote 43 In the median month, 50% of the articles were negative in tone, whereas 25% were positive. This confirms others' findings that media coverage tends to focus on negative aspects of immigration (e.g., Brader, Valentino, and Suhay Reference Brader, Valentino and Suhay2008). In 73% of the months coded, negative coverage outweighs positive coverage.
We then created a new measure of the national media environment by interacting the salience of immigration over the prior six months with the share of coverage that was negative in tone. This allows us to explore the possibility that people are especially attentive to local demographic changes when the media coverage of immigration is prominent and negative. This measure is correlated with the original salience measure at 0.83, an indication that adding information on frames does not change the characterization of over-time variation substantially. Using the sparse model with this new measure, we again find a strong interaction: the mean estimate of increased impact is 17.8 percentage points, with a 95% confidence interval from 6.9 to 35.3 percentage points. This finding is quite compatible with the previous findings, but the associated uncertainty is such that we cannot draw conclusions about whether the tone of coverage matters above and beyond the fact that there is coverage at all. Still, throughout this period, the coverage of immigration is more negative than positive. Thus, when immigration is salient, there are likely to be sufficient negative frames to politicize local changes.
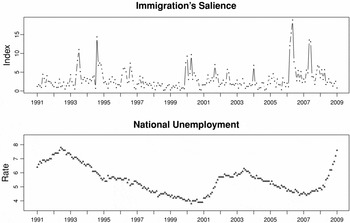
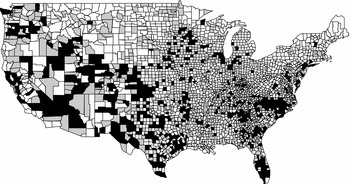
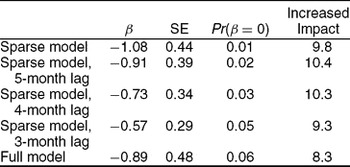

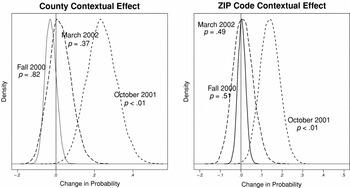
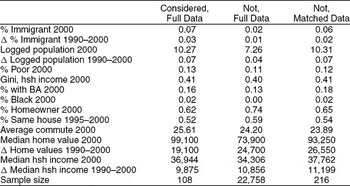
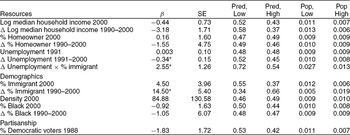
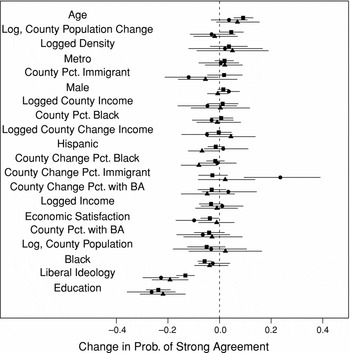
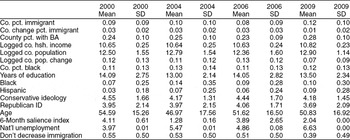
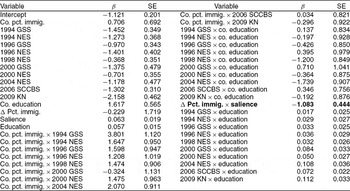



Comments
No Comments have been published for this article.