


1. Introduction
The investment decisions made by individuals have received increasing attention in the last years. There are both academic and policy reasons for this. Regarding the former, many times investment decisions seem to differ from what theory predicts. Indeed, theoretical models predict that rational agents should make their portfolio decisions taking into consideration factors such as their investment horizon (Merton, Reference Merton1969; Campbell and Viceira, Reference Campbell and Viceira2002; Viceira, Reference Viceira2008), human capital and expected volatility of wages (Cocco et al., Reference Cocco, Gomes and Maenhout2005; Gomes et al., Reference Gomes, Kotlikoff and Viceira2008), and other sources of wealth, such as housing (Browning and Crossley, Reference Browning and Crossley2001), among others. With respect to the latter, if investment decisions are non-rational or sub-optimal, this could have negative and relevant welfare effects for individuals (Calvet et al., Reference Calvet, Campbell and Sodini2007).
We analyze the determinants and performance of investment decisions made by individuals, as well as the degree in which learning from past decisions affects future behavior. We do this by using a unique data set built from administrative records, which allows us to study the investment decisions made by members of the Chilean defined contribution (DC) pension scheme.Footnote 1 Chile constitutes an interesting study case because since 1981, its pension system has a DC scheme as its main pillar. Additionally, members have considerable flexibility in choosing the way in which their savings are invested. Specifically, even though members cannot choose the individual assets in their portfolios, they have the possibility of selecting between five different diversified fund types, with equity exposures that range from 80% to 5%. This exposure can be modified multiple times, without a limit in the number of fund changes.Footnote 2 This could lead to undesired outcomes since most members of pension schemes display a low level of financial knowledge.Footnote 3
Our paper studies the performance of investment decisions within pension plans. There are numerous studies focusing on the behavior of individual investors in general financial markets. In this line, Barber and Odean (Reference Barber, Odean, Constantinides, Harris and Stulz2013) provide a comprehensive summary of studies about the performance of individual investors. There is widespread evidence that the average investor obtains poor performance and trades too much (Odean, Reference Odean1999; Barber and Odean, Reference Barber and Odean2000; Barber and Odean, Reference Barber and Odean2001; Calvet et al., Reference Calvet, Campbell and Sodini2007; Chuang and Susmel, Reference Chuang and Susmel2011; Døskeland and Hvide, Reference Døskeland and Hvide2011; Kuo and Lin, Reference Kuo and Lin2013). Another part of the literature focuses on saving and investment decisions in the context of pension plans. In this case, previous studies report the presence of inertia about investment decisions (Madrian and Shea, Reference Madrian and Shea2001; Agnew et al., Reference Agnew, Balduzzi and Sunden2003; Mitchell et al., Reference Mitchell, Mottola, Utkus and Yamaguchi2006; Bilias et al., Reference Bilias, Georgarakos and Haliassos2010; Tang et al., Reference Tang, Mitchell, Utkus, Mauer, Mitchell and Warshawsky2012). When members do trade, they fail to diversify adequately their pension savings (Tang et al., Reference Tang, Mitchell, Mottola and Utkus2010). Also, evidence shows that there is heterogeneity in the degree of involvement in investment decisions, with more participation for members of pension system with higher financial wealth and higher income (Agnew et al., Reference Agnew, Balduzzi and Sunden2003; Engström and Westerberg, Reference Engström and Westerberg2003; Cronqvist and Thaler, Reference Cronqvist and Thaler2004; Tang et al., Reference Tang, Mitchell, Utkus, Mauer, Mitchell and Warshawsky2012). A similar pattern has been reported for investors outside pension systems (Calvet et al., Reference Calvet, Campbell and Sodini2009).
Our paper is also related to the strand of the literature that studies the existence of learning in general financial markets.Footnote 4 Previous research shows that past investment performance can predict a higher frequency of future trading decisions (Glaser and Weber, Reference Glaser and Weber2009; Meyer et al., Reference Meyer, Koestner and Hackethal2012; Barber et al., Reference Barber, Lee, Liu and Odean2014). The rationale behind this is that, by making investment decisions, individuals may learn about their ability to trade. In this line, investors' self-perceived ability has been shown to be relevant in order to start trading (Linnainmaa, Reference Linnainmaa2011). Furthermore, it has been shown that investors stop trading if they discover that they lack the skills for this task (Seru et al., Reference Seru, Shumway and Stoffman2009). In some cases performance has been shown to improve as individuals gain experience from past trades (Nicolosi et al., Reference Nicolosi, Peng and Zhu2009; Meyer et al., Reference Meyer, Koestner and Hackethal2012).
Our work contributes to the existent literature in several ways. First, we use a unique dataset with detailed information on retirement savings portfolio decisions, finding robust evidence on the existence of learning or feed-back effects between successful investment decisions and the probability of engaging in further trading. This feed-back effect has the expected sign and the strongest predictive ability when past performance is measured using naive evaluation rules. To the best of our knowledge, this finding has not been reported before for members of pension plans. Second, regarding performance, we provide new evidence about the effects of investment decisions in a large pension system. We show that the result about average active investors obtaining poor performance seems to be partially dependent on the period under examination. Finally, we find evidence that members with a larger (lower) number of investment decisions are more (less) likely to obtain worst (better) performance. These results, along with simulation exercises, suggest that good performance is the result of luck rather than skill. Unlike previous work that focuses on developed markets, our findings are related to a relatively unexplored case. In related work, Kristjanpoller and Olson Reference Kristjanpoller and Olson2014 use Chilean data and find that younger people, men, people with lower incomes and with low financial knowledge are less likely to make investment decisions. While Kristjanpoller and Olson (Reference Kristjanpoller and Olson2021) estimate the performance obtained by individuals making voluntary changes, our work is able to complement these results in several dimensions. First, since we are able to identify fund changes made voluntarily from those associated to the default investment scheme (which moves individuals from funds B, C, and D), we have a more accurate information on the individuals' actual fund changes. This also allows us to include non-retired individuals regardless of their age (Kristjanpoller and Olson leave out of their sample males who are 55 or older, as well as females who are 50 or older). Second, since we use administrative data, we are able to identify the exact day in which the fund change was realized, allowing us to measure returns more accurately. Third, we provide risk-adjusted performance measures since individuals could achieve a lower performance (return) but also be exposed to less volatility. Fourth, we shed light on whether the performance obtained is consistent with luck versus skill. Finally, and more importantly, we also explore the motivations behind individuals' investment decisions, documenting learning effects. Our results complement the dynamic life cycle analysis of Parada-Contzen (Reference Parada-Contzen2020), which also analyzes investment-saving decisions in Chile but studies crowd-out effect across saving choices, by focusing on the dynamics of feedback effects of past retirement portfolio allocation decisions on individuals using more granular data for each individual across time and a focus on individuals' allocation decisions within the pension system.
From a policy stand, our results suggest that the advantages of having flexibility in the way in which pension plan members adjust their equity and fixed-income exposure should be weighed against the actual outcomes obtained by members.Footnote 5 Moreover, the possible benefits of this flexibility need to be weighed against potential negative effects on financial stability related to the presence of frequent and possibly coordinated investment decisions.Footnote 6 Our results also highlight the need to improve our understanding of the way in which individuals learn about the consequences of their investment decisions. Our results are relevant for policy makers in all jurisdictions which feature individual pension savings accounts and where members have the opportunity of making investment decisions. For instance, OECD (2020) reports that among 32 jurisdictions and pension plans, all but one feature more than one investment option for members. While the specific regulation varies from case to case in features such as the frequency with which investment adjustments can be made, in all of these cases, regulators would benefit from gaining insights into the motivations behind members' investment decisions and the possible existence of behavioral biases in this process.
The importance of avoiding investment mistakes that lead to lower average returns in the context of pension savings has increased in recent years. Indeed, amidst the COVID-19 pandemic, Chilean legislators passed special regulation allowing early access of up to 10% of mandatory pension savings. According to the Pension Regulator, this has resulted in more than four million of system members to have emptied their pension savings accounts.Footnote 7 Streamlining investment decisions will certainly play a role to minimize the negative impact of these withdrawals on future pensions for Chilean workers.
The rest of the paper is structured as follows. Section 2 describes the data and relevant institutional setup. Section 3 describes our methodology and presents our empirical findings regarding the presence of learning or feedback effects as well as the performance obtained by individuals in our sample. Section 4 concludes.
2. The data
2.1 Institutional setup
The Chilean DC system was introduced in 1981. Participation is mandatory for all the civilian working force. However, the coverage of the system is 75% of working-age population. Part of the reason why coverage is not higher is due to the existence of informality in the labor market. This is documented, for instance, by McKiernan (Reference McKiernan2021). High informality limits the percentage of the population that receives benefits from the system. Moreover, it can also lead to members not contributing during all their active life, thus negatively affecting both the amount saved and the pension received upon retirement.Footnote 8 The contributions made by members are invested by six pension fund managers (PFMs).Footnote 9 Assets under management (AUM) have reached the considerable size of 70% of GDP. The investment guidelines for pension funds are largely contained in the Regulator's Pension Fund Investment Regime, which establishes detailed quantitative limits per instrument, group of instruments, and issuer.
Since the PFMs are in charge of taking investment decisions, members do not choose individual assets. However, since August 2002, both mandatory and voluntary savings have been invested under a multi-fund scheme. This consists of five types of funds (A, B, C, D, and E), differentiated mainly by the proportion of their portfolio invested in equity. The maximum investment limits in equities for these funds are 80%, 60%, 40%, 20%, and 5%, respectively. Historically, the PFMs have chosen portfolios close to this limit. As of December 2016, equity exposition for funds A–E was: 77.9%, 58.2%, 35.7%, 15.7%, and 3.5%, respectively. The remaining share of the portfolios is composed mainly of fixed-income investments.
Members are free to choose any fund, except for an age-related restriction that keeps older members from choosing fund A. Also, members can invest their savings combining up to two types of funds. This means that an individual can choose a portfolio composed by almost 80% equity and 20% fixed income from one end (fund A) and vary this allocation to almost 5% equity and 95% fixed income at the other end (fund E), with practically any combination in between. Thus, depending on their choice and subsequent adjustments, individuals can have access to very different risk and expected returns profiles. In order to make a fund change, an individual must attend in person to one of his PFM's offices. Alternatively, if he has a web password, it is possible to request the fund change through the PFM's website. PFMs are required to fulfil the request in four business days. Moreover, there is no limit on the maximum number of fund changes. Under current regulation, affiliates who make more than two changes in their fund type in a calendar year may be charged a fixed fee each time they make such additional changes. Although PFMs are allowed to charge these fees, in practice, none do so. This is known by affiliates in advance because the PFMs must report in all the fees that they will charge during a predetermined period (approximately the next quarter). While no official reason has been given by PFMs for not charging these fees, one factor explaining this could be that the operational cost of processing fund changes is now small. Indeed, while these changes used to require individuals to attend physically to the PFM's office, they are now made online. However, whenever PFMs make portfolio adjustments, they must incur in brokerage fees. The fees associated to assets directly bought by PFMs are paid out of their pockets, whereas the ones associated to assets held indirectly (e.g., mutual fund shares) are deducted from the pension funds themselves and amount to approximately 0.3% of AUM.
Notwithstanding the above, if members do not opt for a type of fund, they are assigned to a default allocation, which features a decreasing equity exposure as members age. Specifically, individuals are initially assigned to fund B, which has an allocation of approximately 60% equity and 40% fixed income. Once members are 35 years old, their savings are changed to fund C (40% equity and 60% fixed income). This is done gradually over a total of five years (20% of the balance is moved from fund B to fund C each year). Afterwards, when males (females) are 55 (50) years old, their balance is gradually moved to fund D (20% equity and 80% fixed income). Once again, this adjustment is gradually done over a period of five years. In our empirical analysis we leave out fund changes associated with the default investment strategy and focus on changes explicitly requested by members.
The performance of the funds in terms of real returns has showed considerable dispersion.Footnote 10 Nevertheless, performance among PFMs is similar. During 2007–2016, the correlation of monthly returns for the same type of fund among PFMs averaged 0.95. We also compared the returns for each type of fund amongst managers through means tests. The results showed that there are no statistically significant differences at the usual confidence levels.
2.2 The data
Since members of the Chilean pension system can choose between five different types of funds, rather than studying direct asset holdings, we will analyze which members make fund changes and the impact of these decisions. The source of information is the Supervisor's Members Data Set (Base de Datos de Afiliados or BDA), which contains administrative records of all members in the private pension system. These data have characteristics that make it particularly interesting and well suited for our study. First, while learning has been studied using data from day traders and brokerage accounts, there is less evidence about learning for members of pension plans. Second, the motivations for trading can be varied, including liquidity needs, tax-loss trading, life-cycle motives, and market timing objectives, among others. However, in our case, we can rule out some of these factors (e.g., liquidity needs) and focus on issues such as life-cycle elements and market timing. Finally, we have access to both the exact day in which members changed funds and the pension funds' Net Asset Value (NAV) on that day. This allows us to give a precise figure of the performance obtained by these members. We do face a potential limitation since we do not have data on other forms of savings. However, we argue that in our case this is not a major issue for two reasons. First, for most Chilean workers, pension accounts are the main type of savings. Indeed, according to the 2009 Social Protection Survey, only 1.1% of members of the DC pension scheme held investments in mutual fund shares, while only 0.8% owned bonds and shares. Second, while more individuals have voluntary pension saving (VPS) accounts (around 15% of members), most of these savings (63%) are invested with PFMs, which means that they are captured in our data.
We limit our study to non-retired members who were already in the scheme at the beginning of 2007. This allows us to maximize the horizon over which we can evaluate the performance of the investment decisions. We focus our analysis on the decision to make fund changes, regardless of whether these occurred when a member switched between two PFMs. Moreover, we use system-average returns in our estimations. We justify our methodological choice since, as we report above, there is a high degree of correlation between PFMs' portfolios. Consistent with previous studies, the number of changes of PFM is relatively low in our sample: less than 10% of fund changes were accompanied by a PFM switch.Footnote 11 Since financial advice may be received when an individual changes between PFM, we control for such changes in our regression analysis.
We follow our sample from February 2007 to December 2016. Given that administrative data on fund changes began to be recorded only recently, we cannot explore data prior to 2007. Our sample is consisted of 62,865 individuals, from which 4,157 (only 6.6% of individuals) made at least one voluntary change of fund. The data show that roughly 18,000 changes were made during this period.
Individuals are free to make fund changes for both their mandatory and voluntary savings accounts. We choose to treat all fund changes in the same way, without making distinctions of whether the change was made in the mandatory or voluntary account. We argue that this choice seems adequate, as it simplifies the analysis, and the potential loss of information is small. Indeed, we have roughly 18,000 changes in our sample. From these, 87% are changes in mandatory accounts. A potential drawback from our approach is that we could lose information by not making a distinction between account types. This would be the case, for instance, if there are simultaneous changes in the mandatory and voluntary accounts that result in opposite changes in equity exposure. This is a very rare event in our sample. Considering all changes in voluntary accounts, we only have 714 cases (3.9% of all fund changes) where there are simultaneous adjustments in the mandatory and voluntary accounts. Moreover, only in 20% of these cases (0.8% of total changes in our sample) are there opposite adjustments in equity exposure. Notwithstanding this argument, we address the distinction between learning and fund changes in mandatory and voluntary accounts in our robustness section.
We define three types of change variables: Change, More Risk, and Less Risk. The first variable takes the value of 1 in the month during which an individual makes a fund change and zero otherwise. The second (third) variable takes the value of 1 in a month if the individual increased (decreased) his equity exposure and zero otherwise.Footnote 12
Table 1 shows the descriptive statistics for our sample, which we have divided into four groups. Group 1 is composed of 58,602 individuals (93.3% of our sample) who have not made any voluntary fund change. We further divide in subgroups the remaining 4,158 individuals (6.7% of our sample) with at least one fund change. Group 2 is formed by 2,353 individuals (3.7% of our sample) with up to three fund changes, which is equivalent to the median number of changes for those with at least one change. Group 3 contains 797 individuals (1.3% of our sample) with four to six fund changes (roughly the 75th percentile of fund changes). Finally, group 4 is formed by 1,003 individuals (1.6% of our sample) with more than six fund changes.
Descriptive statistics

Source: Authors' estimations. This table shows the means values for our sample, which is composed of 62,760 individuals. The sample is divided into four groups: group 1 (individuals with no voluntary fund changes); group 2 (individuals with one to three fund changes); group 3 (individuals with four to six fund changes); and group 4 (individuals with more than six fund changes). ***, **, and * denote that the means of groups 2, 3, or 4 are different, at the 1%, 5%, or 10% significance level, versus the mean of group 1. The data cover from February 2007 to December 2016. Age is measured in years. log(Balance) is the natural logarithm of total savings, including both mandatory and voluntary account balances, measure in Chilean pesos (1 US$ equals 660 CLP). log(Income) is the natural logarithm of monthly income, measured in Chilean pesos. VPS takes the value of 1 (0) for periods in which individuals had (did not have) a voluntary pension savings account. Unemployment takes the value of 1 (0) for periods without (with) mandatory contributions. Male takes the value of 1 (0) for males (females). Change takes the value of 1 for periods in which the individual made a voluntary fund change and zero otherwise. More risk (less risk) takes the value of 1 if the individual made a voluntary fund change that increased (lowered) his equity exposure and zero otherwise. Equity is the weighted mean equity exposure in both mandatory and voluntary accounts, expressed in percentage of total savings. Change PFM takes the value of 1 if the individual changed from pension fund manager during that month and zero otherwise. Web password takes the value of 1 if an individual had obtained the password that is required in order to make fund changes through a PFM's website and zero otherwise. N represents the number of individuals in each group.
Age is measured in years. There is not a clear pattern between groups, although group 4 is slightly younger than the group with no changes. The next variable is the log of the total balance in pension savings, including both mandatory and voluntary accounts. This variable is monotonically increasing as we move from the first to fourth group. Indeed, the average balance is CLP 2.3 million (approximately US$ 3,500) for individuals with no changes and this figure increases up to CLP 12.9 million (approximately US$ 19,500) for the group with the higher number of changes.Footnote 13 Next, we have the log of monthly income, measured in Chilean pesos, leaving out months without mandatory contributions. Wages increase as we move across groups and the group with the most changes has salaries well above the rest of groups (CLP 800,000 versus CLP 193,000 for the first group). VPS is a dummy variable that takes the value of 1 (0) for periods in which individuals had (did not have) a voluntary savings account. Given how the Chilean pension system is designed, if an individual is employed in the formal sector, i.e., she has a work contract, she is automatically obliged to contribute to an individual pension savings account. Therefore, we measure unemployment as lack of contributions to the individual's mandatory pension savings account.Footnote 14 Also, males are more prone to make fund changes. Next, we describe fund changes. For the second group, we register voluntary changes 1.5% of time. This figure rises to 12.1 for the fourth group. In our 10-year sample, the average total number of changes is less than one for the second group and almost four for the last group. Regarding the more risk and less risk variables, the frequency of these events increases as we move from group 2 to 4, while across all groups the predominant change consisted in lowering equity exposure. Equity is the mean equity exposure, constructed as a weighted average of exposure in mandatory and voluntary accounts, expressed in percentage of total savings. Change PFM takes the value of 1 if the individual changed from PFM during that month and zero otherwise. We consider this variable to control for the fact that fund changes may be motivated by advice received when one individual switches between PFMs. Web password takes the value of 1 if an individual had obtained the password that is required to make fund changes through a PFM's website and zero otherwise. The main takeaway is that fund changes are made mainly by: younger males; individuals with higher income; and higher savings.
Table 2 sheds further light on the frequency and type of fund change made by individuals. We have classified a fund change in the following categories: −4, −3, −2, −1, 0, 1, 2, 3, 4. A negative number is associated to a reduction in equity exposure. The largest adjustment of this type would be a −4, equivalent to moving from fund A to fund E. A −3 value means that the individual lowered equity exposure moving: from fund A to fund D, or from fund B to fund E. A −2 value is assigned when individuals move: from fund A to fund C, from fund B to fund D, or from fund C to fund E. The value −1 corresponds to changes: from fund A to fund B, from fund B to fund C, from fund C to fund D, or from fund D to fund E. The positive numbers are associated with an increase in equity exposure. Each positive value, from 1 to 4, is interpreted as the opposite movement described for numbers −1 to −4. Finally, a value of 0 means no fund change. Group 2 made a total of 4,155 fund changes during our sample (i.e., there were no fund changes 98.52% of the time). Most of the fund changes in this group correspond to reductions in equity exposure, with 21.83% of total changes being the smallest adjustment (e.g., fund change type −1). It is interesting to note that, as we move to groups 3 and 4, both the number of fund changes and the size of the equity adjustments increase.
Type of fund changes

Source: Authors' estimations. This table shows the frequency and percentage of fund changes by group of individuals. The sample is divided in four groups: group 1 (individuals with no voluntary fund changes); group 2 (individuals with one to three fund changes); group 3 (individuals with four to six fund changes); and group 4 (individuals with more than six fund changes). Also, the table shows the type of fund changes. A negative number is associated to a reduction in equity exposure. A −4 value is equivalent to moving from fund A to fund E. A −3 value means that the individual lowered equity exposure moving: from fund A to fund D, or from fund B to fund E. A −2 value is assigned when individuals move: from fund A to fund C, from fund B to fund D, or from fund C to fund E. The value −1 corresponds to changes: from fund A to fund B, from fund B to fund C, from fund C to fund D, or from fund D to fund E. The positive numbers are associated with an increase in equity exposure. Each positive value, from 1 to 4, is interpreted as the opposite movement described for numbers −1 to −4 (e.g., a +4 means is assigned to a change from fund E to fund A). Finally, a zero value indicates no change in equity exposure. For instance, group 4 (formed by individuals with more than six changes) did not make a fund change almost 88% of the time. This group made a total of 14,529 changes. Also, 28.54% of these changes were strong reductions in equity exposure (changes fund A to fund E), while 23.86% were strong increases in equity exposure (changes fund E to fund A).
Figure 1 shows that after the Sub-prime Crisis seems to be an inflection point in terms of the salience of pension fund returns in Chile. During 2008 pension funds experienced negative annual returns for the first time since the five types of funds were created, in 2002. Previously, the maximum loss experienced had been −2.52% (fund C) during 1995. Fund A closed 2008 with a staggering loss of −40%. In 2009 the same fund earned a 43% return. Nevertheless, this fund did not regain its pre-crisis NAV until 2014. From 2008 onwards, the number of fund changes has a positive trend. Also, extreme reductions and increases in equity exposure account for more than half of total changes in some periods.
Monthly fund changes.
Source: Authors' calculations based on supervisor's data. The left axis shows the monthly number of voluntary fund changes made by affiliates in our sample. The right axis shows the percentage of voluntary fund changes that correspond to extreme reductions (changes from fund A to fund E) and increases (changes from fund E to fund A) in equity exposure.

3. Methodology and empirical results
In this section, first we summarize the performance obtained by individuals who have made voluntary fund changes in our sample. Overall, this performance is lackluster for the average individual. Then, we explore if learning effects could be playing a role in the incentives to engage in fund changes. Our results suggest that this is the case, although not necessarily for the correct performance measures, i.e., individuals seem to be learning about their ability in an incorrect manner. We provide ample robustness results supporting our findings.
3.1 Performance
We evaluate the performance achieved by individuals making at least one voluntary fund change during the 2007–2016 period. We measure performance in two ways. First, we estimate the raw annual (geometric) average return obtained by those individuals with one or more fund changes. Second, since differences in raw returns could be associated to variations in the risk that individuals are taking (e.g., a low return strategy could be associated to low volatility), we also estimate the investment's strategy Alpha (also known as Jensen's Alpha), which takes into account the risk present in each particular investment strategy.Footnote 15
Our data include information regarding the exact day in which each fund change took place, and we also know the daily funds' NAV. We use this input to estimate the raw and abnormal returns earned by investors. For the latter, we follow Meyer et al. (Reference Meyer, Koestner and Hackethal2012), Kosowski et al. (Reference Kosowski, Timmermann, Wermers and White2006), and Carhart (Reference Carhart1997) and use a single-factor model, since this type of models' results are not significantly different from those produced by multi-factor models. For each individual we run the following regression:

where Ri,t is the real return obtained by individual i in month t; Rf is a short-term inflation-adjusted interest rate for the Chilean market; Rm,t is the real return obtained by the Chilean stock index (proxied by the MSCI Chilean stock index); and ut is a possibly auto-correlated disturbance.Footnote 16
Panel (a) in Table 3 shows the performance of each pension fund. Fund A was the most volatile and worst-performing fund, both in terms of raw and abnormal returns. As we will discuss in our robustness analysis, the losses during the Sub-prime Crisis contribute to this. The rest of panels show three main findings. First, on average individuals display poor performance (both in terms of raw and risk-adjusted returns) when compared against the pension funds. Second, there is considerable heterogeneity in performance across individuals. Third, as we move from group 1 (panel b) to the group 4 (panel d) average performance worsens and its dispersion increases.
Active investors and pension fund performance (%)

Source: Authors' estimations. This table summarizes the performance obtained by members with at least one fund change and that of pension funds. The sample is divided in the following groups: group 2 (individuals with one to three fund changes); group 3 (individuals with four to six fund changes); and group 4 (individuals with more than six fund changes). The second column shows the annualized average return, the third column shows annualized standard deviation, and the last column contains the annualized abnormal return (alpha). Panel (a) shows the results for the five pension funds. Panel (b) contains the results for the individuals in group 2, showing 5th and 25th percentiles, followed by the mean and the 75th and 95th percentiles for each performance measure. Panels (c) and (d) show similar information for individuals in groups 3 and 4, respectively.
There are some factors behind this lackluster performance. First, at the beginning of our sample, most members who made voluntary changes were in funds A, B, and C. Moreover, they made very few changes. Indeed, the majority (26.6%) only made one change, 72% made less than five changes, and only 15% made more than ten changes. Therefore, their performance was similar to the one obtained by these three funds. Second, between 2007 and 2016 fund A had the worst performance (lowest average return and highest volatility) whereas funds B and C also performed poorly. As a result, most members with fund changes obtained poor performance in this period. Considering risk-adjusted returns does not alter this result.
A relevant question regarding the good performance obtained by some individuals in our sample is whether this is due to the existence of skill or the product of luck. We shed light on this matter by examining the relation between the number of fund changes made by members and the performance they obtained. If there was true market-timing ability for a group of individuals, we should observe a relatively high number of fund changes coupled with good performance. Moreover, if individuals are particularly skilled at market timing, this group should exhibit a better performance versus the rest of members. Table 4 shows the mean and median number of voluntary fund changes according to the performance (quartiles) group and the type of member. Panel (a) shows the results by average raw return performance, while panel (b) does so for abnormal returns performance groups. Two main results emerge. First, the presence of individuals with high number of fund changes (group 4) is more (less) prevalent in the worst (best) performance groups, while the opposite pattern holds for those with few changes (group 2). For group 3 the distribution of individuals across performance groups is fairly constant. Second, overall, there is a statistically significant negative relation between the number of fund changes and performance. Note that this relationship is non-monotonic, as the number of changes slightly increases between the second-to-best and the best-performance groups.
Relation between number of fund changes and performance

Source: Authors' estimations. The sample is divided in the following groups: group 2 (individuals with one to three fund changes); group 3 (individuals with four to six fund changes); and group 4 (individuals with more than six fund changes). The upper part of this table shows the number of individuals from groups 2, 3, and 4 that are present in each performance category, defined according to the quartiles of the raw average returns' distribution for individuals with at least one fund change. The table also shows the average number of fund changes for each group. ***, **, and * denote that the mean number of changes between adjacent performance groups is different, at the 1%, 5%, or 10% significance level. The lower part of the table displays the same information, but performance groups are formed according to the abnormal return (alpha) obtained by individuals.
We interpret these results as suggesting that good performance is caused by luck rather than by ability. A pooled OLS regression shows that there is a negative relationship between raw return and number of changes up to around 35 changes (only 0.2% of individuals made that many changes in our sample). From then on, the relationship becomes positive. However, an individual would have to make at least 66 changes in order to have the same expected return of making no fund changes.Footnote 17 We will return to the issue of luck versus skill in our robustness analysis.
3.2 Evidence of learning
The existing literature about learning studies individuals in the context of general financial markets (e.g., Linnainmaa Reference Linnainmaa2011 calibrates a theoretical learning model using data from Finnish household). In this context, the incentives to learn and trade may be influenced by factors such as liquidity needs, short-term savings objectives (e.g., precautionary motives savings), and tax considerations (e.g., tax-loss harvesting). An interesting feature of our data is that it allows us to shed light on the presence of learning in the context of pension savings. This is an area where evidence is scarcer. Also, in our data, factors such as liquidity and tax considerations should not play a major role for individuals. The reason for this is that members of the pension system cannot use their mandatory savings until retirement.Footnote 18 Individuals can get access to their VPS (subject to tax-related penalties). We analyze the potential importance of treating investment decisions related to mandatory and voluntary accounts differently in our robustness analysis. Liquidity and tax considerations aside, we argue that there are two elements that could be playing a relevant role for individuals in our data to make investment decisions. First, life-cycle considerations could be present. Second, market timing motives could also lead to make fund changes. If the first type of consideration is prevalent, it could be expected that, on average, fund changes would go in one direction, namely reducing equity exposure as individuals age. In the case of the second explanation, we would expect equity exposure to increase and decrease over time.
Our empirical specification is built upon a theoretical model, which is available from the authors upon request.Footnote 19 In line with the aforementioned theoretical models, we hypothesize that individuals may be learning from past investment decisions. However, it is not straightforward how to build a proxy for individuals' perceived ability. We considered two factors in order to construct these variables. First, when does a fund change qualify as ‘successful’? And second, how often should this evaluation take place?
Regarding the first issue, we explore three different definitions of success. Under definition 1, we classify a change as successful if the return is higher than the one that would have been obtained without the change and unsuccessful otherwise. This is a counter-factual exercise. Under definition 2, a change is successful if a positive return is obtained when the change is made and unsuccessful otherwise. We argue that this is a naive evaluation rule as a positive (negative) return obtained by picking one particular fund among five alternatives does not necessarily imply that a good (bad) decision was taken.Footnote 20 This rule is motivated by evidence on the literature suggesting that individuals tend to use heuristics or simplified rules when making financial decisions.Footnote 21 Our third definition declares a change as successful if the highest-return fund is selected and unsuccessful otherwise. We view this definition as following the spirit of what market timing practitioners aim to achieve. We leave out alternative definitions, such as risk-adjusted returns or abnormal returns, since it seems unlikely that the average member of the pension system is capable of estimating these performance measures.
As for the evaluation horizon, this could be at the least: daily, monthly, quarterly, or yearly. From these possibilities, we use monthly evaluations. The reason for this is motivated by our institutional setup. The Pension Supervisor collects daily data on the NAV of pension funds. These data are available, with some lag, in the Supervisors' website. However, since only the daily NAVs are reported, if an individual who has made a fund change wishes to know, for instance, if he selected the best fund for a particular day, he would have to build daily returns series for each fund. Additionally, the first days of each month, the supervisor publishes information on the returns earned by pension funds during the previous month (e.g., in the first days of December, the supervisor announces the returns earned by pension funds during November). This information is available on the supervisors' website, along with time series of monthly returns. Moreover, all major newspapers give wide dissemination to these results, with special emphasis on whether the returns obtained were positive or negative, rather than on the specific return figures.Footnote 22 Members of the pension system have an additional source of information, which is a balance sent to them by their PFM every 4 months. This balance also has information on the returns earned during the January to April, May to August, and September to December periods. However, data from the 2009 EPS show that 37% of workers claims not having received such a statement from their PFM during the last 12 months. Moreover, from those who received their statement, only about one-third claims that they read information about funds' returns. In the case of yearly or lower frequency evaluations, we argue that it seems unlikely that individuals are able to keep track of the fund change decisions they have made during such long periods of time. Based on these considerations, we choose to work with a monthly evaluation frequency.Footnote 23
The final step to build our ability measures is to keep track of the total number of changes made and whether these changes were successful. Since there are three definitions for success, three measures of ability are built. Ability is defined each month as the proportion of successful over total accumulated changes. This approach is based on theoretical grounds (see, e.g., Linnainmaa, Reference Linnainmaa2011). Therefore, this is a variable that takes values between 0 (no successful changes) and 1 (all changes are successful). Since we do not have information on changes before February 2007, we assign all individuals in our sample initial values of 0.5 for their ability.Footnote 24 If no changes are made, the 0.5 value is kept. Also, the values are updated every month in which a fund change takes place.Footnote 25 Figure 2 shows the densities for our three ability measures at the end of our sample, along with the mean for each measure. Turning to our first definition of ability (panel a) we have that, on average, group 2 has the lowest ability (0.45), followed by group 3 (0.48) and 4 (0.59). Therefore, only for the last group average ex-post ability is higher than our assumed initial values of 0.5. The density of ability measured using a naive evaluation is showed in panel (b). In this case, the average ex-post estimated ability is very similar for groups 2 and 3, reaching 0.58 and 0.6, respectively. In the case of group 4, their average ability is considerably higher, reaching a value of 0.68. It is interesting to note that, under the naive evaluation rule, the density of group 4 is by far the most favorable. That is, if individuals do evaluate their changes using such a rule, members of this group would have a high self-assessment of their ability. Finally, we move to the market timing definition of ability in panel (c). Average ability for group 4 is once again the highest, but it reaches a value of only 0.36. The average for groups 2 and 3 is 0.35 and 0.3, respectively.
Density of ability measures.
Source: Authors' estimations. These panels show the density at the end of our sample for three different measures of ability. Each density is accompanied by a vertical line showing the mean of the distribution. Panels (a)–(c) plot this relation for ability assessed according to definitions 1–3, respectively. Definition 1, labeled ‘counter-factual’ qualifies a fund change as successful if the return is higher than the one that would have been obtained without making the change and unsuccessful otherwise. Definition 2, called ‘naive’ qualifies a fund change as successful if a positive return is earned during the month in which the change was made and unsuccessful otherwise. The third definition, labeled ‘market timing’ states that a change is successful if the highest-return fund for that month is selected and unsuccessful otherwise. The densities are showed for groups 2 (up to three changes), 3 (between four and six changes), and 4 (more than six changes). (a) Definition 1 (counter-factual), (b) definition 2 (naive), (c) definition 3 (market timing).
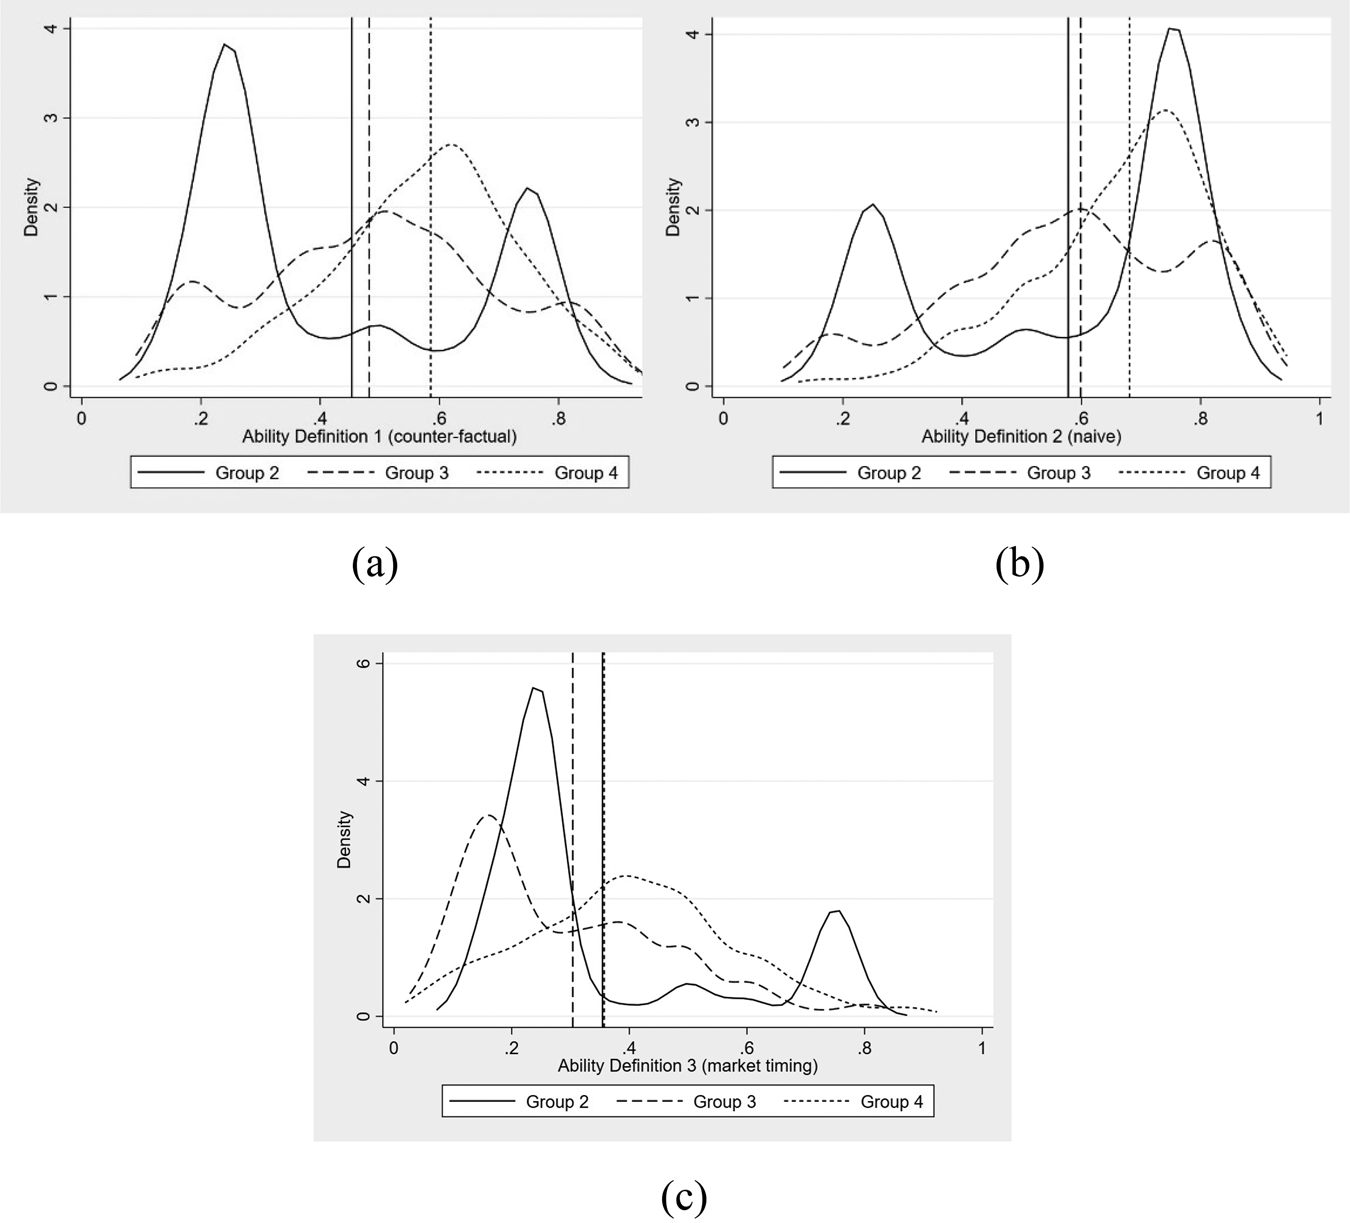
Before using regression analysis, it is interesting to look at the correlations between ability and the total number of fund changes. These correlations are 0.17, 0.45, and −0.38 for our counter-factual, naive, and market-timing ability measures, respectively. All these values are statistically significant and, as we will show, the signs of these correlations will continue to hold in our regressions.
We give preference to simple, panel linear models, in order to have a readier interpretation of the coefficients obtained in the regressions. It should be noted that while we consider that both, a change from fund A to fund B and a change from fund A to fund E as reductions in equity exposure, the change in equity exposure is quite different (20 versus roughly 75%, respectively). To deal with this issue, we also estimate multinomial logit regressions, where we modeled both the size and the magnitude of changes in financial exposure (while using ordered probit models seems more intuitive, given the ordering of our dependent variable in terms of equity exposure, the specification tests showed that these models violated key assumptions, such as the proportional odds assumption, casting doubt on the consistency of the results). Since the estimated effects of ability on the incentives to perform fund changes are similar in these more complex models, we opted to present simpler, OLS estimates, since results and marginal effects are easier to analyze and communicate.Footnote 26 After performing standard specification tests, we estimated fixed-effects panels.Footnote 27 This has the advantage of allowing us to control for individual-level characteristics that are time-invariant and may be relevant to determine the propensity to make fund changes, but for which we do not have a proxy, such as intelligence (see, e.g., Grinblatt et al., Reference Grinblatt, Keloharju and Linnainmaa2012).
We study a total of three dependent variables: change (equal to 1 if there is a fund change and zero otherwise); more risk (equal to 1 if there is an increase in equity exposure and zero otherwise); and less risk (equal to 1 if there is a drop in equity exposure and zero otherwise). The regression model and dependent variables are given by:

where Abilityi,t is the proxy for ability; Malei is a dummy equal to 1 (0) for males (females); Xi,t is a set of control variables; γi is an (unobserved) individual effect; and ɛi,t is a potentially correlated random term. The control variables are guided by our theoretical model and include age; natural logarithm of pension savings balance and income; a dummy indicating if an individual had a voluntary savings account the previous month; a dummy indicating the existence of periods of unemployment; a dummy indication if the individual changed between fund managers; and a dummy indicating if the individual has an active web password to facilitate making a fund change. We also include variables that measure financial market conditions (that proxy for the potential gains from changing between funds). These variables are: the 1-month lagged value of the difference in returns between funds A and E (alone and interacted with the male dummy); the last 36-month lagged value of the difference in returns between funds A and E (alone and interacted with the male dummy); the 1-month lagged value of the standard deviation of fund A's returns, and interaction between this volatility and the male dummy. In order to control for the increasing frequency of fund changes over time, we include a quadratic trend. Moreover, to control for the investment recommendations given by financial advisor firms (see Da et al., Reference Da, Larrain, Sialm and Tessada2018) we also include dummy and trend variables. This allows us to effectively isolate the effect of investors' individual learning experience through our ability proxies.
The expected effects of our dependent variables on the incentives to make fund changes are given by our theoretical model. We expect our ability proxies to have a positive effect on the incentives to make fund changes. Since learning about market timing ability is an investment, we predict that its attractiveness will decline if there is less time to benefit from gaining this knowledge. Therefore, we expect age to have a negative effect on the incentives to make changes. Our model predicts that higher wealth should lead to individuals making more (less) changes if they have low (high) risk aversion. Therefore, the signs of the savings balance and income can be both positive and negative. The inclusion of the voluntary savings dummy proxies for financial sophistication and is thus expected to have a positive sign. The PFM dummy controls for the possibility that fund changes are made as the result of advice from a new PFM. The web password dummy is also expected to have a positive sign since it indicates that individuals have a lower cost of requesting a fund change. Next, we control for periods of unemployment. The gap in returns between funds A and E and the volatility in returns of fund A are proxies for the potential gains of market timing. Therefore, we expect them to have positive signs. Finally, the introduction of the male dummy interaction seeks to capture differences in response to market variables and perceived ability across genders (Barber and Odean, Reference Barber and Odean2001; Hibbert et al., Reference Hibbert, Lawrence and Prakash2016).
Table 5 shows the regression results for the change variable. Columns 1–3 show the results for the ability proxies defined according to the counter-factual, naive, and market-timing rules, respectively. Given that fund changes are, on average, scarce events, our models have limited predictive power. Nevertheless, practically all variables are highly significant, both in individual terms and as a group. Interestingly, the best fit to the data, measured by the pseudo R 2 is achieved with the naive ability specification (showed in column 2). Regarding the ability proxies, the first two empirical specifications show a positive impact of ability on the frequency of fund changes, while the third specification has a negative coefficient. In the case of the naive evaluation ability proxy (column 2) a one standard deviation increase in ability (which equals approximately 0.21) raises the probability of making an additional change by 624 (709) basis points for females (males). The effects of perceived ability are thus economically relevant. Age has a significant and negative effect on the propensity of making fund changes, which is consistent with models in which trading is an investment that allows individuals to learn about their ability. Having a shorter period in which potential gains can be exploited makes learning less attractive. Under specification 2, each additional year translates into a drop of 0.05 percentage points (or five basis points) in the probability of making a fund change. We have a positive and significant effect of both income and balance across all specifications. Having VPS increases the likelihood of changing funds by up to 1.2 percentage points (120 basis points) which is a large effect. One potential concern with this variable is that making voluntary savings should be the result of a decision-making process and therefore, it may be endogenous. We mitigate potential endogeneity issues by using the lagged value of this dummy.Footnote 28 The change PFM and web password dummies both have positive, statistically significant, and economically relevant impacts on the likelihood of making fund changes: about 3.6 percentage points (360 basis points) and two percentage points (200 basis points), respectively. The unemployment dummy has a positive and significant effect on the probability of making fund changes. For the return gap between funds A and E, one of our proxies for the potential gains of market timing, we have mixed results. In the 1-month lag case, we find a negative and significant coefficient. A 1% increase in this gap reduces the likelihood of making a fund change by around two basis points. However, the effect for the 36-month lag has positive sign and a similar magnitude. Volatility, the second proxy for the attractiveness of market timing, has the predicted positive sign across all specifications. We do not find large or robust evidence of statistically significant differences in response across genders for this variable. The economic importance of this proxy is similar to the returns gap. Also, the controls and trends related to financial advisory firms turn out to be statistically significant.
Change models

Source: Authors' estimations. This table shows the fixed-effects panel regression results for the binary change/no change dependent variable. ***, **, and * denote that coefficients are statistically different from zero at the 1%, 5%, and 10% significance levels, respectively. The data cover from February 2007 to December 2016. Column 1 considers our counter-factual definition of ability whereas in columns 2 and 3 the naive and market-timing definitions or ability is used, respectively. Age is measured in years. log(Balance) is the natural logarithm of total savings, including both mandatory and voluntary account balances, measure in Chilean pesos. log(Income) is the natural logarithm of monthly income. VPS takes the value of 1 (0) for periods in which individuals had (did not have) a voluntary pension savings account. Unemployment equals 1 for months without mandatory contributions and zero otherwise. Deltar represents the 1-month and 36-month lagged differences in the monthly returns of funds A and E, expressed in percentage. Volatility is the 1-month lagged GARCH standard deviation of fund A's monthly returns, expressed in percentage. Male takes the value of 1 (0) for males (females). Change PFM takes the value of 1 if the individual changed from pension fund manager during that month and zero otherwise. Web password takes the value of 1 if an individual had obtained the password that is required in order to make fund changes through a PFM's website and zero otherwise. The regression includes dummies and trends to control for investment recommendations made by financial advisors.
We now proceed to analyze the results of the regressions that study the decision of increasing, as well as reducing equity exposure. All results are shown in Table 6. We will make a joint analysis of the results, with an emphasis in comparing whether the response to changes in our dependent variable is more biased toward increasing or reducing exposure to equity. When ability is measured using a counter-factual evaluation, a one standard deviation increase would lead to an increase of 187 (233) basis points in the probability of increasing equity exposure for females (males). This same change translates in an increase of 90 basis points in the probability on reducing equity exposure for both genders. Moreover, when ability is measured using the naive evaluation, the same change raises the probability of increasing equity exposure by 282 (333) basis points for females (males), while also increasing in 340 basis points the probability of reducing exposure for both genders. Once again, the coefficient of our ability variable built using market-timing criteria has a negative effect. Regarding age, savings account balance, and income, the results are very similar to those observed in our previous model. The voluntary savings dummy has a positive and significant sign across both tables and for all specifications. An interesting finding emerges with the change PFM dummy. While changing manager has an associated increase of about 140 basis points in the odds of reducing equity exposure, this figure doubles to almost 220 basis points for the probability of increasing equity exposure, suggesting that, if some advice regarding equity exposure is given during this change, it is biased toward encouraging members to increase their equity exposure. This pattern reverses for the web password dummy, which raises the probability of increasing (reducing) equity exposure by 67 (100) basis points. Regarding unemployment periods, it is interesting to note that such periods have a stronger effect on the odds of reducing risk exposure (around 30 basis points) versus increasing such exposure (around 20 basis points). For females, the 1-month lagged Deltar variable has a positive effect in terms of higher odds of increasing equity exposure. For males, it has a weaker effect. This same variable has a negative effect on the likelihood of reducing equity exposure. The 36-month lagged Deltar variable has no significant effect on the probability of increasing equity exposure for females. For males, the effect is negative, but modest (about one basis point). The same variable has a positive effect on the probability of reducing equity exposure, both for females (about three basis points) and males (approximately five basis points). Regarding volatility, the coefficients have the same sign for the increase and reduce equity variables. However, once again we find differences in magnitudes. For females, a 1% increase in volatility leads to an increase of 0.394 basis points in the probability of increasing equity exposure. For males, the point estimates are negative, suggesting less response, but these coefficients are not significant for all specifications. The same change in this variable has an impact of 0.7 basis points in the probability of reducing equity exposure for both females and males, suggesting a ‘shelter-seeking’ behavior among members of the system, who increase the odds of lowering equity exposure in the month following high volatility of fund A's returns.Footnote 29 Our findings regarding the negative effect of volatility on equity exposure are similar to those of Tang et al. (Reference Tang, Mitchell, Utkus, Mauer, Mitchell and Warshawsky2012). Interestingly, the variables used to control for financial firms' investment advice turn out to be statistically significant and the coefficients' signs go in the expected direction. For instance, the probability of increasing equity exposure is higher after these firms' advice to increase equity exposure.Footnote 30
More risk and less risk models

Source: Authors' estimations. This table shows the fixed-effects panel regression results for the binary more risk/no change and less risk/no change variables. ***, **, and * denote that coefficients are statistically different from zero at the 1%, 5%, and 10% significance levels, respectively. The data cover from February 2007 to December 2016. Columns 1 and 4 consider our counter-factual definition of ability whereas in columns 2 and 5; and 3 and 6 the naive and market-timing definitions or ability is used, respectively. Age is measured in years. log(Balance) is the natural logarithm of total savings, including both mandatory and voluntary account balances, measure in Chilean pesos. log(Income) is the natural logarithm of monthly income. VPS takes the value of 1 (0) for periods in which individuals had (did not have) a voluntary pension savings account. Unemployment equals 1 for months without mandatory contributions and zero otherwise. Deltar represents the 1-month and 36-month lagged differences in the monthly returns of funds A and E, expressed in percentage. Volatility is the 1-month lagged GARCH standard deviation of fund A's monthly returns, expressed in percentage. Male takes the value of 1 (0) for males (females). Change PFM takes the value of 1 if the individual changed from pension fund manager during that month and zero otherwise. Web password takes the value of 1 if an individual had obtained the password that is required in order to make fund changes through a PFM's website and zero otherwise. The regression includes dummies and trends to control for investment recommendations made by financial advisors.
To sum up, our regression results are largely consistent with our prior for the case of the age and web password variables, our proxies for investment horizon and the cost of making fund changes, respectively. For the case of our measures of wealth and income, the results are consistent with investors having relatively low levels of risk aversion. We also find that the volatility of returns, which proxies for the potential gains of engaging in market timing, has a positive effect on fund changes. Our key variable, ability, has the expected sign for two of our three proxies. We view this finding as robust evidence of the existence of a feedback effect between perceived skill and subsequent fund changes. The proxy that seems to provide a better fit to actual data is the naive evaluation rule, which is consistent with previous literature showing the relevance of simplified rules to make financial decisions. When a market timing evaluation rule is used, ability has the wrong sign. Our interpretation of this finding is that individuals use a naive investment rule to evaluate their performance and this rule happens to be negatively correlated with the market timing rule in our sample.Footnote 31 Finally, we find that males are more influenced by their perceived ability.
3.3 Robustness and additional analysis
3.3.1 Results for different cohort of members
One potential limitation in our analysis is due to our inability to observe fund changes prior to 2007. Since the individuals in our sample were already members of the Pension System by 2007 it is possible that they had previous learning experience. Therefore, by setting initial ability at the same level, we would be biasing this variable, artificially reducing its variance in the starting point in our sample. While this should bias our estimated coefficient toward zero, we also performed our analysis for a sample of members who joined the system during the second half of 2007.
This new sample is formed by 13,986 individuals. Compared to the characteristics of our original sample reported in Table 1, this cohort is much younger (average age is 26 versus 40 for original sample); they have lower accumulated average balance (about 90% lower versus original sample); and they have smaller wages (about 25% lower versus original sample). All these differences are consistent with these individuals having joined the system recently.
The results (available upon request) show that applying our analysis to a group of individuals for whom we have a complete history produces some minor effects. We find that our results for two out of three ability measures continue to hold. Namely, the naive and market-timing measures display the same signs and similar significance levels from our original sample. Only for the counter-factual ability measure we find a change in the predicted effect. Taking this evidence into account, we argue that our conclusions about the presence of feedback effects based on naive criteria are robust.
3.3.2 Alternative definitions of learning
In order to examine the robustness of our reported learning effects, we modified how we measure ability. Instead of building this variable as the percentage of successful changes, we use a dummy variable taking the value of 1 if a fund change has been ‘successful’ and zero otherwise. As in our previous analysis, we employ three different definitions of success (counter-factual, naive, and market-timing). By doing this, we avoid using a potentially biased variable. Our results (available upon request) are not qualitatively affected. Moreover, the naive definition continues to have the highest predictive power in terms of explaining fund changes.
In addition to the previous analysis and aiming to determine if our results are robust to alternative definitions in the time used to evaluate investment decisions, we built new versions of our ability measures for two additional horizons: quarterly and yearly. We chose these two horizons since they are commonly used in portfolio management. We did not use longer horizons (e.g., three or five years) which are also fairly standard, because of our sample spans only ten years. The results (available upon request) are very similar to those of Tables 5 and 6. Also, our main result, namely the positive (negative) feedback effect between ability, measured according to naïve and counter-factual (market timing) definitions, and the incentives to make fund changes, continues to hold.
Finally, we explore whether individuals with voluntary savings, which presumably are the ones who have a better understanding of the pension system, have a different learning process from those without this type of savings. In order to shed light on this issue, we separated our sample between those individuals with voluntary savings and those without them. We further built all our ability measures following the procedure described in Section 3.2 but differentiating by whether the fund change was made for the mandatory or the voluntary savings account. This means that, additional to the results of Tables 5 and 6, we also estimate our models restricting the sample to individuals with no voluntary savings (almost 56,000 individuals). By construction, this group can only learn by making changes in their mandatory fund accounts. We then consider the group of individuals with voluntary savings (around 6,800 individuals) and study how their incentives to make fund changes are affected by their ability. Whereas their ability is constructed using only changes in voluntary pension funds of both mandatory and voluntary funds, the results are remarkably similar. The results of this exercise show that the regression coefficients are very homogenous across the different samples and learning definitions. Moreover, since the coefficients associated to the learning variables are roughly the same, we interpret this as evidence that the learning process occurs in a comparable manner for all individuals, regardless of whether they make investment decisions associated to their mandatory or voluntary funds. Since this set of results is remarkably similar to those of Tables 5 and 6, they have been omitted, but they are available upon request.
3.3.3 Performance and learning in a different period
Since our sample period contains the negative effects of the Sub-prime Crisis, we explore the robustness of our findings using different samples. If we focus on the 2009–2016 period, fund A is the most volatile but also has the best performance, with an 8.1% annualized average return and 9.1% standard deviation. Funds B, C, D, and E follow, with average returns of 7.2%, 6.5%, 5.9%, and 5.4%, respectively; and standard deviations of 6.6%, 4.3%, 2.5%, and 1.8%, respectively.Footnote 32 Moreover, once again there are large groups of members around funds A, B, and C. Given the good performance achieved by these funds, all our groups of individuals with fund changes achieve average returns (both raw and abnormal) that are usually at least as good as those of fund B, suggesting that the performance obtained is sample-dependent.
Nevertheless, several of our key findings continue to hold in this case. First, the negative relation between number of fund changes and performance is still present. Second, the qualitative findings of our regression analysis continue to hold. Specifically, all the learning effects, both in signs and magnitudes, are still present. Examining different sub-samples yields similar qualitative results. The details of these results are available upon request.
3.3.4 Simulating performance
In order to provide additional evidence on the issue of whether skill or luck is the main driver of the results achieved by the best-performance group, we follow a procedure along the lines of Bajgrowicz and Scaillet (Reference Bajgrowicz and Scaillet2012). Specifically, we estimate the investment rules followed by the best and worst performers in our data. We then simulate the investment decisions that would result for each rule and compare the distributions of returns obtained to assess differences in performance.
In order to estimate the investment rules, we discretize the dependent variable in a total of eight categories: from −4 to 4. An individual that moves to a fund with less equity is assigned a negative number. In particular, −4 is the lowest number possible, and it corresponds to moving from fund A to fund E. On the other hand, four is the highest number possible, representing an investor that changes from fund E to fund A. The baseline case is zero, i.e., no fund change. This variable is modelled using a multinomial logit model. We maintain the same set of controls. As we previously explained in Section 3.2, specifications test casts doubt on the use of more intuitive ordered probit models. We opt to use the multinomial probit specification, which provides consistent, albeit inefficient estimates.Footnote 33 After estimating the investment rules we generate 1,000 different return histories for funds A to E, as well as the GARCH standard deviation of these returns. We also simulate Rm and Rf. The returns are generated through a bootstrapping procedure, avoiding the need to make ex ante assumptions about the distributions for the returns. We apply the estimated decision models to each of the return paths. This allows us to calculate the average return and alpha obtained, as well as the empirical distribution for these variables. We omit the corresponding output and merely note that the distributions obtained are quite similar for both rules. Indeed, in our sample the average alpha for the best performing group was 3.56% and it only reached 1.63% for the worst performance group. However, the simulated average annualized alpha for the best and worst performance groups is 0.6511% and 0.6443%, respectively.
3.3.5 Market timing firms and fund changes
Recently, some firms that sell advice regarding the best moment to change between pension funds have gained notoriety in Chile. In exchange for a monthly fee, these firms send announcements to subscribers, recommending fund changes, which typically involve a considerable adjustment in equity exposure (e.g., changes from Fund A to Fund E or vice versa) and are aimed at achieving market timing.Footnote 34
We have already controlled for the presence of this advice in all our regressions. However, as a robustness analysis, we check if our conclusions are sensitive to the presence of members that follow these announcements. We have information on the date and advised equity adjustments for 32 announcements that took place between 2011 and 2016. Using this information, we find that for 255 individuals (6.2% of those with one or more fund change) there is at least one match in dates. Excluding this group does not affect our results. This lack of relevance seems to contrast with the evidence of Da et al. (Reference Da, Larrain, Sialm and Tessada2018), who report a significant impact on the price of some domestic financial instruments following these announcements. Our data provide a possible explanation, since among the 255 individuals who have followed the firms' advice, only 14 of them (0.4% of individuals with at least one fund change in our sample) have done so for more than half of their changes. This suggests that price effects are not driven by a large group composed by the same individuals. Rather, it seems that the increasing number of fund changes is fueled by ‘newcomers’.
4. Conclusions
In this paper we characterize those members of the Chilean DC pension system that make fund changes, assess the performance of their decisions, and identify if they learn from their past investment decisions.
Our evidence shows that the average performance obtained by individuals is poor, although this finding is influenced by the low returns experienced during the Sub-prime Crisis. Nevertheless, there is robust evidence that performance is decreasing in the number of fund changes made, regardless of the sample period. Additionally, our analysis involving simulated returns casts further doubt on the existence of true investment skills in our sample.
We have documented the presence of a sizeable feedback effect between perceived ability and the subsequent likelihood to make more fund changes. However, the direction of this relation is positive when past changes are evaluated according to naive and counter factual rules. The naive rule's positive effect on the probability of making fund changes continues to hold even when we study a smaller cohort of individuals for whom we are able to observe their entire fund-changing history.
Taken together, our findings suggest that part of fund changing activity observed may be explained by individuals who make large increases and decreases in equity exposure. Moreover, these individuals appear to use simplified and inadequate rules to evaluate the success of past decisions.
From a policy stand, our results suggest that the advantages of having flexibility in investment decisions should be weighed against the actual outcomes obtained by members who are making frequent use of these possibilities as well as against the potential negative effects on local financial markets (see Larrain et al., Reference Larrain, Muñoz and Tessada2017; Da et al., Reference Da, Larrain, Sialm and Tessada2018). Our results suggest that so far, the average member of the system has not obtained an adequate performance as a result of making active investment decisions.
An adequate policy response would warrant tackling this issue from several directions. For instance, improvements could be made so the information that members receive about the effects of their investment decisions allows them to be fully aware of any subpar performance. Additionally, restrictions on the number and the type of fund changes could be implemented. The existent default investment strategy could provide guidance in this regard.Footnote 35 Indeed, this strategy calls for no more than one fund change per year and only between adjacent funds (e.g., a change from fund A to fund B would be consistent with the adjacent fund restriction, but not a change from fund A to fund C, D, or E). Moreover, under this strategy, no more than 20% of the individual's balance is transferred at one time. Along this line, Korea and Latvia only allow two investment changes per year.Footnote 36 Finally, explicit costs could be introduced to members with frequent investment adjustments. These costs could take the form of fees, which PFM should charge, or they could be introduced through swing price policies, similar to the ones often used by mutual funds. This policy introduces a bid-ask spread for members who make frequent fund changes. Thus, these individuals redeem (buy) fund shares at a price that is lower (higher) than the true share market price. This practice aims to make frequent fund changers internalize the costs (i.e., transaction costs) that their decisions have on the rest of members of the fund.
The importance of avoiding investment mistakes that lead to lower average returns has increased in recent years. Indeed, amidst the COVID-19 pandemic, legislators passed special regulation allowing early access of up to 10% of mandatory pension savings. According to the Pension Regulator, this has resulted in more than four million of system members to have emptied their pension savings accounts.Footnote 37 Streamlining investment decisions will certainly play a role to minimize the negative impact of these withdrawals on future pensions for Chilean workers.
Our results are relevant for policy makers of jurisdictions which feature individual pension savings accounts and where members have the opportunity of making investment decisions. In all of these cases, regulators would benefit from gaining insights into the motivations behind members' investment decisions and the possible existence of behavioral biases in this process.
Finally, improving our understanding of the way in which individuals learn about the consequences of their investment decisions seems like an interesting and relevant research avenue, with potential implications beyond the scope of pension systems.
Acknowledgement
We are grateful to Solange Berstein, Matías Braun, Pablo Castañeda, Luis Figueroa, Iftekhar Hasan, Kose John, Wojciech Kopczuk, Alejandra Marinovic, Olivia Mitchell, Herve Roche, Stephen Utkus, and Marno Verbeek for their comments and suggestions. We also benefited from comments by assistants to the First Conference on Financial Stability and Sustainability, the Netspar International Pension Workshop, and Adolfo Ibáñez Business School seminars. Our views and conclusions do not necessarily represent those of the Superintendencia de Pensiones. Remaining errors are our own.



