


Introduction
For understanding the Arctic ice-occan system it is necessary to develop coupled ice ocean models that can reproduce climatological changes in appropriate ways. The occurrence of ice affects the forcing of ocean circulation. Likewise, heat and salt transport in the ocean helps determine the long-term thickness and extent of sea ice. Because most oceanic heat enters the Arctic from the Atlantic Ocean, correct representation of Atlantic water circulation is particularly important. Observed radionuclide distributions from European fuel reprocessing provide an opportunity to evaluate different circulation schemes for this water. We explore how the representation of sub-grid eddies and the improved numerical simulation of advection lead to a tracer distribution that is more consistent with that which is observed (Reference Livingston, Bowen and KupermanLivingston and others, 1982a, Reference Livingston, Bowen and Kupermanb).
Soluble radionuclides, from the Sellafield nuclear-power station in northern England, are carried northwards from the Irish Sea, around the west coast of Scotland, and into the North Sea (Reference Livingston, Bowen and KupermanLivingston and others, 1982a,Reference Livingston, Bowen and Kupermanb), mixing with additional components from La Hague (France). Then they are transported northwards in the Norwegian Coastal Current (Reference Holm, Persson, Hallstadius, Aarkrog and DahlgaardHolm and others, 1983) before splitting off northern Norway. One branch flows eastwards into the Barents Sea, while the other becomes part of the West Spitsbergen Current, entering Nansen Basin through Fram Strait (Reference Smith, Ellis and JonesSmith and others, 1990). A portion then returns southward in the East Greenland Current (Reference Aarkrog, Dahlgaard, Hansen and HolmAarkrog and others, 1983; Reference Livingston, Swift and ÖstlundLivingston and others, 1985).
Model Description
A multi-level primitive-equation model (Reference BryanBryan, 1969; Reference CoxCox, 1989: Reference PacanowskiPacanowski, 1995) was coupled to a dynamic thermodynamic sea-ice and snow model (Reference HiblerHibler, 1979; Reference Parkinson and WashingtonParkinson and Washington, 1979), using a spherical coordinate system. The ocean was specified with three velocity components, potential temperatures and salinity, while the sea ice was specified with ice velocity, thickness and compactness. The sea-ice model supplied the heat, salt and momentum exchange for the ocean surface, whereas the ocean model supplied the current and heat-transfer data for the ice model. The atmospheric forcing (monthly climatological fields of wind stress, surface-air temperature, humidity, radiation and heat fluxes) came from datasets or bulk formulae (Reference Trenberth, Olson and LargeTrenberth and others, 1989; Reference Schubert, Rood and PfaendtnerSchubert and others, 1993; Reference Chapman, Welch, Bowman, Sacks and WalshChapman and others, 1994).
The study covered the Arctic Ocean and northern parts of the Greenland and Norwegian Seas. Along the open boundaries with the Atlantic Ocean and Bering Sea, we used momentum boundary conditions derived from a larger-scale ocean model. Reference LevitusLevitus’ (1982) temperature and salinity data were applied for inflow with free conditions set for the outflow of tracers. To avoid the singularity effect at the Pole, we employed Reference Eby and HollowayEby and Holloway’s (1994) grid rotation. The horizontal resolution of the model is 55 km, with 29 levels in the vertical, covering a total depth of 4350 m, and expanding in thickness from 10 m at the surface to 290 m in the deep ocean. The configuration of the basin is defined by the depth field from ETOPO5 (1986), with correction near the North Pole.
The model includes parameterization of the interaction of the bottom topography and sub-gridscale eddies that act as a driving force (the “neptune” effect) in ocean circulation (Reference HollowayHolloway, 1992; Reference Alvarez, Tintoré, Holloway, Eby and BeckersAlvarez and others, 1994). We present the results of two numerical experiments: a ccntered-difference advection (CDA) scheme with constant diffusion without neptune, and a flux-corrected transport (FCT) scheme (after Reference Gerdes, Koberle and WillebrandGerdes and others, 1991) with neptune parameterization. To limit the numerical dispersion by centered-difference advection, an explicit diffusion larger than can be attributed to physical mixing was added (Reference RoodRood, 1987). For the centered-difference advection scheme, the horizontal and vertical diffusions were 102 and 2 × 10⁻⁵ m2 s−1, respectively.
From initial conditions of zero velocity, no ice, and annual mean Reference LevitusLevitus (1982) temperature and salinity, integration proceeded under monthly-varying forcing until quasi-equilibrium was attained in the upper and intermediate depths. The acceleration method (Reference BryanBryan, 1984) was used with this time-dependent forcing. Test cases using different acceleration ratios showed only a weak dependence on the acceleration factor. After quasi-equilibrium was attained, a constant tracer source was introduced into the Norwegian Coastal Current, as an idealized European source of reprocessing radionuclides. The models were then integrated for a further 15 years.
Results
Arctic Ocean
Surface-water circulation in the Arctic Ocean is largely understood from studies of sea-ice drift. Prominent long-term features of this are the anticyclonic Beaufort Gyre, which occupies most of the Canada Basin, and the Transpolar Drift that flows across the Pole towards Fram Strait. The coupled ice-ocean model qualitatively reproduces these features.
Sub-surface circulation (42.5 m) shows the Beaufort Gyre with only modest differences between CDA and FCT (Fig. 1). At this depth, water motion in the experiments does not produce the Transpolar Drift. However, ice motion (not shown) is nearly the same for both and is consistent with the observed Transpolar Drift.
Velocities at 42.5 m for (a) CDA without neptune, and (b) FCT with neptune.
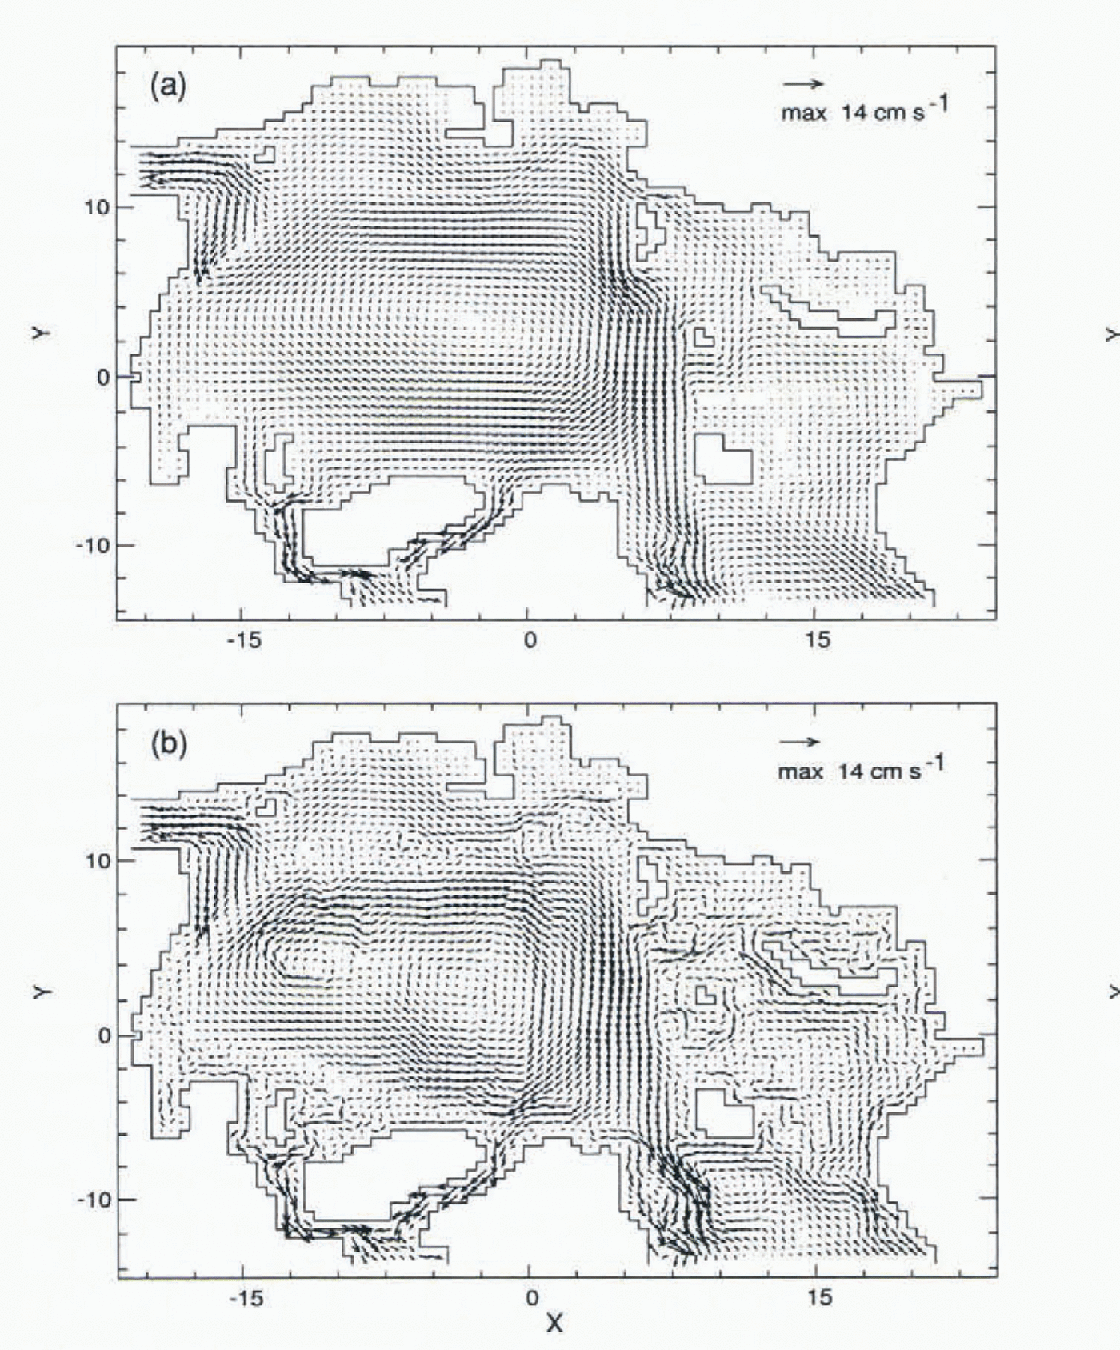
The Norwegian Coastal Current (NCC), which follows the western and northern roast of Norway before flowing into the Barents Sea, splits into two main branches: one turns eastwards and continues as a coastal current, the other turns northwards before subdividing into smaller branches. Figure 1 shows differences in the Barents Sea circulation generated by the two experiments.
Two main currents exchange water through Fram Strait. The West Spitsbergen Current (WSC), an extension of the NCC, flows through Fram Strait, off the west coast of Spitsbergen, carrying warm, salty water into the Arctic Ocean. Its continuation is complex, as the current appears to split into two or more branches (Reference Perkin and LewisPerkin and Lewis, 1984; Reference Aagaard, Foldvik and HillmanAagaard and others, 1987). For the CDA case with viscous damping (Fig. 1a), the WSC was not seen, but with FCT and neptune (Fig. 1b) the near-surface WSC does appear.
The second main current is the East Greenland Current (EGC) that exits from the Arctic Ocean. Fram Strait appears to be a region of pronounced recirculation of Atlantic water, much of it joining the southward-moving EGC.
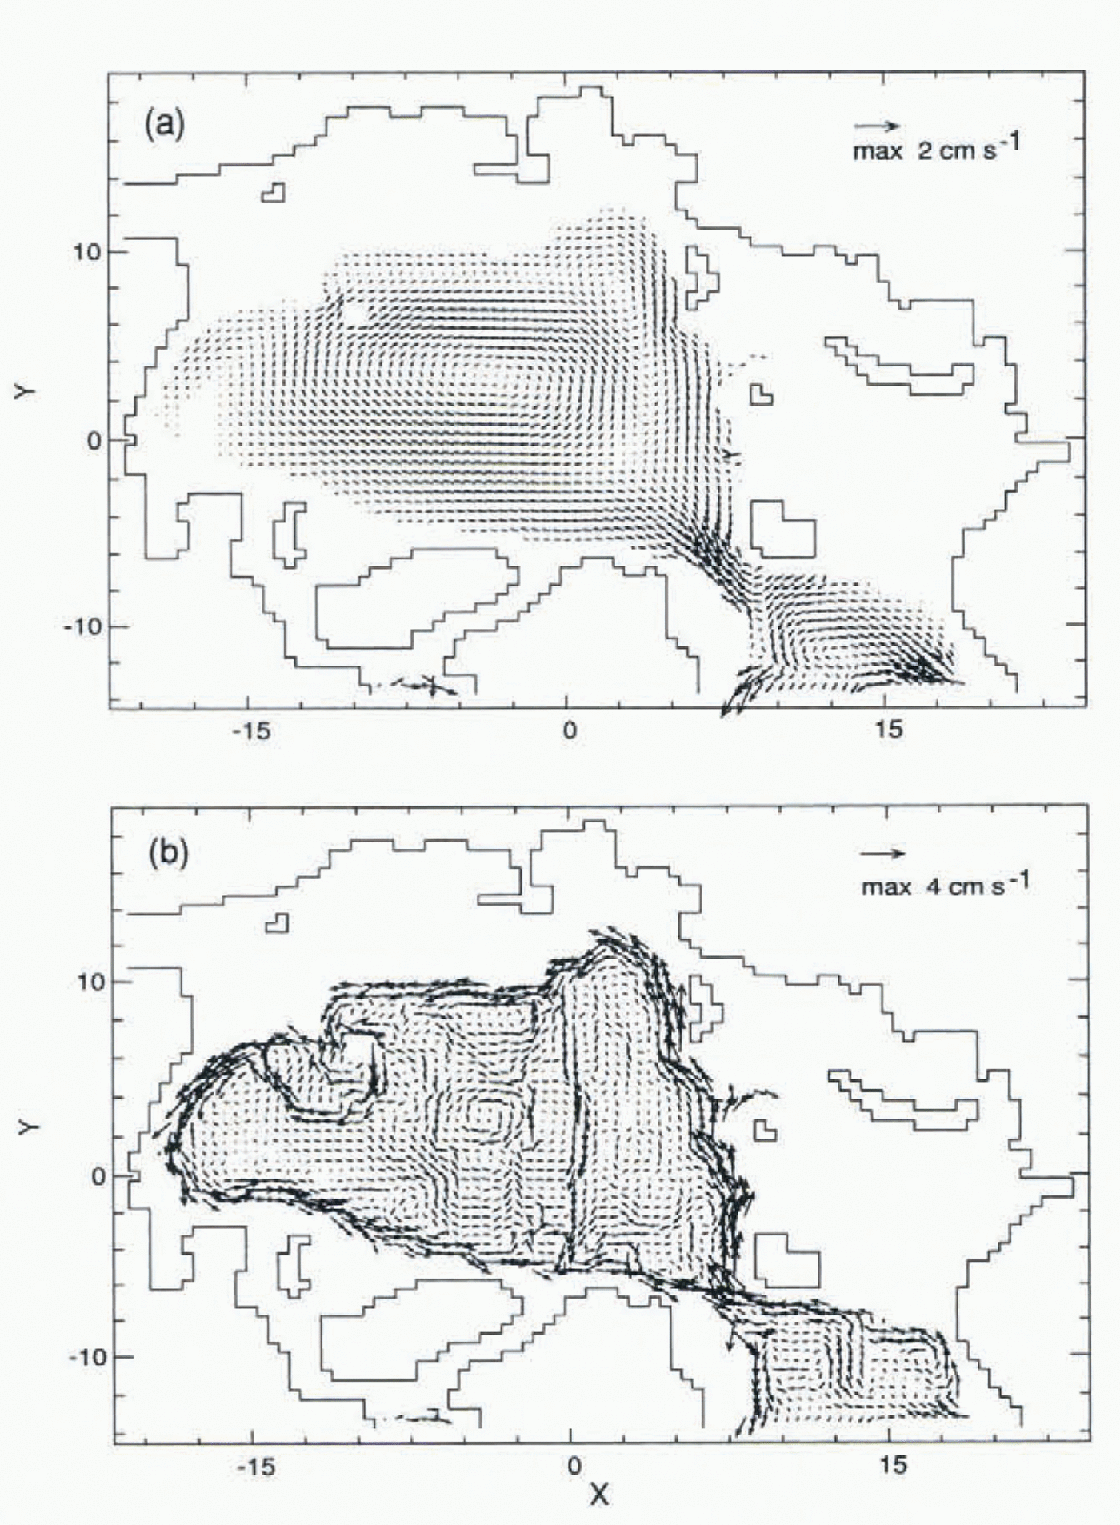
The differences between the two cases are clearly seen at intermediate depths (497.5 m, Fig. 2). With FCT and neptune (Fig. 2b), the cyclonic circulation of Atlantic-derived water is dominated by several gyres steered by topographic features, such as the Gakkel, Lomonosov and Alpha-Mendeleev ridges. The FCT and neptune case also shows the exiting EGC at intermediate depths, a feature absent in the CDA viscous-damping case (Fig. 2a).
Velocities at 497.5 m for (a) CDA without neptune, and (b) FCT with neptune.
Transport of contaminants
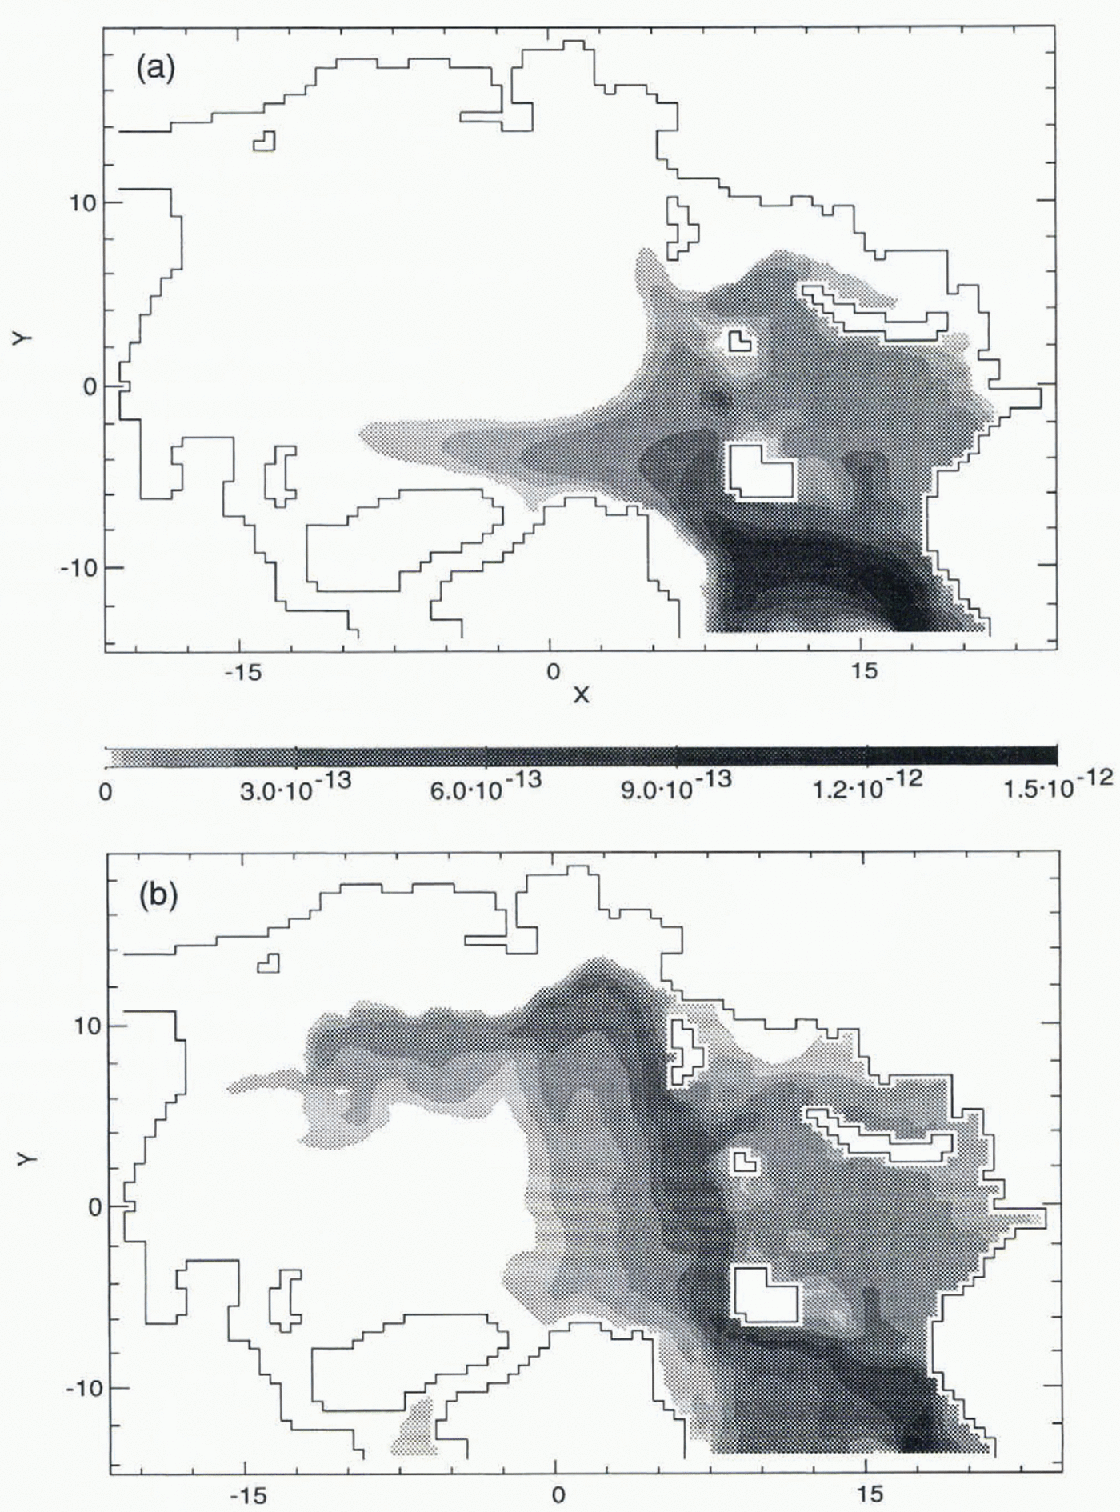
To investigate potential radionuclide pathways in the Arctic Ocean, we included an idealized source, consisting of an assigned (constant) concentration on the open boundary from the NCC, to represent the European reprocessing contaminants as reported by Reference Kershaw and BaxterKershaw and Baxter (1995). Figure 3 shows the vertically integrated tracer burden after 15 years. The CDA without neptune (Fig. 3a) shows a diffuse contamination field because of a large explicit diffusion and unrealistic circulation.
Vertically integrated tracer burden. Units are burden per unit surface area, normalized by the source release for (a) CDA without neptune, and (b) FCT with neptune.
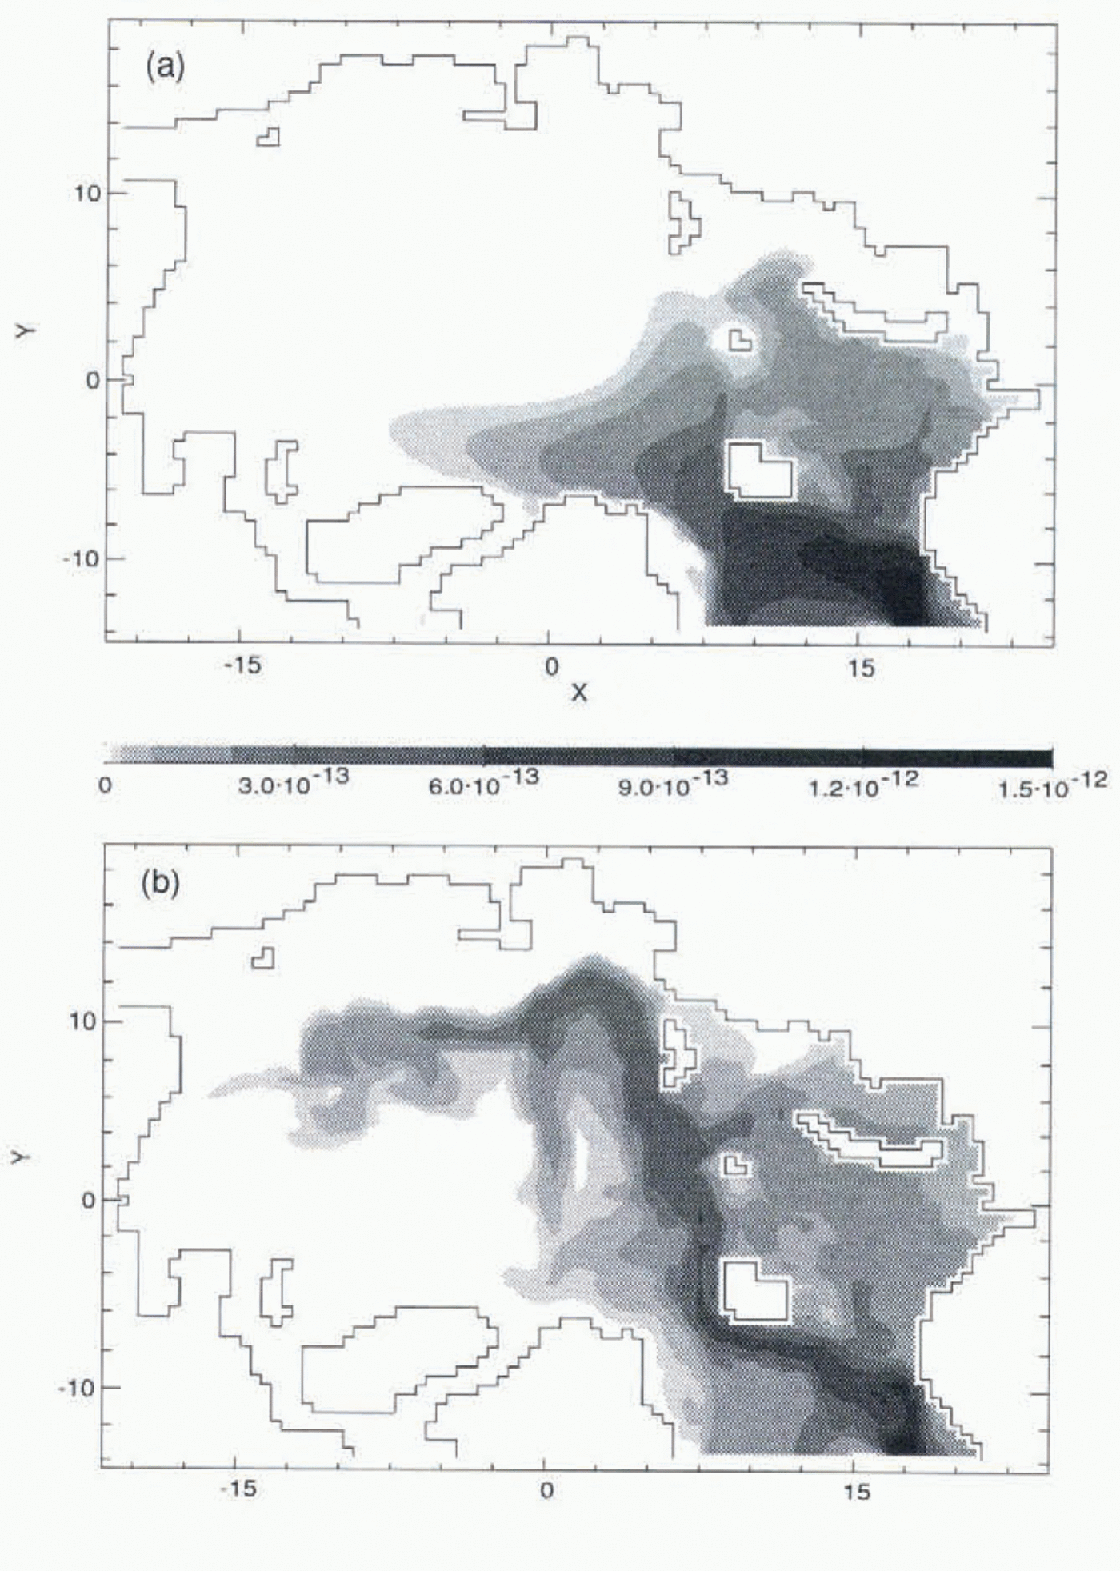
The FCT case with neptune is more realistic (Fig. 3b). Some contaminants enter the Barents Sea via the NCC, while the rest flow northwards with the WSC. In Fram Strait, there is a partial recirculation southwards in the EGC Figs 1, 2 and 3b) while the northward branch sinks and follows the shelf break in the Nansen Basin as a boundary current. This current is relatively strong, increasing with depth through the Atlantic layer into deeper water, and moving counter to the surface flow (Figs 1, 2 and 3b). It takes contaminants along the Eurasian slope and returns along the Lomonosov Ridge (Fig. 3b). Contamination spreading to the Canada Basin is carried by a counter-clockwise flow along the continental margin opposite to the surface flow (Fig. 2).
In the Barents Sea, contamination flows along the coast of Norway (Fig. 3). Most contaminants spread along the western coast of Novaya Zemlya (Fig. 2). Smaller branches of the NCC carry contamination to other parts of the Barents and Kara Seas. Modified Atlantic water in the Barents Sea exits along the eastern flank of the St Anna Trough, carrying contaminants into the Arctic Basin. Part of the WSC also turns into the Barents Sea along the western flank of this trough.
Figure 4 shows contamination concentration and velocity normal to a vertical sections along Y = 0.0 (through the North Pole). Shaded areas denote normal velocity “out” of the page (negative), while blank areas denote velocity “into” the page (positive). Near X = 7.4 contaminants are brought into the Arctic Ocean from Fram Strait by the intermediate-depth current. Much less contamination leaves the Arctic with the outflow at X = 5.0 (Fig. 4b) where velocities become negative. The model with FCT and neptune produces the returning flow along the Lomonosov Ridge at X = 2.0 (Fig. 4b).
Tracer concentration and velocity normal to the section γ = 0 in Fig. 1. Shading indicates flow “out” of the page. Contours are tracer concentration relative to the source for (a) CDA without neptune, and (b) FCT with neptune.
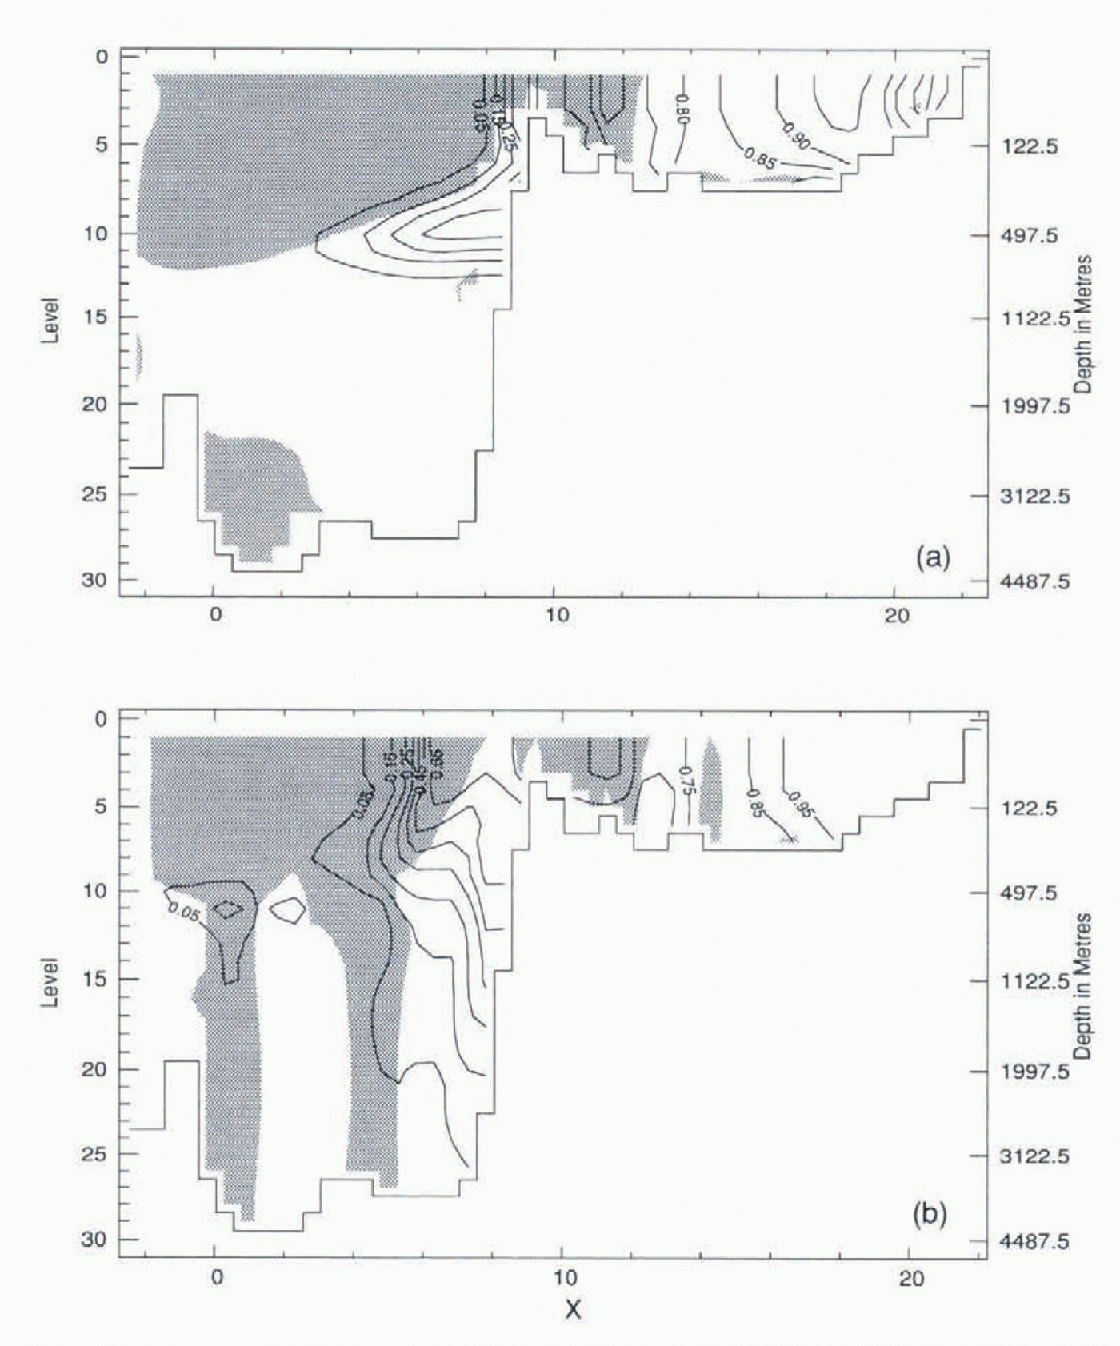
The distribution of contamination from the CDA without neptune model is shown in Figure 4a . The distribution is dominated by the explicit diffusion, necessary to maintain numerical stability, that makes the contaminants spread in an unrealistic flow field (Reference Kershaw and BaxterKershaw and Baxter, 1995).
Because improvements have resulted from the use of FCT with neptune, the question arises as to how much each modification would contribute separately. Figure 5 has the same format as Figure 3, except that Figure 5a is based on FCT without neptune and Figure 5b uses CDA with neptune. Most of the overall improvement (Fig. 3b) results from including the neptune effect (on account of modified circulation patterns). The FCT is, nonetheless, helpful in retaining sharper property contrasts in the contaminant field and in the temperature and salinity fields.
Vertically integrated tracer burden for (a) FCT without neptune, and (b) CDA with neptune.
Finally, a word of caution. Our comparisons were based upon the GFDL ocean model (Reference PacanowskiPacanowski, 1995) which is gridded on fixed z-levels. Model results are also dependent on the underlying architecture, which is sometimes poorly understood. We do not know how the apparent progress made here may carry over to other models such as the sigma-coordinate (Reference Häkkinen and MellorHäkkinen and Mellor, 1992) or isopycnal-layer (Reference HollandHolland, 1994) models.
Summary
A multi-level primitive-equation model, coupled to a dynamic—thermodynamic sea-ice model, was used to explore the distribution of radionuclides from idealized European reprocessing sources. The research focused on determining the possible effects of the parameterization for unresolved eddies, and an advection scheme on contamination distribution in the Arctic Ocean. The model with small mixing and improved physics (FCT with neptune) simulated a more realistic circulation and contamination distribution than the centered-difference advection scheme with constant diffusion (CDAwithout neptune).
Acknowledgements
This research has been supported in part by the Panel on Energy Research and Development (Canada) under project 6B2027 and by the Office of Naval Research under grant N00014-96-1-0518.



