Introduction
Autism spectrum disorder (ASD) is a neurodevelopmental condition characterized by difficulties with reciprocal social interaction and communication, and the presence of repetitive, stereotyped behaviours and interests. ASD regularly co-occurs with other psychiatric and neurodevelopmental disorders; upwards of 70% of individuals with ASD meet diagnostic criteria for an additional psychiatric or neurodevelopmental disorder (de Bruin et al. Reference de Bruin, Ferdinand, Meester, de Nijs and Verheij2007; Simonoff et al. Reference Simonoff, Pickles, Charman, Chandler, Loucas and Baird2008). Attention deficit hyperactivity disorder (ADHD) is particularly common; 28–60% of individuals meeting criteria for ASD also meet diagnostic criteria for ADHD (Yoshida & Uchiyama, Reference Yoshida and Uchiyama2004;Simonoff et al. Reference Simonoff, Pickles, Charman, Chandler, Loucas and Baird2008), and subclinical traits associated with these conditions show considerable covariation in the general population (Ronald et al. Reference Ronald, Simonoff, Kuntsi, Asherson and Plomin2008). While the fifth edition of the Diagnostic and Statistical Manual of Mental Disorders (DSM-5; APA, 2012) will introduce changes, current diagnostic criteria (APA, 2000) do not allow dual diagnosis of these conditions, and their co-occurrence hence remains poorly understood.
Behavioural genetic research has recently investigated whether shared genetic and environmental risk factors underlie ASD and ADHD. Findings from family studies are inconsistent. Nijmeijer et al. (Reference Nijmeijer, Hoekstra, Minderaa, Buitelaar, Altink, Buschgens, Fliers, Rommelse, Sergeant and Hartman2009) reported that ADHD and traits of ASD were genetically independent of one another. Conversely, Mulligan et al. (Reference Mulligan, Anney, O'Regan, Chen, Butler, Fitzgerald, Buitelaar, Steinhausen, Rothenberger, Minderaa, Nijmeijer, Hoekstra, Oades, Roeyers, Buschgens, Christiansen, Franke, Gabriels, Hartman, Kuntsi, Marco, Meidad, Mueller, Psychogiou, Rommelse, Thompson, Uebel, Banaschewski, Ebstein, Eisenberg, Manor, Miranda, Mulas, Sergeant, Sonuga-Barke, Asherson, Faraone and Gill2009) reported that 56% of the phenotypic correlation between ADHD and ASD could be attributed to shared familial influences.
Twin studies have more consistently found evidence for overlapping genetic influences between these conditions and their related subclinical traits. With the possible exception of early childhood (Ronald et al. Reference Ronald, Edelson, Asherson and Saudino2010a), when it can be more challenging to assess traits related to ASD and ADHD, twin studies suggest that traits of ASD and ADHD share considerable genetic influences when assessed in middle childhood (Ronald et al. Reference Ronald, Simonoff, Kuntsi, Asherson and Plomin2008; Lichtenstein et al. Reference Lichtenstein, Carlström, Råstam, Gillberg and Anckarsäter2010; Lundström et al. Reference Lundström, Chang, Kerekes, Gumpert, Råstam, Gillberg, Lichtenstein and Anckarsäter2011), early adolescence (Lichtenstein et al. Reference Lichtenstein, Carlström, Råstam, Gillberg and Anckarsäter2010; Lundström et al. Reference Lundström, Chang, Kerekes, Gumpert, Råstam, Gillberg, Lichtenstein and Anckarsäter2011), early adulthood (Reiersen et al. Reference Reiersen, Constantino, Grimmer, Martin and Todd2008) and adulthood (Lundström et al. Reference Lundström, Chang, Kerekes, Gumpert, Råstam, Gillberg, Lichtenstein and Anckarsäter2011), and share a modest degree of environmental influences (Reiersen et al. Reference Reiersen, Constantino, Grimmer, Martin and Todd2008; Ronald et al. Reference Ronald, Simonoff, Kuntsi, Asherson and Plomin2008).
Despite the developmental nature of ASD and ADHD, longitudinal studies of their association are lacking. Longitudinal designs enable questions surrounding causality to be addressed in terms of how the phenotypes of interest influence one another across development. One study to date has used longitudinal methods to examine the developmental association between traits of ASD and ADHD. St Pourcain et al. (Reference St Pourcain, Mandy, Heron, Golding, Davey Smith and Skuse2011) used latent class growth analysis to explore the association of social–communication traits and traits of ADHD across development. They found that children with persistently impaired social–communicative abilities were either moderately or persistently impaired on hyperactive–inattentive behaviours. Additionally, children with persistent hyperactive–inattentive symptoms displayed more persistent social and communication difficulties.
No twin research to date has adopted longitudinal methods to explore the association between traits of ASD and ADHD. Cross-lagged modelling is a form of twin modelling that considers the direct influence of multiple phenotypes on one another across development while controlling for their concurrent association at an earlier age (Burt et al. Reference Burt, McGue, Krueger and Iacono2005). The model also estimates genetic and environmental influences on each trait at each specified age, as well as their genetic and environmental overlap. The model also shows the proportion of genetic and environmental influences that are transmitted across time, and the proportion that are unique to each age. While cross-lagged modelling has been used to explore other behaviours in childhood (e.g. Burt et al. Reference Burt, McGue, Krueger and Iacono2005; Hallett et al. Reference Hallett, Ronald, Rijsdijk and Happé2010; Greven et al. Reference Greven, Asherson, Rijsdijk and Plomin2011), we are the first to explore phenotypic-driven processes as they relate to ASD and ADHD using this method.
We aimed to explore longitudinal associations between traits of ASD and ADHD between the ages of 8 and 12 years using cross-lagged modelling. We specifically focused on the period between the ages of 8 and 12 years due to the important developmental changes that occur across this period, as the transition from childhood to adolescence begins. We aimed to assess the direct influence of traits of ASD on traits of ADHD across this period, as well as the reverse association to explore the bidirectional causal relationship across development. Given the putative ‘fractionable’ nature of the core symptoms of ASD (Happé et al. Reference Happé, Ronald and Plomin2006; Ronald et al. Reference Ronald, Happé, Bolton, Butcher, Price, Wheelwright, Baron-Cohen and Plomin2006; Happé & Ronald, Reference Happé and Ronald2008) and evidence for some genetic specificity within traits of ADHD (McLoughlin et al. Reference McLoughlin, Ronald, Kuntsi, Asherson and Plomin2007; Asherson & Gurling, Reference Asherson and Gurling2012), we also fitted cross-lagged models to measure subscales exploring associations between specific symptom domains of ASD and ADHD. St Pourcain et al. (2012) provided evidence to suggest a dynamic relationship between traits across development; hence we expected that traits of ASD and ADHD would significantly influence one another across development. Given the lack of genetically informative, longitudinal research regarding the association of traits of ASD and ADHD, we did not have specific hypotheses concerning the relative strengths of the associations.
Additionally, we aimed to estimate the degree of genetic and environmental overlap across traits of ASD and ADHD by applying bivariate twin model fitting to data at age 12 years. Ronald et al. (Reference Ronald, Simonoff, Kuntsi, Asherson and Plomin2008) reported bivariate twin models for traits of ASD and ADHD when the sample used in the present study were aged 8 years. With the advantage of using the same sample and the same measures as this previous study, we aimed to explore the extent to which common genetic and environmental influences operate on traits of ASD and ADHD when the twins were aged 12 years. We expected traits of ASD and ADHD to show moderate genetic overlap, and a modest degree of environmental overlap.
Method
Participants
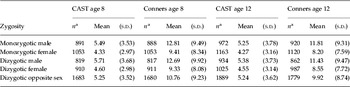
Parents of twins participating in the Twins Early Development Study (TEDS) completed questionnaires regarding their twins' traits of ASD and ADHD. TEDS is a community sample of twins born in England and Wales between 1994 and 1996 (Oliver & Plomin, Reference Oliver and Plomin2007). Data were collected when twins were aged 8 and 12 years. A total of 6762 families returned questionnaires when twins were aged 8 years, while 7520 were returned at age 12 years. Participants were excluded if they displayed specific medical syndromes, such as Down's syndrome or Fragile X, and chromosomal abnormalities. Exclusions also included extreme perinatal complications, unavailable zygosity data, lack of informed consent, missing birth order details, and unavailable first contact data. A total of 1406 twin pairs were excluded at age 8 years and 1537 were excluded at age 12 years. The final sample comprised 5356 twin pairs at the age of 8 years and 5983 twin pairs at the age of 12 years. Zygosity was determined by DNA testing and parental report (Goldsmith, Reference Goldsmith1991), which has been shown to be 95% as accurate as DNA testing (Price et al. Reference Price, Freeman, Craig, Petrill, Ebersole and Plomin2000). Sample frequencies by zygosity are presented in Table 1. Written informed consent was provided prior to completion of the questionnaires.
Scores for each of the scales at both ages, split by zygosity

CAST age 8, 31-item Childhood Autism Spectrum Test at age 8 years; Conners age 8, Conners' Parent Rating Scale at age 8 years; CAST age 12, 30-item Childhood Autism Spectrum Test at age 12 years; Conners age 12, Conners' Parent Rating Scale at age 12 years; s.d., standard deviation.
a Frequency of the sample by zygosity and sex is given by the number of twin pairs.
Measures
Traits of ASD
Parents completed the Childhood Autism Spectrum Test (CAST; Scott et al. Reference Scott, Baron-Cohen, Bolton and Brayne2002) at both ages. The CAST comprised 31 items at age 8 years and 30 items at age 12 years (due to the removal of an age-inappropriate item). Questions concern behaviours associated with ASD in children, and are answered ‘yes’ or ‘no’. The maximum score is 31; those scoring 15 or above are defined as ‘at risk’ of ASD (Williams et al. Reference Williams, Scott, Stott, Allison, Baron-Cohen and Brayne2005). The CAST provided an overall score and, in-line with prior studies (Ronald et al. Reference Ronald, Happé, Bolton, Butcher, Price, Wheelwright, Baron-Cohen and Plomin2006, Reference Ronald, Happé, Dworzynski, Bolton and Plomin2010b), was also broken down into three subscales corresponding to Diagnostic and Statistical Manual of Mental Disorders, fourth edition, text revision (DSM-IV-TR) subcategories of ASD symptoms: (a) social, (b) communication, and (c) repetitive, restrictive behaviours/interests (RRBI). The CAST displayed good internal consistency (age 8 years: α = 0.71; age 12 years: α = 0.73).
Traits of ADHD
Traits of ADHD were rated by parents at both ages using the ADHD subscale of the Conners' Parent Rating Scale (Conners) (Conners et al. Reference Conners, Sitarenios, Park and Epstein1998). The scale includes 18 items, which correspond closely to DSM-IV-TR symptom criteria for ADHD. Parents rated the extent to which each statement is true of their child on a four-point scale (maximum score = 54). As well as an overall ADHD symptom score, the scale data were divided into two subscales corresponding to the two ADHD symptom domains: hyperactivity/impulsivity and inattention. The Conners displayed excellent internal consistency (α = 0.91 at both ages).
Data analysis
Data preparation
The CAST and Conners scales were log-transformed for positive skew to meet with the assumptions of twin modelling. The effects of sex and age were regressed out of the CAST and Conners scales in line with standard behavioural genetic procedures, and analyses were conducted on residual scores.
Correlations
Cross-trait cross-twin (CTCT) intraclass correlation coefficients (ICCs) are the foundation of bivariate twin modelling. These correlate one twin's CAST score with their co-twin's Conners score, and cannot exceed the phenotypic correlation between traits. Using SPSS (SPSS Inc., USA), the CTCT ICCs were obtained separately for monozygotic (MZ) and dizygotic (DZ) twins. MZ twins share 100% of their DNA code, while DZ twins share approximately 50% of their DNA code (Hall, Reference Hall2003). Consequently, genetic influences on the phenotypic correlation are implied if the MZ ICC exceeds the DZ ICC. Since MZ twins are genetically identical, any within-pair MZ differences are caused environmentally. Hence, if the MZ ICC is less than the phenotypic correlation, the presence of non-shared environmental influences, which create differences between twins and include measurement error, on the covariance between traits is suggested. Shared environmental influences create cross-twin similarity, and are implicated if the DZ ICC is greater than half the MZ ICC. These correlations were computed across trait scores at each age and across age groups.
Bivariate twin model fitting at age 12 years
Bivariate twin model fitting estimates parameters corresponding to additive genetic (‘A’), shared environmental (‘C’) and non-shared environmental (‘E’) influences for each trait. The ‘genetic correlation’ (r g) estimates genetic overlap between traits; r g falls between −1 and 1. If r g = 1 or −1, all genetic influences are shared between two traits, while r g = 0 indicates no shared genetic influences. Shared environmental (r c) and non-shared environmental (r e) correlations are also computed and operate in the same fashion. Such a model is termed the ‘ACE’ model or Cholesky decomposition, and was fitted using Mx (Neale et al. Reference Neale, Boker, Xie and Maes2003). AE, CE, and E models that constrained certain parameters to equal zero, enabling an assessment of their significance, were fitted in addition to the ACE model. Quantitative sex differences were tested with sex limitation models, which provide separate parameter estimates for males and females. This model was fitted without the inclusion of DZ opposite-sex twins.
Cross-lagged modelling between the ages of 8 and 12 years
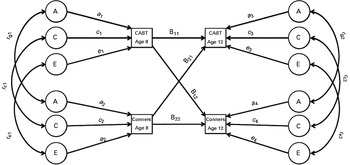
Cross-lagged modelling explored longitudinal associations. Fig. 1 presents an example cross-lagged path diagram. A, C and E are estimated for each trait at each age, as well as r g, r c and r e. At the second age, these are residual correlations, and hence may differ from estimates derived in a bivariate model at one age only. B11 and B22 are stability pathways, and assess the effect of each trait at the age of 8 years on the same trait at the age of 12 years. B12 and B21 are cross-lagged pathways, and estimate the direct influence of traits of ASD at the age of 8 years on traits of ADHD at the age of 12 years (B12), and vice versa (B21). Stability and cross-lagged pathways are partial regression coefficients that assess the direct influence of traits at the age of 8 years on traits at the age of 12 years whilst accounting for their pre-existing association at the age of 8 years (Burt et al. Reference Burt, McGue, Krueger and Iacono2005). The model estimates the percentage of variance in each trait unique to age 12 years and that which is shared across ages, which is further decomposed into that due to A, C and E influences on each trait and their covariance at the age of 8 years. All parameters within the cross-lagged model were estimated separately for males and females, with the exception of r g, r c and r e, which were constrained to be equal across sexes due to the inclusion of opposite-sex DZ twins (Neale et al. Reference Neale, Røysamb and Jacobson2006). Models were fitted to full-scale CAST and Conners scores, and measure subscales. These models explored associations between CAST subscales and the overall Conners scale (CAST social–Conners, CAST RRBI–Conners, CAST communication–Conners), Conners subscales and overall CAST scale (Conners hyperactivity/impulsivity–CAST, Conners inattention–CAST), and six models exploring the association of each of the three CAST subscales with the two Conners subscales. Models were also fitted controlling for the effects of a composite ‘g’ score, which assessed general cognitive ability, and both with and without individuals with confirmed or suspected ASD included. Cross-lagged models were fitted using Mx (Neale et al. Reference Neale, Boker, Xie and Maes2003).
Example cross-lagged path diagram. A, C and E are latent variables that estimate the degree of additive genetic (A), shared environmental (C) and non-shared environmental (E) influences operating upon each trait individually at each age. The additive genetic (r g), shared environmental (r c) and non-shared environmental (r e) correlations indicate the proportion of these influences that are shared across traits at each age. Longitudinal associations are indexed by parameters labelled B11, B12, B22 and B21. B11 and B22 are stability effects, and indicate the extent to which each trait is stable across development. B12 and B21 are cross-lagged pathways, which are partial regression coefficients that assess the influence of each trait on the other across time. Stability and cross-lagged parameter estimates are influenced by the pre-existing associations of traits at 8 years. CAST age 8, 31-item Childhood Autism Spectrum Test at age 8 years; CAST age 12, 30-item Childhood Autism Spectrum Test at age 12 years; Conners age 8, Conners' Parent Rating Scale at age 8 years; Conners age 12, Conners' Parent Rating Scale at age 12 years.

To compare the cross-lagged model with an alternative explanation of the covariance between traits across development, the fit of the model was compared with that of a longitudinal Cholesky decomposition. The longitudinal Cholesky model is an extension of the bivariate model detailed above, and contained four variables: CAST at age 8 years, Conners at age 8 years, CAST at age 12 years and Conners at age 12 years. The model provides A, C and E estimates for each of the four variables, as well as r g, r c and r e between them (Neale et al. Reference Neale, Boker, Xie and Maes2003).
Assessment of model fit
Model fit was assessed using the likelihood ratio test. A fit statistic that is two times the log-likelihood of the data (−2LL) was computed for each model, and compared with −2LL of saturated models of the means, variances and covariances in the data. The saturated model for the cross-lagged model contained five data groups, one for each of MZ male, MZ female, DZ male, DZ female and DZ opposite-sex twin pairs. Since the bivariate Cholesky decomposition did not include DZ opposite-sex twins, the saturated bivariate model did not include a calculation group for the DZ opposite-sex twins. The difference in −2LL between an identified model and a saturated model is χ2 distributed, with degrees of freedom (df) equivalent to the difference in the number of parameters estimated, enabling a statistical comparison of fit. Significant χ2 results indicate a significant deterioration of fit between models. Model fit was further assessed using Akaike's Information Criterion (AIC), calculated Δχ2 – (2Δdf). Lower AIC values indicate better-fitting models. Model fit was assessed again when certain parameters were constrained to equal zero to determine their significance. If ‘dropping’ certain parameters did not produce a significant deterioration of fit, then these parameters were removed from the model.
Results
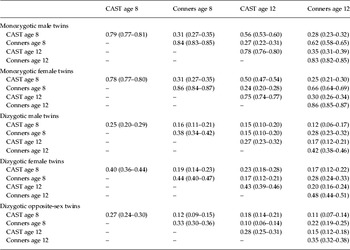
Mean scale scores are presented in Table 1. The phenotypic correlation between full-scale CAST and Conners scores was r = 0.52 (p < 0.001) at both ages. ICCs are presented in Table 2, and suggest genetic influences on each trait at both ages. MZ CTCT ICCs exceed DZ CTCT ICCs at both ages, suggesting genetic influences on their covariation.
Intraclass twin correlations, given within each scale within each age (cross-twin correlations), across the two scales within each age (cross-trait cross-twin correlations), and given both within and across each scale across time

Data are given as intraclass correlation (95% confidence interval). The correlations are all split by sex and zygosity.
CAST age 8, 31-item Childhood Autism Spectrum Test at age 8 years; Conners age 8, Conners' Parent Rating Scale at age 8 years; CAST age 12, 30-item Childhood Autism Spectrum Test at age 12 years; Conners age 12, Conners' Parent Rating Scale at age 12 years.
Cross-lagged model fitting between the ages of 8 and 12 years
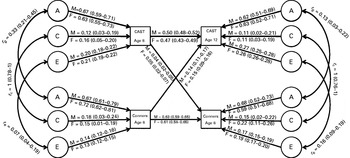
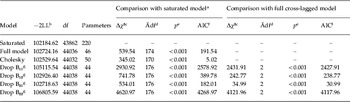
Table 3 presents fit statistics for the cross-lagged model and the longitudinal Cholesky decomposition. Equating parameters across sexes led to a significant deterioration of model fit (χ212 = 23.11, p < 0.05), and hence fit statistics are presented for a cross-lagged model that included quantitative sex differences. It was not possible to drop any longitudinal pathways from the cross-lagged model without significantly reducing the fit of the model, although the fit of the full model was a significant deterioration from the saturated model (χ2174 = 539.54, p < 0.001). This commonly occurs in larger samples, as small differences in trait variance between ages can result in a significant loss of fit. It was not possible to drop any of the longitudinal pathways from the model without reducing its fit (see Table 3). Cross-lagged model parameter estimates are presented in Fig. 2. Both CAST and Conners scores displayed significant developmental stability (B11 male = 0.50, B11 female = 0.47; B22 male = 0.63, B22 female = 0.61). There was a modest, significant, cross-lagged association between CAST at age 8 years and Conners at age 12 years (B12 male = 0.04, B12 female = 0.05). The cross-lagged pathway between Conners at age 8 years and CAST at age 12 years was significant, and stronger (B21 male = 0.14, B21 female = 0.15). These associations held when participants with confirmed or suspected ASD were excluded from the analysis (details available from M.T.).
Cross-lagged model, with parameter estimates. The model suggests a considerable degree of additive genetic influence (A) on each trait individually at both ages, and a modest degree of shared environmental (C) and non-shared environmental (E) influences. Genetic correlations are labelled r g, shared environmental correlations are labelled r c, while non-shared environmental correlations are labelled r e. The arrows leading from CAST age 8 to CAST age 12, and from Conners age 8 to Conners age 12 are stability pathways, while the arrows from each CAST age 8 to Conners age 12 and Conners age 8 to CAST age 12 are cross-lagged pathways that index the influence of each trait on the other. CAST age 8, 31-item Childhood Autism Spectrum Test at age 8 years; CAST age 12, 30-item Childhood Autism Spectrum Test at age 12 years; Conners age 8, Conners' Parent Rating Scale at age 8 years; Conners age 12, Conners' Parent Rating Scale at age 12 years; M, male parameter estimate; F, female parameter estimate.

Fit statistics for cross-lagged modelling

df, Degrees of freedom; AIC, Akaike's Information Criterion.
a The saturated model is a model of the means, variances and covariances in the data.
b −2LL is a fit statistic that is minus two times the log-likelihood of the data; this statistic is provided for all models fitted to the data.
c Δχ2 is the change in −2LL between a given model and the comparison model. The difference in –2LL values is χ2 distributed.
d Δdf is the change in df between a given model and the comparison model, which is equivalent to the difference in the number of parameters between the two models; using Δdf and Δχ2, it is possible to carry out a statistical comparison of the fit of two models.
e Probability statistic derived from the χ2 test; significant p values indicate a model that is a significantly worse fit compared with the comparison model.
f AIC is another fit statistic, which is calculated Δχ2 – (2Δdf). Lower AIC values indicate better-fitting models.
g Submodels assessing the significance of stability pathways for traits of autism (B11) and traits of ADHD (B22), and cross-lagged pathways between autistic traits at the age of 8 years and traits of ADHD at the age of 12 years (B12), and traits of ADHD at the age of 8 years and autistic traits at the age of 12 years (B21). This is achieved by constraining the selected parameter to equal zero; all submodels are compared with the saturated model and the full cross-lagged model. A significant p value indicates that dropping the selected parameter produces a significant deterioration of fit between the submodel and the comparison model.
Further cross-lagged models were fitted to CAST and Conners subscales. The strongest association between the Conners overall scale at age 8 years and the CAST communication subscale at age 12 years was particularly strong (Bmale = 0.18, Bfemale = 0.19). Further models revealed no substantial difference in associations with the CAST communication subscale between the Conners hyperactivity/impulsivity (Bmale = 0.22, Bfemale = 0.23) and inattention (Bmale = 0.23, Bfemale = 0.24) subscales. This association persisted whilst controlling for the effects of general cognitive ability (see Supplementary material).
The cross-lagged model also estimated the proportion of trait variance that was common to both ages. These statistics are presented in the Supplementary material, and suggest that most of the variance in trait scores at the age of 12 years was unique to that age. These estimates were decomposed into A, C and E influences; while some genetic variation was common to both ages, very little non-shared environmental variance was shared across development. Of the variance in male and female CAST scores at the age of 12 years, 5% was due to non-shared environmental variation at the age of 8 years, while 6% of the variance in Conners scores in males, and 5% in females, was shared with age 8 years.
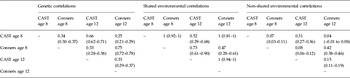
The fit of the cross-lagged model was compared with the fit of a longitudinal Cholesky decomposition to explore alternative explanations. The AIC value for the longitudinal Cholesky decomposition was lower than that of the cross-lagged model (see Table 3), indicating that this model was a better fit compared with the cross-lagged model. Parameter estimates for this model are presented in Tables 4 and 5.
Standardized parameter estimates for the longitudinal Cholesky decomposition: variance components estimates

Data are given as estimate (95% confidence interval).
CAST age 8, 31-item Childhood Autism Spectrum Test at age 8 years; Conners age 8, Conners' Parent Rating Scale at age 8 years; CAST age 12, 30-item Childhood Autism Spectrum Test at age 12 years; Conners age 12, Conners' Parent Rating Scale at age 12 years; A, additive genetic influences; C, shared environmental influences; E, non-shared environmental influences.
a Separate variance components estimates are provided for males and females.
Standardized parameter estimates for the longitudinal Cholesky decomposition: aetiological correlationsa

Data are given as estimate (95% confidence interval).
CAST age 8, 31-item Childhood Autism Spectrum Test at age 8 years; Conners age 8, Conners' Parent Rating Scale at age 8 years; CAST age 12, 30-item Childhood Autism Spectrum Test at age 12 years; Conners age 12, Conners' Parent Rating Scale at age 12 years.
a The aetiological correlations are equated across sexes due to the inclusion of dizygotic opposite-sex twins in the analysis (Neale et al. Reference Neale, Røysamb and Jacobson2006).
Bivariate model fitting at 12 years
The best-fitting bivariate Cholesky decomposition was an ACE model with quantitative sex limitation (see Supplementary material for fit statistics). Considerable genetic influences were present for the CAST [Amale = 0.69, 95% confidence interval (CI) 0.61–0.76; Afemale = 0.52, 95% CI 0.43–0.61]. Shared environmental influences (Cmale = 0.08, 95% CI 0.01–0.15; Cfemale = 0.26, 95% CI 0.17–0.34) and non-shared environmental influences were modest (Emale = 0.23, 95% CI 0.21–0.26; Efemale = 0.22, 95% CI 0.20–0.25). The Conners displayed strong genetic influences (Amale = 0.76, 95% CI 0.67–0.84; Afemale = 0.63, 95% CI 0.55–0.71), with modest shared environmental (Cmale = 0.11, 95% CI 0.02–0.19; Cfemale = 0.21, 95% CI 0.13–0.29) and non-shared environmental (Emale = 0.14, 95% CI 0.12–0.15; Efemale = 0.16, 95% CI 0.16–0.18) influences in both sexes. The CAST and Conners shared a moderate degree of genetic influences in males (r g = 0.41, 95% CI 0.34–0.47) and a modest proportion in females (r g = 0.23, 95% CI 0.15–0.33). Nearly all shared environmental influences were common to CAST and Conners across sexes (r c male = 1, 95% CI 0.86–1; r c female = 0.99, 95% CI 0.75–1), while non-shared environmental overlap was modest (r e male = 0.16, 95% CI 0.10–0.22; r e female = 0.18, 95% CI 0.12–0.23). The model was a significantly worse fit to the data than the saturated model (χ234 = 75.76, p < 0.001).
Discussion
This study employed genetically informative modelling to explore longitudinal phenotypic associations between traits of ASD and ADHD. While the cross-lagged pathway between traits of ASD at the age of 8 years and traits of ADHD at the age of 12 years was significant, it was weaker than the association between traits of ADHD at the age of 8 years and traits of ASD at the age of 12 years. Such effects occurred above and beyond the association between traits at the age of 8 years. The model demonstrated stability in traits of ASD (Robinson et al. Reference Robinson, Munir, Munafo, Hughes, McCormick and Koenen2011; Whitehouse et al. Reference Whitehouse, Hickey and Ronald2011) and ADHD (Kuntsi et al. Reference Kuntsi, Rijsdijk, Ronald, Asherson and Plomin2005; Greven et al. Reference Greven, Asherson, Rijsdijk and Plomin2011) across development. These results suggest that there is a dynamic relationship between traits of ASD and ADHD whereby they influence one another across development. Additionally, our findings are the first to demonstrate that such associations occur above and beyond the concurrent association between these traits at an earlier age.
ADHD is common in individuals with ASD, and traits of ASD appear elevated in ADHD (Clark et al. Reference Clark, Feehan, Tinline and Vostanis1999; Reiersen et al. Reference Reiersen, Constantino, Volk and Todd2007). Hence, the strength of the association between earlier traits of ADHD at the age of 8 years and traits of ASD at the age of 12 years is not entirely surprising; the question is why it is stronger than the reverse association. To gain further insight, cross-lagged modelling was applied to subscales. These models suggested that both ADHD trait subscales at the age of 8 years were most associated with communication difficulties characteristic of ASD at the age of 12 years.
One possibility is that overlap between items on the two measures may have led to this pattern of associations. For example, the CAST communication subscale asks about whether the child is able to keep a two-way conversation going, while the Conners asks whether the child often interrupts others or appears not to hear what is being said to them. However, there is considerable evidence to suggest that the CAST and Conners are valid measures of ASD and ADHD, respectively. For example, Williams et al. (Reference Williams, Scott, Stott, Allison, Baron-Cohen and Brayne2005) reported that the CAST shows high sensitivity and specificity, while Conners et al. (Reference Conners, Sitarenios, Park and Epstein1998) found that individuals with a diagnosis of ADHD scored higher than controls on the hyperactivity–impulsivity subscale of the Conners' Parent Rating Scale that the Conners scale in the present study was derived from.
The association between earlier traits of ADHD and later ASD communication traits may indicate language difficulties common to ASD and ADHD. Some of the CAST communication subscale items concern pragmatic language: language use in social communication (Leonard et al. Reference Leonard, Milich and Lorch2011) (e.g. ‘Is s/he good at turn-taking in conversation?’). Some behaviours associated with ADHD may relate to pragmatic language use; individuals with ADHD may struggle with turn-taking in conversation, while younger children may struggle to sustain attention while playing with other children. Individuals with ADHD have been found to display impairments in pragmatic language not dissimilar to those seen in ASD (Bishop & Baird, Reference Bishop and Baird2001). Thus future research may seek to further explore the association between ASD, ADHD and language ability.
Furthermore, the full cross-lagged model suggested different non-shared environmental influences on trait scores at each age. While it is not possible to tease apart genuine non-shared environmental influences from age-specific measurement error (Plomin et al. Reference Plomin, DeFries, McClearn and McGuffin2008), it is possible that many non-shared environmental influences on traits of ASD and ADHD differ with age. Many changes occur between the ages of 8 and 12 years; for example, children make the transition from elementary to high school, potentially requiring new relationships to be formed and adjustment to a new school environment. Such changes could contribute toward the associations reported here; for instance, a child displaying traits of ADHD upon entering high school may struggle to form new social relationships, and may hence interact less with others. Consideration of specific non-shared environmental influences is possible within the twin design by examining within-pair differences between genetically identical MZ twins (Turkheimer & Waldron, Reference Turkheimer and Waldron2000). Such research may shed further light on the cross-lagged associations.
It is important to consider these interpretations of the findings in the context of the relatively poor fit of the cross-lagged model. While deterioration of fit between saturated models and twin models is quite common in large samples (Barrett, Reference Barrett2007), the model was also a poorer fit compared with a longitudinal Cholesky decomposition. Previous research that has employed the cross-lagged model has not included comparison with the longitudinal Cholesky decomposition (e.g. Hallett et al. Reference Hallett, Ronald, Rijsdijk and Happé2010; Greven et al. Reference Greven, Asherson, Rijsdijk and Plomin2011). Such a model was included here as an alternative explanation for the covariance of traits of ASD and ADHD across development. The model suggested that traits of ASD and ADHD at the age of 8 years shared a considerable degree of their genetic influences with the same traits at the age of 12 years. Genetic overlap between traits across development was modest, suggesting that largely different genes may be involved in the covariation of traits of ASD and ADHD between the ages of 8 and 12 years.
We also fitted a bivariate model to data from 12-year-old twins. The model replicated the finding that traits of ASD and ADHD display considerable heritability (e.g. Ronald & Hoekstra, Reference Ronald and Hoekstra2011;Asherson & Gurling, Reference Asherson and Gurling2012). It is noteworthy that shared environmental influences on traits of ASD and ADHD individually were significant in the present study. Twin studies of traits of ASD have often reported models where it is possible to drop shared environmental parameters from the model (e.g. Ronald et al. Reference Ronald, Happé, Bolton, Butcher, Price, Wheelwright, Baron-Cohen and Plomin2006). Similarly for ADHD, many studies suggest that shared environmental influences are negligible. In a large meta-analysis, Nikolas & Burt (Reference Nikolas and Burt2010) reported that shared environmental effects were non-significant. It is hence interesting to note that shared environmental parameters were significant in the present study.
Furthermore, contrary to the findings of an existing study of the same sample at age 8 years (Ronald et al. Reference Ronald, Simonoff, Kuntsi, Asherson and Plomin2008), the bivariate model estimated genetic correlations that differed considerably across sexes. While there was a moderate degree of genetic overlap in males, this was not the case for females, for whom genetic overlap was modest. Although previous twin studies on 12-year-olds did not report such differences (Lichtenstein et al. Reference Lichtenstein, Carlström, Råstam, Gillberg and Anckarsäter2010; Lundström et al. Reference Lundström, Chang, Kerekes, Gumpert, Råstam, Gillberg, Lichtenstein and Anckarsäter2011), these studies did not use sex limitation models. These discrepancies are probably accounted for by our best-fitting model, which accounted for quantitative sex differences. Hence, these findings suggest that genetic influences on the covariation of traits overlap to a lesser extent in females than in males at the age of 12 years.
The bivariate Cholesky decomposition also estimated significant shared environmental correlations between traits, again in contrast to the earlier study of the same sample at age 8 years (Ronald et al. Reference Ronald, Simonoff, Kuntsi, Asherson and Plomin2008). It is possible that this difference is age-related and further exploration of these associations in adolescent twin samples may prove informative. Indeed, an important direction for future work will be to explore the association between traits of ASD and ADHD in adolescence, an age period which, to date, has been overlooked.
These findings have implications for molecular genetics. The findings from the bivariate and longitudinal Cholesky decomposition add to existing literature suggesting that molecular genetic studies may consider searching for pleiotropic genes underlying ASD and ADHD. Additionally, the cross-lagged model has implications for research on clinical populations. For example, such work may explore whether individuals with ASD and ADHD display similar communication profiles, and whether these contribute toward the co-occurrence of these conditions. A further possibility may be that underlying language and communication difficulties may influence the associations between certain symptoms over time, and hence future work may test this possibility.
This study was not without limitations; due to the large sample, we were unable to employ in-depth clinical assessments. Community-based samples offer the advantage that vast data can be collected, allowing considerable statistical power for twin modelling, while avoiding the referral biases present in clinical samples. It is nevertheless important that these findings are complemented by research with clinically based samples to ensure their clinical relevance.
Cross-lagged parameter estimates were also modest. However, these pathways are partial regression coefficients that account for pre-existing associations. Hence, it is likely a rule, not an exception, that cross-lagged pathways produce conservative estimates (Kenny, Reference Kenny1975), which nevertheless have important scientific implications.
This is the first genetically informative longitudinal analysis of the association between traits of ASD and ADHD. The bivariate model at age 12 years, consistent with prior studies (e.g. Ronald et al. Reference Ronald, Simonoff, Kuntsi, Asherson and Plomin2008), suggests that aetiological influences on traits of ASD and ADHD overlap to an extent. Beyond this, the cross-lagged model suggested that these traits are not static, but influence one another across development. Traits of ADHD at age 8 years were more predictive of autistic traits at the age of 12 years, particularly communication impairments, than the reverse association. Future research may further explore the association with communication, and the specific aetiological factors driving this association across development.
Supplementary material
For supplementary material accompanying this paper visit http://dx.doi.org/10.1017/S003329171200253X.
Acknowledgements
The authors thank all the families who participated in the Twins Early Development Study (TEDS). TEDS is funded by a grant from the UK Medical Research Council (no. G0500079). The first author was funded by an Interdisciplinary Doctoral Studentship from the UK Medical Research Council and the Economic and Social Research Council. Research at the Centre for Research in Autism and Education is supported by the Clothworkers' Foundation and Pears Foundation.
Declaration of Interest
King's College London has received funds for consultancy, invited speaker and/or research grants for work by P.A. from Shire, Lilly, Janssen, Medice and Vifor. F.H. has served as a consultant to Gerson Lehrman Group Healthcare and Biomedical Council and Novartis, and has received honorarium from Novartis for consultancy.