Complications related to intubation and mechanical ventilation, such as ventilator-associated pneumonia (VAP), contribute to substantial morbidity and mortality among intensive care unit (ICU) patients.Reference Davis 1 , Reference Kollef, Hamilton and Ernst 2 Guidelines (often compiled into a “ventilator bundle”) exist to minimize these complications. One such bundle from the Institute for Healthcare Improvement includes the following core interventions: elevation of the head of the patient’s bed; daily “sedation vacations” and assessment of the patient’s readiness to extubate; peptic ulcer disease prophylaxis; and venous thromboembolism prophylaxis. 3 Although some studies demonstrate reduction of VAP and other adverse ventilator-related outcomes with use of a ventilator bundle,Reference Zilberberg, Shorr and Kollef 4 – Reference Lawrence and Fulbrook 6 others have questioned the effectiveness of such bundles on reducing VAP.Reference Zilberberg, Shorr and Kollef 4 , Reference Lawrence and Fulbrook 6 – Reference Klompas 9 Criticisms include but are not limited to a lack of robust evidence supporting some components of the bundle and issues with bundle compliance assessment. Specifically, the determination of process compliance may be performed using periodic audits,Reference Berenholtz, Pham and Thompson 5 , Reference Bird, Zambuto and O’Donnell 10 , Reference Crunden, Boyce, Woodman and Bray 11 which may not reflect actual compliance over the entire day.
Vanderbilt University Hospital (VUH) is part of an academic medical center based in Nashville, Tennessee, that provides advanced care to a large catchment area encompassing Middle Tennessee, Southern Kentucky, and Northern Alabama. VUH has 6 specialty adult ICUs (burn, cardiovascular, medical, neuroscience, surgical, and trauma) that include a total of 151 beds. These ICUs are all closed units, and ventilated patients are managed by a dedicated ICU medical team. In response to institutional VAP rates that were higher than Centers for Disease Control and Prevention benchmarks, institutional leadership prioritized and resourced a quality improvement project designed to reduce VAP and ventilator-related complications by implementing a sustainable comprehensive program, which would integrate a ventilator bundle into the existing workflow and be facilitated by an electronic compliance dashboard. An initial examination of the impact of the use of the institutional ventilator bundle and compliance dashboard in VUH’s surgical ICU in the year after its implementation has been published previously.Reference Zaydfudim, Dossett and Starmer 12 The current study expands on that investigation, includes all VUH ICUs, and examines whether the impact noted in the initial analysis was sustained following implementation.
METHODS
Development of the Institutional Ventilator Bundle and Compliance Dashboard
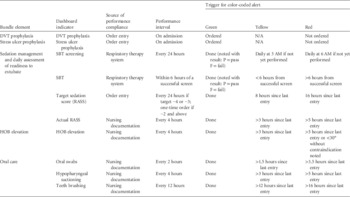
A core improvement team reviewed the available literature regarding strategies to reduce VAP and other ventilator-related complications, including an examination of various “ventilator bundles” that encompassed evidenced-based practices associated with improved patient outcomes. A multidisciplinary design studio of key stakeholders was convened in January 2007 to reach consensus on the components of an institutional ventilator bundle, to formulate implementation plans for the use of the bundle, and to develop bedside tools that would hardwire compliance to the recommended practices. The VUH institutional bundle (Table 1) included components from nationally recognized ventilator bundles (eg, elevation of the head of the patient’s bed between 30° and 45°, daily assessment of readiness for extubation, and stress ulcer and deep venous thrombosis prophylaxis) as well as additional practices associated with a reduced risk of VAP (eg, routine oral care including toothbrushing and hypopharyngeal suctioning). A formal daily “sedation vacation,” which was part of the Institute for Healthcare Improvement ventilator bundle, 3 was not incorporated in the VUH bundle; however, the group included daily sedation management targeted to a daily designated Richmond Agitation Sedation Scale scoreReference Sessler, Gosnell and Grap 13 , Reference Ely, Truman and Shintani 14 and a daily spontaneous breathing trial if the patient’s Richmond Agitation Sedation Scale score was above −2 (light sedation). The group also determined performance frequencies for each bundle component (Table 1) on the basis of the available literature or the opinions of local clinicians and content experts when there was a lack of consensus in the published evidence. Contraindications to bundle components (eg, cervical spine instability and head of bed elevation) were also determined. Order sets reflecting the VUH bundle components were created within the institutional computerized prescriber order entry system.
VUH Ventilator Bundle Practices and Recommended Frequency of Performance

NOTE. DVT, deep venous thromboembolism; HOB, head of bed; RASS, Richmond Agitation Sedation Scale; SBT, spontaneous breathing trial; VUH, Vanderbilt University Hospital.
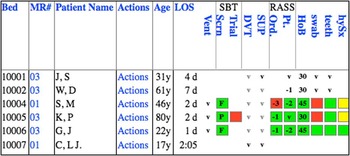
To hardwire performance of the bundle practices and to facilitate real-time course correction of noncompliant parameters at the bedside, a computerized ventilator dashboard was developed. The dashboard was designed to alert caregivers when performance of bundle interventions was due using a color-coded visual display (green=bundle component has been performed and is in compliance; yellow=bundle component is in compliance but there is an impending deadline for performance; red=bundle component has not been performed and is overdue). Parameters for each color-code alert were determined for each component of the bundle on the basis of the consensus performance frequencies (Table 1). The dashboard, which was displayed as a screen saver on every ICU patient’s bedside computer (Figure 1), integrated data from the electronic nursing record, the physician order entry system, and respiratory therapy documentation. The dashboard system received updates on practice performance in real time and adjusted the color-coded performance indicator every 5 minutes. The components of the ventilator bundle remained unchanged, although in April 2009 the institution introduced the use of continuous subglottic secretion (CSS) suction via a specialized endotracheal tube in patients expected to require intubation greater than 24 hours. This addition did not replace the requirement for hypopharyngeal suctioning.
Ventilator dashboard noting up-to-date status of the compliance to bundle components, as displayed as a screen saver on each patient’s bedside computer. LOS, length of stay; Vent=patient currently on a ventilator; SBT=spontaneous breathing trial (F=failed trial); DVT=deep venous thromboembolism prophylaxis (check indicates ordered); SUP=stress ulcer prophylaxis (check indicates ordered); RASS=Richmond Agitation Sedation Score, Ord=ordered (number in box indicates target RASS), Pt=patient’s present RASS; HoB=head of bed elevation (number in box designates degree of elevation); swab=performance of oral mucosa cleaning; teeth=performance of tooth brushing; hySx=performance of hypopharyngeal suctioning.

Assessment of Bundle and Dashboard Impact
Following its implementation in August 2007, an assessment of the ventilator bundle and compliance dashboard was performed. The study period included a baseline period from January 2005 through July 2007, an implementation period from August through December 2007, and an intervention period from January 2008 through June 2011. The study population included all 6 adult ICUs at VUH. Unit-specific monthly ventilator bundle compliance and VAP rates were assessed. Bundle compliance was noted as an overall cumulative bundle adherence assessment (denoted as a Z100 Score), reflecting the percentage of total ventilated time all bundle elements were concurrently in compliance for all ventilated patients on the unit.
VAP was defined by trained infection preventionists (IPs) who were masked to patient-specific bundle adherence data and who used Centers for Disease Control and Prevention definitions in effect during the study period. Four of the 6 IPs who conducted the VAP surveillance were present for the entire study period; the remaining 2 IPs were trained by a single IP, who validated their case ascertainment through audit. The process for VAP identification was the same throughout the entire study period. Specifically, every weekday the IPs reviewed every respiratory culture (eg, sputum, endotracheal aspirate, bronchoalveolar lavage) sent for an ICU patient, regardless of whether the culture was positive or negative for growth of organisms. Cultures collected over the weekend were reviewed on the following Monday. Patients with an identified culture specimen then underwent medical chart review with examination of chest radiographs and clinical signs and symptoms to ascertain the presence of a VAP, as defined by the Centers for Disease Control and Prevention surveillance definition in place at the time of the event.
Analysis
A before-and-after analysis comparing the VAP rates in the baseline and the intervention period was performed using incidence rate ratio comparisons with Stata, version 13 (StataCorp).Reference Linden 15 A more robust interrupted time-series regression analysis with Newey-West standard errors was also performed to examine the impact of the ventilator dashboard introduction upon VAP rates, with August to December 2007 serving as the implementation period and January 2008 to June 2011 as the intervention period. Because CSS management was added to the bundle in April 2009, we analyzed the VAP rate trends using an interrupted time-series analysis before and after introduction of this intervention to assess for potential confounding of the dashboard’s impact. A Pearson correlation analysis between the monthly overall bundle adherence score (Z100 score) and monthly VAP rates was also performed for the intervention period only. Subgroup analyses by ICU type were also conducted.
RESULTS
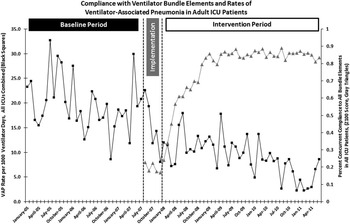
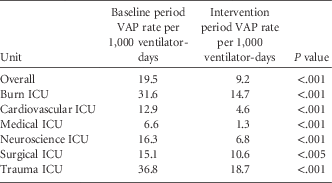
During the study period, there were a total of 87,537 ventilator-days for all 6 ICUs combined (baseline period: 37,116 ventilator-days; implementation period: 5,643 days; intervention period: 44,778 days). The VAP rates for the baseline and intervention periods are noted in Table 2. The VAP rate in all ICUs combined decreased from 19.5 VAPs per 1,000 ventilator-days to 9.2 per 1,000 ventilator-days following program implementation (P<.001). Bundle compliance significantly improved following implementation of the program, with a monthly Z100 score of 23% in August 2007 increasing to 83% in June 2011 (P<.001) (Figure 2).
Compliance with the institutional ventilator bundle elements (gray triangles) and rate of ventilator-associated pneumonia (VAP; black squares) in adult intensive care unit (ICU) patients in relation to implementation of a bundle compliance dashboard. Compliance is measured as an overall cumulative bundle adherence assessment (Z100 Score), reflecting the percentage of total ventilated time all elements were concurrently in compliance for all ventilated patients on the unit.

Ventilator-Associated Pneumonia (VAP) Rates, Baseline and Intervention Periods, Overall and by Intensive Care Unit (ICU)

Impact of Dashboard Implementation, All ICUs Combined
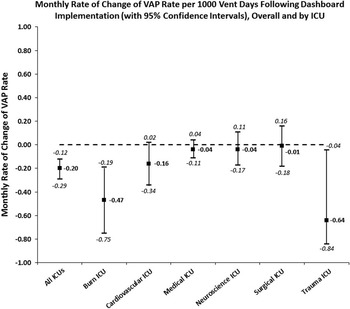
Before the dashboard implementation, there was a nonsignificant decrease in the monthly VAP rate of 0.14 per 1,000 ventilator-days for all ICUs combined. The dashboard implementation was associated with an acute significant monthly decrease in the VAP rate of 3.28 per 1,000 ventilator-days (95% CI, 2.64–3.92 per 1,000 ventilator-days). Following the intervention, the VAP rate decreased significantly at a rate of 0.20 per 1,000 ventilator-days per month (95% CI, 0.14–0.30 per 1,000 ventilator-days per month) (Figure 3). Finally, improved compliance with the ventilator bundle for all ICUs combined was significantly correlated with reductions in the monthly VAP rate (Pearson correlation coefficient=−0.32, P=.04). The examination of the impact of introduction of CSS management in April 2009 revealed a significant pre-CSS introduction in the monthly VAP rate (0.25 per 1,000 ventilator-days), which was similar to the results noted above. The introduction of CSS also did not result in a significant change in the VAP rate trend after introduction.
Monthly rate of change of ventilator-associated pneumonia (VAP) rate per 1,000 ventilator-days following dashboard implementation (with 95% confidence intervals), overall and by intensive care unit (ICU).

Impact of Dashboard Implementation, Analysis by Individual ICU
When examined for each specific ICU, a significant reduction in VAP rate before implementation was present in the medical ICU (reduction of 0.29 VAPs per 1,000 ventilator-days per month). Implementation of the dashboard also resulted in a significant monthly decrease in the VAP rate in 2 ICUs, the burn ICU (reduction of 0.47 VAPs per 1,000 ventilator-days [95% CI, 0.19–0.75 VAPs per 1,000 ventilator-days]) and the trauma ICU (reduction of 0.64 VAPs per 1,000 ventilator-days [95% CI, 0.44–0.84 VAPs per 1,000 ventilator-days]). The correlation between improved compliance with the ventilator bundle and reductions in the monthly VAP rate varied by ICU, with a significant correlation between these measures noted for the trauma ICU (Pearson correlation coefficient=−0.36, P=.02).
DISCUSSION
A VAP prevention program using a real-time bundle adherence dashboard displayed at the bedside was associated with a significant increase in bundle compliance and a significant decrease in the ICU-wide VAP rate among adult ICU patients. Importantly, these changes were sustained for more than 3 years following the dashboard implementation. The reasons for these sustained reductions in VAP rates are likely multifold. Standardization of the practices for the care of the ventilated patient helped reduce variability and improved the ability to train new providers on the expected standard of care (as opposed to learning provider-specific protocols and preferences). Improved compliance in the evidenced-based practices that compose the bundle may also have facilitated outcome improvements; however, the degree to which these practices impact VAP is unclear.
An increasing number of studies have noted significant reductions in VAP with implementation of a ventilator bundle.Reference Berenholtz, Pham and Thompson 5 , Reference Bird, Zambuto and O’Donnell 10 , Reference Crunden, Boyce, Woodman and Bray 11 , Reference Al-Tawfiq and Abed 16 – Reference Bouadma, Deslandes and Lolom 18 Study comparisons are challenging in part because bundle components vary and data on bundle practice compliance are often not reported. These studies have met some criticism related to various factors, including the subjectivity of the VAP outcome, the lack of evidence for some bundle components to reduce VAP specifically, and the lack of impact on other ventilator-related outcomes such as length of ICU stay, hospital stay, or mortality.Reference Klompas 9
The current study is unique among the published studies on the impact of the ventilator bundle on VAP because of the dashboard’s ability to capture and report bundle practice compliance throughout the entire duration of mechanical ventilation. Some studies have used point prevalence assessments of the bundle components (eg, audit during morning rounds) to determine compliance,Reference Berenholtz, Pham and Thompson 5 , Reference Bird, Zambuto and O’Donnell 10 , Reference Crunden, Boyce, Woodman and Bray 11 but that may lead to incorrect assessments of actual practice throughout the day. For example, a patient with the head of his bed elevated at 45° during the spot audit performed during morning rounds will be counted compliant for the day even if, 15 minutes after the audit, the head of bed is reclined for a procedure and then not returned to 45° for the rest of the day. Measuring compliance over an entire day rather than using spot performance audits provides a more accurate assessment of practice and may explain the lack of association of improved bundle adherence with VAP reduction reported in other studies.
Our sustained improvement in VAP rates following the dashboard implementation may also be attributable to the presence of a visible dashboard in each patient’s room. This noticeable reminder may have assisted in directing the frontline caregiver’s overall attention to the care of the ventilated patient. In addition, feedback from providers noted the dashboard’s utility in triggering conversations about ventilator management and necessity among the various members of the multidiscipline ICU teams (eg, respiratory therapy, nursing, and the ICU physicians). This rationale is supported by both the acute decrease in the VAP rate noted during the short 5-month implementation period when the Z100 compliance score was still quite low (~20%) and by the moderate correlation between bundle compliance and VAP rate reductions.
The impact of the program and the dashboard did vary when examined at the individual ICU level. Specifically, 2 units noted a significant decrease in VAP following implementation whereas only 1 ICU demonstrated a significant correlation between the dashboard implementation and bundle compliance. These findings may be related to statistical power because these 2 units had the highest preintervention VAP rates and demonstrated the greatest percentage decrease in the VAP rate among all the ICUs. Another unit, the medical ICU, noted a significant decrease in the monthly VAP rate before dashboard implementation. This unit had developed its own internal unit standards for ventilated patients before formal dashboard implementation. A potential benefit from the dashboard in this unit is suggested by the fact that the medical ICU had 9 VAP-free months in the 2.5 years prior to implementation, and 31 VAP-free months in the 3.5 years following.
This study does have some potential limitations. First, compliance was based on provider documentation, so any errors in documentation could affect the results. This impact is likely quite low because audits of compliance were also part of the initial implementation. A second limitation involves study generalizability. As has been well-described,Reference Klompas 19 , Reference Klompas 20 the now-retired VAP metric in adults had substantial issues surrounding subjectivity and reproducibility. With the development of a new measure focused upon complications in ventilated patients (ie, ventilator-associated events introduced in 2013),Reference Magill, Klompas and Balk 21 the impact of the VAP bundle on this outcome is not yet known. Third, patient-related factors that alter the risk of VAP development (eg, age, severity of underlying illness) may have led to the changes noted rather than the intervention; however, there was a significant decrease in the VAP rate in the months immediately after implementation of this program. We do not suspect nor has there been reported a large-scale shift in the patient population of the units studied during that short period. Finally, several measures commonly used in VAP prevention bundles, such as oral chlorhexidine, were not included in the initial bundle.
Creating standardized practice expectations surrounding the delivery of clinical care that are coupled with regular feedback on compliance to these standards can help reduce the rate of important complications in hospitalized patients. The use of a real-time, visible compliance dashboard in the ICU in conjunction with standardized guidelines for the care of ventilated patients led to reductions in VAP rates that remained sustained for several years after implementation.
ACKNOWLEDGMENTS
We acknowledge the frontline ICU nurses, respiratory therapists, and physicians, for their commitment to safe patient care and the successful implementation of the dashboard program; and Sharon Mullins, RN, for her dedication and work on this program.
Financial support. Vanderbilt University Medical Center.
Potential conflicts of interest. D.C. reports that he has received funds to serve on a speaker’s bureau for Sage. All other authors report no conflicts of interest relevant to this article.