Adolescent alcohol use remains a leading public health concern. Early alcohol use predicts escalation of use, regular substance use in adulthood, and a number of other negative consequences including higher rates of crime, increased rates of medical problems, and substance use disorders for some youth (Hingson, Edwards, Heeren, & Rosenbloom, Reference Hingson, Edwards, Heeren and Rosenbloom2009; Hingson, Heeren, Levenson, Jomanka, & Voas, Reference Hingson, Heeren, Levenson, Jamanka and Voas2002). Identifying risk factors associated with alcohol use in early adolescence, an age when initiation is typical (Johnston, O'Malley, Bachman, & Schulenberg, Reference Johnston, O'Malley, Bachman and Schulenberg2008), may help inform the development and refinement of intervention programs. To this end, researchers highlight developmental–ecological models (Bronfenbrenner, Reference Bronfenbrenner1979) to identify risk factors across contexts and mediational pathways leading to adolescent alcohol use (e.g., Dodge et al., Reference Dodge, Malone, Lansford, Miller, Pettit and Bates2009). These models posit that neighborhood and family factors, along with delinquent peer affiliations and adolescent delinquency, have a cascading effect on the onset of alcohol use (Dodge et al., Reference Dodge, Malone, Lansford, Miller, Pettit and Bates2009). Thus, it is critical that empirical evaluations of pathways to adolescent alcohol use consider multiple levels of influence over time. Moreover, some influences may have bidirectional effects (Rankin & Quane, Reference Rankin and Quane2002). The goal of this study was to examine parenting and peer delinquency as mechanisms that might account for the association between neighborhood risk factors and early adolescent alcohol use, and potential bidirectional influences among parenting, peer delinquency, adolescent delinquency, and alcohol use.
Neighborhoods, Parents, and Peers
Most developmental research distinguishes two broad features of neighborhoods. Neighborhood structure encompasses compositional characteristics of the community (e.g., racial composition and median income) whereas neighborhood social processes refer to a community's social organization (e.g., social cohesion; Chung & Steinberg, Reference Chung and Steinberg2006; Gardner, Barajas, & Brooks-Gunn, Reference Gardner, Barajas, Brooks-Gunn and Scheier2010; Mrug & Windle, Reference Mrug and Windle2009; Sampson, Morenoff, & Gannon-Rowley, Reference Sampson, Morenoff and Gannon-Rowley2002). Both have been shown to impact the development of externalizing problems in adolescents (Mrug & Windle, Reference Mrug and Windle2009). Leventhal and Brooks-Gunn (Reference Leventhal and Brooks-Gunn2000) posited that social processes might have a more proximal impact on adolescent behaviors, acting as a mechanism through which disadvantaged neighborhoods operate. Residents within disadvantaged neighborhoods are less likely to intervene to help reduce substance use within the community if they mistrust or fear other residents (Sampson et al., Reference Sampson, Morenoff and Gannon-Rowley2002). However, neighborhood effects on adolescents are often small, and there has been increasing interest in examining mechanisms through which neighborhoods impact adolescent behaviors (e.g., Murry, Berkel, Gaylord-Harden, Copeland-Linder, & Nation, Reference Murry, Berkel, Gaylord-Harden, Copeland-Linder and Nation2011). Two frameworks have been proposed for understanding indirect effects of neighborhoods on problem behaviors: the relationships and ties and the norms and collective efficacy models, and both have garnered empirical support (Leventhal & Brooks-Gunn, Reference Leventhal, Brooks-Gunn, Lerner and Steinberg2004).
The relationships and ties model, based on family stress theories (McLoyd, Reference McLoyd1990), posits that the link between neighborhood risk and adolescent delinquency is partly mediated by parenting. Parental control and warmth are considered to be broad parenting dimensions that are important for effective socialization of youth (e.g., Barnes, Hoffman, Welte, Farrell, & Dintcheff, Reference Barnes, Hoffman, Welte, Farrell and Dintcheff2006). Parental control reflects behaviors toward the adolescent to shape behavior deemed acceptable to the parents, including discipline and setting rules regarding adolescent behavior (e.g., Barnes et al., Reference Barnes, Hoffman, Welte, Farrell and Dintcheff2006). In contrast, parental warmth reflects behaviors toward the child that promote messages that they are loved such as praising and spending time together (Barnes et al., Reference Barnes, Hoffman, Welte, Farrell and Dintcheff2006). Both parental control and warmth are viewed as positive parenting behaviors (Smetana, Crean, & Daddis, Reference Smetana, Crean and Daddis2002). The stress of living in a disadvantaged neighborhood has been found to disrupt family functioning and compromise parenting, and low levels of positive parenting mediate neighborhood effects on adolescent delinquency, including alcohol use (e.g., Barnes, Reifman, Farrell, & Dintcheff, Reference Barnes, Reifman, Farrell and Dintcheff2000; Rankin & Quane, Reference Rankin and Quane2002). Taken together, neighborhood social processes and the relationship and ties models suggest that neighborhood disadvantage is likely to lead to decrements in positive parenting via low neighborhood cohesion. In turn, decrements in parenting practices are likely to predict adolescent delinquency and alcohol use.
The norms and collective efficacy model (Leventhal & Brooks-Gunn, Reference Leventhal, Brooks-Gunn, Lerner and Steinberg2004) posits that neighborhoods impact adolescent outcomes depending on the effectiveness of community institutions, residents, and parents to monitor and control behavior. A lack of structured community organizations (e.g., social clubs or volunteer opportunities) may weaken bonds to prosocial others and activities, thus increasing opportunities to interact with deviant others (Catalano, Kosterman, Hawkins, Newcomb, & Abbott, Reference Catalano, Kosterman, Hawkins, Newcomb and Abbott1996). In addition, poor monitoring on behalf of parents and residents promotes delinquent behavior by increasing unsupervised time in the community. Hence, poor parenting is thought to exert its primary influence through allowing delinquent behaviors and involvement with delinquent peers (Dishion, Capaldi, Spracklen, & Li, Reference Dishion, Capaldi, Spracklen and Li1995). Negative peer influences are thought to operate largely because of a lack of neighborhood and parenting resources to regulate peer group behavior (Dishion et al., Reference Dishion, Capaldi, Spracklen and Li1995). Affiliation with deviant peers is conceptualized as a proximal influence that promotes alcohol use (Chuang, Ennett, Bauman, & Foshee, Reference Chuang, Ennett, Bauman and Foshee2005). Delinquent peers likely provide support and opportunities to engage in alcohol use, increase the perception that drinking is normative, socially reinforce use, and shape attitudes toward alcohol use (e.g., Prinstein & Wang, Reference Prinstein and Wang2005).
In sum, the relationship and ties model and the norms and collective efficacy model both suggest that neighborhood social processes may be more proximal predictors of parenting and peer delinquency compared to neighborhood disadvantage. In turn, parents and peers may have more proximal effects on adolescent alcohol use compared to neighborhoods. Moreover, affiliation with delinquent peers likely mediates the relationship between parenting and adolescent problem behaviors. Although recent studies have examined the role of both parents and peers as mediators of neighborhood effects (Chung & Steinberg, Reference Chung and Steinberg2006; Mrug & Windle, Reference Mrug and Windle2009), few have empirically tested the mediating role of both microsystems in the same prospective model. This is particularly surprising given that these two perspectives are meant to be complementary (Chung & Steinberg, Reference Chung and Steinberg2006) and acknowledge that both peers and parents play a role in the initiation and maintenance of problem behaviors during adolescence.
Reciprocal Influences
Adolescent behavior is thought to be reciprocally associated with parenting and peer behavior. We use the terms reciprocal and bidirectional interchangeably to refer to a process whereby adolescent-driven behaviors and behaviors from others in the adolescent's environment (e.g., parents and peers) both influence and are influenced by each other. Though it is important to assess bidirectional influences when examining developmental contextual factors, empirical work that does so remains scarce (Reitz, Dekovic, & Meijer, Reference Reitz, Dekovic and Meijer2006). One of the most prominent theories involving parent–child transactions leading to problem behavior is Patterson's (Reference Patterson1986) coercion theory, which posits a negative reinforcement mechanism to account for the reciprocal association between problem behavior and inept parenting. Such a process is thought to escalate problem behavior and lead to parents becoming disenfranchised from parenting. The few longitudinal studies that have examined bidirectional effects of parenting practices on adolescent behavior problems have produced contradictory findings. Some studies support reciprocal associations between externalizing problems and parenting (e.g., Hipwell et al., Reference Hipwell, Keenan, Kasza, Loeber, Stouthamer-Loeber and Bean2008). In contrast, other studies have found support for the role of adolescent behavior predicting parenting behaviors, but not the reverse (Fite, Colder, Lochman, & Wells, Reference Fite, Colder, Lochman and Wells2006; Kerr & Stattin, Reference Kerr, Stattin, Crouter and Booth2003), or have reported no cross-lagged effects between a child's antisocial behavior and parenting (Vuchinich, Bank, & Patterson, Reference Vuchinich, Bank and Patterson1992). Furthermore, studies examining reciprocal effects of adolescent behaviors and parenting demonstrate stronger bidirectional effects for substance use with parenting than for delinquency (Stice & Barrera, Reference Stice and Barrera1995). It is suggested that adolescents who are more entrenched in problem behaviors and those engaging in less normative deviant behaviors, such as early-onset alcohol use, may be particularly likely to have a negative impact on the parent–child relationship (Jang & Smith, Reference Jang and Smith1997).
To our knowledge, prior research has not considered the role neighborhood characteristics and potential reciprocal effects of social context have on delinquency and alcohol use separately. This omission is surprising given that associations have been found between neighborhood characteristics and parenting, delinquent peer involvement, and externalizing behaviors (e.g., Brody et al., Reference Brody, Ge, Conger, Gibbons, McBride Murry and Gerrard2001; Mrug & Windle, Reference Mrug and Windle2009; Rankin & Quane, Reference Rankin and Quane2002). Guided by conceptual frameworks for understanding indirect effects of neighborhoods on problem behaviors, this study examines whether disadvantaged neighborhoods lead to inept parenting and selection of delinquent peers through neighborhood social processes consistent with the relationship and ties model, or whether delinquent peers are more available in disadvantaged neighborhoods, leading to socialization effects from peers consistent with the norms and collective efficacy model. We extend the literature by examining reciprocal effects between parenting and adolescent behavior (both delinquency and alcohol use). Reciprocal models have also been applied to associations between adolescent and peer behavior in the form of selection (adolescents choose to affiliate with peers based on similarity) and socialization (peers socialize behavior via reinforcement and modeling) processes. The current study assesses whether adolescents select delinquent peers based on similar predilections to engage in delinquency and alcohol use, or whether friendships with delinquent peers lead to problem behaviors. Evidence supports both selection and socialization with respect to externalizing behavior and substance use (Mercken, Candel, Willems, & de Vries, Reference Mercken, Candel, Willems and de Vries2009). Thus, it is important to consider bidirectional associations as implied by selection and socialization effects involving delinquent peer relationships.
Current Study
The present study investigates the potential influence of contextual factors longitudinally within a developmental–ecological model of risk for alcohol use starting in early adolescence (ages 11–13). Integrating distal and proximal risk factors across contexts is useful for organizing this vast literature and shows promise for understanding pathways to adolescent alcohol use, yet empirically testing these models has proven daunting. Failure to do so may yield oversimplified findings that misrepresent causal pathways. Research moving beyond testing circumscribed models (e.g., peer influence or family risk models) is critical.
Although studies have examined developmental models that integrate dynamic relations across multiple social systems for understanding adolescent alcohol use (e.g., Chuang et al., Reference Chuang, Ennett, Bauman and Foshee2005; Dodge et al., Reference Dodge, Malone, Lansford, Miller, Pettit and Bates2009), few have considered the role of neighborhoods in longitudinal bidirectional models. The first aim of the current study was to fill a gap in the literature by testing a model that includes neighborhood-, parent-, peer-, and individual-level factors in the development of early adolescent alcohol use. In this model, we prospectively test mechanisms through which neighborhood disadvantage may impact alcohol use indirectly via neighborhood cohesion, parenting, and affiliation with delinquent peers as mediators using a multi-informant design. Neighborhood disadvantage was hypothesized to be negatively associated with neighborhood cohesion, which in turn was expected to be positively associated with positive parenting. Positive parenting was hypothesized to be negatively associated with peer delinquency and subsequent alcohol use.
The second aim was to consider bidirectional associations between parenting, adolescent behavior problems, and peer delinquency on alcohol use that are often discussed but rarely tested (e.g., adolescent behavior predicting parenting; Reitz et al., Reference Reitz, Dekovic and Meijer2006). Accounting for reciprocal associations is likely to provide a more comprehensive understanding of the indirect pathways from neighborhood disadvantage to subsequent adolescent alcohol use. Given support for reciprocal effects, bidirectional associations between parenting and adolescent behavior problems were tested. It was hypothesized that there would be more evidence of reciprocal effects between parenting and adolescent alcohol use compared to general delinquent behaviors. This is consistent with studies demonstrating full reciprocal associations between substance use and parenting but limited evidence for reciprocal effects for delinquency (Stice & Barrera, Reference Stice and Barrera1995). To our knowledge, this will be the first study to examine comprehensive mediation pathways from neighborhood disadvantage on adolescent substance use behaviors by considering general delinquency and alcohol use separately as they relate to parenting in a bidirectional relationship.
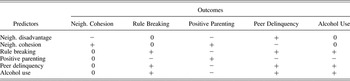
Given support for models of peer selection and socialization, these were also tested. It was hypothesized that there would be support for both peer selection and socialization processes. This will be indicated by adolescent rule breaking and alcohol use predicting subsequent peer delinquency (selection) as well as peer delinquency predicting subsequent adolescent rule breaking and alcohol use (socialization). In sum, the current study conceptualizes the development of alcohol use as a result of bidirectional influences among parents, peers, and the adolescent. Additional predicted associations from our proposed path model are presented in Table 1.
Hypothesized direction of direct effects in proposed path model

Note: Neigh., neighborhood; +, hypothesized positive associations; −, hypothesized negative associations; 0, no association expected.
Method
Participants
Participants were taken from a three-wave longitudinal study examining behavior problems on substance use initiation. Participants were recruited utilizing a random-digit-dial sample of listed and unlisted telephone numbers generated for Erie County, New York. Erie County is a large geographical area that encompasses mostly urban and suburban areas, but also some rural areas. US Census Bureau (2012) reports suggest that Erie County has a high concentration of White persons (80.0%), average rates of persons living below the poverty level (14.0%), and high rates of residential stability (i.e., percentile living in the same house for 1 year or longer = 86.8%).
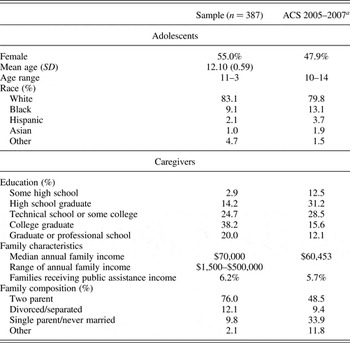
Adolescents were eligible at recruitment if they were between the ages of 11 and 12, and did not have any language or physical disabilities that would preclude them from understanding or completing the assessment. The sample included 387 families (a caregiver and child from each). The participation rate was 52.4%, which is well within the range of population-based studies requiring extended and extensive levels of subject involvement (Galea & Tracy, Reference Galea and Tracy2007). Sample demographic information is presented in Table 2. Given the eligibility criteria, it would be inappropriate to compare this sample to overall demographic characteristics of Erie County, New York. Accordingly, demographic information for a subpopulation of Erie County, New York, corresponding to the population from whence the sample came (i.e., families with children ages 10–14) is also presented. Demographic characteristics are largely comparable to that of Erie County, New York, with the exception that the sample was more highly educated and included more married couples.
Sample and community characteristics in Time 1

a US Census Bureau: American Community Survey 2005–2007; generated by Alan Delmerico using American FactFinder (http://factfinder.census.gov), June 4, 2009.
Total attrition for the study was 7% (29/387). One difference emerged between families who did and did not complete the Time 2 (T2) assessment (14/387), such that families who did not complete the T2 assessment endorsed lower levels of positive parenting practices at Time 1 (T1), F (1) = 5.84, p < .05, Cohen d = 0.55. There were no significant differences across all other study variables and demographic characteristics (gender, age, family income, marital status, neighborhood characteristics, peer delinquency, and adolescent rule breaking and alcohol use). Comparison of families who did not complete the Time 3 (T3) assessment (24/387) with those who did suggested no differences across all study variables and demographic characteristics. The low level of attrition and few differences between those who were retained and those who dropped out suggest that missing data likely had a minimal impact on study findings. The mean age for adolescents at T2 and T3 was 13 years (range = 12–14) and 14 years (range = 13–16), respectively.
Procedure
The larger study was described to parents and adolescents as an investigation of the transition into adolescence. Interviews were conducted at a university research laboratory. Before the interview, the caregiver was asked to give consent and the adolescent was asked to provide assent. The child and caregiver were then taken to separate rooms to enhance privacy. All questionnaires were read aloud, and responses were entered directly into a computer to minimize random responding and missing data. To increase confidentiality during adolescent interviews, questions deemed “sensitive” (i.e., alcohol use and peer delinquency) were read aloud by the interviewer, but answers were inputted into the computer by the adolescent. Each interview took approximately 2.5 hr to complete. Interview procedures were the same at each wave. The T2 and T3 assessments typically occurred on the year anniversary of the previous assessment. Families were compensated $75, $85, and $125 for their participation at each respective wave.
Measures
Neighborhood disadvantage
Neighborhood disadvantage was assessed at baseline using census tract information. Census tracts are useful because they incorporate descriptive information regarding defining neighborhood features and offer a good approximation of social and economic data available from the US Census Bureau (Estabrooks, Lee, & Gyurcsik, Reference Estabrooks, Lee and Gyurcsik2003). A composite index using a principal components analysis was derived based on: proportion of families living below poverty, proportion receiving public assistance, median family income, female-headed households living below poverty with children ages 0–17, and children living below the poverty level ages 0–17. Variables were first converted to z scores and then summed. High scores indicated greater neighborhood disadvantage (α = 0.96).
Neighborhood cohesion
Neighborhood cohesion was assessed using items adapted from the Los Angeles Family and Neighborhood Survey (Lara-Cinisomo & Pebley, Reference Lara-Cinisomo and Pebley2003). Parental perceptions regarding neighborhood cohesion were measured during the first two waves with 10 items (e.g., “This is a close-knit neighborhood that is cohesive and unified”). High values on this measure indicate greater neighborhood cohesion. The internal consistency (T1 α = 0.91, T2 α = 0.92) was good for this measure.
Positive parenting
Research suggests that parenting practices as reported by the child have a stronger impact on future psychosocial development and may be less biased than parent report (Kuppens, Grietens, Onghena, & Michiels, Reference Kuppens, Grietens, Onghena and Michiels2009). As such, parenting as reported by adolescents was assessed using the Parenting Style Inventory (Darling & Toyokawa, Reference Darling and Toyokawa1997). Demandingness (e.g., “My parent expects me to follow family rules”) and responsiveness (e.g., “My parent spends time just talking to me”) were assessed using five items for each scale on a Likert scale (1 = strongly disagree, 5 = strongly agree) during the first two waves. Given the moderate correlation between subscales (r =. 36, p < .001), scales were combined to form a composite index of positive parenting to minimize model complexityFootnote 1 and consistent with other studies examining parenting on adolescent behavior (e.g., Mrug & Windle, Reference Mrug and Windle2009). High scores indicate more positive parenting (T1 α = 0.69, T2 α = 0.72).
Rule breaking
Self-reported delinquency at T1 and T2 was assessed using the rule breaking subscale of the Youth Self Report (Achenbach & Rescorla, Reference Achenbach and Rescorla2001). Items assess behavior in the past 6 months such as breaking rules, lying, stealing, and truancy using a Likert scale (0 = not true, 2 = very true). For this study, substance use items were omitted. Items were summed to create a scale score for each wave (α = 0.71 and 0.75, respectively).
Peer delinquency
Adolescents reported on perceived delinquency within their peer group (i.e., their three closest friends) during the first two waves of the study using 14 items from Fergusson, Woodward, and Horwood (Reference Fergusson, Woodward and Horwood1999). The dichotomously scored (no/yes) items (e.g., theft, school truancy, and substance use) were summed to create a scale score. Internal consistency (α = 0.78 and 0.81, respectively) was adequate at both time points.
Alcohol use
Lifetime alcohol use was assessed using a dichotomous (no/yes) item from the National Youth Survey (Elliott & Huizinga, Reference Elliott and Huizinga1983) during T1. During the first wave of the study, 16 (4.2%) adolescents reported having used alcohol without parental permission in their lifetime. Quantity and frequency of alcohol use in the past year at T2 and T3 were assessed with fill in the blank questions. At T2, 83 (22%) adolescents reported having used alcohol in the past year, and 120 (33%) reported having used in the past year during T3. A quantity by frequency index of drinking was created to represent total drinks in the past year at T2 and T3. Distributions of quantity by frequency scores were skewed (11.9 to 19.2). Accordingly, a 4-point ordinal variable was created (0 = no use, 1 = greater than 0 but ≤1 standard drink, 2 = greater than 1 standard drink but ≤4 standard drinks, 3 = greater than four standard drinks per occasion). These rates of use are comparable to prevalence rates for this developmental period (e.g., Simons-Morton, Reference Simons-Morton2004).
Family socioeconomic status (SES) and marital status
Research supports a strong association between family SES and marital status with neighborhood disadvantage and parenting (Rankin & Quane, Reference Rankin and Quane2002). Thus, it is important to include family SES and marital status as statistical controls. We computed a composite family SES (family income, parent education, and public assistance income) and marital status (dichotomously coded not married vs. married) variable. Both were included as statistical control variables along with other demographic characteristics (i.e., adolescent age, race, and sex) in our analysis.
Data analytic plan
A cross-lagged mediation path modelFootnote 2 was tested using Mplus 6.1 (Muthén & Muthén, Reference Muthén and Muthén1998–2010). Given that the outcome was ordinal, the robust weighted least squares estimation procedure was used to accommodate the alcohol use outcome variable (Brown, Reference Brown2006). The full information maximum likelihood estimation was used to handle missing values. This approach has been demonstrated to provide unbiased estimates when data are missing at random and performs better than other common approaches for handling missing data (Enders & Bandalos, Reference Enders and Bandalos2001). An advantage of using a prospective design was that it established temporal precedence between the mediator and the outcome, a key criteria for establishing mediation (Kraemer, Kiernan, Essex, & Kupfer, Reference Kraemer, Kiernan, Essex and Kupfer2008). Asymmetric confidence intervals computed in RMediation were used to test proposed mediated effects (Tofighi & MacKinnon, Reference Tofighi and MacKinnon2011).
The model was analyzed with neighborhood disadvantage at T1 predicting positive parenting, peer delinquency, adolescent rule breaking, low neighborhood cohesion, and alcohol use at T1 and T2. Paths between positive parenting, peer delinquency, adolescent rule breaking, low neighborhood cohesion, and alcohol use at T1 and T2 were examined to test stability and bidirectional effects. The T2 effects of positive parenting, peer delinquency, adolescent rule breaking, low neighborhood cohesion, and alcohol use on T3 alcohol use were also examined. Covariances between endogenous variables assessed at the same time point were estimated. Adolescent age, race, sex, family SES, and marital status were also included as exogenous covariates; covariances between exogenous variables were estimated. Multiple group path models were also run to examine potential differences across boys and girls.
Results
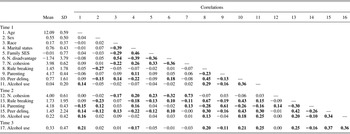
Table 3 provides the descriptive statistics for all study variables. Of particular interest, marital status and family SES, though distinct, had largely similar associations with study variables. For example, high SES families and two-parent (married) families resided in less disadvantaged neighborhoods with higher levels of cohesion at both time points. Higher SES and being from a two-parent family was also associated with lower levels of adolescent rule breaking and peer delinquency at T2. Adolescents from two-parent families also reported higher levels of positive parenting. Neighborhood disadvantage was positively correlated to being a minority, adolescent rule breaking at T2, and peer delinquency. Neighborhood disadvantage was also negatively correlated to neighborhood cohesion across time points. Neighborhood cohesion at T1 was negatively correlated to rule breaking and positively correlated to positive parenting at T2. Neighborhood cohesion at T2 was positively correlated with positive parenting at T2. Adolescent rule breaking was positively correlated with peer delinquency and alcohol use, and negatively correlated to positive parenting across time points. Peer delinquency was positively correlated with alcohol use and negatively correlated to positive parenting across time points. Positive parenting was negatively correlated with alcohol use at T1 and T3.
Means, standard deviations, and correlations for study variables

Note: SES, socioeconomic status; N., neighborhood; Delinq., delinquency; sex 0 = boys, 1 = girls; race 0 = White, 1 = minority; marital status 0 = not married, 1 = married. Bold values represent significant (p < .05) associations.
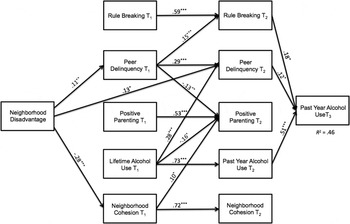
The proposed path model provided a good fit to the data, χ2 (36) = 60.95 (p < .01, root mean square error of approximation = 0.04, comparative fit index = 0.99, Tucker–Lewis index = 0.95) and accounted for 45.9% of the variance in alcohol use at T3 (see Figure 1 for standardized path coefficients). Accordingly, no post hoc model fitting was done. No significant sex differences were found in the full model using multiple group analysis, and therefore, the overall sample was used in the final model. Although not depicted in the figure, there were some effects of demographic control variables. Girls reported less rule breaking (–0.28, p < .001) and peer delinquency (–0.17, p < .001) at T1 compared to boys. Minority adolescents reported more positive parenting (0.15, p < .05) at T1 compared to White adolescents. Adolescents from two-parent families reported lower levels of peer delinquency (–0.18, p < .001), alcohol use (–0.20, p < .05), and more positive parenting (0.17, p < .01) at T1 compared to adolescents from other family structures (e.g., single or widowed parents). Family SES was positively associated with neighborhood cohesion at T1 (0.19, p < .001). Age was positively associated with rule breaking (0.09, p < .01), peer delinquency (0.12, p < .01), and alcohol use (0.39, p < .001) at T1. As expected, all stability effects of repeated measures were statistically significant (see Figure 1).
Estimated standardized path coefficients. T1, Time 1; T2, Time 2; T3, Time 3. Model fit: χ2 (36) = 60.95 (p < .01, root mean square error of approximation = 0.04, comparative fit index = 0.99, Tucker–Lewis index = 0.95). Only significant paths are presented: *p < .05, **p < .01, ***p < .001. Paths from covariates (i.e., age, sex, race, marital status, and family socioeconomic status) and covariances (i.e., between exogenous variables and between within-time endogenous variables) were estimated, but they are not depicted to simplify the presentation of the results.

Neighborhood disadvantage was associated with high levels of T1 peer delinquency and T2 adolescent rule breaking and peer delinquency. Neighborhood cohesion at T1 was a significant predictor of positive parenting at T2. High levels of peer delinquency at T1 were associated with high levels of adolescent rule breaking and with low levels of positive parenting at T2. Counter to hypotheses, positive parenting did not predict peer delinquency, adolescent rule breaking, or alcohol use. Lifetime alcohol use at T1 was a significant predictor of high levels of peer delinquency and low levels of positive parenting at T2. As predicted, adolescent rule breaking and peer delinquency at T2 prospectively predicted greater alcohol use at T3.
Based on the significant path coefficients in our model, we tested five proposed mediational pathways. As recommended by MacKinnon (Reference MacKinnon2008; Tofighi & MacKinnon, Reference Tofighi and MacKinnon2011), indirect effects were tested using Rmediation and unstandardized path coefficients. First, the indirect effect from neighborhood disadvantage to adolescent rule breaking at T2 through peer delinquency at T1 was statistically significant (estimate = 0.02, p < .05, 95% confidence interval = 0.003–0.03). In terms of the percent variance, 15.5% of the total effect of neighborhood disadvantage on adolescent rule-breaking behavior at T2 operated through peer delinquency at T1. Second, the indirect effect in the subsequent pathway from peer delinquency at T1 to alcohol use at T3 through adolescent rule breaking at T2 was also statistically significant (estimate = 0.03, p < .05, 95% confidence interval = 0.004–0.05). Third, the indirect effect from neighborhood disadvantage to positive parenting at T2 through peer delinquency at T1 was statistically significant (estimate = –0.01, p < .05, 95% confidence interval = –0.03 to –0.002). Fourth, the indirect effect from neighborhood disadvantage to positive parenting at T2 operating through neighborhood cohesion was statistically significant (estimate = –0.03, p < .05, 95% confidence interval = –0.06 to –0.006). Given that the indirect and direct effects have opposite signs in these two paths to positive parenting, absolute values of the quantities were taken before computing the proportion mediated by T1 peer delinquency and neighborhood cohesion, respectively; a procedure recommended by Alwin and Hauser (1975 as cited in MacKinnon, Reference MacKinnon2008). Accordingly, 37.8% of the total effect of neighborhood disadvantage to positive parenting at T2 operated through peer delinquency at T1, and 56.6% of the total effect operated through neighborhood cohesion at T1. Fifth, although there was evidence for one additional key path in the proposed mediational pathway between neighborhood disadvantage and alcohol use at T3 via peer delinquency at T2, this indirect effect was not significant (estimate = 0.02, ns, 95% confidence interval = –0.001 to 0.04).
Discussion
Theoretical accounts of adolescent alcohol use highlight the importance of developmental–ecological and bidirectional models to identify risk factors across contexts and potential mechanisms through which they operate (e.g., Chuang et al., Reference Chuang, Ennett, Bauman and Foshee2005; Reitz et al., Reference Reitz, Dekovic and Meijer2006). Yet conceptual models integrating sociocultural risk and protective factors across contexts are rarely tested. Failure to test integrative models has likely yielded misrepresentations of the causes of adolescent alcohol use, and research moving beyond testing circumscribed models (e.g., peer influence or family risk models) is critical. This study sought to investigate the influence of neighborhood, family, and peer contexts on early adolescent alcohol use using a multi-informant longitudinal cross-lagged design.
Direct and indirect effects of neighborhood characteristics
Consistent with hypotheses, neighborhood disadvantage and cohesion had weak direct effects on adolescent delinquency and alcohol use. Neighborhood effects are viewed as becoming stronger with age, as youth spend less time at home and more time with peers in the community (Murry et al., Reference Murry, Berkel, Gaylord-Harden, Copeland-Linder and Nation2011). Developmental research suggests that in early adolescence neighborhood effects are more distal and thus have weak direct effects on behaviors, especially when proximal socialization factors (e.g., peers) are taken into account. Our results suggest that the effects of neighborhood disadvantage on adolescent problem behaviors were largely mediated by affiliation with deviant peers. Neighborhood disadvantage was associated with greater peer delinquency at T1, which in turn predicted more adolescent rule breaking at T2. Furthermore, high levels of adolescent rule breaking at T2 predicted subsequent alcohol use at T3. This is largely consistent with the norms and collective efficacy model (Leventhal & Brooks-Gunn, Reference Leventhal, Brooks-Gunn, Lerner and Steinberg2004), whereby disadvantaged neighborhoods characterized by a lack of social resources and control networks result in low consensus regarding standards expected for residents (Brody et al., Reference Brody, Ge, Conger, Gibbons, McBride Murry and Gerrard2001). A consequence of the lack of these resources is thought to increase access to delinquent peers in unsupervised settings and subsequently more opportunities to engage in delinquent behaviors. Our findings also align with cascade models (Dodge et al., Reference Dodge, Malone, Lansford, Miller, Pettit and Bates2009), which highlight the progression from neighborhood factors, to peer deviance and adolescent externalizing behaviors, leading to substance use.
There was evidence indicating that neighborhood cohesion at T1 and peer delinquency at T1 mediated the association between neighborhood disadvantage and positive parenting at T2. Neighborhood disadvantage may compromise parenting through deterioration of social norms and shared ideals among neighborhood residents (i.e., cohesion; Chung & Steinberg, Reference Chung and Steinberg2006; Rankin & Quane, Reference Rankin and Quane2002). Furthermore, the relationship and ties model suggests that the added stress of living in disadvantaged neighborhoods likely disrupts family functioning, thus compromising positive parenting practices. However, contrary to our expectations, positive parenting did not mediate neighborhood effects on alcohol use and there was minimal evidence of positive parenting as a predictor of adolescent problem behavior. This was surprising given research suggesting that low levels of parental warmth and control increase the risk of delinquent behaviors, including alcohol use, in adolescents (e.g., Barnes et al., Reference Barnes, Reifman, Farrell and Dintcheff2000; Rankin & Quane, Reference Rankin and Quane2002).
Although theory and research suggest that parenting practices are important precursors to deviancy and alcohol use (e.g., Barnes et al., Reference Barnes, Reifman, Farrell and Dintcheff2000), there is evidence that parent–child relationship quality plays a critical role in adolescent deviance. For example, Kerr, Stattin, and Burk (Reference Kerr, Stattin and Burk2010) demonstrated that neither parental monitoring nor solicitation (i.e., active efforts of parents to track their adolescent) predicted changes in delinquency across time. In contrast, youth disclosure to parents predicted engagement in delinquent behavior 2 years later. Disclosure likely reflects the quality of the parent–child relationship (Kerr et al., Reference Kerr, Stattin and Burk2010) rather than parenting practices, and may be a better predictor of deviance and alcohol use. Thus, child disclosure to parents and quality of the parent–child relationship, rather than parental control and warmth, may be an important family-level correlate of early adolescent drinking.
Overall, neighborhood cohesion was a weaker predictor in the model compared to neighborhood disadvantage. This was not expected and may be a function of our use of parent reports of neighborhood cohesion. Research comparing census-based neighborhood characteristics with subjective reports from parents and youth (e.g., Brody et al., Reference Brody, Ge, Conger, Gibbons, McBride Murry and Gerrard2001) suggest that children's appraisal of neighborhood characteristics are more highly correlated with census data than are parent perceptions of neighborhood risk. Furthermore, there is evidence that census data and children's appraisals of neighborhood predicted affiliation with deviant peers, whereas parent appraisals of neighborhoods did not (Brody et al., Reference Brody, Ge, Conger, Gibbons, McBride Murry and Gerrard2001). There may be important differences in how caregivers and children experience their neighborhoods, differences in exposure to specific areas, and youth experiences may have a stronger influence on youth behavior (Brody et al., Reference Brody, Ge, Conger, Gibbons, McBride Murry and Gerrard2001). Stronger effects from adolescent report compared to parent report may also reflect possible bias due to common method variance (Byrnes, Chen, Miller, & Maguin, Reference Byrnes, Chen, Miller and Maguin2007; Chung & Steinberg, Reference Chung and Steinberg2006). Future research assessing both parent and child neighborhood perceptions may be important in providing a more comprehensive understanding of the links between neighborhood characteristics and adolescent alcohol use.
Reciprocal effects
Parenting
Although parenting is viewed as an important mechanism of socializing children, the relationship between child behavior and parenting is complex. Some research suggests that parents influence child behavior (Chuang et al., Reference Chuang, Ennett, Bauman and Foshee2005), while others suggest that children impact parenting (e.g., Fite et al., Reference Fite, Colder, Lochman and Wells2006; Kerr & Stattin, Reference Kerr, Stattin, Crouter and Booth2003). Our findings offered support for the latter. Delinquent peer affiliation and adolescent alcohol use at T1 predicted low levels of positive parenting at T2. One account for this direction of effects is that when youth associate with delinquent peers or initiate alcohol use, parent–child communication declines (Dishion, Poulin, & Medici Skaggs, Reference Dishion, Poulin, Medici Skaggs, Kerns, Contreras and Neal-Barnett2000), and this may undermine parents' efforts to socialize their child (Patrick, Snyder, Schrepferman, & Snyder, Reference Patrick, Snyder, Schrepferman and Snyder2005). Kerr and Stattin (Reference Kerr, Stattin, Crouter and Booth2003) found that adolescent delinquency including alcohol use predicted decreases in parental control, emotional support, and encouragement from parents over time, while these same parenting behaviors did not predict adolescent deviance.
It may also be important to keep in mind the age of our sample when considering child behavior effects on parenting. Bidirectional associations between parents and children are likely to change over time (Jang & Smith, Reference Jang and Smith1997). Parents tend to supervise their children less and tend to have less of an impact on child behaviors as children transition into adolescence. At the same time, the transition to adolescence is marked by a significant shift in the power dynamic from parent to child (Jang & Smith, Reference Jang and Smith1997). This shift coincides with a period when adolescents are seeking increased autonomy from parents and are highly influence by peers (Laird, Pettit, Bates, & Dodge, Reference Laird, Pettit, Bates and Dodge2003). Thus, it is not surprising that in our early adolescent sample, youth tend to have a stronger impact on parenting and that peers have a stronger impact compared to parents.
It is important to note that although peer delinquency and adolescent alcohol use influenced parenting practices, adolescent rule breaking did not. Most research on bidirectional effects of parenting and adolescent behaviors have combined delinquent behaviors and alcohol use to reflect antisocial behavior or deviancy (e.g., Kerr & Stattin, Reference Kerr, Stattin, Crouter and Booth2003); our study separated these two domains to examine their unique effects. Other work that has examined the unique reciprocal effects of adolescent delinquency and substance use on parenting demonstrates full reciprocal associations between substance use and parenting, and limited support for full reciprocal associations for externalizing behaviors (Stice & Barrera, Reference Stice and Barrera1995); namely, there was only evidence that externalizing behaviors predicted subsequent parenting practices but not the reverse. Adolescent externalizing behaviors and substance use were not assessed in the same model (Stice & Barrera, Reference Stice and Barrera1995). Although adolescent rule-breaking behaviors were negatively correlated with parenting practices in our sample, it may be that when examining both problem behaviors in the same model, adolescent alcohol use is a stronger predictor of parenting practices. The age of our sample during T1 is consistent with the larger literature's definition of early-onset drinking (i.e., use at age 14 or younger; Donovan & Molina, Reference Donovan and Molina2011). Research suggests that early-onset drinking is indicative of severe behavior problems and associated with problematic outcomes later in adolescence, including physical aggression, dropping out of school, risky sexual behavior, illicit drug use, substance use disorders, and alcohol- and drug-related motor vehicle crashes (Hingson et al., Reference Hingson, Heeren, Levenson, Jamanka and Voas2002, Reference Hingson, Edwards, Heeren and Rosenbloom2009). As such, little unique variance might have existed for adolescent rule breaking on parenting above and beyond alcohol use.
Peer delinquency
As expected, there was support for both adolescents being influenced by (socialization) and selecting to affiliate with (selection) delinquent peers. High levels of peer delinquency at T1 predicted adolescent rule breaking at T2, and rule breaking at T2 predicted subsequent alcohol use at T3. Similarly, peer delinquency predicted alcohol use directly, but only during the last wave of the study. Stability of alcohol use across T1 and T2 was high (standardized estimate = 0.73, p < .001), suggesting little change in alcohol use across the first two waves of the study. High stability may have resulted in limited prediction of alcohol use at T2. These findings are consistent with research suggesting that youth may learn problem behaviors through exposure to delinquent peers (Dishion et al., Reference Dishion, Capaldi, Spracklen and Li1995). There is considerable evidence that youth tend to select peers with proclivities similar to themselves because similarity provides opportunities for validation and reinforcement (Byrne & Griffitt, Reference Byrne and Griffitt1973; Mercken et al., Reference Mercken, Candel, Willems and de Vries2009). Adolescents engaging in alcohol use may select into deviant peer groups because they offer acceptance of alcohol use.
Limitations and future directions
Although this study provided an important advancement in understanding three key contexts thought to be central to adolescent alcohol use in a comprehensive prospective mediational model, some limitations should be noted. Findings should not be generalized beyond the age characterized in this sample. Early adolescence is a period when peer influence is particularly salient (e.g., Dodge et al., Reference Dodge, Malone, Lansford, Miller, Pettit and Bates2009). In contrast, early adolescents may have less direct exposure to their neighborhoods compared to those in late adolescence. Accordingly, future studies should extend this model to later ages, and perhaps consider age as a moderator. In addition, alcohol use is usually light in early adolescence. It is important not to generalize these findings to other stages of use such as regular or problematic drinking. Future studies should consider how these social contexts impact other stages of alcohol use. Findings should not be generalized to samples with different demographic characteristics. Although our sample reflected characteristics of the county from which it was selected, it was largely White. Peer influence (e.g., Gibbons et al., Reference Gibbons, Pomery, Gerrard, Sargent, Weng and Wills2010) and parenting practices (Lansford, Deater-Deckard, Dodge, Bates, & Pettit, Reference Lansford, Deater-Deckard, Dodge, Bates and Pettit2004) may operate differently across racial and ethnic groups. Findings may also not generalize to other communities. Neighborhood characteristics are not universal; rather, they are embedded in sociocultural, historical, and geographical contexts (Mrug & Windle, Reference Mrug and Windle2009). Our sample was drawn from a region with low levels of ethnic heterogeneity and residential instability. Other studies have focused on regions with higher levels of ethnic heterogeneity, poverty, and residential instability such as Philadelphia and Chicago (e.g., Chung & Steinberg, Reference Chung and Steinberg2006). It is important to keep such variability in social ecology in consideration.
Another limitation is that a majority of variables used in this study were based on youth self-report. This may increase shared-method variance and may bias findings (Chung & Steinberg, Reference Chung and Steinberg2006). Although youth perception of peer and parenting behaviors is particularly meaningful during this developmental period (Kuppens et al., Reference Kuppens, Grietens, Onghena and Michiels2009), it will be important to replicate these findings across additional reporters and methods of assessment. Finally, we focused on positive parenting (a combination of demandingness and responsiveness), and other parenting behaviors may operate differently in predicting alcohol use in adolescence. For example, alcohol-specific socialization practices such as having clear rules and consequences for drinking alcohol, and the quality of the parent–child relationship may be more germane to adolescent alcohol use than are general parenting practices (e.g., Kerr et al., Reference Kerr, Stattin and Burk2010; Strandberg & Bodin, Reference Strandberg and Bodin2011). An important direction for future research is to examine potential differences in the relationship between disadvantaged neighborhoods and alcohol-specific parenting or the quality of the parent–child relationship versus general parenting practices.
Despite these limitations, this study builds from the extant literature by examining how parents and peers operate together to transmit neighborhood risk. Developmental–ecological models have utility in organizing this vast literature and show promise for understanding causal and reciprocal pathways to adolescent alcohol use. Failure to consider integrative models may offer an incomplete picture of the effects neighborhood disadvantage has on adolescent behaviors. Furthermore, studies examining joint effects rarely account for reciprocal effects, despite recognition of the importance of bidirectional models, and tend to focus on at-risk samples with concurrent designs (e.g., Chung & Steinberg, Reference Chung and Steinberg2006; Mrug & Windle, Reference Mrug and Windle2009), limiting conclusions on the direction of mediational effects. Our study addresses these limitations and tests a longitudinal developmental model. Findings are consistent with literature suggesting that peer delinquency impacts adolescent alcohol use. More novel is our finding that disadvantaged neighborhoods may promote affiliation with delinquent peers, and this may be a crucial mechanism by which neighborhoods impact adolescent alcohol use. Communities may organize opportunities for adolescents to spend time with peers in supervised settings either in school or in organized community contexts to minimize risk factors. Structured after-school programs for youth developed to address the potential risks posed by the lack of adult supervision such as the Positive Youth Development Collaborative (Tebes et al., Reference Tebes, Feinn, Vanderploeg, Chinman, Shepard and Brabham2007) and the Friendly PEERSuasion program (Smith & Kennedy, Reference Smith and Kennedy1991) have demonstrated promising results. Participants enrolled in these programs demonstrated less favorable attitudes toward alcohol and drugs, were more likely to view substances as harmful, and reported reduced incidence of substance use compared to those in the control group. These programs may be profitably targeted for youth in disadvantaged communities. The finding of less effective parenting as a response to adolescent alcohol use and peer delinquency suggests the need to refine intervention models to account for the putative influence of adolescents on parents. In addition to increasing structure, consistency, and involvement with children, parent-training programs should also address how to respond to a child's alcohol use initiation and delinquent peer affiliation. These methods may help curtail disenfranchisement of parents as youth engage in problem behaviors and may help prevent adolescent alcohol use.