1. Introduction
Due to uncontrollable factors such as erosion and deposition, the surfaces of compressor and turbine blades typically exhibit roughness. This roughness can introduce an uncertainty of approximately
 $\pm$
9% in the system’s available power, affecting equipment selection and overall economic viability (Chung et al. Reference Chung, Hutchins, Schultz and Flack2021). The roughness distribution on turbine and compressor blades is inherently complex and varies with specific operational conditions. For instance, the roughness patterns on vanes and blades in the low-pressure turbine differ both in the streamwise and radial directions (Kellersmann et al. Reference Kellersmann, Weiler, Bode, Friedrichs, Stading and Ramm2018), and the roughness on compressor blades varies between those in under-wing and rear-mounted engine configurations (Gilge et al. Reference Gilge, Kellersmann, Friedrichs and Seume2019). In the case of compressor blades, turbine blades or aerofoils, the fluid encounters both favourable and adverse pressure gradient sections. The fluid accelerates under favourable pressure gradients and decelerates under adverse ones. Favourable pressure gradients help to thin the boundary layer, whereas adverse pressure gradients thicken it, potentially leading to boundary-layer separation. Separation is characterised by an inflection point in the velocity distribution and the formation of a backflow region downstream of the separation point. At high altitudes, where air density is significantly reduced, a thicker boundary layer at lower Reynolds numbers is more prone to separation under adverse pressure gradients. When the incoming flow disturbances and adverse pressure gradients are not severe, the boundary layer may reattach some distance downstream of the separation point, with transition occurring beyond the reattachment point. The region between the separation and reattachment points is known as a laminar separation bubble (LSB), which can increase total pressure loss and diminish aerofoil lift. This can be mitigated by designing the blade’s leading edge and managing roughness to inhibit the growth of the LSB. The Kelvin–Helmholtz (K-H) instability, a form of inviscid instability, frequently accompanies LSBs. According to the Rayleigh’s inflection point criterion, a necessary condition for inviscid flow instability is the presence of an inflection point in the velocity distribution. Fluid at the LSB boundary can generate spanwise rollers under K-H instability, which may then undergo secondary instability, deform and produce streamwise vortices. These vortices evolve into hairpin vortex structures, with their eventual breakdown signalling the transition to turbulent flow (Li & Yang Reference Li and Yang2019; Wang et al. Reference Wang, Ge, Deng, Yu and Wang2019).
The conjunction of complex roughness and pressure gradients presents significant challenges in predicting resistance and analysing the mechanisms of near-wall flows, such as those occurring on blade surfaces. Consequently, numerous studies have concentrated on the impact of isolated roughness elements on the transition of flat-plate flows without pressure gradients. To date, variously shaped roughness elements have been examined, including cylindrical elements (Puckert & Rist Reference Puckert and Rist2018; Weingärtner et al. Reference Weingärtner, Mamidala and Fransson2023), hemispherical elements (Vaid et al. Reference Vaid, Vadlamani, Malathi and Gupta2022) and cuboidal elements (Ma & Mahesh Reference Ma and Mahesh2022), among others. Cylindrical roughness elements stand out as the most classic subject of research, which primarily investigates the effects of the Reynolds number of elements, relative height within the local boundary layer, and the aspect ratio. These parameters characterise the element feature’s height and thickness, respectively. Investigations into the flat-plate transition induced by cylindrical roughness elements can be traced back to Fransson et al. (Reference Fransson, Brandt, Talamelli and Cossu2004), who demonstrated that the relative height of roughness elements determines the maximum amplitude of induced streaks. Subsequent studies by Ergin & White (Reference Ergin and White2006) explored the instability mechanisms caused by high roughness elements under subcritical and supercritical Reynolds numbers, revealing distinct instability behaviours with varying aspect ratios as the Reynolds number changes. Loiseau et al. (Reference Loiseau2014) conducted numerical simulations at supercritical Reynolds numbers for isolated cylindrical roughness elements with a relative height below 1 and an aspect ratio range of approximately 0.85–3. Their findings indicate that flows with thinner cylinders are subject primarily to sinuous instabilities, while those with thicker cylinders are governed by varicose instabilities. These two instability modes have been elaborated upon by Andersson et al. (Reference Andersson, Brandt, Bottaro and Henningson2001) and Vaughan & Zaki (Reference Vaughan and Zaki2011). Puckert & Rist (Reference Puckert and Rist2018) conducted experimental research based on the work of Loiseau et al. (Reference Loiseau, Robinet, Cherubini and Leriche2014), confirming that varicose modes correspond to thick cylinders under both subcritical and supercritical Reynolds numbers, in alignment with Loiseau’s findings. However, for thin cylinders in supercritical conditions, both instability modes were found to coexist, with the roughness element acting as a wavemaker, possibly due to external experimental noise. In supercritical conditions with thin cylinders, the sinuous mode prevails predominantly in very-low-turbulence environments. The unsteady behaviour of the flow can be altered not only by the Reynolds number but also by the coupled effect of relative height and aspect ratio. Bucci et al. (Reference Bucci, Cherubini, Loiseau and Robinet2021) employed direct numerical simulation (DNS), dynamic mode decomposition (DMD) and stability methods to examine the influence of isolated cylinders with a relative height exceeding 1 on boundary-layer transition, revealing that the leading unstable mode for thin cylinders is the varicose mode when the aspect ratio exceeds 2.04. It has been emphasised that the Reynolds number, relative height, aspect ratio of isolated roughness element and their interactions profoundly impact the dynamics of boundary-layer transition.
In practical applications, the irregular roughness encountered is typically more intricate than the simplified configurations of isolated roughness elements. The next step is naturally to focus on the discrete distributions formed by multiple, repeated isolated roughness elements, where the flow through the interstices becomes increasingly complex due to the interaction among these elements. Von Deyn et al. (Reference von Deyn, Forooghi, Frohnapfel, Schlatter, Hanifi and Henningson2020) employed numerical methods to investigate transition phenomena with arrays of hemispherical roughness elements and noted that altering the array density did not significantly alter the spacing of induced velocity streaks, provided the height of the roughness elements remained constant. Ma & Mahesh (Reference Ma and Mahesh2023) conducted DNS on the boundary layer over a cube array with varying spanwise and streamwise spacings, observing that wider spanwise spacing augmented the hairpin vortex and fostered transition, while increased streamwise spacing induced varicose and sinuous modes in the first and second rows of roughness elements, respectively. The DNS research of Seddighi et al. (Reference Seddighi, He, Pokrajac, O’Donoghue and Vardy2015) elaborated on the influence of pyramid-shaped roughness element arrays on turbulence characteristics, encompassing quadrant analysis, turbulence anisotropy and energy spectra. In applications such as heat exchangers and turbine cooling (Shishkina & Wagner Reference Shishkina and Wagner2011; Borello, Salvagni & Hanjalic Reference Borello, Salvagni and Hanjalic2015), riblets can be regarded as two-dimensional roughness elements of limited spanwise length. These elements give rise to pronounced secondary flows in the vicinity of the riblets, posing new challenges to the study of boundary-layer transition (Sewall et al. Reference Sewall, Tafti, Graham and Thole2006; Pirozzoli et al. Reference Pirozzoli, Modesti, Orlandi and Grasso2018). Early research categorised two-dimensional roughness elements based on the pitch-to-height ratio
 $P/H$
(Perry, Schofield & Joubert Reference Perry, Schofield and Joubert1969; Bandyopadhyay Reference Bandyopadhyay1987), distinguishing between k-type roughness elements, characterised by
 $P/H\gt 3$
and a ‘convex’ profile, and d-type roughness elements, marked by
 $P/H\leqslant 3$
and a ‘concave’ one. In recent years, streamwise-aligned riblets have also been developed and can be classified into two categories (Wang & Cheng Reference Wang and Cheng2006): ‘raised’ ridge-type riblets, defined by their localised height, and ‘sunken’ strip-type riblets, characterised by their wall shear. Mahmoodi-Jezeh & Wang (Reference Mahmoodi-jezeh and Wang2020) utilised DNS to study spanwise-aligned square riblets with different blockage ratios, revealing that the enhancement of ejection and sweep events, as well as vortex strength near the riblet’s crest, is proportional to the riblet’s height. Similarly, the Reynolds stress in the secondary flow and at the riblet’s top increased with the blockage ratio. The analysis of Endrikat et al. (Reference Endrikat, Modesti, Garcia-mayoral, Hutchins and Chung2021) of streamwise-aligned riblets of various shapes on K-H instability in channel flow found that K-H rollers are fully developed only in regions of high shear near the riblet tips.
When the density of multiple roughness elements is sufficiently high, their discrete distribution may be effectively approximated as a continuous rough surface. To simplify the matter, an equivalent sand-grain roughness, proposed by Nikuradse (Reference Nikuradse1933), is initially employed to describe a rough surface that exhibits comparable resistance properties. Nikuradse categorises the equivalent sand-grain roughness at the viscous scale, denoted as
 $k_{s}^{+}$
, into three distinct ranges. In the first range,
 $k_{s}^{+}\lt 5$
, the friction resistance is independent of roughness and is solely determined by the Reynolds number. Conversely, in the range of
 $k_{s}^{+}\gt 70$
, roughness significantly impacts the resistance. The intermediate range represents a transitional zone. Previous research (Bons Reference Bons2010) has compiled empirical correlations for gas turbine blades from various literatures spanning 1962–2006, albeit without achieving complete consensus. Despite its inability to standardise the variability of actual roughness, the concept of equivalent sand-grain roughness remains a valuable tool for investigating the characteristics of real rough surfaces. For instance, it has been utilised to examine the influence of rough surfaces with varying coverage areas on the suction side of a high-subsonic compressor (Wang et al. Reference Wang, Yang, Li, Zhao, Zhang and Lu2021b
), which found that roughness distribution near the leading edge can effectively curtail the growth of LSB and mitigate momentum loss.
The rough surfaces encountered in compressor and turbine blades lack a definitive shape, yet they can be characterised by certain statistical attributes. Chung et al. (Reference Chung, Hutchins, Schultz and Flack2021) offer an excellent synopsis of the statistical properties employed to describe three-dimensional rough surfaces, with several cited references emphasising the significance of skewness (
 $Sk$
), effective slope (
 $ES$
), and root-mean-square height (
 ${h}_{\textit{rms}}$
). Previous literature has delved into the influence of these properties on resistance. Jelly et al. (Reference Jelly, Ramani, Nugroho, Hutchins and Busse2022) have investigated the effects of the effective slope in the streamwise and spanwise directions on flow resistance, revealing that augmenting the ratio of the spanwise effective slope to the streamwise effective slope can diminish the countercurrent region behind the roughness peak and mitigate flow separation. Furthermore, roughness aligned with the streamwise direction exhibits lower resistance than that aligned spanwise, corroborating the findings of Busse & Jelly (Reference Busse and Jelly2023), who examined the impact of both positive and negative skewness on the roughness function, noting that beyond a certain skewness threshold, the roughness function, Reynolds stress peak and other characteristics reach saturation. This occurs because at high skewness levels, the distribution of peaks or deep craters becomes sparse, and their influence on global resistance diminishes. Their study found that all the roughness functions
 $\Delta {{U}^{+}}$
with positive skewness exceeded those with negative skewness, given the same kurtosis, a phenomenon also observed in numerous other studies. This may be attributed to the fact that negative skewness, characterised by more pits, tends to produce additional separation zones and recirculation flows, reducing surface forces, while positive skewness, with its abundance of convex peaks, enhances the velocity gradient near rough peaks and the windward area, thereby increasing surface forces (Yang et al. Reference Yang, Stroh, Chung and Forooghi2022). Moreover, the alternating distribution of smooth and rough surfaces can induce secondary flows (Stroh et al. Reference Stroh, Schafer, Frohnapfel and Forooghi2020), generating additional resistance, with the gradient of normal-spanwise Reynolds shear stress being closely linked to the pattern of secondary flow distribution.
The aforementioned numerical simulations of the actual rough surface are limited to fully developed turbulence within a minimal flow unit. However, the blade boundary layer in fluid machinery typically undergoes a laminar–turbulent transition, with the fluid being forced by favourable–adverse pressure gradient along the streamwise direction. Ishida et al. (Reference Ishida, Ohira, Hosoi, Tokugawa and Tsukahara2022) conducted DNS on swept wings with isolated cylinders using a body-fitted grid and complemented the wind-tunnel experiment using the wing-shaped pressure-displacement body. Their findings indicated that isolated cylinders increase drag and diminish lift. Wang et al. (Reference Wang, Lu, Yang, Zhao and Zhang2021a ) investigated distributed roughness arrays on compressor blades (derived from analytical formulas) through large eddy simulations, revealing that these arrays effectively enhance streamwise vortices and accelerate the instability of the separated shear layer. An increase in roughness amplitude markedly reduces the profile loss. Other numerical studies exploring the placement of roughness on actual aerofoil/blade surfaces include the work of De Vincentiis et al. (Reference De Vincentiis, Henningson and Hanifi2022) and Jelly et al. (Reference Jelly, Nardini, Rosenzweig, Leggett, Marusic and Sandberg2023). Nevertheless, simulating the actual blade boundary layer with body-fitted meshes is inherently computationally expensive, making it impractical to analyse three-dimensional rough surfaces with specific statistical properties based on this. Drawing inspiration from the experimental set-up involving a wing-shaped pressure-displacement body, studies (Zhang & Hodson Reference Zhang and Hodson2006; Rao et al. Reference Rao, Jefferson-Loveday, Tucker and Lardeau2014; Sivaramakrishnan Malathi et al. Reference Sivaramakrishnan Malathi, Nardini, Vaid, Rao Vadlamani and Sandberg2022) have employed a top deformation boundary (contraction–expansion sections) to impose alternating pressure gradients on the flat-plate boundary layer with rough surface. Additionally, research has applied variable pressure gradients by prescribing the velocity distribution at the domain’s top horizontal boundary via the Falkner–Skan equation (Zoppini, Ragni & Kotsonis Reference Zoppini, Ragni and Kotsonis2022; Nakagawa, Tsukahara & Ishida Reference Nakagawa, Tsukahara and Ishida2023). This method of imposing pressure gradients through the far-field boundary not only reduces computational costs but also ensures the presence of orthogonal meshes near the plate, which is advantageous for resolving three-dimensional rough surfaces in DNS (utilising the immersed boundary method).
The influence of three-dimensional rough surfaces on the flow resistance characteristics within the minimal flow unit under complete turbulence has been extensively investigated. The effects of the rough surface’s characteristic height, effective slope in the spanwise and streamwise directions, and positive/negative skewness on friction resistance, pressure resistance, roughness function, and the spatial scale of coherent structures across the rough surface (encompassing the entire computational domain) have been elucidated (Chung et al. Reference Chung, Hutchins, Schultz and Flack2021; Jelly et al. Reference Jelly, Ramani, Nugroho, Hutchins and Busse2022; Yang et al. Reference Yang, Stroh, Chung and Forooghi2022; Busse & Jelly Reference Busse and Jelly2023). However, their impact on the LSB and flow characteristics in the laminar–turbulent transition region with pressure gradients remains ambiguous. To comprehend the flow dynamics in actual compressor and turbine cascades and to theoretically guide the reduction of losses, energy consumption and enhance economic viability, it is crucial to examine how diverse statistical rough-surface attributes influence local resistance characteristics and downstream transition flow patterns. This paper conducts such investigations, encompassing secondary flow patterns, resistance and dispersive characteristics of local rough surfaces, as well as the transient characteristics in the downstream transition region, energy transfer from ‘time-averaged flow to fluctuating flow’, the spatiotemporal scales of coherent structures, and the characteristic modes. Nine types of three-dimensional rough surfaces, with varying effective slope ratios (
 ${E{{S}_{z}}}/{E{{S}_{x}}}$
) and
 $Sk$
, but identical
 ${h}_{\textit{rms}}$
, are designed for placement within the favourable–adverse pressure gradient segment. Section2 introduces the statistical properties of rough surfaces and the computational model, and delineates the numerical methodologies for resolving three-dimensional rough surfaces. Section3 presents and discusses the computational outcomes. Section4 synthesises the findings of this study.
2. Numerical methodology
2.1. Rough-surface synthesis
Building upon the research of Yang et al. (Reference Yang, Li, Wang and Hong2014), two-dimensional phase sequences can be synthesised with specified first four moments and autocorrelation functions. These moments encompass the mean height, root-mean-square height, skewness and kurtosis, while the autocorrelation function delineates the streamwise and spanwise wavelengths. It is pertinent to note the Pearson’s inequality (1916) constraint between skewness and kurtosis, which dictates that the values of skewness and kurtosis must be carefully selected when generating the rough-surface matrix. To enhance the convergence of numerical simulations, it is further essential to apply low-pass Fourier filtering to the generated matrix, thereby yielding a smoothly varying three-dimensional surface (Jelly & Busse, Reference Jelly and Busse2018, Reference Jelly and Busse2019a
). The method proposed by Busse et al. (Reference Busse, Lutzner and Sandham2015) is employed, wherein the rough-surface height matrix undergoes a two-dimensional Fourier transformation along the streamwise and spanwise directions. Subsequently, a circular low-pass filter is applied to eliminate the high-wavenumber components. The filtered roughness is then retrieved via the inverse Fourier transform. This filtering process effectively removes the smallest scales from the original rough surface, avoiding excessive mesh densification and computational costs associated with DNS, while ensuring that the rough-surface edges satisfy the periodicity requirements of the computational domain boundaries. The key of this approach lies in determining the cutoff wavenumber
 ${k}_{c}$
. In this paper, the autocorrelation function in Fourier space is utilised to estimate the original wavenumbers
 ${k}_{x,\textit{origin}}$
,
 ${k}_{z,\textit{origin}}$
in the streamwise and spanwise directions of the rough surface. The cutoff wavenumber is calculated as
 $k_{c}^{2}={{ ( {{k}_{x,\textit{origin}}}+2 )}^{2}}+{{ ( {{k}_{z,\textit{origin}}}+2 )}^{2}}$
, thereby ensuring that the filtered rough surface maintains the overall similarity to the original while achieving the desired filtering effects of edge periodicity and eliminating the smallest scales.
In this study, nine types of irregular rough surfaces are designed based on the ratio of the spanwise effective slope to the streamwise effective slope (
 ${E{{S}_{z}}}/{E{{S}_{x}}}$
) and
 $Sk$
, and their statistical properties are detailed in table 1. Notably, three positive skewness surfaces in table 1 can be derived by directly inverting the y-coordinates of the three negative skewness surfaces, reversing only the skewness sign while leaving most other statistical parameters unchanged. It is evident that the
 ${E{{S}_{z}}}/{E{{S}_{x}}}$
and
 $Sk$
values obtained from the final rough surface deviate from the prescribed values in the synthesis program, a consequence of the inevitable changes introduced by low-pass Fourier filtering. Table 1 reveals that the deviations of
 ${E{{S}_{z}}}/{E{{S}_{x}}}$
and
 $Sk$
for the nine rough surfaces in this study all fall within 3.5%, a range smaller than the maximum deviations of
 $\pm$
5% in the work of Busse & Jelly (Reference Busse and Jelly2023). The nine rough surfaces are depicted in figure 1. At the same skewness, c_0.52_0 clearly exhibits a larger streamwise wavenumber, while c_2.40_0 presents a larger spanwise wavenumber. With the same effective slope ratio, c_1_-1.4 features several large-scale pits, in contrast to c_1_1.4 which boasts several large-scale peaks. For the non-Gaussian (
 $Sk\ne 0$
) and anisotropic (
 ${E{{S}_{z}}}/{E{{S}_{x}}}\;\ne 1$
) rough surfaces, it is noted that the
 ${E{{S}_{z}}}/{E{{S}_{x}}}=0.52$
group preserves the predominant streamwise wavenumber while concurrently manifesting pronounced characteristics of pits/peaks. Likewise, the
 ${E{{S}_{z}}}/{E{{S}_{x}}}=2.40$
group presents a topography marked by closely spaced spanwise undulations, coupled with distinct and large-scale profound indentations/protuberances.
Statistical attributes of irregular rough surfaces are as follows:
 $E{{S}_{x}}$
denotes the effective slope in the streamwise direction, while
 $E{{S}_{z}}$
represents the spanwise effective slope,
 ${h}_{\textit{rms}}$
refers to the root-mean-square height,
 $Sk$
to skewness and
 $Ku$
to kurtosis. The notation
 ${S}_{y,5\times 5}$
signifies the division of the rough surface matrix into
 $5\times 5$
blocks, with individual peak and valley heights computed for each segment, followed by the averaging of these heights across all segments. Here,
 ${h}_{\textit{max}}$
indicates the maximum altitude,
 ${h}_{\textit{min}}$
the minimum altitude and
 ${h}_{\textit{eff}}$
the melt-down height, calculated as the ratio of the total volume encompassed by the rough surface to the projected area on the bottom wall;
 $H$
represents the characteristic height of the computational domain, fixed at a value of one. The initial digit of the case name corresponds to the
 $E{{S}_{z}}/E{{S}_{x}}$
established in the rough surface synthesis process, with the second digit indicating the
 $Sk$
value;
 $\delta _{ES}^{*}$
and
 $\delta _{Sk}^{*}$
denote the relative errors between the actual and set values of
 $E{{S}_{z}}/E{{S}_{x}}$
and
 $Sk$
, respectively.

The height distribution of the nine rough surfaces studied in this paper.

2.2. Numerical simulation and computational domain set-up
In this study, DNS was employed to quantify the flow dynamics over a three-dimensional rough surface. The open-source code Semtex (Blackburn et al. Reference Blackburn, Lee, Albrecht and Singh2019) was utilised, with the spectral element method deployed to discretise the flow field spatially. This approach amalgamates the versatility of the finite element method in handling complex boundaries with the high accuracy of the spectral method. A stiffly-stable time integration scheme (Karniadakis, Israeli & Orszag Reference Karniadakis, Israeli and Orszag1991), boasting second-order precision, was implemented. In the absence of the three-dimensional rough surface, the incompressible Navier–Stokes equation to be addressed is as follows
 $\colon$
 \begin{align}{\boldsymbol{\nabla }\boldsymbol{\cdot }{\boldsymbol{u}^{*}} \&=0, } \end{align}
 \begin{align}{ \frac {\partial {\boldsymbol{u}^{*}}}{\partial t}+\boldsymbol{\nabla }\boldsymbol{\cdot }\left ( {\boldsymbol{u}^{*}}{\boldsymbol{u}^{*}} \right ) \&=-\frac {\boldsymbol{\nabla }{{p}^{*}}}{\rho }+\nu {{{\nabla} }^{2}}{\boldsymbol{u}^{*}}, } \end{align}
where
 ${\boldsymbol{u}^{*}}={{ ( {{u}^{*}},{{v}^{*}},{{w}^{*}} )}^{\textrm T}}$
denotes the velocity field devoid of rough-surface influence,
 ${p}^{*}$
is the pressure field devoid of rough-surface influence,
 $\nu$
is the kinematic viscosity and
 $\rho$
is the density. The embedded boundary method (EBM) is employed to resolve the three-dimensional rough surface, with the following equations appended based on the research of Yang & Balaras (Reference Yang and Balaras2006)
 $\colon$
 \begin{align}{ \frac {{{\gamma }_{0}}}{\Delta t}\left ( \widehat {\boldsymbol{u}}-{\boldsymbol{u}^{*}} \right ) \&={\boldsymbol{f}_{\textit{EBM}}}, } \end{align}
 \begin{align}{\frac {{{\gamma }_{0}}}{\Delta t}\big( {\boldsymbol{u}^{n+1}}-\widehat {\boldsymbol{u}}\big) \&=-\boldsymbol{\nabla }\widehat {p}, } \end{align}
where
 ${\gamma }_{0}$
is the coefficient in the time integration scheme,
 $\Delta t$
is the time step,
 $\widehat {\boldsymbol{u}}$
is the corrected velocity field,
 $\boldsymbol{u}^{n+1}$
is the next layer velocity field to be updated,
 $\boldsymbol{f}_{\textit{EBM}}$
is the extra body force brought by the rough surface,
 $\widehat {p}$
is the pressure change brought by the rough surface, and the joint action of
 $\boldsymbol{f}_{\textit{EBM}}$
and
 $\widehat {p}$
can satisfy the incompressibility of
 $\boldsymbol{u}^{n+1}$
.
Combining (2.3) and (2.4) and applying divergence yields the Poisson equation of
 $\widehat {p}$
 $\colon$
 \begin{equation} {{\nabla }^{2}}\widehat {p}=\boldsymbol{\nabla }\boldsymbol{\cdot }{\boldsymbol{f}_{\textit{EBM}}}. \end{equation}
Once the corrected velocity field
 $\widehat {\boldsymbol{u}}$
is established,
 $\boldsymbol{u}^{*}$
and
 ${p}^{*}$
can be determined by solving (2.1) and (2.2). Subsequently,
 $\widehat {p}$
is derived from (2.3) and (2.5), and
 $\boldsymbol{u}^{n+1}$
is calculated by integrating (2.4). Ultimately, the pressure field for the next layer is updated using the following equation
 $\colon$
 \begin{equation} p={{p}^{*}}+\widehat {p}. \end{equation}
The corrected velocity field
 $\widehat {\boldsymbol{u}}$
is achieved by manually setting the velocity at points within the solid domain to zero and linearly interpolating the velocities at forced points – nodes in the fluid domain adjacent to at least one point in the solid domain. The specifics of the linear interpolation method are detailed in the work of Yang & Balaras (Reference Yang and Balaras2006). It is important to note that this paper employs quadrilateral discretisation for the resolving of solid walls instead of triangulation (o’Rourke Reference o’Rourke1998; Ericson Reference Ericson2005; Yang Reference Yang2016), as quadrilateral discretisation is more straightforward for common geometries such as cuboids, cylinders and spheres. Additionally, the iterative technique proposed by Busse et al. (Reference Busse, Lutzner and Sandham2015) is utilised, which further streamlines the implementation of the EBM in DNS.
(a) A computational domain featuring a three-dimensional rough surface and a pressure gradient is depicted, with the rough surface positioned in proximity to the peak velocity brought by the pressure gradient. The buffer slopes are set at the front and rear ends of the rough surface. A buffer layer is situated near the outlet to mitigate the distortion of upstream flow caused by turbulent backflow. The outlet velocity field is subject to zero Neumann boundary conditions, while the pressure field adheres to zero Dirichlet boundary conditions. The bottom wall is designed as a no-slip wall, and the lowest point of the rough surface is consistently aligned with the bottom wall across all cases. The spanwise boundaries are configured as periodic boundaries. (b) The distributions of streamwise velocity
 $u$
and wall-normal velocity
 $v$
for the inlet and top boundaries of the domain are manifested. (c) The distribution of bottom-wall pressure coefficient along the streamwise direction in the absence of rough surface are presented, (
 ${{C}_{p}}=( p-{{p}_{\textit{in}}} )/( \rho U_{\infty }^{2}/2 )$
), with (
 $p_{\textit{in}}$
) denoting the inlet pressure.

The computational domain depicted in figure 2(a) features a favourable–adverse pressure gradient segment, with a three-dimensional rough surface positioned adjacent to the streamwise peak velocity. This pressure gradient is induced by deforming the top boundary in the experiment (Radi & Fasel Reference Radi and Fasel2010; Coull & Hodson Reference Coull and Hodson2011; Jagadeesh & Fasel Reference Jagadeesh and Fasel2013) and can be induced by prescribing the normal velocity distribution of the top boundary in the numerical simulation (Alam & Sandham Reference Alam and Sandham2000; Spalart & Strelets Reference Spalart and Strelets2000). The present study draws upon the work of Hosseinverdi & Fasel (Reference Hosseinverdi and Fasel2019), and the designed inlet and top boundary velocity distributions are presented in figure 2(b). The inlet streamwise velocity follows the Blasius profile. It is imperative that the streamwise and wall-normal velocity at the junction of the inlet and top boundary remain consistent. The specifics of verifying the independence of the computation for the wall-normal dimension of the domain are delineated in Appendix B. This serves to demonstrate that the Dirichlet condition for the top streamwise velocity does not impose non-physical constraints or generate additional vortices within the boundary layer. To mitigate the excessive impact of the sharp transitions at the leading and trailing edges of the rough surfaces on the flow outcomes, this study employs the smooth slope introduced by Ananth et al. (Reference Ananth, Nardini, Vaid, Kozul, Rao Vadlamani and Sandberg2023) as a buffer zone. The cosine profiles are adapted from the research of Sandberg & Sandham (Reference Sandberg and Sandham2006). The buffer slope’s height for each rough surface is ascertained based on the values of
 $h_{\textit{eff}}$
provided in table 1, with the streamwise length maintained at 20% of the rough surface’s total length. Figure 2(c) illustrates the distribution of the bottom-wall pressure coefficient along the streamwise direction in the absence of rough surface. It is evident that the maximum pressure (which coincides with the peak velocity) is observed at the location where the wall-normal velocity at the top boundary undergoes a significant change as shown in figure 2(b), approximately at
 $x=2$
. Furthermore, the pressure coefficient distribution along the bottom wall in this study exhibits a comparable pattern to those observed on the surfaces of fluid machinery such as the aerofoil (Hosseinverdi & Fasel Reference Hosseinverdi and Fasel2019) and compressor blade (Ling et al. Reference Ling, Gao, Wang, Zeng, Huang and Xi2024). Each of these surfaces experiences a section with a monotonically diminishing pressure value under the favourable pressure gradient, succeeded by a segment with a monotonically ascending pressure value under the adverse pressure gradient. In the region of the reverse pressure gradient, a plateau with a negligible slope is apparent, corresponding to the formation of a LSB due to the adverse pressure gradient. The minimum pressure coefficient depicted in figure 2(c) is roughly
 $-0.37$
, falling within the range observed between the
 $-0.44$
minimum of the aerofoil investigated by Hosseinverdi & Fasel (Reference Hosseinverdi and Fasel2019) and the
 $-0.32$
minimum recorded for the compressor blade by Zaki et al. (Reference Zaki, Wissink, Rodi and Durbin2010).
In this research, the reference length scale is denoted as
 $H=1$
, corresponding to half the wall-normal height of the computational domain, while the reference velocity scale is the top streamwise velocity
 ${{U}_{\infty }}=1$
. Unless specified otherwise, all variables depicted in figure 2 and subsequent text are normalised with respect to the two reference scales. For instance, the Reynolds number
 ${\textit{Re}}=H{{U}_{\infty }}/\nu =4000$
is consistent across all cases. Employing the Blasius distribution as the initial field, 800 snapshots were collected to achieve a statistical average, with transient effects having been flushed out after approximately two flow times. This statistical duration corresponds to half of the lowest eddy turnover time (
 $H/{{u}_{\tau ,max }}$
,
 ${{u}_{\tau ,max }}$
: maximum friction velocity), which encompasses roughly 1550 snapshots, whereas one full cycle of the largest eddy turnover time (
 $\sim H/{{U}_{\infty }}$
) comprises approximately 33 snapshots. When normalising with the friction velocity over the rough surface, the time step for each snapshot is denoted as (
 $\Delta {{t}_{\tau }}=\Delta tu_{\tau }^{2}/\nu \approx 1.94$
,
 ${{u}_{\tau}}$
: friction velocity). The sufficiency of the spanwise range of the computation domain and the grid resolution are verified in Appendix A and Appendix B, respectively.
3. Results
3.1. Rough-surface drag and pressure
For rough surfaces characterised by varying statistical properties, the primary flow characteristic of interest is the friction resistance, as depicted in figure 3. The friction resistance coefficient and pressure resistance coefficient of the rough surface can be determined through the following equations (Jelly et al. Reference Jelly, Ramani, Nugroho, Hutchins and Busse2022)
 $\colon$
 \begin{align} {{C}_{\textit{fi}}}=\frac {\mu \left ( \dfrac {\partial {{U}_{i}}}{\partial {{x}_{\!j}}}+\dfrac {\partial {{U}_{\!j}}}{\partial {{x}_{i}}} \right )}{\dfrac {\rho U_{\infty }^{2}}{2}}\dfrac {\dfrac {\partial F}{\partial {{x}_{\!j}}}}{\left \| \dfrac {\partial F}{\partial {{x}_{\!j}}} \right \|}, \text{ }{{C}_{p}}=\dfrac {\left ( P-{{P}_{0}} \right )}{\dfrac {\rho U_{\infty }^{2}}{2}}\frac {\dfrac {\partial F}{\partial {{x}_{\!j}}}}{\left \| \dfrac {\partial F}{\partial {{x}_{\!j}}} \right \|},\\[-10pt]\nonumber\end{align}
 \begin{align} F\left ( x,y,z \right ) &=h\left ( x,z \right )-h=0,\end{align}
where
 $\mu$
is dynamic viscosity,
 $h(x, z)$
is rough surface height function,
 $h$
is rough surface height equal to
 $y$
when the surface is placed on a flat plate,
 $F ( x,y,z )$
stands for the equation of the rough surface, subscripts
 $i,j$
follow the Einstein summation convention,
 ${P}_{0}$
is the inlet pressure,
 ${U}_{i}$
is the time-averaged velocity.
(a) The distribution of streamwise friction coefficients for the nine rough surfaces is presented, with the isosurface only showing the parts of forward flow. (b) An overview of the streamwise friction resistance coefficient
 ${C}_{\textit{fx}}$
isosurfaces for negative skewness group (red) and positive skewness group (blue) is depicted, with the higher area highlighted by green isolines.

Figure 3(a) shows the streamwise friction coefficient distribution in each case. It can be found that the streamwise resistance of c_1_0 is distributed evenly, and the streamwise resistances of the
 ${E{{S}_{z}}}/{E{{S}_{x}}}=0.52$
group are concentrated in the structure with a certain streamwise wavelength modulated by small
 $E{{S}_{z}}/E{{S}_{x}}$
. Relatively, the resistances of the
 ${E{{S}_{z}}}/{E{{S}_{x}}}=2.40$
group are concentrated at the spanwise crest. Comparative analysis of cases under identical
 ${E{{S}_{z}}}/{E{{S}_{x}}}$
reveals that the area of peak resistance, induced by negative skewness, is substantially expanded. This is attributable to the presence of several large-scale, profound indentations that create an increased number of elevated regions, which are the primary locations of resistance distribution. As can be seen from table 2, structures modulated along the spanwise direction by large
 $E{{S}_{z}}/E{{S}_{x}}$
will generate greater streamwise resistance with the same skewness. For the remaining cases with significant positive and negative skewness, as described in §2.1, they are obtained by inverting each other’s y-coordinates, i.e. their peaks and pits correspond to each other. Therefore, it can be clearly shown in figure 3(b) that irrespective of
 $E{{S}_{z}}/E{{S}_{x}}$
, under positive skewness, streamwise resistance is primarily concentrated in the vicinity of rough peaks, whereas in negative skewness, it bypasses the depressed regions, aggregating in the elevated zones external to these depressions. Table 2 indicates that, with the same
 $E{{S}_{z}}/E{{S}_{x}}$
, the integrated-averaged value of streamwise resistance is consistently maximised in negative skewness, which aligns with the larger resistance peak area attributed to negative skewness as depicted in figure 3(a). This finding contradicts the consensus from prior research suggesting that positive skewness friction resistance exceeds that of negative skewness (Yang et al. Reference Yang, Stroh, Chung and Forooghi2022; Busse & Jelly Reference Busse and Jelly2023). They postulate that the increased recirculation zones under negative skewness counteract some of the surface forces imposed by the forward flow. However, in the presence of sparsely distributed large-scale depressions in the negative skewness cases, the generated recirculation is insufficient to offset the augmented resistance resulting from the expanded high-altitude zones. Consequently, the overall resistance exceeds that observed under positive skewness.
Integrated-averaged values of the streamwise friction coefficient
 $({\widehat {C}}_{\textit{fx}})$
on the rough surfaces.

(a) Distribution of pressure coefficients for the nine rough surfaces. (b,c) The negative and positive
 ${C}_{px}$
components of cases of negative skewness and positive skewness are examined, with the higher area highlighted by green isolines.

The pressure resistance is intricately linked to the friction resistance. Figure 4(a) presents the distribution of the pressure coefficients for each rough surface. Positive values typically correspond to the windward face, whereas negative values denote the leeward side. The isosurfaces of figure 4(a) fit well with the height distributions of figure 1. It is worth noting that in the
 $E{{S}_{z}}/E{{S}_{x}}=2.40$
group, the structure, significantly influenced by large
 $E{{S}_{z}}/E{{S}_{x}}$
values, lacks a consistent spanwise wavelength; the grooves oriented along the streamwise direction do not extend across the entire rough surface. For cases of negative skewness and positive skewness, figures 4(b) and 4(c) elucidate their distinctive characteristics
 $\colon$
the negative pressure coefficients are concentrated downstream of the rough peaks under positive skewness and upstream of the pits under negative skewness, while the positive pressure coefficients exhibit the opposite pattern. This indicates the formation of local recirculation zones within each pit. The correlation coefficients for the
 ${C}_{px}$
distribution of cases of negative skewness and positive skewness under identical
 $E{{S}_{z}}/E{{S}_{x}}$
are computed, as defined hereafter
 $\colon$
 \begin{equation} {{\sigma }^{*}}_{A,B}=\frac {\textrm{cov}\left ( A,B \right )}{{{\sigma }_{A}}{{\sigma }_{B}}}, \end{equation}
where
 $\textrm{cov} ( \boldsymbol{\cdot },\boldsymbol{\cdot })$
represents the covariance,
 $A$
and
 $B$
are two variables,
 $\sigma_{A}$
and
 $\sigma_{B}$
denotes the standard deviations. The computed results for the three negative and positive skewness cases are all
 $-1$
, which signifies that the statistical distributions of
 ${C}_{px}$
induced by the rough surfaces with positive/negative skewness, obtained by inverting the y-coordinates, exhibit a perfectly antisymmetric pattern. Even in a state of statistical equilibrium, such a high degree of correlation is remarkable.
An essential resistance characteristic of roughness element arrays and rough surfaces in fluid flow is the sheltering effect. This effect refers to the creation of a shielded zone by upstream roughness elements. The diminished momentum within this wake zone leads to a reduction in surface friction resistance. The interstice between these shielded zones constitutes the exposed region, where local resistance maxima arise. Predicting the sheltering angle allows for a direct estimation of the relative magnitude of frictional resistance based on the geometric attributes of the rough surface. Yang et al. (Reference Yang2016) investigated the sheltering effect of cuboid arrays and introduced a formula to calculate the sheltering angle, as shown in (3.4), factoring in the relative magnitude of mean velocity at the height of the roughness top to friction velocity, as well as the wake expansion rate downstream of the roughness elements, as depicted in the upper image of figure 5(a). Its essence lies in assessing the sheltering effect induced by the ‘down-sweeping’ component. Yang et al. (Reference Yang, Stroh, Chung and Forooghi2022) subsequently simplified this formula for quasi-random rough surfaces. They replaced the double-averaged (along the streamwise and spanwise directions) mean velocity (as shown in (3.13) later), the characteristic height of the rough surface and the spanwise integral length scale within the formula, demonstrating its applicability to irregular roughness. However, the formula’s premise is based on cuboid arrays, with the default reference line being the horizontal line extending from the element peak, and it accounts only for the sheltering effect of down-sweeping. In the case of three-dimensional rough surfaces examined in this study, when the local velocity downstream the rough peak exhibits ‘up-ejecting’, the original sheltering angle formula does not adequately capture the sheltering effect, as presented in the lower image of figure 5(a). Consequently, this paper improves the original formula by incorporating a term that accounts for the up-ejecting
 $\colon$
 \begin{equation} {\tan {{\theta }_{1}}={{C}_{\theta }}\frac {{{u}_{\tau }}}{{{\left \langle U \right \rangle }_{m}}},{{C}_{\theta }}=1-\frac {2}{3}\left ( 1-\frac {{{h}_{\textit{eff}}}}{{{L}_{h}}} \right )}, \end{equation}
 \begin{align}{ {\tan {{\theta }_{2}} =\frac {{{\left \langle V \right \rangle }_{m}}}{{{\left \langle U \right \rangle }_{m}}}}, } \end{align}
 \begin{align}{\tan \theta = \left \{\!\! \begin{array}{ll} \tan \theta _{1}, & {V}_{\textit{box}}\lt 0 \\[2pt] \tan \theta _{2}, & {V}_{\textit{box}}\gt 0. \end{array} \right . } \end{align}
(a) The upper image depicts a schematic considering solely the sheltering effect of down-sweeping, whereas the lower image incorporates an additional aspect: up-ejecting.
 $U_h$
denotes the double-averaged streamwise velocity at height
 $h$
. The yellow arrow denotes the direction of the local streamwise velocity. The height distribution on the right aligns with the intercepts of the red dots on the left. The inverted
 $\dagger$
symbolises the maximum of the rough surface’s height distribution, with the yellow zone demarcating the ‘box’ area between consecutive maximum points. (b)The distribution of rough-surface height, streamwise friction coefficient and pressure coefficient along the x-axis is depicted. The spanwise position is fixed at
 $z=1.4$
. The black solid line signifies the height, the blue dash-dot line represents the negative streamwise friction coefficient, and the orange dash-dot-dot line signifies the pressure coefficient. All data are normalised using root-mean-square values for consistent visualisation. The green solid line and the grey dashed line represent the sheltering angles as determined by the new formula and the old formula, respectively. For enhanced clarity, the lowest point of the height curve has been aligned with the baseline of the ordinate.

In equation (3.4),
 ${\theta }_{1}$
represents the sheltering angle proposed by Yang et al. (Reference Yang2016), and
 ${C}_{\theta }$
is a parameter that quantifies the extent of wake expansion based on roughness geometry. This paper utilises the melt-down height as the characteristic height and adopts a truncation of the spanwise integral length scale
 $L_{h}$
at 0.2 according to the work of Yang et al. (Reference Yang, Stroh, Chung and Forooghi2022). Here,
 $u_{\tau }$
denotes the integrated-averaged value of friction velocity across each rough surface, and
 ${\theta }_{2}$
is the new addition that accounts for up-ejecting. The subscript
 $m$
indicates a particular maximum in the height distribution, and
 ${\left \langle U \right \rangle }_{m}$
and
 ${\left \langle V \right \rangle }_{m}$
are the double-averaged streamwise and spanwise velocities, respectively, at the height of this maximum. The two sheltering angles are determined primarily by the ‘box-averaged wall-normal velocity’
 ${V}_{\textit{box}}$
. The box is formed by the local maximum and the subsequent local maximum, as depicted in the lower image of figure 5(a), and the
 ${V}_{\textit{box}}$
represents the average wall-normal velocity within the boxed space. Figure 5(b) illustrates the distribution of height, streamwise friction coefficient and pressure coefficient at
 $z=1.4$
under various cases, comparing the predictive efficacy of the new and old formulas. The findings suggest that the added up-ejecting component indeed enhances the prediction of the subsequent significant resistance peak, as evidenced by the results for c_1_−1.4 and c_2.40_0. Focusing solely on the down-sweeping aspect would lead to numerous unreasonable sheltering angles, potentially even penetrating the rough surface. However, the new formula also falls short in certain predictions, such as the second local maximum at c_0.52_−1.4. Notably, the old formula exhibits a positive slope at the final local maximum of c_1_−1.4, which can be attributed to the negative value of
 ${\left \langle U \right \rangle }_{m}$
at that height, indicating the presence of recirculation. These results underscore the need for refinement in both the up-ejecting component introduced in this paper and the down-sweeping aspect considered in the old formula. Figure 5(b) also reveals that the peak of the streamwise friction coefficient consistently aligns with the rough peak, while the pressure coefficient experiences local peak and valley before and after the rough peak, a phenomenon explained as follows: at a certain stagnation point upstream of the rough peak, the fluid’s kinetic energy is maximally converted into pressure energy, resulting in the maximum relative pressure at that point. From the stagnation point to the rough peak and downstream, the fluid’s kinetic energy progressively recovers, and the relative pressure gradually diminishes. As outlined in (3.1), the friction coefficient arises from the shear deformation rate of the fluid, which persists from the base of the roughness to its peak. The phase shift corresponding to the pressure stagnation point will be explored in the subsequent section. Initially, the predictive capability of the new sheltering angle formula will be further assessed from a two-dimensional perspective.
The height distribution of each rough surface, once normalised by the root-mean-square, is depicted through isolines. The black contours signify the predicted sheltering zones according to the new formula. For an enhanced comparative analysis, the left graph exclusively exhibits the distribution of height and sheltering zones, while the right graph incorporates these, along with the resistance peaks denoted in red.

The distributions of rough-surface heights and the resistance peaks are depicted. The black contours delineate the sheltering region as predicted by the old formula. The remaining legends correspond to those outlined in figure 6.

Figures 6 and 7, respectively, illustrate the sheltering regions and the distribution of rough-surface height along with the resistance peak values as predicted by the new and the old formulas. Theoretically, the sheltering region should closely follow the height peak and be situated in the lee, with the resistance peak displaced from this area. It is observed from the figures that both formulas generally anticipate the correct sheltering region, with the darkened area encircling the peak isolines in the rear half, whereas the front half without sheltering is depicted by white area. Nonetheless, the new formula exhibits superior predictive accuracy compared with the old formula. For instance, in figure 7, numerous resistance peaks for c_1_0 coincide with the sheltering region, whereas in the vicinity of
 $z=2.5$
for c_2.40_−1.4 the sheltering area does not appear in the lee region of the rough peaks. Assessing the correlation between the sheltering area and the resistance peak distribution through the correlation coefficient as delineated in (3.3), the findings are presented in table 3. It is evident that the correlation coefficients for all cases in the new formula are lower than those of the old, indicating a closer proximity to
 $-1$
, which suggests that the new formula predicts a smaller overlap between the sheltering region and the resistance peak, thereby enhancing the accuracy of the predicted sheltering angle.
We shall now explore the phase shift in relation to the pressure stagnation point in greater depth. Figure 8(a) depicts the probability density function (p.d.f.) of the optimal phase shift values for various cases across distinct spanwise positions, as well as the correlation between rough-surface height and the pressure distribution coefficient. The optimal phase shift value corresponds to the specific number of discrete point (along the x-direction or z-direction) that allows the absolute value of the correlation coefficient between rough-surface height and pressure coefficient distribution
 ${\left | {{\sigma }^{*}} \right |}_{hp}$
to achieve its maximum value post-displacement. Notably, the optimal phase shift value under the maximum probability for each case is four. Prior to this optimal phase shift, the correlation between rough-surface height and the pressure distribution coefficient is negligible, whereas following the optimal phase shift, the correlation coefficient increases by at least one order of magnitude. This finding suggests that the relative advancement of the pressure distribution ahead of the rough-surface height is independent of statistical properties such as
 $E{{S}_{z}}/E{{S}_{x}}$
and
 $Sk$
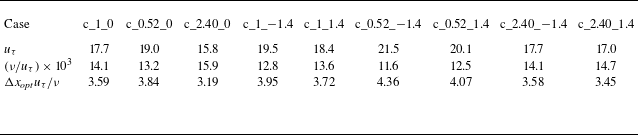
. Figure 8(b) illustrates the outcomes from sections taken along varying streamwise positions. It is evident that no consistent optimal phase shift value is observed across all cases, and the correlation coefficient does not experience a marked increase after the optimal phase shift, indicating that the relative forward movement of the pressure distribution with respect to height is confined to the streamwise direction. This aligns with the physical interpretation of the pressure stagnation point. Table 4 provides the viscous length dimensions and the optimal phase shift distances for each rough surface. Analogous to table 2, for the same
 $E{{S}_{z}}/E{{S}_{x}}$
, the viscous length dimension for the negative skewness is consistently the smallest (corresponding to the highest
 $u_{\tau }$
). It is observed that all cases exhibit approximately the same dimensionless optimal phase shift distance (with each case having an identical grid scale within the rough surface), a phenomenon attributable to the uniform streamwise effective slope of all rough surfaces and the consistent inlet velocity profile. The pressure stagnation points, generated by the fluid’s impact upon the windward aspects of each rough peak, are statistically positioned at analogous locations. This indicates that the relative forward displacement of the pressure peak in relation to the height peak is unaffected by the spanwise effective slope and the skewness.
The correlation coefficients between the sheltering areas (subscript
 $s$
) and the resistance peaks (subscript
 $f$
) predicted by the new and old formulas on the rough surface.

3.2. Instantaneous physics of transition
In the context of flow transition with pressure gradient, the LSB emerges as a predominant feature, as depicted in figure 9(a). Figure 9(b) reveals that the LSB is generally confined to the interval
 $x\in [ 3,8 ]$
in the absence of a rough surface, where the spanwise uniformity of the streamwise velocity at the LSB’s trailing edge starts to deteriorate, akin to the observations of Hosseinverdi & Fasel (Reference Hosseinverdi and Fasel2019). In the absence of free-stream turbulence, the separated shear layer downstream is prone to K-H instability, leading to the breakdown of spanwise rollers and subsequent transition to turbulence. The y-value used for colouring indicates that the ratio of the LSB’s maximum height to the spanwise extent of the computational domain is approximately 16. According to previous studies (Jones, Sandberg & Sandham Reference Jones, Sandberg and Sandham2008; Hosseinverdi, Balzer & Fasel Reference Hosseinverdi, Balzer and Fasel2012), the spanwise range of the computational domain in this paper is sufficiently large to avoid influencing the LSB and its associated modal characteristics. Figure 9(b,c) also illustrates the distribution of the bottom wall’s streamwise friction coefficients under the nine rough surfaces. It is evident that there is no obvious LSB under these cases, implying that the rough surfaces, positioned near the peak velocity, disrupt the formation of the LSB and alter the transition from a separation-induced transition to a bypass one. Furthermore, it is observed that, with the exception of three cases of positive skewness, the other cases all yield countercurrent bottom-wall friction initiating at
 $x=2$
. Notably, the cases with the highest values were c_0.52_−1.4, c_1_−1.4 and c_0.52_0. The two cases of positive skewness, c_0.52_1.4 and c_2.40_1.4, also initiated reverse-flow friction from
 $x=3$
, yet only c_1_1.4 preserved forward-flow friction consistently. These observations suggest that the spanwise or streamwise wave features induced by
 $E{{S}_{z}}/E{{S}_{x}}$
can also generate local recirculation zones akin to those observed downstream of the large-scale depressions. Beyond
 $x\gt 5$
, all nine rough-surface cases exhibit steep increases of forward-flow friction, signalling the onset of transition. After
 $x\gt 8$
, the streamwise friction coefficient for all cases gradually stabilises, marking the conclusion of the transition and the onset of the turbulent phase.
The p.d.f. of optimal phase shift
 $(N_p)$
values is presented for varying (a) spanwise and (b) streamwise positions across the rough surface (depicted by bar charts on the left ordinate and bottom abscissa). The absolute value of the correlation coefficient between rough-surface height and pressure coefficient distribution are illustrated (represented by curves and their corresponding filled areas on the right ordinate and top abscissa), with the black and blue regions signifying the results prior to and subsequent to the optimal phase shift, respectively.

In most cases, the hairpin vortex serves as a distinctive landmark of the transition’s onset. Figure 10 depicts the three-dimensional transient vortex structures, revealing distinct hairpin vortex formations across all cases. Notably, three negative skewness cases exhibit the densest hairpin vortex clusters, whereas those in cases of positive skewness are comparatively less dense. The central spanwise vorticity on the sidewall encapsulates the entire progression from the emergence of the spanwise rollers and hairpin vortices to their eventual dissolution. The vorticity distribution further suggests that there are no appreciable flow disruptions at the forefront and backend of the rough surface, signifying the successful mitigation by the implemented buffer slopes. Given that the spanwise vortex is a crucial component of the hairpin vortex’s head (Acarlar & Smith Reference Acarlar and Smith1987), three cases of negative skewness with great melt-down height yield the densest hairpin vortex clusters. This is evident in the distribution of spanwise vorticities, which are markedly uplifted in the downstream region of the rough surface prior to fragmentation. The increased elevation contributes to a greater velocity gradient within the free shear layer, thereby effectively intensifying the spanwise rollers and hairpin vortices. A comparison between the
 $E{{S}_{z}}/E{{S}_{x}}=0.52$
group and the
 $E{{S}_{z}}/E{{S}_{x}}=2.40$
group in figure 10 indicates that a larger
 $E{{S}_{z}}/E{{S}_{x}}$
value impedes the rise of spanwise rollers and the subsequent flow separation downstream of the rough surface, aligning with the findings of Jelly et al. (Reference Jelly, Ramani, Nugroho, Hutchins and Busse2022). It is noteworthy that in figure 10, c_2.40_0 and c_0.52_1.4 each generate a solitary hairpin vortex in the proximity of
 $z=1.5$
and
 $z=0.25$
, respectively. This occurrence is analogous to the single sequence of hairpin vortices produced by an isolated roughness element, both stemming from a robust streamwise vortex pair that forms downstream of a prominent rough peak as the flow passes around it. By examining the height distribution at the backend of these two rough surfaces, it becomes apparent that there are indeed local rough peaks at these spanwise locations (though the results are not depicted).
The friction velocities, viscous length scales and the optimal phase shift distances
 $(\Delta {{x}_{\textit{opt}}})$
normalised by the viscous length scales are presented for each rough surface.

(a) The
 $u=0$
isosurface, devoid of roughness, is coloured with the y-coordinate. (b,c) The distribution of the bottom-wall streamwise coefficient at
 $z=1.5$
, under both the absence of rough surfaces and the presence of the nine rough-surface cases.

The three-dimensional transient vortex structures for the nine rough-surface cases,
 ${{\lambda }_{2}}=-0.08$
, are visualised with colouring based on streamwise velocity. On the sidewall, the transient spanwise vorticity at
 $z=1.5$
is depicted, with the isosurface values ranging from
 $-8$
to 1. For ease of presentation, this is translated to the position
 $z=0$
.

Cohen et al. (Reference Cohen, Karp and Mehta2014) identified the three components of the hairpin vortex as counter-rotating vortex pairs, wall-normal shear and two-dimensional spanwise vortex sheets. We proceeds to investigate them individually using the methodology of Bucci et al. (Reference Bucci, Cherubini, Loiseau and Robinet2021). In light of the flow characteristics related to transition observed in figure 9(b,c), these primarily manifest in the
 $x\in [ 2,10 ]$
region. For the range of wall-normal heights, the wall-normal truncation employed by Shahinfar et al. (Reference Shahinfar, Fransson, Sattarzadeh and Talamelli2013) in their study of streaks is adopted here
 $\colon$
 \begin{equation} {0\leqslant \eta \leqslant {{\eta }^{*}}}, \end{equation}
where
 \begin{equation} {\eta =\frac {y}{\delta }=\frac {y}{\sqrt {x\nu /{{U}_{\infty }}}},{{\eta }^{*}}=9}. \end{equation}
in which
 $\delta$
denotes the square root of distance from the leading edge of the boundary layer. It can be inferred that the wall-normal truncation range corresponding to the
 $x\in [ 2,10 ]$
region is
 $y\in [ 0.20,0.45 ]$
. Figure 11 captures the average
 $y=0.3$
of this truncation range, which is employed to illustrate the streamwise vorticity distribution, thereby ensuring that the flow characteristics are maximally demonstrated. As evident from figure 11, the streamwise vortex pairs generated by c_0.52_−1.4, c_2.40_−1.4 and c_0.52_0 exhibit the highest overall strength, whereas those generated by c_2.40_0, c_1_1.4 and c_0.52_1.4 demonstrate the weakest. The findings indicate that a small
 $E{{S}_{z}}/E{{S}_{x}}$
value and negative skewness exert an excitatory effect on streamwise vortices, whereas the spanwise modulation of a rough surface with a large
 $E{{S}_{z}}/E{{S}_{x}}$
value can significantly impede the growth of such vortices, consequently hindering the formation of hairpin vortices.
The transient streamwise vorticity isosurface for each case is denoted at
 $y=0.3$
. Additionally, a top-down view of the rough surface has been incorporated to enhance visual clarity.

The distribution of transient streamwise velocity (blue solid line) and spanwise vorticity (green dash-dot line) at various longitudinal positions is presented. Each pair of curves horizontally represents the corresponding distribution values, with the data being averaged across the spanwise direction. The inflection points in the streamwise velocity distribution are denoted by open circles, whereas the extremities of the spanwise vorticity are indicated by open triangles. These points are identified based on the zero-crossings of the second derivative for inflection points and the first derivative for extremities.

The subsequent analysis explores the characteristics of wall-normal shear and two-dimensional spanwise vortex sheets. Figure 12 depicts the distribution of streamwise velocity and spanwise vorticity along five longitudinal locations. Under the negative skewness cases, the streamwise velocity at
 $x=2$
is significantly higher than that observed in other cases. This aligns with the augmented spanwise vorticity distribution presented in figure 10, which can be attributed to the increased melt-down height associated with negative skewness. At
 $x=3$
, c_1_−1.4, c_2.40_−1.4 and c_2.40_1.4 commence the manifestation of multiple velocity inflection points and vorticity extremities, whereas the velocity distributions for the remaining cases preserve a solitary inflection point. This suggests that negative skewness and large
 $E{{S}_{z}}/E{{S}_{x}}$
values can foster the formation of two-dimensional spanwise vortex sheets. Beyond
 $x\gt 3$
, there is a significant rise in the number of velocity inflection points across all cases, and the spanwise vorticity distribution becomes increasingly distorted, coinciding with the widespread appearance of hairpin vortices as depicted in figure 10. At the
 $x=4,5$
positions within the hairpin vortex cluster, c_1_−1.4 and c_2.40_−1.4 exhibit the most pronounced distortion in spanwise vorticity distribution and the highest inflection point, while c_0.52_0 presents the lowest velocity inflection point and the least degree of distortion in the spanwise vorticity distribution. Hence, it is deduced that the streamwise modulation of a small
 $E{{S}_{z}}/E{{S}_{x}}$
value can curtail the deformation of wall-normal shear and the two-dimensional spanwise vortex sheet, whereas larger
 $E{{S}_{z}}/E{{S}_{x}}$
values and negative skewness exert opposite effects. In essence, the influence of
 $E{{S}_{z}}/E{{S}_{x}}$
on the streamwise vortex pair counters the effects on the wall-normal shear and the two-dimensional spanwise vortex sheet. Negative skewness uniquely stimulates all three components of the hairpin vortices, thereby accounting for the densest clusters of hairpin vortices observed in the three negative skewness cases depicted in figure 10.
3.3. First and second moments
To delve further into the impact of varying
 ${E{{S}_{z}}}/{E{{S}_{x}}}$
and
 $Sk$
on the flow characteristics within the peak velocity region and its downstream vicinity, an analysis of the first and second moments of the flow is conducted. Initially, the secondary flow dynamics over the rough surface are investigated, with the imaginary part of the complex conjugate eigenvalues of the two-dimensional time-averaged velocity gradient tensor (Jelly et al. Reference Jelly, Ramani, Nugroho, Hutchins and Busse2022). The pertinent formulas are as follows
 $\colon$
 \begin{align}{ \qquad\qquad\qquad\qquad\,\,\,\,{\overline {{{{\varLambda } }_{ci}}} ={{\lambda }_{ci}}{{{\varOmega } }_{x}}/\left | {{{\varOmega } }_{x}} \right |},\\[-12pt]\nonumber } \end{align}
 \begin{align}{\qquad\qquad\qquad\qquad{\boldsymbol{\nabla }{\boldsymbol{u}_{2{\textrm{D}}}} =\left [ \begin{matrix} \dfrac {\partial V}{\partial y} & \dfrac {\partial V}{\partial z} \\[12pt] \dfrac {\partial W}{\partial y} & \dfrac {\partial W}{\partial z} \\ \end{matrix} \right ] },\\[-12pt]\nonumber} \end{align}
 \begin{align}{{{{\lambda }^{2}}+p\lambda +q=0,\text{ }{{\lambda }_{1,2}} =\frac {-p\pm i\sqrt {4q-{{p}^{2}}}}{2},\text{ }{{\lambda }_{ci}}=\frac {\sqrt {4q-{{p}^{2}}}}{2}}, } \end{align}
where
 \begin{equation} {p=-\left ( \frac {\partial V}{\partial y}+\frac {\partial W}{\partial z} \right ),\text{ }q=\frac {\partial V}{\partial y}\frac {\partial W}{\partial z}-\frac {\partial V}{\partial z}\frac {\partial W}{\partial y}}, \end{equation}
where
 $V$
is time-averaged wall-normal velocity,
 $W$
is time-averaged spanwise velocity,
 $\lambda$
is the variable of eigenvalue equation,
 $\overline {{{\varLambda }_{ci}}}$
represents the signed swirling strength,
 ${\lambda }_{ci}$
denotes the imaginary part of the eigenvalue, and
 ${\varOmega }_{x}$
signifies the time-averaged streamwise vorticity. Equation (3.11) represents the eigenvalue equation associated with the two-dimensional time-averaged velocity gradient tensor and its complex conjugate eigenvalue solution. The coefficient
 ${{{\varOmega } }_{x}}/\left | {{{\varOmega } }_{x}} \right |$
is introduced to ensure that the depicted secondary flow aligns with the local time-averaged streamwise vorticity. The findings are presented in figure 13. When comparing the cases with identical skewness, it becomes evident that a decrease in
 ${E{{S}_{z}}}/{E{{S}_{x}}}$
leads progressively to a progressive rarefaction of the secondary flow pattern. This is because the streamwise wavelength structure becomes more pronounced as
 ${E{{S}_{z}}}/{E{{S}_{x}}}$
diminishes, thereby restraining the evolution of the secondary flow pattern along the streamwise direction, in agreement with the observations of Jelly et al. (Reference Jelly, Ramani, Nugroho, Hutchins and Busse2022). When contrasting cases with the same
 $E{{S}_{z}}/E{{S}_{x}}$
, positive skewness is observed to enhance the continuity of the secondary flow pattern. This can be explained by the local recirculation within the pits, which hinders the cohesive development of the quasi-streamwise vortices downstream. The results for c_0.52_1.4 further illustrate that, despite the impediment posed by the streamwise wave topography with low
 $E{{S}_{z}}/E{{S}_{x}}$
modulation, positive skewness can still yield a secondary flow pattern with considerable continuity, suggesting that the governing factor in this regard is the skewness.
The secondary flow in the vicinity above each rough surface is visualised through the isosurface of the signed swirl intensity,
 $\overline {{{{\varLambda } }_{ci}}}=\pm 0.2$
, with yellow indicative of negative values and blue signifying positive values.

For three-dimensional rough surfaces, a pivotal first moment of interest is the dispersive quantity, which is derived from the spatial averaging of the time-averaged quantity, as follows (Jelly et al. Reference Jelly, Ramani, Nugroho, Hutchins and Busse2022)
 $\colon$
 \begin{align}{ {\left \langle {{U}_{i}} \right \rangle \left ( y \right ) =\frac {1}{{{A}_{f}}\left ( y \right )}\int _{{{A}_{f}}\left ( y \right )}{{{U}_{i}}\left ( y \right ){\textrm d}x{\textrm d}z}}, } \end{align}
 \begin{align}{{\widetilde {{{U}_{i}}} ={{U}_{i}}-\left \langle {{U}_{i}} \right \rangle }, } \end{align}
where
 $U_i$
denotes the time-averaged streamwise velocity,
 $\left \langle \boldsymbol{\cdot }\right \rangle$
denotes the fluid-only integral average at a specific height,
 ${{A}_{f}} ( y )$
signifies the area occupied by the fluid at that height, and
 $\widetilde {{{U}_{i}}}$
represents the dispersive velocity. In this study,
 ${{A}_{f}} ( y )$
specifically refers to the fluid area within the range of rough-surface projection. Figure 14 illustrates the distribution of streamwise dispersive velocity across the central cross-section of the rough surface. From the observation of the cases with the same skewness, it is evident that, in alignment with the influence of the aforementioned secondary flow patterns, a decrease in
 ${E{{S}_{z}}}/{E{{S}_{x}}}$
leads to a sparser streamwise dispersive velocity. Nevertheless, the upper height limit of the streamwise dispersive velocity distribution remains essentially constant, approximately at
 $0.2H$
, and is unaffected by variations in
 ${E{{S}_{z}}}/{E{{S}_{x}}}$
and skewness, a departure from the findings of previous studies (Chan et al. Reference Chan, Macdonald, Chung, Hutchins and Ooi2018; Jelly et al. Reference Jelly, Ramani, Nugroho, Hutchins and Busse2022). It is crucial to note that the rough surface near the peak velocity has not experienced transition; transition begins only downstream of the rough surface, as evidenced by the results in §3.2. However, prior research monitored the dispersive velocity in full turbulence, where the degree of momentum diffusion to the outer layer of the boundary layer differs. When comparing cases with positive and negative skewness, it is apparent that positive skewness enhances the prevalence of positive streamwise dispersive velocities, countering the negative dispersive velocities (arising from local recirculation) induced by negative skewness. Skewness predominantly governs the homogeneity of the streamwise dispersive velocities.
The contour of streamwise dispersive velocity
 $\widetilde {U}$
on the central cross-section in the range of the rough surface,
 $x=1$
.

Since (3.14) defines the dispersive velocity, the dispersive stress can be further defined as
 \begin{equation} {{\boldsymbol{D}_{ij}}=\left \langle \left ( {{U}_{i}}-\left \langle {{U}_{i}} \right \rangle \right )\left ( {{U}_{\!j}}-\left \langle {{U}_{\!j}} \right \rangle \right ) \right \rangle =\left \langle \widetilde {{{U}_{i}}}\widetilde {{{U}_{\!j}}} \right \rangle }. \end{equation}
Figure 15 presents three types of dispersive normal stresses. It is evident that the magnitude of the streamwise dispersive normal stress exceeds that of the spanwise and wall-normal stresses, due primarily to the streamwise pressure gradient. In
 ${D}_{11}$
, c_1_1.4 demonstrated the highest degree of spatial heterogeneity, with c_2.40_1.4 and c_0.52_1.4 following suit. The streamwise velocity spatial uniformity in the remaining cases was approximately equivalent. This suggests that positive skewness is the predominant influence on the streamwise dispersive normal stress. For the distribution of
 ${D}_{22}$
, the peak values are observed in the three cases with negative skewness, signifying that extensive depressions markedly enhance the spatial heterogeneity of the wall-normal velocity. The c_1_0 exhibits the lowest values for both the streamwise and wall-normal dispersive normal stress peaks. For
 ${D}_{33}$
, the maximum peaks are found in the three cases characterised by positive skewness, whereas the three cases with negative skewness exhibit the lowest peaks. This suggests that, in relation to the spanwise spatial heterogeneity perpendicular to the driving pressure gradient, the numerous elevated regions induced by negative skewness can markedly diminish the spanwise spatial non-uniformity.
The dispersive stress across each rough surface is distributed along the wall-normal direction, with the stress being non-dimensionalised by
 $u_{\tau }^{2}$
and the y-coordinate by
 $\nu /{{u}_{\tau }}$
.

Subsequently, we direct our focus to the transition region located downstream of the rough surface. The most frequently employed second moments for studying transition are the Reynolds stress and the fluctuating kinetic energy (FKE) equations
 $\colon$
 \begin{equation} {\frac {\partial k}{\partial t}+{{U}_{\!j}}\frac {\partial k}{\partial {{x}_{\!j}}}=\underbrace {-\overline {{{u}_{i}^{\prime }}{{u}_{\!j}^{\prime }}}\frac {\partial {{U}_{i}}}{\partial {{x}_{\!j}}}}_{{{P}_{k}}}-\frac {1}{2}\frac {\partial \overline {{{u}_{i}^{\prime }}{{u}_{i}^{\prime }}{{u}_{\!j}^{\prime }}}}{\partial {{x}_{\!j}}}-\frac {1}{\rho }\frac {\partial \overline {{p}^{\prime }{{u}_{\!j}^{\prime }}}}{\partial {{x}_{\!j}}}+\nu \frac {{{\partial }^{2}}k}{\partial {{x}_{\!j}}\partial {{x}_{\!j}}}\underbrace {-\nu \overline {\frac {\partial {{u}_{i}^{\prime }}}{\partial {{x}_{\!j}}}\frac {\partial {{u}_{i}^{\prime }}}{\partial {{x}_{\!j}}}}}_{{{\varepsilon }_{k}}}}, \end{equation}
where
 $p^{\prime}$
is the fluctuating pressure,
 ${u}_{i}^{\prime }$
denotes the fluctuating velocity,
 $k=\overline {{{u}_{i}^{\prime }}{{u}_{i}^{\prime }}}/2$
represents the FKE, while
 ${P}_{k}$
and
 ${\varepsilon }_{k}$
correspond to the production and dissipation terms, respectively. The former encapsulates the interaction between the time-averaged strain rate and the Reynolds stress, whereas the latter signifies the dissipation of FKE due to viscous action. As observed in §3.2, flow characteristics pertinent to transition emerge predominantly within the
 $x\in [ 2,10 ]$
region. To ascertain the local spatial position that encapsulates the characteristics most effectively, the power spectrum (PS) of the flow intensity, obtained via Fourier transform, is employed as depicted in figure 16. The flow intensity is defined as follows
 $\colon$
 \begin{equation} {Fi=\sqrt {\frac {1}{3}\frac {{{u}^{2}}+{{v}^{2}}+{{w}^{2}}}{U_{\infty }^{2}}}}. \end{equation}
where
 $w$
denotes the spanwise velocity. Evidently, the predominant frequencies across all cases fall within the spectrum of
 $\omega \in [ 1,10 ]$
. As illustrated later in figures 22 and 23, these frequencies are predominantly clustered within the range of
 $\omega =2{\sim}7$
. This finding contrasts markedly with the results reported by Bucci et al. (Reference Bucci, Cherubini, Loiseau and Robinet2021), where the dominant frequencies for the isolated cylinder they examined were grouped primarily within the range of
 $\omega =0.4{\sim}2$
(
 ${\textit{Re}}=700,1000$
). The characteristic frequencies of the rough surfaces in this study, under linear dynamic approximation, are nearly an order of magnitude greater than those of the isolated cylinder. The predominant frequency and amplitude are observed at the two positions
 $x=4,6$
across almost all cases, and subsequent investigation into transition characteristics concentrates on these two streamwise locations. It is further noticed that at
 $x=2$
, only the PS of c_2.40_0 exhibits notable amplitudes, which correspond to the solitary hairpin vortex that emerges at
 $z=1.5$
, as depicted in figure 10. In the downstream region of
 $x=8,10$
, the dominant amplitude of the PS diminishes substantially, with several dominant frequencies no longer present. This can be attributed to the fact that turbulence resulting from bypass transition lacks characteristic frequencies in the absence of free-stream turbulence at the inlet and without specific elements such as jets or vibrating walls within the computational domain.
The three-dimensional PS distribution of the flow intensity for five spatial points within the domain has been computed, with data extracted from the statistical equilibrium. Here,
 $x\in [ 2,10 ]$
,
 $z=1.5$
. The y-coordinates correspond to half the wall-normal height as truncated by (3.7) and (3.8), while
 $\omega$
denotes the circular frequency.

The isosurface of the FKE production term and the isoline of the dissipation term at (a)
 $x=4$
and (b)
 $x=6$
of each case.

The distribution of the FKE production and dissipation terms at the two positions
 $x=4,6$
is depicted in figure 17. As indicated by the figure’s legends, the absolute values of these terms at
 $x=4$
are substantially greater than those at
 $x=6$
, owing to the fact that the early transition stage predominantly involves the transformation of time-averaged kinetic energy into FKE. When the time-averaged energy conversion occurs via the production term opposite in sign to
 ${P}_{k}$
in the time-averaged kinetic energy budget equation, the subsequent dissipation of FKE through viscous action also intensifies. In figure 17(a), c_0.52_−1.4 stands out exhibiting significantly higher production and dissipation terms than the other cases. Drawing upon the transient physical analysis in §3.2, it is indicative that the conjunction of smaller
 $E{{S}_{z}}/E{{S}_{x}}$
values and negative skewness can optimise the production of FKE within the immediate downstream. The observed phenomenon is clearly associated with K-H instability. Non-negligible dissipation terms are present near the bottom wall of cases of negative skewness, signifying that the viscous instability prompted by the lift-up mechanism contributes significantly. Comparing the cases with identical skewness, it is evident that the spanwise modulation of higher
 $E{{S}_{z}}/E{{S}_{x}}$
values leads to a reduction in the spanwise wavelength of both the production and dissipation terms, echoing the influence on the secondary flow pattern in figure 13. At
 $x=6$
, the dissipation terms of all cases trend towards the bottom wall, a phenomenon explainable by the definitions in (3.16)
 $\colon$
the fluctuating velocity distributed in the domain during the later stages of transition increases markedly, and the fluctuating velocity gradient near the bottom wall becomes predominant. Compared with
 $x=4$
, the production term for each case is more diffused, with a reduced spanwise wavelength, a consequence of the decreased energy input from the time-averaged kinetic energy and the enhanced diffusion term due to the increasing fluctuating velocity itself. Figure 18 depicts the distributions of Reynolds stresses
 $\overline {{u}^{\prime }{u}^{\prime }}$
and
 $\overline {{v}^{\prime }{w}^{\prime }}$
for the two longitudinal directions, which, when contrasted with figure 17 , exhibit a similar pattern to the production terms, particularly at
 $x=6$
. This suggests that the previous explanation regarding the concentration of dissipation terms at the bottom wall is accurate.
Reynolds normal stress
 $\overline {{u}^{\prime }{u}^{\prime }}$
contour and Reynolds shear stress
 $\overline {{v}^{\prime }{w}^{\prime }}$
isoline at (a)
 $x=4$
and (b)
 $x=6$
of each case.

3.4. Coherent structures of transition
Coherent structures are distinctive features of transitional flows, characterised by the cyclic amalgamation of streamwise vorticity and streaks derived from the lift-up mechanism (Bae, Lozano-Durán & Mckeon Reference Bae, Lozano-Durán and Mckeon2021). Investigating the spatial wavelengths and temporal frequencies of these coherent structures can deepen our understanding of varied impacts of
 ${E{{S}_{z}}}/{E{{S}_{x}}}$
and
 $Sk$
on transition onset. Returning to the two cross-sections, the premultiplied power spectra of the three types of fluctuations for each case are presented in figure 19. As with the findings in figures 17 and 18, c_0.52_−1.4 continues to exhibit the highest values at
 $x=4$
. A comparison of the wavenumbers in the peak region for the two longitudinal locations reveals that the characteristic wavenumber at
 $x=4$
is approximately 20–40, diminishing to 10–20 at
 $x=6$
. Furthermore, the intensity of PS across various cases exhibits a trend towards uniformity. This aligns with the changes observed in the production term distribution of figure 17, resulting primarily from the reduction in time-averaged input energy and the increased influence of the diffusion term. It is also evident that the frequency band of the peak region for three cases of negative skewness at
 $x=4$
is significantly broader than that of the other cases, suggesting that large-scale pits facilitate the growth of the spanwise wave of coherent structures.
The premultiplied power spectra of three types of fluctuations are depicted at (a)
 $x=4$
and (b)
 $x=6$
for each case, with the streamwise fluctuation power spectra
 $(\phi_{u^{\prime}u^{\prime}})$
represented by isosurfaces, and the wall-normal fluctuation power spectra
 $(\phi_{v^{\prime}v^{\prime}})$
and spanwise fluctuation power spectra
 $(\phi_{w^{\prime}w^{\prime}})$
by red and green isolines, respectively.
 $k_{z}$
represents the spanwise wavenumber. Bidirectional arrows denote the bandwidth of each peak region.

The autocorrelations of the three fluctuating velocities at positions (a)
 $x=4$
and (b)
 $x=6$
are exhibited.
 $R_{u^{\prime}u^{\prime}}$
,
 $R_{v^{\prime}v^{\prime}}$
, and
 $R_{w^{\prime}w^{\prime}}$
denote the autocorrelations of the streamwise, wall-normal, and spanwise fluctuating velocities, respectively.
 $t$
represents the time. Data are extracted from the statistical equilibrium, with the y-coordinates representing half the truncated wall-normal height as shown in (3.7) and (3.8), and with the x-coordinates in the range of
 $x\in [ 2,10 ]$
and the z-coordinates of
 $z=1.5$
. The Fourier transform is utilised to derive the spectral distribution of each curve, and the circular frequencies associated with the peak spectral magnitudes are represented by the top abscissa of this figure. Here,
 $\omega$
corresponds to the circular frequency.

Let’s focus on the time integral scale of coherent structures. Figure 20 presents the autocorrelation curves of the fluctuating velocity over time for the two cross-sections. Regarding the integral scale from the first instance of decay to zero, the three cases with negative skewness each exhibited the smallest integral scale for the three fluctuating velocities at
 $x=4$
, in alignment with the densest vortex clustering observed in figure 10 for the negative skewness cases. It is also obvious that the three cases with positive skewness generally presented larger integral scales for the three fluctuating velocities. Utilising a threshold value of 0.2 to calculate the integral scale (Yang et al. Reference Yang, Stroh, Chung and Forooghi2022), as depicted in figure 21, essentially confirms the aforementioned findings, save for the c_1_1.4, which displays a smaller integral scale for the three fluctuating velocities at
 $x=4$
. This suggests a significant reduction in the temporal integral scale of coherent structures for the negative skewness cases, while in the positive skewness ones, the temporal integral scale of coherent structures within the transitional region is prolonged to the greatest extent. For the
 $x=6$
cross-section, the previous conclusions no longer hold, and the influence of the statistical properties of the rough surface on the integration scale is no longer predominant. The frequencies corresponding to the maximum spectrum values of each curve are also provided in figure 20, serving as an approximation of the frequency characteristics of the three fluctuating velocities at the respective spatial points. It is evident that the three fluctuation frequencies for cases of negative skewness at
 $x=4$
are basically the highest. This echoes the extensive distribution of production and dissipation terms in the negative skewness cases depicted in figures 17 and 18, which is intricately linked to inviscid instability (Hosseinverdi & Fasel Reference Hosseinverdi and Fasel2019).
The time integral scale (
 $L_R$
) of each curve in figure 20 is calculated with the threshold of 0.2 reduced for the first time: (a)
 $x=4$
, (b)
 $x=6$
.

The distribution of wall-normal heights corresponding to the peak PS of the streamwise fluctuating velocity across a total of 50 cross-sections within the range of
 $x\in [ 2,10 ]$
is examined. The hollow triangular curve plotted against the right ordinate denotes the respective PS values, while the colour of the filled circles signifies the spanwise wavenumber associated with each maximum value.

The evolution of spanwise wavelength and the predominant wall-normal height along the streamwise direction of coherent structures is depicted in figure 22. Notably, c_2.40_0 exhibits a high spanwise wavenumber of approximately 14 within the interval
 $x\in [ 4,6 ]$
, where the PS attains its peak value. The corresponding wavelength constitutes roughly 15% of the spanwise extent of the computational domain. The spanwise wavenumbers for c_0.52_-1.4 and c_0.52_1.4 are comparatively lower, while the remaining cases feature spanwise wavenumbers tending towards zero in the vicinity of the peak PS, suggesting that the coherent structures do not possess a defined spanwise wavelength. This finding indicates that significant spanwise modulation by large
 $E{{S}_{z}}/E{{S}_{x}}$
values can directly yield coherent structures with high spanwise wavenumbers, whereas extensive depressions or rough peaks can impede this process. The wall-normal height curve reveals that the high spanwise wavenumbers of c_2.40_0 are concentrated in the range of
 $y\in [ 0.1,0.2 ]$
, signifying that the corresponding coherent structures are consistently positioned at the core of the FKE production, dissipation and Reynolds stress peak regions, as illustrated in figures 17 and 18.
3.5. Characteristic modal analysis
The preceding analysis of transition has centred primarily on local flow structures or individual fluctuating velocity fields, whereas the characteristic modes derived from the complete three-dimensional velocity field can offer novel perspectives on the influence of
 ${E{{S}_{z}}}/{E{{S}_{x}}}$
and
 $Sk$
on transition phenomena. This paper employs DMD to investigate these eigenmodes. The algorithmic approach, detailed in the work of Schmid (Reference Schmid2010), constitutes a widely adopted numerical framework for Koopman analysis and is capable of approximating the dynamics of nonlinear systems with linear dynamics (Loiseau Reference Loiseau2014). The standard parameters utilised in DMD analysis include modal amplitude and modal growth rate, which indicate the mode’s contribution to a chosen snapshot and its linear stability, respectively. Without loss of generality, the first snapshot is selected to define the modal amplitude (Taira et al. Reference Taira, Hemati, Brunton, Sun, Duraisamy, Bagheri, Dawson and Yeh2020), with the specific formulas as follows:
 \begin{align}{ {b_{i}^{0} =\boldsymbol{\psi } _{i}^{-1}{\boldsymbol{X}_{0}}}, } \end{align}
 \begin{align}{ {{{\lambda }_{i}} ={{e}^{{{\mu }_{i}}\Delta t}}, \text{ }{{g}_{i}}={\textit{Re}}\left ( {{\mu }_{i}} \right )=\frac {\ln \left | {{\lambda }_{i}} \right |}{\Delta t}}, } \end{align}
where
 ${b}_{i}$
denotes the amplitude of the ith mode, while
 $\boldsymbol{\psi }_{i}$
corresponds to the ith mode. The superscript
 $-1$
signifies the inverse matrix;
 $\boldsymbol{X}_{0}$
refers to the initial snapshot of the input data, and
 ${\lambda }_{i}$
represents the Ritz eigenvalue associated with the ith mode (Hosseinverdi & Fasel Reference Hosseinverdi and Fasel2019), which is the eigenvalue of the linear coefficient matrix within a linear system;
 ${\mu }_{i}$
constitutes the exponential component of
 ${\lambda }_{i}$
,
 ${g}_{i}$
is the modal growth rate, and
 $\textit{Re} ( \boldsymbol{\cdot })$
indicates the complex real part;
 $\Delta t$
is the temporal increment between snapshots. In this paper, the temporal increment
 $\Delta t=3\times {{10}^{-2}}$
corresponds to capturing a snapshot every 100 computational steps. In relation to the minimum time integral scale
 ${{L}_{R,min }}\approx 0.08$
depicted in figure 21, then
 ${{L}_{R,min }}\approx 2.7\Delta t$
. Figure 23 illustrates the convergence of DMD results with respect to
 $\Delta t$
, with the total duration of the time series set at three. Eigenvalue spectra were computed for five distinct snapshot sampling intervals. It is evident that all eigenvalues tend towards a common fitted curve, signifying that the chosen
 ${{N}_{\Delta t}}=100$
for this study ensures sufficient convergence of the DMD outcomes. It is important to note that due to varying sampling intervals, the number of snapshots employed to derive the approximate linear dynamics from the same time series differs, resulting in the eigenvalue spectra’s inability to fully coincide. Nonetheless, they are expected to converge towards a consistent solution.
At (a)
 $x=4$
and (b)
 $x=6$
, the DMD eigenvalue spectra for the c_1_0 are presented across varying snapshot time steps (only the third quadrant of the complex plane depicted).
 $\mu_{i,i}$
is the imaginary part of the eigenvalue exponential component, and
 ${\mu}_{i.r}$
is the corresponding real part. The time series length is fixed at 3. Here,
 ${N}_{\Delta t}$
denotes the ratio of the snapshot time step to the computational time step. The solid line signifies the spline-fitted curve.

Figures 24 and 25 present the DMD results for two cross-sections at
 $x=4,6$
, compared with the PS values from figure 16. Initially, the modal growth rates are examined. The unstable modes of c_2.40_−1.4 and c_2.40_0 are particularly pronounced, occurring predominantly within the range of
 $\omega \in [2,7]$
. In contrast, c_1_0 and c_0.52_1.4 do not exhibit substantial modal growth rates exceeding zero. This suggests that the coherent structure’s spanwise wave fostered by large
 $E{{S}_{z}}/E{{S}_{x}}$
exhibits a pronouncedly unstable tendency. Nevertheless, the streamwise modulation induced by small
 $E{{S}_{z}}/E{{S}_{x}}$
and the rough peaks can effectively curtail this instability. Moreover, the large modal amplitudes and large growth rates across various cases fall predominantly within the same frequency domain. The colour bars in the figure indicate the PS values, which reflect the intensity of the nonlinear coherent structure. In figures 24 and 25, the frequencies with substantial modal amplitude and high PS values are highlighted,
 $\omega =2,4.5\,{\textrm{and}}\,7$
. At these three characteristic frequencies, the linear modes may exhibit a quasi-orthogonality with respect to other DMD modes and can independently approximate the nonlinear dynamic evolution (Bucci Reference Bucci2017).
The distribution of DMD modal amplitude and growth rate of flow intensity along the frequency axis is depicted, with solid squares denoting the modal amplitude and hollow circles the modal growth rate. The left ordinate represents the modal amplitude
 $(b^0)$
, and the right ordinate represents the modal growth rate
 $(g)$
. The colour bar illustrates the PS values of the flow intensity at each frequency, while the vertical dashed line indicates the three frequencies of particular interest. Here,
 $x=4$
, and
 $\omega$
corresponds to the circular frequency.

The distribution of DMD modal amplitude and growth rate of flow intensity along the frequency axis at
 $x=6$
is depicted, with the legends equal to that in figure 24.

To delve further into the aforementioned issues, the real components of the corresponding Fourier series coefficients (termed shape functions) are extracted from the three distinctive frequencies indicated in figures 24 and 25, and are then compared with the real parts of the DMD modes at the same frequencies. The findings are presented in figures 26 and 27. According to the legends, it is observed that the characteristic modes corresponding to the three frequencies exhibit a sequential decrease in overall values. The distribution of DMD modes and shape functions across all cases exhibits a degree of similarity. Figure 28 reveals the specific correlation coefficients. Clearly, the correlation coefficients for some cases exceed 0.5, signifying that the corresponding DMD modes exhibit a degree of quasi-orthogonality.
The real component of the DMD mode of flow intensity at
 $x=4$
across various frequencies is compared with the real part of the Fourier series coefficients
 $(\textit{Fi}_\textit{fft})$
. The isoline denotes the real component of the DMD mode, while the isosurface signifies the real part of the Fourier series coefficients. The sequence of cases from top to bottom at each frequency corresponds to the arrangement specified in table 1.

The real component of the DMD mode of flow intensity at
 $x=6$
across various frequencies is compared with the real part of the Fourier series coefficients, with the legends equal to that in figure 26.

At (a)
 $x=4$
and (b)
 $x=6$
, the correlation coefficients
 $(\sigma^*)$
between the real components of DMD modes and the real parts of Fourier series coefficients across distinct frequencies are presented. The sequence of cases from left to right at each frequency corresponds to the arrangement specified in table 1. Within the figure, the three negative skewness cases are denoted by
 $\dagger$
.

Initially, a comparison of the nine rough-surface cases at each characteristic frequency reveals that the DMD flow intensity for three cases of negative skewness under frequencies
 $\omega =4.5$
and
 $\omega =7$
at
 $x=4$
is substantially higher than that of the other cases. However, no such pronounced discrepancy is observed under
 $\omega =2$
. In conjunction with figure 24, this is intricately linked to the PS values of the flow intensity. This finding suggests that during the initial phase of transition, negative skewness is capable of generating linear modes of equivalent intensity to the nonlinear coherent structures at middle and high frequencies. At
 $x=6$
, the DMD flow intensities for the three characteristic frequencies under negative skewness cases are comparable to those under other cases. In light of the generally higher correlation coefficients at middle and high frequencies for the negative skewness cases depicted in figure 28(a), it can be inferred that negative skewness fosters the generation of linear modes with quasi-orthogonality. Furthermore, in the later stages of transition, zero skewness appears to generate linear modes with a strong degree of quasi-orthogonality at low frequencies.
4. Conclusions
In this study, DNS is employed to investigate the transition flow over a flat plate characterised by three-dimensional rough surface and pressure gradient. The rough surfaces, categorised into nine types based on the varying ratios of the spanwise effective slope to the streamwise one and the skewness, are maintained at a constant root-mean-square height. The resolving of rough surface is conducted utilising the EBM. The focus lies in elucidating how variations in rough-surface skewness and effective slope influence drag characteristics, secondary flow patterns, dispersive quantities, transient behaviour in the downstream transition region, energy transfer from time-averaged flow to fluctuating flow, the spatiotemporal scales of coherent structures, and characteristic modes. The following is a detailed discussion.
The rough surfaces investigated herein will disrupt the original LSB. Under identical skewness levels, structures modulated along the spanwise direction by large
 $E{{S}_{z}}/E{{S}_{x}}$
will incur increased streamwise resistance. The overall resistance of the negative skewness rough surface, in relation to the resistance of the positive skewness counterpart, is contingent upon the competition between the recirculation within its large-scale depressions and the higher proportion of elevated regions. This paper modifies the traditional sheltering angle formula, which accounted solely for the down-sweeping, by incorporating the up-ejecting aspect. The final sheltering angle formula is selected through the spatial average of the wall-normal velocity between adjacent maximum points in the height distribution. While the enhanced formula offers greater precision in predicting the sheltering area across the entire rough surface than its predecessor, both the down-sweeping and up-ejecting components in the formula require further refinement. Despite variations in effective slope and skewness, the peak in resistance always aligns with the peak in height. The pressure distribution consistently yields local maxima and minima in the vicinity of the resistance peak, with the relative shift in streamwise direction corresponding to the pressure stagnation point remaining unaffected by the spanwise effective slope and the skewness.
Regarding the flow characteristics in the transitional region, the uplift of the boundary layer induced by negative skewness can markedly augment the velocity gradient within the free shear layer, thereby fostering the evolution of spanwise rollers and hairpin vortices. A higher
 $E{{S}_{z}}/E{{S}_{x}}$
exerts a mitigating influence. For the triad of factors that generate hairpin vortices, the impact of
 $E{{S}_{z}}/E{{S}_{x}}$
on streamwise vortex pairs counters its effects on wall-normal shear and two-dimensional spanwise vortex sheets. Negative skewness uniquely triggers all three simultaneously, culminating in the densest aggregation of hairpin vortices. As
 $E{{S}_{z}}/E{{S}_{x}}$
diminishes, the terrain with an increasingly pronounced streamwise wavelength curtails the development of secondary flow patterns in the streamwise direction. Positive skewness significantly enhances the continuity of these patterns and predominates over the effective slope in influence. The local recirculation within the pits induced by negative skewness hinders the coherent formation of quasi-streamwise vortices downstream. The spatial heterogeneity of the streamwise and spanwise velocities across the rough surface is governed predominantly by positive skewness, whereas large-scale pits associated with negative skewness markedly intensify the spatial inhomogeneity of the wall-normal velocity. The conjunction of low
 $E{{S}_{z}}/E{{S}_{x}}$
and negative skewness can optimise the stimulation of FKE in the immediate downstream region.
For coherent structures, large-scale depressions facilitate the propagation of spanwise waves. The time integral scale of coherent structures induced by negative skewness in the downstream region is reduced, whereas those fostered by positive skewness are augmented; moreover, the fluctuating frequency catalysed by negative skewness is elevated, closely associated with inviscid instability. The spanwise modulation effected by large
 $E{{S}_{z}}/E{{S}_{x}}$
can directly yield coherent structures with high spanwise wavenumbers, whereas large-scale depressions or rough peaks interfere with this process. In the context of approximate linear dynamic characterisation, the spanwise wave development of coherent structures under the influence of significant
 $E{{S}_{z}}/E{{S}_{x}}$
exhibits a pronouncedly unstable tendency, whereas the streamwise modulation due to diminishing
 $E{{S}_{z}}/E{{S}_{x}}$
and pronounced rough peaks can mitigate this instability. During the early phase of transition, negative skewness is capable of generating linear modes of equivalent intensity to the nonlinear coherent structures at medium and high frequencies, and these modes exhibit quasi-orthogonality. In the later stage of transition, zero skewness can give rise to linear modes with a strong degree of quasi-orthogonality at low frequencies.
Funding
The work was financially supported by the National Natural Science Foundation of China (grant no. 52176044).
Declaration of interests
The authors report no conflict of interest.
Appendix A. Validations of grid resolution
In this study, the total number of original z-plane grids is 2943, with 6 points of Gauss–Lobatto interpolation along both the streamwise and wall-normal directions, and 120 spanwise planes in the Fourier expansion. If the polynomial interpolation of the spectral element method is considered as a form of grid densification, the overall number of three-dimensional grids amounts to
 $8.83\times {{10}^{6}}$
. Figure 29(a) presents the mesh configuration for c_1_0 in the vicinity of the rough surface. It is evident that the near-wall densification spans the entire wall-normal extent of the rough surface (for the non-Gaussian distribution scenario, another set of finer meshes within the near-wall region is employed to encompass the rough surface entirely, which is not depicted here). Furthermore, the densification along the streamwise direction encompasses the entire span from the inlet to the rear-transition ramp. These localised densifications are imperative to ensure the comprehensive resolving of the EBM. The mesh resolution was assessed utilising the Kolmogorov length scale
 $\eta ={{ ( {{\nu }^{3}}/\varepsilon )}^{0.25}}$
(
 $\varepsilon$
is the FKE dissipation rate), which characterises the scale of dissipative motion within transitional flows (Hosseinverdi & Fasel Reference Hosseinverdi and Fasel2019). Figure 29(b) presents a comparison between the grid scales
 $\unicode{x1D6E5} =\sqrt [3]{\Delta x\times \Delta y\times \Delta z}$
and
 $\eta$
. It is observed that the maximum value of the contour in the near-wall region occurs in proximity to the rough surface, signifying a local maximum in FKE dissipation in that area. The grid scale of this peak does not exceed
 $4\eta$
and remains consistently at
 $O ( \eta )$
, in alignment with the recommendations of research (Hosseinverdi & Fasel Reference Hosseinverdi and Fasel2019; Mahmoodi-Jezeh & Wang Reference Mahmoodi-jezeh and Wang2020). Furthermore, Moser & Moin (Reference Moser and Moin1987) have noted that most scales of dissipative motion in curved channels exceed
 $15\eta$
. Thus, the grid resolution employed in this study is adequate for precise analysis of the fluctuating structures induced by rough surfaces.
(a) An enlarged perspective of the mesh distribution adjacent to the rough surface under Gaussian distribution is illustrated. (b) The ratio of the grid scale
 $\unicode{x1D6E5} =\sqrt [3]{\Delta x\times \Delta y\times \Delta z}$
to
 $\eta$
for c_1_0 is averaged along the spanwise direction.

Appendix B. Validations of the sufficiency of computational domain spanwise and wall-normal range
The spanwise extent of the computational domain depicted in figure 2(a) exceeds 20% of the total streamwise length, adequately accommodating all predominant modes within the separated shear layer and its downstream region (Wissink & Rodi Reference Wissink and Rodi2004; Lardeau, Leschziner & Zaki Reference Lardeau, Leschziner and Zaki2012). To ascertain that the spanwise dimensions of the computational domain in this study adequately capture the evolution of the flow structure during transition, the autocorrelation coefficients of three fluctuating velocities were computed. The findings are presented in figure 30. These autocorrelation coefficients reflect the spanwise correlation extent of the fluctuating structure; the majority exhibit decay to zero before reaching the computational domain’s spanwise boundary, thereby demonstrating that the spanwise dimension does not constrain the development of the fluctuating structure during transition.
The distribution of autocorrelation terms for the three types of fluctuating velocities of c_1_0 is shown. The reference point is at
 $z=1.5$
. The five spatial positions correspond to those depicted in figure 16, with the arrows in the figure denoting the progression of increasing x-coordinate values.

The time-averaged distribution of spanwise vorticity under the c_1_-1.4 at varying computational domain altitudes
 $y_{\textit{max}}=1.7$
(black solid line),
 $y_{\textit{max}}=2$
(red dashed line), and
 $y_{\textit{max}}=2.3$
(blue dotted line) has been ascertained. The data have been integrated and averaged along both the streamwise and spanwise directions within the
 $x\in [2,10]$
interval.

To illustrate that the Dirichlet condition for the top streamwise velocity employed in this study does not impose non-physical constraints or generate extraneous vorticity within the boundary layer, figure 31 presents a comparative analysis of the spanwise vorticity distributions across an isotropic negative skewness rough surface with varying wall-normal altitudes of the computational domain. It is evident that the spanwise vorticity for all three cases plateaus at a constant value prior to reaching
 $y=1$
. Upon closer examination, it can be observed that
 $y_{\textit{max}}=1.7$
exhibits significant oscillations in the vicinity of
 $y=1$
, whereas
 $y_{\textit{max}}=2$
and
 $y_{\textit{max}}=2.3$
maintain a relatively constant value even at an enlarged view at this height. Consequently, the computational domain height
 $y_{\textit{max}}=2$
chosen for this paper is adequately expansive and does not introduce additional vorticity into the flow, thus not affecting the results.