I. INTRODUCTION
Surface enhanced Raman scattering (SERS) is considered to be a direct and sensitive technique with the ability of identifying trace molecules and has been actively explored in the last few years.Reference Fleischmann, Hendra and McQuillan1,Reference Aroca2 As an ultrasensitive detection technique, the applications of SERS have been demonstrated in physics, chemistry, biology and materials, etc.Reference Gunnarsson, Bjerneld, Xu, Petronis, Kasemo and Kall3–Reference Liu and Lee5 So far, much effort has been put into the fabrication of SERS-active substrates. To develop commercial application of SERS substrates, a SERS substrate should be strong in signal enhancement, reproducible, uniformly rough, easy to fabricate, and stable over time. Namely, the SERS substrate should possess large specific surface area that could adsorb more molecules to contribute to Raman signals, and should have abundant hot spots produced by Au or Ag nanostructures that may enhance the local electromagnetic field as well as the Raman signals.Reference Sun, Liu, Miao, Wang, Tian, Zhang, Li, Fan and Jiang4,Reference Lee, Morrill and Moskovits6,Reference Xu, Aizpurua, Käll and Apell7
Most of the conventional SERS substrates were obtained from pure Au or Ag nanostructures with various morphologies, such as nanoparticles (NPs), nanocubes, and nanorods, which were usually spread onto a planar surface, forming a two-dimensional (2D) array.Reference Shen, Hui, Yang, Xiao, Tian, Bao, Chen, Ding and Gao8–Reference Li, Wu, Wang, Wu, Peng and Pan12 For these SERS substrates, the largest contributions to SERS arise from molecules located in nanogaps among closely coupled metal NPs. Recently, some hybrid nanostructures have been used as the SERS substrates and exhibited some advantages over the pure noble metal nanostrucutres, such as higher SERS activity, lower cost, etc.Reference Sun, Liu, Miao, Wang, Tian, Zhang, Li, Fan and Jiang4,Reference Zhao, Zhang, Ai, Zhang, Cao, Liu, Sun, Wang and Lu13–Reference Kim, Kim and Park15 In these hybrids, many kinds of nanomaterials have been selected as templates, including ZnO nanostructure, SiO2 nanostructure, Al2O3 nanostructure, and carbon nanostructure, then combined with Au or Ag nanoparticles to produce the SERS-active substrates. Compared with the nonconductive templates (e.g., ZnO, SiO2, Al2O3, and so on), the conductive templates (e.g., Au, Ag, Cu, C, and so on) are considered to exhibit more excellent performance for SERS. It has been reported that a noble metal nanoparticle residing above a gold conductive film can almost be as effective a SERS substrate as two closely coupled gold NPs for the fact that the hot spot is formed in the space between the NP and the gold conductive film.Reference Mubeen, Zhang, Kim, Lee, Krämer, Xu and Moskovits16 Similarly, carbon nanostructure may also be a good SERS template candidate not only due to its good conductivity but also its stable ability to withstand acid and alkali, suitable for SERS measurement under severe environment. In addition, carbon nanostructures with different dimensions can also be easily prepared in large scales at relatively low cost. To our knowledge, there have been some reports about the carbon nanostructure-based SERS-active substrates. For example, Chen and Liu have synthesized Ag/C/Ag NPs by a hydrothermal method in an AgNO3 solution using sodium citrate as reducer. Raman analyses showed that the Ag/C/Ag NP was a good SERS-active substrate, whose enhancement factor (EF) was on the order of 1 × 10⁷.Reference Chen and Liu17 Both Sun and Chen et al. have investigated the SERS substrates produced from a nanoporous carbon nanotube (CNT) network decorated with AgNPs.Reference Sun, Liu, Miao, Wang, Tian, Zhang, Li, Fan and Jiang4,Reference Chen, Young, Macpherson and Wilson18 The as-prepared SERS substrates by Sun showed much higher Raman enhancement than ordinary planar substrate, which was due to the extremely large surface and the unique zero-dimensional (0D) (Ag) at one-dimensional (1D) (CNT) nanostructure. In addition, Lu et al. have fabricated Ag or Au NP-decorated 2D reduced graphene oxide (rGO) on Si substrate by electroless deposition, which exhibited dramatic Raman enhancement and efficient adsorption of aromatic molecules.Reference Lu, Li, Liusman, Yin, Wu and Zhang19 Recently, Raman enhancement on the surface of 2D graphene attributed to a chemical enhancement effect has been reported by Ling et al. Due to the limited surface area, however, only 2- to 17-folder Raman enhancement was observed on a graphene film compared with the SiO2/Si substrate.Reference Ling, Xie, Fang, Xu, Zhang, Kong, Dresselhaus, Zhang and Liu20 In general, the above reported carbon nanostructure-based SERS substrates were mainly produced from decorating noble metal NPs on the surfaces of 0D carbon nanospheres, 1D CNTs, and 2D rGO. It is considered that the specific surface area used for absorbing molecules and the number of hot spots could be further improved when using three-dimensional (3D) nanomaterials as template.
Recently, we have synthesized carbon nanocoils (CNCs) in high yield by thermal chemical vapor deposition (CVD) using Fe–Sn–O catalysts.Reference Li, Pan, Qian and Liu21–Reference Li and Pan23 Because of their unique 3D helical morphologies, CNCs have more outstanding mechanical and electromagnetic properties than those of CNTs and are expected to have wide applications, which can be used in electromagnetic wave absorbers, field emission devices, micro/nano electro mechanical systems, catalysis, etc.Reference Treacy, Ebbesen and Gibson24–Reference Tang, Yang, Lin, Zhong, Au and Du28 However, to the best of our knowledge, its potential as a substrate or template for Raman enhancement has not been investigated up to now. It is expected that CNC-based architectures (AgNP-decorated CNC) would show a higher SERS activity due to their large specific surface area available for the formation of more hot spots located between neighboring AgNPs on the CNC surface. In addition, the large surfaces of CNCs would adsorb more molecules to contribute to the Raman signal. As we know, Sai et al. have developed 3D Si nanosprings coated with noble metal NPs using CVD or chemisorption of presynthesized or in situ-synthesized NPs, which displayed remarkable SERS activity.Reference Sai, Gangadean, Niraula, Jabal, Corti, McIlroy, Eric Aston, Branen and Hrdlicka29 However, the Si nanosprings need to be functionalized using coupling agents, which may introduce impure signals during Raman testing. In addition, the average interparticle spacing is more than 20 nm, which is not small enough and should be further reduced to obtain the strong local electric field and high SERS enhancement.
In this work, we have fabricated novel SERS-active nanostructures of AgNP-decorated CNC hybrids using different methods, which lead to unique 0D–3D (Ag–CNC) hybrid nanostructures, forming 3D hot-spot distributions. Optimization of experimental results shows that AgNPs can be densely distributed on the whole CNC surfaces and the interparticle spacing of AgNPs is much smaller (<4 nm). The as-prepared SERS substrate is capable of detecting trace amounts of rhodamine 6G (R6G) molecules, showing much higher Raman enhancement than 2D planar SERS substrate.
II. EXPERIMENTAL
A. CNC synthesis
A solution of FeCl3·6H2O with a concentration of 0.2 mol/L was used as the catalyst precursor. Hundred microliters of FeCl3·6H2O solution was dropped onto the indium tin oxide (ITO) glass substrate (sizes: 20 × 20 mm2) and dried at 30 °C. Then the samples were calcined at 700 °C for 30 min to oxidize the catalysts. CNCs were synthesized by thermal CVD at 700 °C for 60 min by introducing acetylene and Ar gases with flow rates of 15 and 245 sccm, respectively.
B. Preparation of SERS substrate
The grown CNCs were dispersed in ethanol and sonicated for 20 min. Then the suspension of CNCs was spread onto a glass substrate by spin coating, forming a CNC network substrate that acts as a template for the deposition of AgNPs.
1. Ag–CNC hybrid SERS substrate
Radio-frequency magnetron sputtering (RFMS) is one of the most widely applied techniques to deposit thin films. Herein, AgNPs were deposited onto the CNC network substrate by RFMS in a vacuum chamber. When the pressure in the chamber was decreased to 10−4 Pa, Ar gas with a flow rate of 30 sccm was introduced into the chamber and the working pressure was adjusted to 0.4 Pa. The sputtering power for Ag target was 30 W. The sputtering time ranged from 0 to 12 min. After deposition, the Ag–CNC substrate with 12 min sputtering time was calcined at 450 °C under Ar gas condition for 1 h. For comparison, a series of AgNPs or Ag films were deposited on the planar glass substrate by changing the sputtering time from 0 to 12 min. Finally, the samples were stored in the dark room.
2. Ag–TiO2–CNC hybrid SERS substrate
a. Method A (called A-substrate)
The CNC substrates and glass substrates were put into the chamber. When the pressure in the chamber was decreased to 10−4 Pa, O2 and Ar gases with flow rates of 5 and 40 sccm were brought into the chamber and working pressure was adjusted to 1.2 Pa. The sputtering power for Ti target was 150 W. The sputtering time ranged from 15 to 150 min. After deposition, the TiO2–CNC substrates were irradiated with UV light (wave length: 310 nm) from a low pressure mercury lamp (power: 6 W) in an aqueous solution containing 0.003 M AgNO3 for 2 h to photocatalytically deposit AgNPs, where the distance between the substrate and the UV lamp was approximately 6 cm. After irradiation, the substrates were removed from AgNO3 solution, dried in air, and stored in the dark room.
b. Method B (called B-substrate)
In this method, TiO2 sol was first prepared by a sol–gel method. Fifty milliliters of tetrabutyl orthotitanate and 3 mL of acetylacetone were mixed and stirred for 10 min (called solution-A); simultaneously, 110 mL of alcohol, 1.4 mL of deionized water, and 0.2 mL of nitric acid were mixed and stirred for 10 min (called solution-B). Then solution-B was added dropwise into solution-A during the stirring process and the mixture solution was stirred for 30 min, forming TiO2 sol solution. TiO2 film was deposited onto the CNC network substrate (size: 20 × 20 mm2) by a spin-coating method using 200-μL TiO2 sol solution with a spin-coating speed and time of 1000 rpm and 45 s, respectively. Simultaneously, a TiO2 film with the same thickness was deposited on the glass substrate using the above method. After coating, the sample was calcined at 450 °C for 1 h to crystallize the TiO2 film. Similar to method A, the as-prepared TiO2–CNC substrate was irradiated with UV light in an AgNO3 aqueous solution (0.003 M) for 30 min to photocatalytically deposit AgNPs. After irradiation, the substrate was removed from AgNO3 solution and stored in the dark room.
C. SERS measurement
R6G with a concentration of 10−7 M was selected as the probe molecule. Three kinds of SERS substrates were soaked in the R6G solution for 1 h. After soaking, the sample with molecules was washed with deionized water to remove the free molecules and dried in air. At last, Raman spectra were measured under the same conditions as follows: a 632.8 nm He–Ne laser with a power of 3.28 mW was used as the exciting light; a 50× objective was used to focus the laser beam onto the sample surface and to collect the Raman signal; the size of the laser spot is about 1 μm; the spectra were recorded with an accumulation time of 10 s.
D. Characterization
The products were studied and analyzed by scanning electron microscope (SEM; Nova NanoSEM 450, FEI, Hillsboro, OR), atomic force microscope (AFM; Agilent PicoPlusII, Agilent, Santa Clara, CA), Raman spectrometer (Renishaw inVia plus, Renishaw, Gloucetershire, UK), and UV-visible microscope (Maya2000-Pro, Ocean Optics, Dunedin, FL).
III. RESULTS AND DISCUSSION
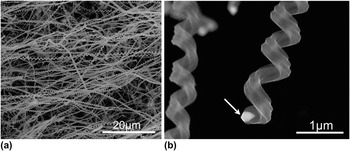
Figure 1 shows the SEM images of CNCs grown at 700 °C for 60 min on an ITO substrate. A high yield of CNCs (more than 90%) with uniform coil pitch and diameter can be obtained [Fig. 1(a)]. The average line diameter and coil diameter of the CNCs are approximately 300 and 500 nm, respectively. Figure 1(b) shows an enlarged SEM image of a typical CNC and the catalyst particle is observed at the tip of the grown CNC (indicated by the arrow), suggesting a tip growth mechanism.
(a) SEM images of typical CNCs synthesized by CVD using Fe–ITO substrate as the catalyst. (b) Enlarged SEM image of the tip of a carbon coil. The arrow in part (b) points to the catalyst particle at the CNC tip.

Our synthesized CNCs are helical, rough-textured, conductive, and have large surface-to-volume ratio, which is suitable to serve as a novel 3D template for depositing NPs and absorbing molecules. To fabricate an effective 3D CNC-based SERS substrate, the deposition of densely packed AgNPs on the CNC surfaces is required because hot spots can be formed in the gaps between adjacent AgNPs. The detection at these hot spots shows tremendously enhanced Raman signal due to the extremely strong local E-field excited at the gaps. So far, many different methods have been used to deposit AgNPs on the carbon nanostrucutres, which include physical vapor deposition, CVD, chemisorption of presynthesized NPs, hydrothermal method, etc. Herein, we have fabricated AgNPs on the surfaces of CNCs in three different ways. The designs and corresponding SERS activities of these CNC-based SERS substrates are discussed in detail below.
A. Ag–CNC hybrid SERS substrate
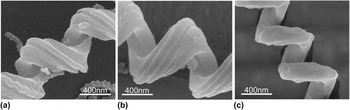
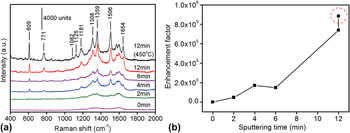
Figure 2 shows the typical SEM images of CNCs coated with AgNPs or films prepared by RFMS, which is named as Ag–CNC hybrids. The thickness of the Ag film on the CNC surfaces is controlled by changing the sputtering time. When depositing Ag for 4 min, irregular AgNPs with small sizes (approximately 18 nm) and small interparticle gaps (approximately 6 nm) are formed, as shown in Figs. 2(a) and S1(a). When the sputtering time reaches 12 min, CNCs are completely covered by a thick Ag film [Fig. 2(b) and Fig. S1(b)]. It is found that the surface of the Ag film is very rough, which may be beneficial for SERS enhancement. To test the SERS activities of Ag–CNC hybrids, R6G with a concentration of 10−7 M was used as the probe molecules. Figure 3(a) shows the SERS signals of R6G absorbed on Ag–CNC substrates with different Ag sputtering times. Numerous peaks of R6G are distinctly observed for the excitation spectra, where the most pronounced peaks at 1308, 1359, 1506, and 1645 cm−1 can be assigned to aromatic C–C stretching vibrations; the peaks at 1082, 1125, and 1181 cm−1 mainly result from C–H in-plane bending motion, whereas those at 609 and 774 cm−1 are due to C–H out-of-plane bending and C–C–C ring in-plane bending modes, respectively.Reference Hildebrandt and Stockburger30 It is found that the SERS signals of R6G are gradually increased with the increase of Ag sputtering time, while no R6G signal but two broad Raman peaks that originated from CNCs can be observed on the pure CNC network substrate, one is at around 1323 cm−1 known as D-band and other is at around 1583 cm−1 known as G-band. To further compare the Raman enhancement on these substrates, the SERS EF as a function of the Ag sputtering time is plotted in Fig. 3(b), which shows that the EF achieved by using the substrate for 12 min Ag sputtering time has reached 7 × 10⁵. It is also found that when the Ag–CNC (12 min) substrate is calcined at 450 °C under Ar gas conditions for 1 h, small Ag particles on the CNC surface are fused with each other and changed into large AgNPs [Fig. 2(c)]. Interestingly, this substrate after calcination exhibits better SERS activity than that without calcination [the data marked by dotted circle in Fig. 3(b)], which is considered to be mainly due to the increased sizes of AgNPs.
SEM images of CNCs coated with AgNPs by RFMS for (a) 4 min, (b) 12 min, and (c) 12 min and calcined at 450 °C for 1 h.

(a) SERS spectra of R6G (10−7 M) on an Ag–CNC substrate prepared by RFMS for different times. (b) The dependence of the SERS EF on Ag sputtering time. The data point marked by dotted circle corresponds to the EF with AgNPs by RFMS for 12 min and calcined at 450 °C.

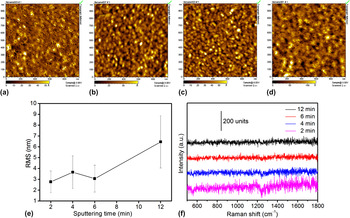
For comparison, Ag films with different thicknesses have also been fabricated on planar glass substrates. Figs. 4(a)–4(d) show the AFM images of Ag films prepared with sputtering times of (a) 2 min, (b) 4 min, (c) 6 min, and (d) 12 min. It is found that the Ag films deposited by RFMS are continuous and relatively flat, and the roughness is gradually increased from (2.77 ± 1) to (6.46 ± 2.41) nm with the increase of sputtering time [Fig. 4(e)]. Figure 4(f) compares the Raman signals of R6G (10−7 M) on Ag films prepared by sputtering. It is clearly observed that no signals from R6G could be detected on Ag films with different thicknesses, indicating that the continuous and smooth Ag films have no SERS activity. The above results demonstrate that the Ag–CNC hybrid is an effective SERS substrate, which is much better than the smooth Ag film substrate.
AFM images of Ag films prepared by RFMS for (a) 2 min, (b) 4 min, (c) 6min, and (d) 12 min. (e) The dependence of surface roughness on Ag film sputtering time. (f) Raman spectra of R6G (10−7 M) on Ag films prepared with different sputtering times.

A closer examination of Fig. 3(a) shows that besides the SERS signal of R6G, Raman signals of D-band and G-band that originated from CNCs always exist, especially for the substrates with short Ag sputtering time, which affects the SERS measurement.
B. Ag–TiO2–CNC hybrid SERS substrate
It has been reported that Ag nanostructures can be generated on TiO2 films by photocatalysis.Reference Mills, Hill, Stewart, Graham, Smith, Hodgen, Halfpenny, Faulds and Robertson31 Prompted by this feature, TiO2-decorated CNC network substrates have been prepared using two different methods and then AgNPs are grown on TiO2–CNC hybrids by photoreduction in an AgNO3 aqueous solution.
1. Method A
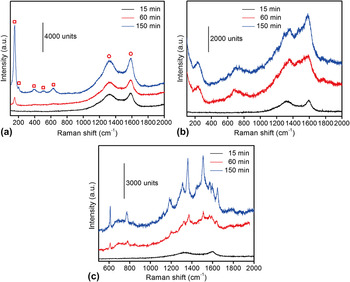
Figure 5(a) compares the Raman spectra of TiO2-decorated CNC network substrates prepared by RFMS with different sputtering times. It can be seen that two broad peaks originated from CNCs are still observed in the Raman spectra. It is also found that almost no peaks of TiO2 are observed when the sputtering time is shorter than 15 min, which is probably caused by an insufficient content of TiO2. When the sputtering time reaches 60 min, a small TiO2 Raman peak around 152 cm−1 appears. With further increasing the sputtering time, five Raman peaks associated with TiO2 around 152, 201, 388, 510, and 628 cm−1 are observed, indicating that the formed TiO2 is in the anatase phase.Reference Ahmed, Keyes, Byrne, Blackledge and Hamilton32,Reference Li, Pan, Li, Liu, Wu and Peng33 When AgNPs are loaded on TiO2–CNC surfaces by UV light irradiation in 3 mM AgNO3 solution for 2 h, the spectra features change a lot, as shown in Fig. 5(b). Most of the Raman peaks originated from anatase-phase-TiO2 disappear, suggesting that the structure of the TiO2 film has been changed by the photoreduction of AgNPs on its surface under the UV irradiation. In addition, two new broad peaks around 236 and 689 cm−1 appear in the Raman spectra, which may be attributed to the Ag or AgOx.
(a) Raman spectra of the CNCs coated with the TiO2 film prepared by RFMS. (b) Raman spectra of the CNC–TiO2 substrate after UV light irradiation in 3-mM AgNO3 solution for 2 h. (c) SERS spectra of R6G (10−7 M) on A-substrate. The squares and circles in (a) indicate Raman peaks originated from TiO2 and CNC, respectively.

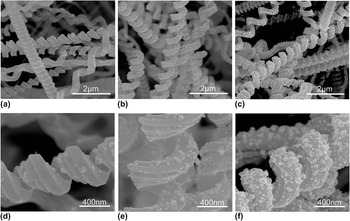
Figure 6 and Fig. S2 show the SEM images of Ag–TiO2–CNC hybrid nanostructures prepared by the combined RFMS-TiO2/photoreduction-AgNPs method (called A-substrate) with different TiO2 sputtering times. It is observed that the density of AgNPs increased with increasing TiO2 film thickness, whereas the particle size gradually decreased with decreasing TiO2 film thickness, which indicates that the photocatalytic activity of TiO2 is increased with the increase of the film thickness (Fig. S3). The distribution of the AgNP size is obtained by an average diameter analysis software. The average sizes of AgNPs are 30, 35, and 39 nm for 15, 60, and 150 min TiO2 sputtering times, respectively.
(a–c) SEM images of AgNPs on TiO2–CNCs substrates, formed in 3-mM AgNO3 solution with UV light irradiation for 2 h, where TiO2 is formed by sputtering for 15 min, 60 min, and 150 min, respectively. (d–f) The corresponding enlarged SEM images of A-substrates in (a–c).

The above A-substrates with three TiO2 sputtering time (15, 60, 150 min) are applied in the SERS detection using 10−7 M R6G as the probe, and the results are shown in Fig. 5(c). It is found that A-substrate with a 150-min TiO2 sputtering time exhibits the best performance in the SERS measurement, which is mainly due to the optimized size, density, and interparticle gap of AgNPs on the TiO2–CNC surfaces. However, this kind of SERS substrate still has some flaws and the insufficiency, which needs further to be improved. First, the background signals from A-substrate (mainly carbon) in the SERS spectra still exist, which is because CNCs have not been completely encased by the TiO2 film though they have experienced a long sputtering time; second, the coverage and uniformity of AgNPs on the TiO2–CNC surfaces are not high enough, which would affect the distribution and number of the hot spots; additionally, the interparticle distance is not small enough and should be further reduced to obtain a higher SERS enhancement. Therefore, it is still a challenge to optimize our 3D SERS substrate for obtaining uniform AgNPs with small gaps on the surfaces of CNCs or TiO2–CNC hybrids.
2. Method B
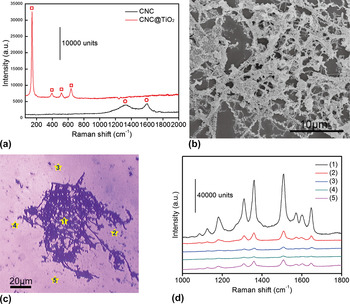
Compared with the vacuum deposition method, the spin-coating technique is much simpler and has low cost for preparing a thin film, and the film thickness can be easily controlled by adjusting the spin-coating speed. In this experiment, we have deposited TiO2 films on CNC substrates by spin coating. Figure 7(a) shows the Raman spectra of the calcined TiO2-decorated CNC network substrate. It can be seen that no carbon signals, but only Raman peaks that originated from anatase-phase-TiO2 around 142, 394, 515, and 637 cm−1 are observed, which indicate that CNCs are completely encased by the TiO2 film prepared by spin coating. Compared with the optical transmission spectra of TiO2 films (without CNCs) prepared by RFMS and spin coating (Fig. S3), the TiO2 film prepared by spin coating is thicker than that prepared by RFMS, which may be more helpful in the growth of AgNPs on TiO2–CNC surfaces. The TiO2–CNC substrate from the UV light irradiation in 3-mM AgNO3 solution for 30 min is shown in Fig. 7(b). It is observed that high-density AgNPs are formed on the TiO2–CNC hybrid surfaces, whereas small AgNPs (<30 nm) are formed in areas without CNCs, which can be further identified in Fig. 9 and Fig. S4. A closer observation shows that, in such Ag–TiO2–CNC hybrids (called B-substrate) AgNPs tend to cover the whole CNC surfaces, which is believed to be beneficial for SERS. To evaluate the SERS activity of this kind of 3D hybrid, the Raman spectra for 10−7 M R6G are measured. Figure 7(c) shows an optical microscopy image of the B-substrate, and the SERS spectra of R6G detected at the point positions of (1)–(5) are shown in Fig. 7(d). Interestingly, the SERS signal from point (1) exhibits the best performance and is about 6.3, 38.1, 70.4, and 9.1 times stronger than those at points (2)–(5), respectively. This result indicates that our B-substrate provides much better SERS enhancement at least one order of magnitude larger than the planar substrate. It is considered that the abundant AgNPs formed on the CNC surfaces and the small interparticle spacing are the most important factors that lead to this superior SERS performance.
(a) Raman spectra of the calcined TiO2-decorated CNC substrate by spin coating. (b) SEM image of the B-substrate by spin coating and with UV light irradiation in 3-mM AgNO3 solution for 30 min. (c) Microscopy image and (d) the corresponding SERS spectra of R6G (10−7 M) treated B-substrate. The squares and circles in (a) indicate Raman peaks originated from TiO2 and CNC, respectively.

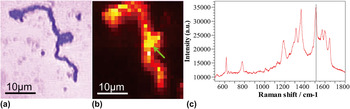
(a) Optical microscopy image and (b) the corresponding SERS mapping (step size, 1 μm) of R6G (10−7 M)-treated single B-nanostructure. The brightness in (b) is proportional to the R6G signal intensity at 1507 cm−1. (c) Raman spectrum of R6G (10−7 M) detected at the point position shown in (b) (indicated by arrow).

In addition, we have investigated the hot spot distribution on a single CNC surface. Figs. 8(a) and 8(b) show the optical microscopy image and the corresponding SERS mapping (step size: 1 μm) for the 10−7 M R6G treated B-nanostructure, respectively. The brightness in part (b) is proportional to the R6G signal intensity at 1507 cm−1. Obviously, the SERS signal is strong and highly uniform throughout the whole CNC. This is considered to be due to the presence of uniformly and densely packed AgNPs which form abundant hot spots on the CNC surfaces. This result is further confirmed using SEM characterization in a later section. It is interesting to note that the SERS signal detected at the arrow position in part (b) seems higher than other positions. The main possible reason is that there are two CNCs across each other at this position [Fig. 8(a)] and then more AgNPs contribute to the formation of hot spots.
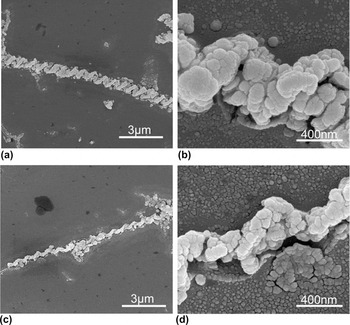
(a) and (c) Two typical SEM images of single B-nanostructure. (b) and (d) The corresponding enlarged SEM images of B-nanostructures in parts (a) and (c).

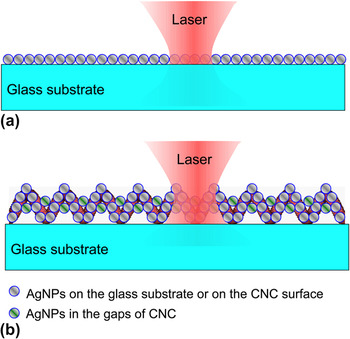
Figures 9(a) and 9(c) show two typical SEM images of single B-hybrid nanostructures. It is found that AgNPs are yet to grow on the CNC surfaces, and the unique 3D helical morphologies of CNCs are still clearly visible. It is observed from the enlarged SEM images [Figs. 9(b) and 9(d), Figs. S3(a) and S3(b)] that the surfaces of CNCs are very densely coated with irregular AgNPs with an average diameter of approximately 45 nm and interparticle spacing of <4 nm. It is also found that AgNPs are distributed not only along the outline of a CNC but also in the gaps and inner side of the CNC, which takes the advantage of the large area of the CNC and raises the coverage percentage of AgNPs on the CNC surface up to nearly 100% much larger than that of AgNPs grown on TiO2-decorated CNC by the sputtering method. While in the planar area without CNC, some smaller AgNPs with an average diameter of 25 nm are grown, and the average interparticle spacing in this area is approximately 6 nm which is larger than that of AgNPs on the CNC surfaces [Fig. S3(c)]. Figure 10 shows the schematic of the cross-sections of (a) 2D planar SERS substrate and (b) 3D CNC coated with AgNPs illustrated with laser. Based on the above analysis, we can further confirm that the superior SERS performance of the Ag–TiO2–CNC substrate over the planar substrate is mainly due to the unique 3D structure where large surface area is available for the adsorption of more molecules on the CNC surfaces, and loading more densely packed AgNPs (existing not only on the surfaces and inner side of CNCs but at the gaps between adjacent turns) to produce abundant Raman hot spots.
Schematic of the cross-sections of (a) 2D planar substrate and (b) 3D CNC coated with AgNPs illustrated with laser.

In addition, this kind of TiO2–CNC hybrid nanostructure as a 3D SERS template has at least two advantages. First, high pure AgNPs can be effectively grown on the TiO2–CNC surfaces by photoreduction without introducing any organic contaminations; second, carbon signals from the TiO2–CNC substrate could be avoided if CNC is completely encased by the TiO2 film.
C. SERS EF of 3D CNC-based substrate
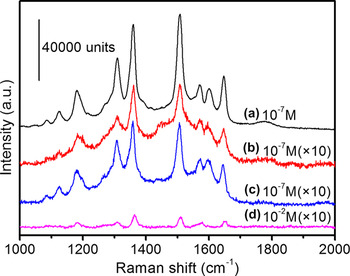
Figure 11 compares the SERS activities of 3D CNC-based substrates prepared by the methods mentioned above. It is found that B-substrates exhibit the highest SERS enhancement, whereas A-substrates and Ag–CNC substrates provide lower SERS activity.
Comparison of the SERS activities for CNC-based SERS substrates prepared by different methods. (a) B-substrate, (b) A-substrate, (c) Ag–CNC substrate, and (d) without SERS substrate.

It is known that the SERS EF is one of the most important factors for evaluating the SERS effect. This is especially true for the practical applications, where the first concern is usually to know the magnitude of the EF that can be achieved.Reference Le Ru, Blackie, Meyer and Etchegoin34 As we know, the most widely used definition for the SERS EF is as followsReference Le Ru, Blackie, Meyer and Etchegoin34:
 $${\rm{EF}} = {{{{I_{{\rm{SERS}}} } \mathord{\left/ {\vphantom {{I_{{\rm{SERS}}} } {N_{{\rm{SERS}}} }}} \right. \kern-\nulldelimiterspace} {N_{{\rm{SERS}}} }}} \over {{{I_{{\rm{vol}}} } \mathord{\left/ {\vphantom {{I_{{\rm{vol}}} } {N_{{\rm{vol}}} }}} \right. \kern-\nulldelimiterspace} {N_{{\rm{vol}}} }}}} = {{I_{{\rm{SERS}}} } \over {I_{{\rm{vol}}} }} \times {{N_{{\rm{vol}}} } \over {N_{{\rm{SERS}}} }}\quad ,$$
where I SERS and I vol are the SERS intensity of probes on the SERS substrate and the normal Raman scattering intensity of the probe solution, N SERS and N vol are the numbers of molecules illustrated by the laser to obtain the corresponding SERS and normal Raman spectra. However, this definition is not always straightforward for relating the experimental results. Therefore, a more practical definition of EF has been given as followsReference Le Ru, Blackie, Meyer and Etchegoin34:
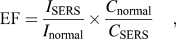 $${\rm{EF}} = {{I_{{\rm{SERS}}} } \over {I_{{\rm{normal}}} }} \times {{C_{{\rm{normal}}} } \over {C_{{\rm{SERS}}} }}\quad ,$$
where I SERS and I normal are SERS intensity of probes detected on the SERS substrate and the normal Raman scattering intensity of the probe solution, C SERS and C normal are the analyte solution concentrations that contribute to the SERS and normal Raman spectra, respectively. Herein, we have calculated the SERS EF of B-substrate using EF in Eq. (2). The concentrations of R6G solutions used for SERS and normal Raman spectra measurements are 10−7 and 10−2 M, respectively. I SERS and I normal are both measured at 1507 cm−1, which are approximately 76,279 and 645, respectively. Therefore, the EF was calculated to be
 $${\rm{EF}} = {{I_{{\rm{SERS}}} } \over {I_{{\rm{normal}}} }} \times {{C_{{\rm{normal}}} } \over {C_{{\rm{SERS}}} }} = {{76279} \over {645}} \times {{10^{ - 2} } \over {10^{ - 7} }} \approx 1.18 \times 10^7 \quad ,$$
indicating a good SERS enhancement of our prepared CNC-based substrate.
It is well known that there are two mechanisms for SERS, namely, the electromagnetic enhancement due to the localized surface plasmon resonance mode and the chemical enhancement that arises from the interaction between molecules and NPs. The above unexpectedly high SERS enhancement in our system relative to those 2D substrates can be mainly caused by electromagnetic enhancement due to the large specific surface areas for the formation of more hot spots which are not only located along the outline of a CNC but also in the gaps and inner side of the CNC. It should also be noted that TiO2 was used in our system, forming a Ag–TiO2–CNC hybrid nanostructure. Yang et al. have investigated the contribution of TiO2 NPs and Ag–TiO2 nanocomposites to SERS.Reference Yang, Jiang, Ruan, Yang, Zhao, Xu and Lombardi35 They found that TiO2 NPs are SERS active, and SERS signals of molecules absorbed on Ag–TiO2 NPs can be further enhanced considerably relative those enhancement on pure TiO2 NPs. It was considered that the surface-deposited Ag on TiO2 can inject additional electron into molecules adsorbed on the TiO2 surface through the conduction band of TiO2 NPs because of plasmon resonance absorption of Ag under incident visible laser, besides the intrinsic TiO2-to-molecule charge-transfer contribution. In our system, the charge-transfer contributions involving TiO2–Ag-molecules may also exist. However, to verify the charge-transfer mechanism in our system, a very specific experimental should be designed, which is also a subject for our further study.
IV. CONCLUSIONS
A novel 3D CNC-based SERS substrate has been easily fabricated by deposition of AgNPs on the CNC surfaces, forming the unique 0D–3D nanostrucutre. Three different methods have been tried to deposit AgNPs on the CNCs. By comparison, the B-substrates exhibit the highest SERS enhancement with an EF of over seven orders of magnitude, whereas A-substrates and Ag–CNC substrates provide the lower SERS activity. This 3D CNC-based SERS substrate shows much higher Raman enhancement than 2D planar SERS substrate mainly due to the formation of 3D hot spots. It is also considered that the TiO2–CNC hybrid nanostructure as a 3D SERS template gives at least two advantages. First, high pure AgNPs can be effectively grown on the TiO2–CNC surfaces by photoreduction without introducing any organic contaminations; second, carbon signals from the TiO2–CNC substrate could be avoided if CNC is completely encased by the TiO2 film.
ACKNOWLEDGMENTS
This work was supported by the National Natural Science Foundation of China (Nos. 11274055, 61137005, 11074029) and the Fundamental Research Funds for the Central Universities (No. DUT12ZD204).