Modern, intensive agricultural practices have greatly increased productivity but at marked ecological and environmental costs (Stoate et al. Reference Stoate, Baldi, Beja, Boatman, Herzon, van Doorn, de Snoo, Rakosy and Ramwell2009). Conservation practices such as using cover crops, reducing tillage, and planting wildflowers and native grasses in areas that are not in production can improve environmental quality. Such practices are often incentivized through the U.S. Department of Agriculture (USDA Natural Resources Conservation Service 2016) and state conservation programs (e.g., Maryland Department of Agriculture 2016). In other developed countries, conservation and environmental protection programs are widely used. In France, farmers are now required to implement and maintain ecofriendly farming practices in order to receive subsidies (EU Regulation No 1307/2013). One ecofriendly practice that is common in France is the establishment of mixtures of endemic perennial grasses (e.g., tall fescue [Lolium arundinacea (Schreb.) S.J. Darbyshire], orchardgrass [Dactylis glomerata L.]) in 5-m-wide strips around the margins of fields to limit pesticide drift and soil erosion. These strips are never plowed but instead are managed by annual or semiannual mowing. Fertilizer and pesticide applications are also prohibited to protect surface waters (Lacas et al. Reference Lacas, Voltz, Gouy, Carluer and Gril2005).
More recently, grass margin strips have also been promoted for their potential ecological benefits, with positive impacts on farmland biodiversity being demonstrated across a range of different taxa and species of flora (Cordeau et al. Reference Cordeau, Petit, Reboud and Chauvel2012b; Marshall et al. Reference Marshall, West and Kleijn2006) and fauna (Badenhausser and Cordeau Reference Badenhausser and Cordeau2012). Previous research has demonstrated that the abiotic environment (e.g., soil and climate) and management practices used in the strips (mowing, hay harvesting, etc.) can influence the composition of weed communities that co-occur with sown grasses (Cordeau et al. Reference Cordeau, Reboud and Chauvel2010; Critchley et al. Reference Critchley, Fowbert and Sherwood2006). However, little is known about which weed species can tolerate competition from grasses and periodic mowing in grass margin strips.
Community assembly theory suggests that evaluating functional traits rather than species can provide important insights and lead to a more mechanistic understanding of plant community dynamics (Booth and Swanton Reference Booth and Swanton2002). According to community assembly theory, abiotic and biotic factors, such as management practices and competition, act as filters preventing species with some traits while allowing species with other traits to exist in a community. Thus, understanding the factors responsible for filtering and which traits are excluded is important for better predicting which species are likely to increase or decrease in abundance in both natural and managed ecosystems (Ryan et al. Reference Ryan, Smith, Mirsky, Mortensen and Seidel2010).
Plant community composition often differs in natural grasslands based on age, with annual plants being replaced by perennials over time (Kahmen and Poschlod Reference Kahmen and Poschlod2004). Therefore, it might be expected that different life history strategies would be observed between newly sown and older strips (Bazzaz Reference Bazzaz1979; Dolle et al. Reference Dolle, Bernhardt-Romermann, Parth and Schmidt2008). Other traits that are associated with ecosystem services or agricultural production problems could also change in abundance over time. However, no studies have quantified plant community composition and structure in sown-grass margin strips that differ in age. Here we evaluate the trait composition of naturally occurring plant communities in sown-grass strips and assess the relationship between trait combinations and grass strip age. Using weed community data from 75 sown-grass margin strips in France, we hypothesized that grass margin strip management would act as a community assembly filter and traits of dominant species would differ between newly sown-grass margin strips (<2 yr old) and older strips (>5 yr old). We used a trait-based functional group approach and developed an analytical framework to evaluate the weed community that is based on the grouping of plant species with similar traits (Violle et al. Reference Violle, Navas, Vile, Kazakou, Fortunel, Hummel and Garnier2007) and realized niches with respect to multiple environmental factors (Lavorel and Garnier Reference Lavorel and Garnier2002; Lavorel et al. Reference Lavorel, McIntyre, Landsberg and Forbes1997). In addition to identifying which traits allow weeds to persist in sown-grass margin strips, we suggest management practices (i.e., filters) that can be used to promote desirable weed species.
Materials and Methods
Sampling
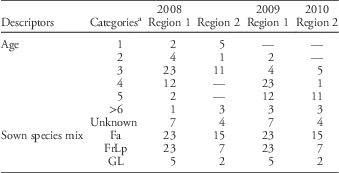
Floral surveys were carried out on 75 sown-grass margin strips in two study regions in France in May 2008, 2009, and 2010 (Table 1) before mowing operations occurred in the given years. The study regions were situated in western France (Region 1: 46°11′N, 0°28′W, Plaine & Val de Sèvres study region) and eastern France (Region 2: 47°13′N, 5°03′W, Fénay study region), in landscapes with similar characteristics (Cordeau et al. Reference Cordeau, Reboud and Chauvel2011). Summer rainfall patterns were similar in both regions (monthly total precipitation: 96 mm in June, 71 mm in July, 70 mm in August, and 49 mm in September), except that 169 mm fell in July 2009 in eastern France (Region 2). Interviews with farmers were used to determine the properties of each strip (sown species, mowing practices), including the time since establishment (i.e., age). All sown-grass margin strips were established within the first 5 m from the field edge and sown with grass mixture consisting of tall fescue, meadow ryegrass [Lolium pratense (Huds.) S.J. Darbyshire], red fescue (Festuca rubra L.), perennial ryegrass (Lolium perenne L.), and orchardgrass. All sown-grass margin strips were mowed twice each year and were managed without fertilizers, herbicides, or tillage practices. The occurrence and abundance of all plant species, both sown and naturally occurring, were recorded in 10 plots (0.36 m²) per sown-grass margin strip, using Braun-Blanquet’s cover-abundance method (Mueller-Dombois and Ellenberg Reference Mueller-Dombois and Ellenberg1974), as described in Cordeau et al. (Reference Cordeau, Reboud and Chauvel2010). Data from the 10 plots in each strip were used to determine the frequency of occurrence and average abundance, which was used to calculate an indicator value (see “Data Analysis” section). Only naturally occurring species (termed “weed species” here) were considered in this analysis. Weed species were identified according to Hanf (Reference Hanf1982) and Jauzein (Reference Jauzein1995).
Number of surveyed sown-grass strips at Region 1 (western France) and Region 2 (eastern France) according to their age (years since establishment) and sown species mix.

a Abbreviations: Fa, mix dominated by Festuca arundinacea Schreb.; FrLp, mix of grasses dominated by red fescue (Festuca rubra L.) and perennial ryegrass (Lolium perenne L.); GL, mix of grasses and legumes (<2% of white clover [Trifolium repens L.]).
Biological Descriptors of Weed Species Used to Define Functional Groups
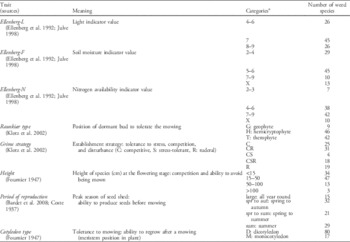
A species-by-trait matrix was created to characterize each of the 97 observed weed species using eight biological descriptors. We considered traits that were likely to impact plant fitness in sown margin strips (Table 2). The eight traits used in this analysis describe habitat preference and tolerance to abiotic and biotic stressors as outlined here:
-
Bioindication of the habitat in (1) soil fertility (N), (2) soil moisture (F), and (3) light availability (L), after Ellenberg et al. (Reference Ellenberg, Weber, R, Wirth, Werner and Paulißen1992). Ellenberg’s indicator values were the first system of bioindication proposed and applied to the flora of Germany, and there is a long tradition of using these values for understanding plant communities and their evolution (see Haas and Streibig [Reference Haas and Streibig1982] for N values and Kleijn and van der Voort [Reference Kleijn and van der Voort1997] for L values). The indicator values range from one to nine for each of the environmental gradients.
-
Tolerance to competition with the sown-grass species, including the (4) height of weed plants (Gaudet and Keddy Reference Gaudet and Keddy1988) relative to the height of the grass canopy and the height of the mower and (5) the establishment strategies of Grime (Reference Grime1979). Grime developed the C–S–R triangle theory, wherein all species could be classified as one or a combination of the descriptors: competitor (C), stress-tolerant (S), and ruderal (R). Competitors are plant species that thrive in areas of low abiotic stress and disturbance and excel in biological competition. These species are able to outcompete other plants by using available resources most efficiently. Stress tolerators are plant species that live in areas of high abiotic stress and low disturbance. Species that have adapted this strategy generally have slow growth rates, long-lived leaves, high rates of nutrient retention, and low phenotypic plasticity. Ruderals are plant species that prosper under high disturbance and low-stress conditions. These species are fast growing, complete their life cycles rapidly, and generally produce large amounts of seeds. Plants that have adapted this strategy are often found colonizing recently disturbed land and are often annuals.
-
Tolerance to mowing, including: (6) Raunkiær biological types (Raunkiær Reference Raunkiær1934), (7) period of reproduction, and (8) cotyledon type (i.e., monocotyledons and dicotyledons). The subdivisions of the Raunkiær system are based on the location of the growing point of the plant (i.e., bud) during periods of adverse conditions (e.g., cold seasons and dry seasons or, in this case, the period when mowing occurred). Hemicryptophytes are plants with buds at or near the soil surface (e.g., dandelion [Taraxacum officinale G.H.Weber ex Wiggers]). Geophytes are plants with belowground buds lying beneath the surface of the ground as a rhizome or bulb (e.g., quackgrass [Elymus repens (L.) Gould]). Finally, therophytes are annual plants that complete their life cycles rapidly under favorable conditions and survive the unfavorable season in the form of seed.
Description of weed traits used in the functional group analysis.

a X, indifferent (i.e., not associated with a particular category).
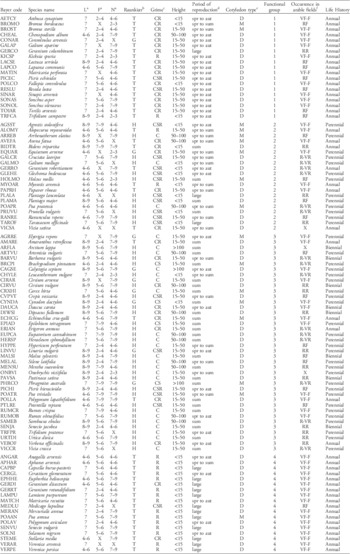
These trait values were not measured from observed weeds but were extracted from online trait databases that contain trait values for thousands of plant species (see Table 2 for sources). We used the BaseFlor database (Julve Reference Julve1998) and the BiolFlor database (Klotz et al. Reference Klotz, Kühn and Durka2002). In these trait databases, references to the original sources of trait measurements are available. Information about other traits, such as plant height and the period of reproduction, was collected from reference books of French flora (Coste Reference Coste1937; Fournier Reference Fournier1947). Trait values were collected for all 97 species, and the resulting species-by-trait matrix was complete, that is, no values were missing (Table 3). Continuous traits (e.g., height) were transformed into categorical traits (Table 2) before we conducted the multiple correspondence analysis (MCA), which requires categorical variables.
List of 97 weed species from flora survey and their traits by functional group.

a Ellenberg’s indicator value (Ellenberg et al. Reference Ellenberg, Weber, R, Wirth, Werner and Paulißen1992) for light (L), soil moisture (F), and nitrogen availability (N).
b Raunkiær (1934) type (position of dormant bud to tolerate the mowing): geophyte (G), hemicryptophytes (H), and therophyte (T).
c Grime establishment strategy: tolerance to stress, competition, and disturbance (C: competitive, S: stress-tolerant, R: ruderal).
d Period of reproduction: all year round (large), spring to autumn (spr to aut), spring to summer (spr to sum), summer (sum).
e Cotyledon type: dicotyledon (D) and monocotyledon (M).
f Occurrence of weed species in field (Jauzein Reference Jauzein1995). X, nonarable; R-VR, rare and very rare; RR, relatively rare; RF, relatively frequent; VF-F, very frequent and frequent.
Data Analysis
Weed species were organized into functional groups. A functional group is a set of species with common plant traits that behave in a similar way. Functional groups were formed by conducting an MCA of the species-by-trait matrix, using the ‘Ade4’ package (Dray and Dufour Reference Dray and Dufour2007) in R (R Development Core Team 2011). MCA is a data analysis technique for nominal categorical data, used to detect and represent underlying structures in a data set (here the species-by-trait matrix). It does this by representing species as points in a low-dimensional Euclidean space. The procedure is comparable to principal component analysis but is applied to categorical instead of continuous data. Thus, species were placed in a multidimensional space with coordinates on each axis of the multidimensional space. The Euclidean distance between species in the multidimensional space represents the distance between species in terms of trait values representing their ecology. The closer the species in the multidimensional space, the more similar they are in terms of trait values. The Euclidean distance (first five axes of the MCA) were then used to conduct a Ward hierarchical ascendant classification (HAC; i.e., cluster analysis). The HAC produced a dendrogram, which is a tree diagram frequently used to illustrate the arrangement of the clusters produced by hierarchical clustering. Examination of the dendrogram allowed us to identify clear and nonredundant functional groups. Fisher’s exact tests, performed with the catdes function (Husson et al. Reference Husson, Le and Pages2010b; Lebart et al. Reference Lebart, Morineau and Piron1995) of the ‘FactoMineR’ package (Husson et al. Reference Husson, Josse, Le and Mazet2010a), were used to classify those traits and trait categories significantly associated with each functional group. The catdes function also provided “v.test values” that indicated trait categories that were overrepresented (v.test values >0) or underrepresented (v.test values<0) in each functional group.
Indicator values were calculated for each weed species to determine the species’ affinity to sown-grass margin strips. Indicator species analysis is commonly used in community ecology to measure the fidelity of a species to a habitat (Dufrêne and Legendre Reference Dufrêne and Legendre1997; Liira et al. Reference Liira, Schmidt, Aavik, Arens, Augenstein, Bailey, Billeter, Bukacek, Burel, De Blust, De Cock, Dirksen, Edwards, Hamersky, Herzog, Klotz, Kuhn, Le Coeur, Miklova, Roubalova, Schweiger, Smulders, Van Wingerden, Bugter and Zobel2008; Ryan et al. Reference Ryan, Smith, Mirsky, Mortensen and Seidel2010). Indicator values were calculated with the following equation:
 $${\rm Indicator}\,{\rm value}_{{sp}} ={{\sum_{1}^{n} ({\rm abundance}{\times}{\rm frequency})} \over n}$$
where “abundance” is the average abundance of the species sp in the 10 plots of the sown-grass margin strips, “frequency” is the frequency of occurrence of the species sp over the 10 plots of the sown-grass margin strips, and n is the total number of sown-grass margin strips in both regions (n=75). Indicator values range from 0 (species not observed) to 100 (species observed in all plots and covering 100% of all plots). Indicator values were log10 transformed and subjected to one-way ANOVA to test for differences between functional groups.
We used a space-for-time substitution approach (i.e., chronosequence; Walker et al. Reference Walker, Wardle, Bardgett and Clarkson2010) to evaluate temporal changes in the relative abundance of each functional group. This approach is commonly used to evaluate long-term changes in plant taxa from spatially replicated samples that differ in age (Blois et al. Reference Blois, Williams, Fitzpatrick, Jackson and Ferrier2013). Chi-square testing was done on a contingency table for the age of sown-grass strips by abundance of each functional group, controlling for the abundance of weed species. In addition to the trait-based functional group analysis using the eight traits in Table 2, we evaluated the temporal effects on weed community composition using two generic classifications: (1) life history (Klotz et al. Reference Klotz, Kühn and Durka2002) and (2) previously documented occurrence in French fields (Jauzein Reference Jauzein1995).
Results and Discussion
Close to 100 weed species were observed across the 75 grass margin strips surveyed. Results show clear patterns of trait assemblages based on age of grass margin strip. The functional group analysis shows that changes in weed species were associated with species’ ability to tolerate the environmental conditions and management of sown-grass margin strips. We found that weed species that commonly emerge from soil seedbank in annually disturbed agricultural fields, such as annual therophytes tolerant to disturbance, dominated the newly sown-grass margin strips. We also found that older sown-grass margin strips hosted predominantly perennial and competitive weeds, which supports our hypothesis.
Traits of Dominant Weeds
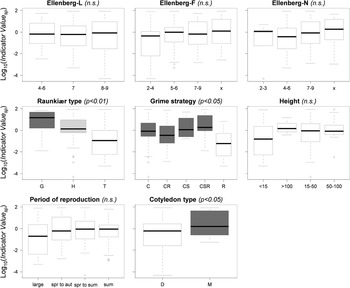
Average indicator values differed significantly within several trait categories (Figure 1). Geophytes (N=9 species; see Table 2) were found to be more frequent and abundant than hemicryptophytes (N=46), which were also more frequent and abundant than therophytes (N=42). The frequencies and abundances of ruderal-strategy weed species (N=19) were lower than other Grime strategies (Figure 1). Monocotyledon species (N=17) were found more frequently and abundantly than dicotyledon species (N=80). No differences were found for the Ellenberg traits.
Indicator values of weeds across categories of each trait (Ellenberg L, F, and N values; Raunkiær type; Grime strategy; height; period of reproduction; and cotyledon type). See Table 2 for details. Average indicator values in boxes filled with the same color were not significantly different (n.s.) based on one-way ANOVA. Circles above or below the boxes indicate values greater or less than 1.5 times the interquartile range, respectively. Black line indicates median indicator value.

Functional Groups of Traits
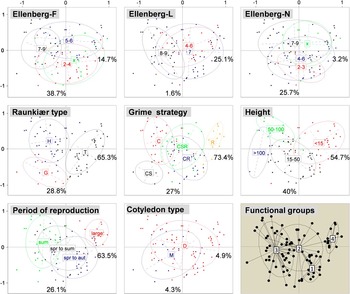
The first five axes of the MCA (Figure 2) accounted for 47.3% of the total trait variation. The first axis (14.5% of the variation) showed a gradient of competition and mowing tolerance (Raunkiær biological types, Grime strategies, height, and reproduction period). It discriminated geophytes, hemicryptophytes, C species, CS species, and tall species (>100 and 50 to 100 cm), all with early reproduction periods, from therophytes and small ruderals with late reproduction. Axis 2 (9.1%) showed a gradient of the level of soil moisture preference (Ellenberg-F) and ability to compete for light (height). It also discriminated hydrophilic species (high soil moisture–loving species) and species taller than the grass cover (50 to 100 cm) from short species (15 to 50 cm) and those indifferent to soil-moisture levels.
Multiple correspondence analysis (MCA) ordination (axis 1: 14.9%; axis 2: 9.1%) of the weed species-by-trait matrix (Tables 2 and 3). All nine overlays (plots) represent the same ordination solution, and weed species (dots) are colored according to their trait categories (see Table 2 for details). Percentages on each axis represent the correlation of each trait with the first and second axis of the MCA. Ellipses show the 95% confidence interval, and the trait category labels are the centroids of all species belonging to the trait category. Weed species were grouped in functional groups (1, 2, 3, and 4) according to their Euclidean distances in the MCA space (first five axes) with a Ward hierarchical ascendant classification.

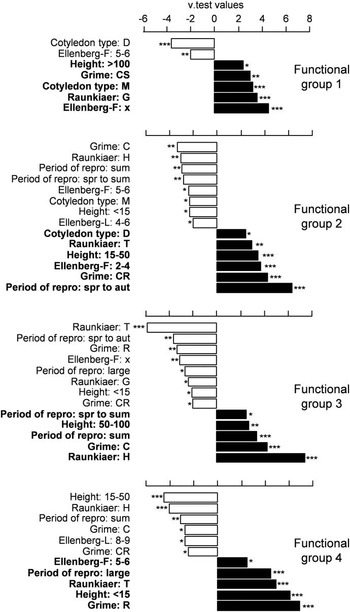
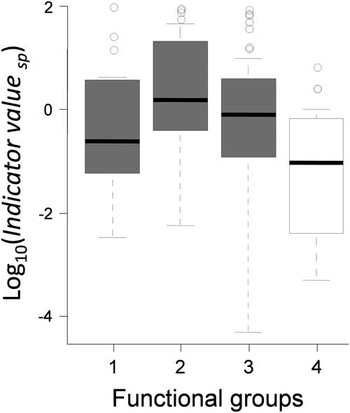
The HAC clustered weed species into four functional groups (Figure 2, last panel) based upon their trait combinations (Figure 3). All traits contributed to the grouping, with the exception of the Ellenberg N classification (P=0.48). The functional groups differed in their average indicator value (one-way ANOVA, F=4.15, df=3, P=0.008).
Filled bars indicate the trait categories (in bold) that contributed to each functional group (overrepresented categories: v.test values>0) and open bars show trait categories that were excluded from each functional group (underrepresented categories: v.test values<0). Fisher’s exact tests were used to compare the allocation of the categories of traits (see Table 2) in the functional groups (*P<0.05; **P<0.01; ***P<0.001). The catdes function (Husson et al. Reference Husson, Le and Pages2010b; Lebart et al. Reference Lebart, Morineau and Piron1995) of the ‘FactoMineR’ package (Husson et al. Reference Husson, Josse, Le and Mazet2010a) provided v.test values (unitless).

Functional group 1 consisted of 19 weed species, among which were monocotyledons (e.g., poverty brome [Bromus sterilis L.]), geophytes (e.g., field bindweed [Convolvulus arvensis L.]), tall species (>100 cm), CS species, and those having little preference based on soil-moisture levels. Asteraceae species, such as prickly lettuce (Lactuca serriola L.), bristly oxtongue (Picris echioides L.), spiny sowthistle [Sonchus asper (L.) Hill], and annual sowthistle (Sonchus oleraceus L.) were representative species of functional group 1. Functional group 2 comprised 20 weed species, which consisted mainly of dicotyledons (e.g., smooth bedstraw [Galium mollugo L.], creeping buttercup [Ranunculus repens L.], dandelion), therophytes (e.g., roundleaf geranium [Geranium rotundifolium L.], wild oat [Avena fatua L.]), species with intermediate height (15 to 50 cm), CR species, and species that reproduce from the spring to the autumn (e.g., ground ivy [Glechoma hederacea L.]). Functional group 3 was the largest functional group, with 40 weed species, among which were hemicryptophytes (e.g., broadleaf dock [Rumex obtusifolius L.]), competitors (e.g., quackgrass, Canada thistle [Cirsium arvense (L.) Scop.], hedge bindweed [Calystegia sepium (L.) R. Br.]), species taller than the grass cover (50 to 100 cm), and species that reproduce from the spring to the summer (e.g., wild carrot [Daucus carota L.]) or in summer (e.g., stinging nettle [Urtica dioica L.], bermudagrass [Cynodon dactylon (L.) Pers.]). Functional group 4 consisted of 18 weed species and was composed of short (<15 cm), ruderal, therophyte (e.g., scarlet pimpernel [Anagallis arvensis L.], shepherd’s-purse [Capsella bursa-pastoris (L.) Medik.], prostrate knotweed [Polygonum aviculare L.], black nightshade [Solanum nigrum L.], annual mercury [Mercurialis annua L.]) species that typically reproduced continuously throughout the year (e.g., corn speedwell [Veronica arvensis L.], annual bluegrass [Poa annua L.]). Functional group 4 contained weed species with low indicator values (Figure 4), which were less frequent and less abundant in sown-grass margin strips.
Indicator values of weed species according to their functional groups. Average indicator value in boxes filled with the same color were not significantly different based on one-way ANOVA. Circles above the boxes indicate values greater than 1.5 times the interquartile range. Black line indicates median indicator value of functional groups.

Traits Allowing Weed Species to Persist in Sown-Grass Margins
The Grime strategies and Raunkiær biological types were highly discriminating traits of the weed community, whereas Ellenberg values were not discriminating traits for the formation of functional groups. The results indicate that the declining species were mainly the hydrophilic species of functional group 4. Interestingly, xerophilic species of functional groups 1 and 2 maintained their populations. This result is somewhat counterintuitive, given that grass margin strips are typically sown in damp areas adjacent to drainage and riparian zones, and thus we expected to find species that are associated with damp conditions.
In addition, the functional group analysis succeeded in identifying combinations of traits that discriminate between newly sown and mature strips. The presence of plant species belonging to functional groups 1 and 3 can be explained by a tolerance to mowing by avoidance. The height of these species was lower than the height of the mower or they grew rapidly after mowing (Meiss et al. Reference Meiss, Munier-Jolain, Henriot and Caneill2008). We showed that functional group 1 differed from functional group 3, which was composed of grasses and tall species. Height was found to be an important trait in sown-grass margin strips, because it is negatively linked with the ability to avoid mowing but positively linked with the ability to compete with the grass cover (Gaudet and Keddy Reference Gaudet and Keddy1988). We found that therophyte forbs, belonging to functional group 2, maintained their population through being either competitive species or species that shed seeds before mowing occurs.
Whereas the trait combinations found in functional groups 1, 2, and 3 allowed these species to persist, the combination of traits in functional group 4 appeared relatively unfavorable for survival in grass margin strips. The species in group 4 tend to be adapted to disturbed habitats, such as fields with tillage (Fried et al. Reference Fried, Chauvel and Reboud2009a; Geertsema et al. Reference Geertsema, Opdam and Kropff2002), and thus would not do well in older sown-grass margin strips that had not been tilled since establishment. Moreover, mowing was done too early (May to June) for some of these therophyte species, such as common lambsquarters (Chenopodium album L.) and prostrate knotweed, which germinate during the spring, to spread mature seeds (Meiss et al. Reference Meiss, Munier-Jolain, Henriot and Caneill2008). Our findings suggest that competition with the grass species sowed and the practices used to manage the grass strips select for a weed community that is different than what is commonly found in annually disturbed agricultural fields (Cordeau et al. Reference Cordeau, Petit, Reboud and Chauvel2012a).
Temporal Effects
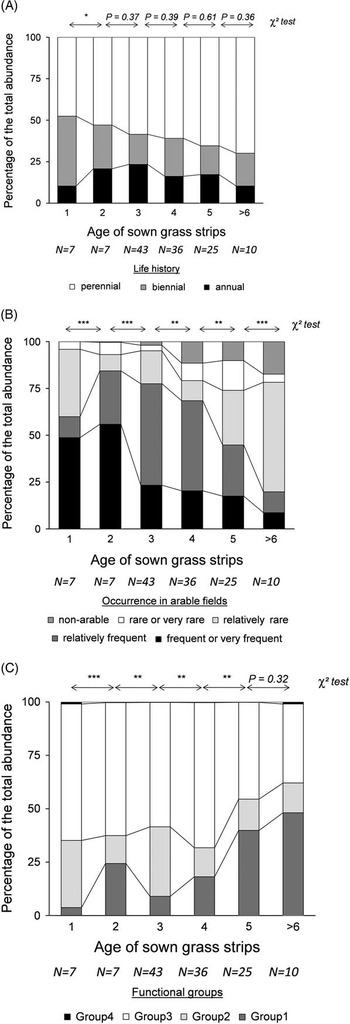
Weed life history differed with grass margin strip age, with a greater frequency of annual weeds observed in newly sown-grass margin strips and perennial weeds observed in older grass margin strips (Figure 5A). Weed species that must produce seeds to maintain their population (i.e., annuals and biennials) decreased with the age of sown-grass margin strips. The percentage of perennial weed species increased from 47.6% in 1-yr-old grass margin strips to 69.9% in 6-yr-old grass margin strips (Figure 5A). It appears that species turnover was initially rapid, changing significantly between 1-yr-old and 2-yr-old grass margin strips (χ2 test, P<0.05), but not thereafter (P-values in Figure 5A). Surprisingly, the percentage of perennials was already very high in the 1-yr-old strips. This might be because the sown-grass margin strips are established next to the pre-existing field edges, and thus the bud banks could be dominated by rhizome and other perennating organs. In addition, species could spread from the pre-existing field edge to the sown-grass strips (Cordeau et al. Reference Cordeau, Petit, Reboud and Chauvel2012a).
Temporal dynamics of weed species abundance in sown-grass strips according to (A) life history (Klotz et al. Reference Klotz, Kühn and Durka2002), (B) occurrence in arable fields (qualitative descriptor, extracted from Flore des champs cultivés [Flora of cultivated fields]; Jauzein Reference Jauzein1995), and (C) functional group. The life history and the occurrence in arable fields of each weed species were described in Table 3. P-values of χ2 test indicate differences between each set of successive years (*P<0.05; **P<0.01; ***P<0.001). N represents the number of sown-grass margin strips in each age class.

The proportion of arable and nonarable species varied significantly with strip age (Figure 5B). Species maintaining their populations in sown-grass margin strips were those rarely found within disturbed agricultural fields (Figure 5B). Indeed, these nonarable plant species (Jauzein Reference Jauzein1995) were absent in 1-yr-old strips and accounted for 17.4% in 6-yr-old strips, whereas weed species frequently observed in disturbed agricultural fields accounted for 59.9% in 1-yr-old and 19.8% in 6-yr-old grass margin strips. This result confirms that the older the sown-grass margin strips, the less they acted as weed reservoirs capable of spreading weeds into the fields (Cordeau et al. Reference Cordeau, Petit, Reboud and Chauvel2012b), which was a concern mentioned by farmers who established the sown-grass margin strips (Cordeau et al. Reference Cordeau, Reboud and Chauvel2011).
Trait combinations differed significantly with the age of the sown-grass margin strips (Figure 5C). Functional groups 2 and 3 were dominant in the grass margin strips that were ≤4 yr old but were replaced by functional group 1 in strips that were >4 yr old. Functional group 4 was always the least abundant functional group (<1%). Sown-grass margin strips established longer than 5 yr showed the same proportion of functional groups (Figure 5C, χ2 test between 5- and 6-yr-old sown-grass strips, P=0.32).
Our results show that the annual species frequently found in fields were also frequent in newly sown-grass margin strips and that these decline rapidly with sown-grass margin strip age. The sown-grass margin strips were established in the first 5 m of the field edges, where weed abundance and species richness are usually greater than in the field centers (Fried et al. Reference Fried, Petit, Dessaint and Reboud2009b). Seedlings emerging from the soil seedbank were abundant in the first year after the establishment of the strips, but the lack of tillage led to a progressive change from annual ruderal species to competitive species with vegetative reproduction (Kleyer Reference Kleyer2002). The rapid decrease of annual ruderals suggests that the establishment of a perennial grass cover without any subsequent soil disturbance would be unfavorable for maintaining rare weeds, usually located in the field edges (Dutoit et al. Reference Dutoit, Gerbaud, Buisson and Roche2003; Marshall Reference Marshall2009).
Maintaining a Diverse Weed Community in Perennial Habitats
We found that annual weed species did not maintain their populations in the sown-grass margin strips. These strips did not increase weed immigration into crop fields (Cordeau et al. Reference Cordeau, Petit, Reboud and Chauvel2012b) and were not a favorable habitat for maintaining a high diversity of weed species, probably because they are not managed for that goal. Other agri-environmental schemes have, however, been proposed and shown to protect weeds that could provide ecosystem services (Walker et al. Reference Walker, Critchley, Sherwood, Large, Nuttall, Hulmes, Rose and Mountford2007). For example, conservation headlands are herbicide-free edges within crop fields that can harbor a high cover and species diversity of weeds, particularly forbs (de Snoo Reference de Snoo1997). The grass margin strips we studied were always sown with perennial grasses, even when farmers could leave the flora to regenerate from the soil seedbank. Farmers typically sow grass species, because natural germination in unsown strips could lead to a high floral diversity (De Cauwer et al. Reference De Cauwer, Reheul, De Laethauwer, Nijs and Milbau2006a) and ingress of these weeds into fields (Cordeau et al. Reference Cordeau, Reboud and Chauvel2011). In conservation headlands, competition for resources is less important in the initial years than in sown strips, which is favorable for autumn-germinating species and early-flowering ruderals (e.g., common chickweed [Stellaria media (L.) Vill.], annual bluegrass) that are considered beneficial weeds in fields (Storkey and Westbury Reference Storkey and Westbury2007).
Based on our results, it appears that sown-grass margin strips of intermediate age have the greatest range of traits and thus the greatest potential for maximizing plant diversity. Holding the plant community at this successional stage is likely to be difficult and might require changes to the sown-grass community, disturbance interventions, or reductions in the duration of life of grass margin strips. However, we predict that a combination of delayed mowing and shallow noninversion soil tillage would increase overall weed diversity and extend this period of high diversity further into the life of the strip. Delayed mowing could give some annual species time to spread mature seed. Disturbing the soil surface of sown-grass margin strips with a harrow or disk could disrupt bryophyte establishment, possibly leading to coexistence of annual and perennial plants (De Cauwer et al. Reference De Cauwer, Reheul, D’Hooghe, Nijs and Milbau2006b; Westbury et al. Reference Westbury, Woodcock, Harris, Brown and Potts2008) by creating gaps in the cover and enhancing weed-seed germination (Reibel et al. Reference Reibel, Guillemin, Cordeau and Chauvel2010).
Sown-grass margin strips that are established for environmental purposes can increase weed diversity and provide important ecosystems services, including supporting pollinators, facilitating biological control, and providing habitat for other desirable species. Using a novel trait-based functional group approach, we show that only some weed species have the combination of traits necessary to tolerate mowing and competition from sown grasses and thus maintain their populations. Raunkiær biological type, Grime strategies, and weed life history were major traits determining the ability of weeds to survive in sown-grass margin strips. Annual, ruderal therophytes decreased rapidly with strip age, whereas grasses and perennial forbs increased. This suggests that mowing and soil disturbance of sown strips could be used to manage the weed community and maximize the ecosystem services it provides. This research also provides an analytical framework for examining weed community assembly and evaluating weed community dynamics that can be applied to other systems.
Acknowledgments
This study was funded by the ANR Ecoger and ANR-STRA-1 08-02 schemes. We acknowledge the farmers of the Plaine & Val de Sèvres (western France) and Fénay (eastern France) study regions for allowing us to perform floral surveys on their sown-grass margin strips. Finally, the authors acknowledge the anonymous reviewers for feedback that helped to improve the quality of the paper.