There are a number of possible sources of stress for children (Attar, Guerra, & Tolan, Reference Attar, Guerra and Tolan1994). One potentially important and persistent source of stress for children is maternal depression. For example, depressed mothers report more stress in marital and social relationships, their job, finances, and in relations with their children (Hammen et al., Reference Hammen, Gordon, Burge, Adrian, Jaenicke and Hiroto1987). In turn, maternal depression has been shown to be associated with less speaking to their children (McLearn, Minkovitz, Strobino, Marks, & Hou, Reference McLearn, Minkovitz, Strobino, Marks and Hou2006), less responsiveness (Milgrom, Westley, & Gemmill, Reference Milgrom, Westley and Gemmill2004), a greater expression of more negative emotions (Radke-Yarrow, Nottelmann, Belmont, & Welsh, Reference Radke-Yarrow, Nottelmann, Belmont and Welsh1993), and more negative comments directed toward their children (Inoff-Germain, Nottelmann, & Radke-Yarrow, Reference Inoff-Germain, Nottelmann and Radke-Yarrow1992). In general, children with depressed mothers are exposed to a more stressful home environment (Goodman & Gotlib, Reference Goodman and Gotlib1999).
Although there is ample evidence that children of depressed mothers have adverse behavioral and emotional problems (Cicchetti & Toth, Reference Cicchetti and Toth1998; Cummings & Davies, Reference Cummings and Davies1994; Goodman, Reference Goodman, Walker and Dworkin1992; Gotlib & Lee, Reference Gotlib, Lee, Mundt, Hahlweg and Fiedler1996), the effects of maternal depressive symptoms on children's adrenocortical and cardiovascular reactions to acute stress are less well studied. Some research has focused on maternal depression and consequent dysregulation of the child's hypothalamic–pituitary–adrenal (HPA) axis, the adrenocortical system that responds to stress by releasing the steroid hormone cortisol. Although some research has reported higher cortisol in children with depressed mothers (e.g., Ashman, Dawson, Panagiotides, Yamada, & Wilkinson, Reference Ashman, Dawson, Panagiotides, Yamada and Wilkinson2002; Essex, Klein, Cho, & Kalin, Reference Essex, Klein, Cho and Kalin2002), after a careful review of a substantial number of studies involving children experiencing different magnitudes of early adversity, Gunnar and Vazquez (Reference Gunnar and Vazquez2001) concluded that cortisol levels, particularly basal levels, are often lower, not higher, than are those of the study's comparison groups. They speculate that low basal cortisol, associated with early life stress (e.g., caretaker insensitivity, neglect, and abuse) provokes frequent elevations in cortisol that result in downregulation of the HPA axis. Low cortisol, flat daytime production patterns, and blunted cortisol responses to stressors describe what has been termed “hypocortisolism” (Heim, Ehlert, & Hellhammer, Reference Heim, Ehlert and Hellhammer2000).
The effects of maternal depressive symptoms on children's cardiovascular reactions to acute stress are even less well understood. There is evidence of heightened cardiovascular reactions to acute stressors in the context of ongoing background stressors for children (ages 8–10) and adolescents (ages 15–17; Matthews, Gump, Block, & Allen, Reference Matthews, Gump, Block and Allen1997), although some data also show lowered cardiovascular reactivity (Gump & Matthews, Reference Gump and Matthews1999). Possible mechanisms for this effect of background stress on acute stress reactivity include cognitive appraisal bias with a tendency to perceive threat (Chen & Matthews, Reference Chen and Matthews2001), social submissiveness (Goldstein, Trancik, Bensadoun, Boyce, & Adler, Reference Goldstein, Trancik, Bensadoun, Boyce and Adler1999), and increased hostility (Gump, Matthews, & Räikkönen, Reference Gump, Matthews and Räikkönen1999). Although the effects of background stress on acute stress reactivity may be short lived (Gump, Reihman, Stewart, Lonky, & Darvill, Reference Gump, Reihman, Stewart, Lonky and Darvill2005), relatively stable background stressors such as maternal depression may have more prolonged and deleterious effects (Krantz & McCeney, Reference Krantz and McCeney2002).
There is a recognized absence of longitudinal research addressing whether the timing and course of maternal depression moderates the associations between maternal depression and their children's cortisol levels (Gunnar & Donzella, Reference Gunnar and Donzella2002). There are many possible patterns of maternal depressive symptoms over time, and it is unclear which of these patterns might exert the greatest influence on children. For example, maternal depression might have the greatest impact when occurring during the maturation of their child's HPA system during the first year of the child's life (Ashman et al., Reference Ashman, Dawson, Panagiotides, Yamada and Wilkinson2002; Stansbury & Gunnar, Reference Stansbury and Gunnar1994). Alternatively, chronic maternal depression and stress might confer the greatest risk for their children (cf. Essex et al., Reference Essex, Klein, Cho and Kalin2002; Keller et al., Reference Keller, Beardslee, Dorer, Lavori, Samuelson and Klerman1986; Sameroff, Seifer, Zax, & Barocas, Reference Sameroff, Seifer, Zax and Barocas1984). A review of research on the effects of background stress on acute stress reactivity does not offer clarification, as there is a similar recognition in this literature of the need for a better characterization of the timing and currency of background stressors (Gump & Matthews, Reference Gump and Matthews1999). Therefore, the present study will provide a characterization of the pattern of maternal depressive symptoms over their child's life span that corresponds systematically with the child's cardiovascular, adrenocortical, and emotional functioning at 9.5 years of age. We selected this age for our initial assessment of acute stress reactivity because 9.5-year-old children are still young enough to be predominantly prepubertal, and thereby provide an initial assessment prior to the onset of hormone changes in puberty and yet old enough for evaluating the effects of maternal depressive symptom changes over time.
Based on prior findings, we predicted that children of mothers who currently and chronically had high depressive symptoms would show greater cardiovascular reactivity to acute stress tasks, especially because of increases in cardiac output (CO). This prediction is based on the hemodynamic consequence of β-adrenergic activation during the defense reaction (Julius, Reference Julius1995) as well as evidence of significantly heightened CO reactivity in children directly following a potent background stressor, the 9/11 terrorist attacks (Gump, Reihman, Stewart, Lonky, & Darvill, Reference Gump, Reihman, Stewart, Lonky and Darvill2005). Our predictions with respect to baseline cardiovascular and initial cortisol levels were more tentative. Heightened baseline blood pressure is presumed to reflect gradual vascular remodeling (Folkow, Reference Folkow1982) and might not have occurred by age 9.5. As such, we did not predict an effect of maternal depressive symptoms on baseline blood pressure. With respect to cortisol, we predicted that initial cortisol would be higher in children with mothers who are stressed or high in depressive symptoms (Ashman et al., Reference Ashman, Dawson, Panagiotides, Yamada and Wilkinson2002; Essex et al., Reference Essex, Klein, Cho and Kalin2002); however, chronic HPA hyperactivity is presumed to give way to attenuation of the HPA axis response through negative feedback sensitivity (Meaney, Aitken, van Berkel, Bhatnagar, & Sapolsky, Reference Meaney, Aitken, van Berkel, Bhatnagar and Sapolsky1988; cf. Miller, Chen, & Zhou, Reference Miller, Chen and Zhou2007) and, therefore, might be associated with reduced cortisol responses to acute stress (i.e., hypocortisolism; cf. Matthews, Gump, & Owens, Reference Matthews, Gump and Owens2001). Based on this predicted transition from hyperactivity to hypoactivity, we predicted reduced adrenocortical reactivity for children with mothers exhibiting chronic depressive symptoms relative to children with mothers low in depressive symptoms.
Methods
Participants
Participants were recruited in the context of an ongoing longitudinal study of the effects of environmental toxicants on development (Lonky, Reihman, Darvill, Mather, & Daly, Reference Lonky, Reihman, Darvill, Mather and Daly1996; Stewart, Reihman, Lonky, Darvill, & Pagano, Reference Stewart, Reihman, Lonky, Darvill and Pagano2000). As part of this study (the Oswego Children's Study), pregnant women were recruited beginning in 1991 from the only obstetrics practice in the study location, Oswego County, NY. Of the 202 children currently enrolled in the Oswego Children's Study, we included 176 children (94 females, 82 males) in the present analyses. Some children were not included because of an inability to schedule them within the testing window (N = 17), technical problems (N = 4), or refusal (N = 5). Children were tested within 2 weeks of becoming 9.5 years of age. This age was selected to provide a prepubertal assessment of adrenocortical and cardiovascular functioning. To confirm pubertal status, the Pubertal Development Scale (Peterson, Crockett, Richards, & Boxer, Reference Peterson, Crockett, Richards and Boxer1988) was administered to mothers during their child's laboratory visit. In addition to a question regarding menstrual status for girls, five items assessed perceptions of other indicators of pubertal status (e.g., hair growth, growth spurt) on a 4-point scale (1 = not started, 4 = completed).
Physiological recording apparatus
Impedance cardiography and an electrocardiogram (ECG) were used for the calculation of stroke volume (SV), preejection period (PEP), and heart rate (HR). An impedance cardiograph (Model HIC-2000, Bio-Impedance Technology, Chapel Hill, NC) was used for the generation of the impedance waveforms using a Tetrapolar band electrode configuration (Kubicek, Patterson, & Witsoe, Reference Kubicek, Patterson and Witsoe1970). The ECG signal was transduced using two disposable silver/silver chloride electrodes (Meditrace 533) placed on each side of the abdomen below the impedance electrode bands, as well as a ground electrode beside the navel. Processing of the impedance signals and ECG was accomplished using the Cardiac Output Program (COP_WIN, Version 5.04), an on-line computerized videographics system for impedance cardiography analysis developed by Bio-Impedance Technology (distributed by Microtronics Corporation, Chapel Hill, NC). Basal impedance, the first derivative of the pulsatile impedance signal (dZ/dt) and the ECG were sampled by a microcomputer hosting a Microstar analog–digital converter board (Model 820/103). The output of COP_WIN included SV, HR, CO (calculated as the product of mean SV and HR for a given period), PEP, and left ventricular ejection time. COP_WIN calculates SV using the Kubicek equation (Kubicek, Karnegis, Patterson, Witsoe, & Mattson, Reference Kubicek, Karnegis, Patterson, Witsoe and Mattson1966) and ensemble-averaged waveforms for 30-s time periods (28-s ensemble average period with 2 s allowed for storing data). Details of the calculations of the various physiological measures from impedance cardiography can be found in Sherwood et al. (Reference Sherwood, Allen, Fahrenberg, Kelsey, Lovallo and van Doornen1990).
Systolic blood pressure (SBP) and diastolic blood pressure (DBP) were monitored using an IBS Model SD-700A automated blood pressure monitor (IBS Corp., Waltham, MA) with an appropriately sized occluding cuff (either a “pediatric” or “adult small,” based on the size of their upper arm), which was placed on the participant's nondominant arm. The pressure readings were entered into the COP program after the experimental session was over, and the program automatically computed total peripheral resistance (TPR) using the formula:

where TPR is in dyne seconds/centimeters5, CO is in liters/minute, and SBP and DBP are in millimeters of mercury.
Experimental tasks
Mirror tracing
Using modified Eyelines software (Beagley, Reference Beagley1994), participants were asked to use the mouse and cursor to trace a computer image of a star with inverted vertical mouse control (i.e., moving the mouse up caused the cursor to move down) for four trials. In one final trial, horizontal mouse control was inverted such that movement of the mouse left produced cursor movement right (up and down movement was normal). Trial duration was 90 s. Movement off the star produced an intermittent beep (1000 Hz) through headphones. The mirror tracing task produces a cardiovascular response consistent with α-adrenergic activation (Kasprowicz, Manuck, Malkoff, & Krantz, Reference Kasprowicz, Manuck, Malkoff and Krantz1990). A α-adrenergic activation typically produces small to moderate increases in HR and a larger increase in DBP and TPR (Allen & Crowell, Reference Allen and Crowell1989).
Reaction time
A computerized choice reaction time task required the participant to respond as quickly as possible to a 1000-Hz tone presented via headphones by pressing a joystick button, but to refrain from responding to a 2000-Hz tone. Fifteen tones were presented at pseudorandom intervals (with an average interstimulus interval of 16 s) by a microcomputer during the 3-min task. This task was chosen on the basis of past studies indicating that it produces cardiovascular responses consistent with β-adrenergic activation (Allen & Crowell, Reference Allen and Crowell1989). A β-adrenergic activation typically produces moderate increases in HR and SBP as well as substantial reductions in contractility indices (e.g., PEP; Allen & Crowell, Reference Allen and Crowell1989).
Cold pressor
The participant was asked to submerge their dominant arm in a 1-gal. tub with one part ice to one part water for 1 min. Participants were informed of the time remaining during the minute in order to encourage completion of the minute, although the instructions for the task clearly informed participants they were free to withdraw their arm if it became too painful. As a further precaution, pain ratings (1 = not at all painful, 7 = extremely painful) were assessed on a visual analog scale every 10 s, and participants were again reminded they were free to remove their arms if and when they rated the experience as a 5. This task was chosen primarily as a means to induce an adrenocortical response (cf. Bullinger et al., Reference Bullinger, Naber, Pickar, Cohen, Kalin and Pert1984). As such, it was always administered first and salivary collection was timed in relation to the onset of this task.
Procedure
On the day of testing, participants arrived at the laboratory at about 4:30 p.m. (M = 4:28 p.m., SD = 95.7 min) and first signed an assent form while their parents signed a separate consent form approved by the institutional review board of SUNY Oswego. The laboratory session commenced with the measurement of height and weight. These measures were followed by the application of electrodes for impedance cardiography and the ECG. The blood pressure cuff was positioned on the nondominant arm. Each experimental session comprised the following: (a) an initial rest period (10 min), (b) a cold pressor task (1 min with 2-min recovery), (c) an intertask rest (8 min), (d) a choice reaction time task (3 min), (e) an intertask rest (8 min), (f) a mirror-tracing task (90 s, five trials), and (g) a final recovery/rest period (10 min). Although it was impractical to control children's activities during the day prior to testing, the first 7 min of the initial baseline was not used for measurement of physiological variables but rather was designed to reduce this potential source of variability in cardiovascular and adrenergic arousal. During this period, children watched a videotape about Hawaii (selected to be interesting but not stimulating; cf. Matthews et al., Reference Matthews, Gump, Block and Allen1997). During the other rest periods, children completed questionnaires and then, time permitting, continued watching the videotape about Hawaii. Children completed questionnaires during the intertask rest periods. Children were paid $80 for their participation in the current session.
Physiological data collection
Blood pressure and impedance-derived variables
Blood pressure measurement was initiated at the 5-, 7-, and 9-min mark of the initial rest period, at the 0:15-, 1:15-, and 2:15-min mark during the reaction time task (cf. Allen, Matthews, & Sherman, Reference Allen, Matthews and Sherman1997), and at the 0:15-min mark for each trial of the mirror tracing task. Data for HR and impedance-derived variables were collected using a 30-s intersample interval and 28-s ensemble average duration (allowing 2 s for storing data). Collection occurred during the last 3 min of the initial rest period and during the entire reaction time and mirror tracing tasks. Cardiovascular levels were also collected during intertask rests. These levels steadily increased across rest periods as is typical for protocols with repeated acute stress tasks. We used the initial baseline values because it becomes progressively more difficult to detect changes as arousal begins to reach arousal ceilings (cf. Chen, Matthews, Salomon, & Ewart, Reference Chen, Matthews, Salomon and Ewart2002).
Cortisol assessment
To measure adrenocortical reactivity, saliva samples were collected at four points during the stress protocol: at the end of the initial 10-min rest, and then during the acute stress tasks (21 and 40 min following the cold pressor task), and during recovery (60 min following the cold pressor task). Following Kivlighan and Granger (Reference Kivlighan and Granger2006), participants were asked to imagine chewing a piece of their favorite food, while moving their jaws as if they were really chewing and to gently force the pooling saliva through a short plastic straw into a 5-ml cryovial. All samples were immediately frozen at −20ºC until transported on dry ice to Penn State University for cortisol assay.
On the day of testing, all samples were centrifuged at 3000 rpm for 15 min to remove mucins. Samples were assayed for salivary cortisol using a highly sensitive enzyme immunoassay US FDA (510 k) cleared for use as an in vitro diagnostic measure of adrenal function (Salimetrics, State College, PA). The test used 25 µl of saliva, had a lower limit of sensitivity of 0.007 µg/dl, a range of sensitivity from 0.007 to 1.8 µg/dl, and average intra- and interassay coefficients of variation of less than 5% and 10%. All samples were assayed in duplicate, with the average of the duplicates used in all analyses. Cortisol units are expressed in micrograms per deciliter (µg/dl).
Cortisol levels follow a circadian cycle with peak levels in the morning, a steady drop during the morning hours, and a relatively stable plateau in the afternoon to early evening. In addition, cortisol levels are affecting by recent meals. Therefore, all subjects were scheduled to begin the protocol in the afternoon (approximately 4:30 p.m.) and given instructions to have no snacks during the 1 hr prior to testing. If the child reported having a recent snack, the session was either rescheduled or briefly delayed, depending on the timing of the snack. In addition, participants were instructed to (a) avoid dairy products for 30 min prior to collections (restriction based on evidence that some bovine hormones cross-react in immunoassay), (b) rinse their mouths with water 10 min prior to collections and no snacks were provided between sample collections, and (c) not brush their teeth within 1 hr of testing to avoid blood contamination in saliva (two participants were rescheduled because of injuries or surgery in the oral cavity within the last 48 hr; Kivlighan, Granger, Schwartz, Nelson, & Curran, Reference Kivlighan, Granger, Schwartz, Nelson and Curran2004).
Psychosocial variables
Maternal depressive symptoms
The Centers for Epidemiological Studies Depression (CES-D; Radloff, Reference Radloff1977) measure was administered to mothers when participants were 3 months, 6 months, 1 year, 2 years, 4.25 years, 6 years, 7 years, 8 years, and 10 years of age. The CES-D contains 20 statements that describe how one might have felt or behaved in the last week (e.g., “I was bothered by things that usually don't bother me”). Each statement is rated on a 4-point response scale (1 = none of the time, 4 = most or all of the time). The CES-D has excellent internal consistency (range = .85–.90) and reasonable test–retest reliability (average = .57; Radloff, Reference Radloff1977). For participants with 16 or greater valid answers, data were averaged across items and multiplied by 20 to compute a total CES-D score ranging from 0 to 60 with a score of 16 or above considered indicative of at least moderate risk of clinical depression (Radloff, Reference Radloff1977). Although our analytic focus was on CES-D scores (i.e., depressive symptom levels), we also scored and analyzed each assessment using this cutoff of 16. Although some participants had missing CES-D assessments (e.g., 51 participants were missing one assessment), the number of missed assessments was not systematic over time (10, 20, 25, 18, 12, 13, 23, and 13 for Time 1 through Time 8, respectively). Because of the extensive use of potential covariates, we are assuming that the probability of “missingness” is not dependent on any unobserved data, and therefore our data fit the requirements for data that are missing at random (Singer & Willett, Reference Singer and Willett2003). This is a required assumption for multilevel modeling (using PROC MIXED) that includes all participants, even those with some missing data.
Child's depressive symptoms
The Children's Depression Inventory (CDI; Kovacs, Reference Kovacs1982) was administered to participants. The CDI contains 27 items, each of which consists of three statements. For each item, the individual is asked to select the statement that best describes his or her feelings for the past 2 weeks (e.g., “I hate myself” or “I do not like myself” or “I like myself”). The CDI has excellent internal consistency (typical range α = .71–.89, α = .78 in the current sample), test–retest reliability (range = .59–.77 for a 4-week interval), and established validity (Kovacs, Reference Kovacs1982). Appropriate items were reverse scored and the sum of all items was used to create a total depressive symptom score (with a possible range of 0–54). Normative data is available for this measure (Kovacs, Reference Kovacs1982). The factor structure of the CDI suggests five factors: negative mood, interpersonal problems, ineffectiveness, anhedonia, and negative self-esteem. Subscale scores were created based on these factors (Kovacs, Reference Kovacs1982).
Potential confounds
We considered a number of potential confounding variables, including characteristics measured during pregnancy, at birth, and throughout childhood (for the present paper, this included measures through age 9.5). These potential confounds are a standard set of variables that have been considered in our prior publications with this cohort (e.g., Gump, Reihman, Stewart, Lonky, Darvill, et al., Reference Gump, Reihman, Stewart, Lonky, Darvill and Matthews2005; Stewart et al., Reference Stewart, Reihman, Gump, Lonky, Darvill and Pagano2005).
Demographic variables
In the initial assessment of pregnant women, data was gathered on maternal and paternal height and weight, socioeconomic status (SES) using the Hollingshead Index of Social Status (Hollingshead, Reference Hollingshead1975) at 1 and 9.5 years of age, marital status (single item, coded as married or not), number of children, race (single item, coded as White or not), years living at same address (single item, in years), and years living within 50 miles of the Great Lakes (single item, in years). After the birth of their child, additional information was gathered on day care use and information regarding the quality of the home environment using the Home Observation for Measurement of the Environment (HOME; Bradley & Caldwell, Reference Bradley and Caldwell1984).
Maternal characteristics
As part of an extensive assessment of maternal health and nutrition questionnaire, a number of assessments were included. Prepregnancy weight and weight gain during pregnancy were assessed. Maternal self-reported stress was measured using a 7-point scale (1 = very relaxed, 7 = very stressed) for the year prior to becoming pregnant, since learning of the pregnancy (first half), and during the second half of the pregnancy. Other self-reported measures included maternal illness history (using illness checklist), vitamins during pregnancy, prescription medication during pregnancy, nonprescription medication during pregnancy, cigarettes smoked during pregnancy, second-hand smoke exposure during pregnancy, as well as consumption for alcohol, herbal tea, decaffeinated coffee, diet soda, decaffeinated soda, and caffeinated beverages. The quality of the mother’ nutrition during pregnancy was assessed using the New York State Pregnant Women General Screening Questionnaire (State of New York, 1988). Complications during pregnancy were assessed using a score based on the Obstetrics Complications Scale (Littman & Parmalee, Reference Littman and Parmalee1978; Parmalee, Reference Parmalee1974). Finally, as a measure of maternal cognitive functioning, the Peabody Picture Vocabulary Test (Dunn & Dunn, Reference Dunn and Dunn1981) was administered to mothers at 1 year postpartum.
Infant and birth characteristics
The characteristics assessed under this category were child gender, birth weight (grams), head circumference (inches), gestational age (weeks, based on obstetrician's estimated day of confinement), and cord blood erythrocyte porphyrin levels (µg/dl). In addition, a physical examination of infants provided a measure of neuromuscular and physical maturity using parameters outlined by Ballard, Novak, and Driver (Reference Ballard, Novak and Driver1979).
Environmental toxicants
Cord blood was assessed for levels of polychlorinated biphenyls (PCBs), lead, dichlorodiphenyldichloroethylene, and hexachlorobenzene. Maternal hair mercury was measured for the first and second half of the pregnancy. Details regarding the methods for measuring these variables can be found elsewhere (Stewart et al., Reference Stewart, Darvill, Lonky, Reihman, Pagano and Bush1999, Reference Stewart, Sargent, Reihman, Gump, Lonky, Darvill, Hicks and Pagano2006).
Childhood characteristics
Additional measures during childhood included blood lead levels (abstracted from physician and state records; Gump, Reihman, Stewart, Lonky, Darvill, et al., 2005), body mass index (BMI; using height and weight measures taken in our laboratory at 9.5 years of age), and an updated HOME score at age 7.
Data analysis
Data reduction
Baseline cardiovascular levels were computed by averaging across the final 3 min of the initial rest period. Change scores for SBP, DBP, HR, and PEP were computed by subtracting these baseline levels from the task means. For impedance-derived variables involving volume measures (CO, SV, and TPR), percent change from baseline to task was used because of questions about the accuracy of absolute levels of these variables (Miller & Hovrath, Reference Miller and Hovrath1978; Sherwood et al., Reference Sherwood, Allen, Fahrenberg, Kelsey, Lovallo and van Doornen1990). For cortisol, reactivity was computed by subtracting the initial level from task and recovery levels (samples collected during and after the acute stress protocol).
Cardiovascular change scores were standardized within the mirror tracing and reaction time stress tasks and then averaged across these two tasks (cf. Matthews, Salomon, Brady, & Allen, Reference Matthews, Salomon, Brady and Allen2003). We took this approach because these two tasks were significantly correlated on a number of the cardiovascular indices. Furthermore, averaging across tasks typically improves the reliability of cardiovascular reactivity assessment (Kamarck & Lovallo, Reference Kamarck and Lovallo2003) and averaging responses across these same tasks (with the addition of two other tasks) has been shown with a larger sample to predict future blood pressure in children (Matthews et al., Reference Matthews, Salomon, Brady and Allen2003). Because of missing data and refusals, we did not use cardiovascular measures obtained during the cold pressor task (cf. Gump, Reihman, Stewart, Lonky, & Darvill, 2005; Gump, Reihman, Stewart, Lonky, Darvill, et al., 2005). Although the order for the reaction time and mirror tracing tasks was counterbalanced, the cold pressor task was always administered first to provide ample time for a cortisol response and recovery without corresponding increases in time demands on participants. It is therefore essential that we consider possible effects of the cold pressor task on subsequent tasks. We found no evidence of such carryover. First, blood pressure and impedance-derived variables were not significantly higher when a task immediately followed the cold pressor task relative to when a task was administered last (ps > .30 for order effect across cardiovascular indices with the exception of HR). Second, although cardiovascular reactivity to the mirror tracing task was moderately correlated with reactivity to the reaction time task (significant correlations were found for HR, PEP, CO, SV, and TPR, ps < .05), neither of these tasks was significantly correlated with reactivity to the cold pressor task on any of the cardiovascular indices (ps > .15). Third, the time children were able to tolerate the cold pressor task was not significantly related to most of the cardiovascular reactivity indices measured during the mirror tracing task or reaction time tasks regardless of order. In sum, cardiovascular responses to the mirror tracing and reaction time tasks represent independent assessments of acute stress reactivity unaffected by prior reactions to the cold pressor task.
Analytic models
SAS PROC MIXED (SAS Institute, 1996) was used to fit multilevel models (Singer, Reference Singer1998; Singer & Willett, Reference Singer and Willett2003). These models considered time (in terms of child's age) of the maternal depressive symptom assessment as a time-varying predictor of maternal depressive symptoms. Both time of maternal depressive symptom measurement and the model intercept were specified as random effects (i.e., differing in value for each subject) and all other effects were entered as fixed. These models tested whether differing characteristics of children at 9.5 years of age were associated with significantly different trajectories of maternal depressive symptoms during the prior 9.5 years (the final measure of maternal depressive symptoms was actually administered at age 10; however, this assessment was closest to the 9.5 year assessment of cardiovascular and adrenocortical functioning). We chose the first-order autoregressive structure (TYPE = AR[1]) for the variance–covariance matrix. Variables were centered on the sample mean to improve interpretation of results (Singer & Willett, Reference Singer and Willett2003). Time was centered from the final assessment (i.e., recomputed so that the intercept reflected differences at the final assessment of maternal depressive symptoms) enabling the model intercept to serve as the statistical test of the association between recent maternal depressive symptoms and their child's cardiovascular and adrenocortical functioning. All models include covariate controls for potential confounds. The following procedure was used to select these covariates. Any child or maternal characteristic related to maternal depressive symptoms at p < .20 in univariate multilevel models were entered into a single multivariate model. Backward elimination was then used to reduce model complexity beginning with the variable predicting the least unique variance. The final model contained all variables still related to maternal depressive symptoms at p < .20. Because cardiovascular parameters are conceptually and mathematically interrelated, our subsequent analysis of multiple parameters is not expected to substantially inflate Type II error and, therefore, we have retained the traditional p < .05 level of significance.
Results
Sample characteristics
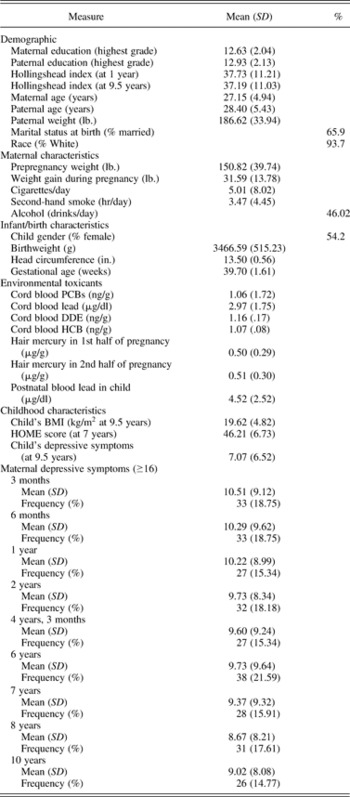
Table 1 presents prenatal, perinatal, and current characteristics of the children and their mothers in this sample. All children were tested within 2 weeks of being 9.5 years of age. All children in the Oswego Children's Study were born at the same hospital and prenatal and perinatal characteristics of this sample were previously found to not differ significantly when compared to all babies born at this same hospital (Lonky et al., Reference Lonky, Reihman, Darvill, Mather and Daly1996). Moreover, although the Oswego Children's Study was designed as a study of environmental toxicant effects, the level of toxicant exposure in this cohort is still considered very low (Stewart et al., Reference Stewart, Sargent, Reihman, Gump, Lonky, Darvill, Hicks and Pagano2006). At the time of testing, only 3.69% of girls had begun menses. Mean scores on the PDS items were 1.38 for boys and 1.87 for girls (1 = not started, 2 = barely started). These data suggest that most children in this sample were prepubertal at the time of testing. Table 1 also includes descriptive data for our measures of depressive symptoms in children and their mothers. Maternal depressive symptoms were highest at 3 months postpartum and steadily declined thereafter. This level and pattern of depressive symptoms is consistent with another study of postpartum depressive symptoms in a community sample (Beeghly et al., Reference Beeghly, Weinberg, Olson, Kernan, Riley and Tronick2002). The number (and percentage) of women with CES-D scores of ≥16, which is the cutoff commonly considered as indicating risk for a major depressive episode (Penninx et al., Reference Penninx, Beekman, Honig, Deeg, Schoevers and van Eink2001), are also reported in Table 1. The percentage of women with elevated depressive symptom scores (M = 17.3% across assessments) is consistent with other studies of depression in women of child-bearing age in community samples (e.g., 14.3%; Knight, Williams, McGee, & Olaman, Reference Knight, Williams, McGee and Olaman1997) although somewhat lower than some studies of the postpartum period (e.g., 27.5%; Ballard, Davis, Cullen, Mohan, & Dean, Reference Ballard, Davis, Cullen, Mohan and Dean1994). In addition, depressive symptom scores for children in our sample (M = 7.01, SD = 6.50) were consistent with normative data for this age group (M = 8.94, SD = 6.99 for children in the fourth grade; Smucker, Craighead, Craighead, & Green, Reference Smucker, Craighead, Craighead and Green1986). In our sample, only 5.81% of the sample had elevated (≥19) CDI scores.
Characteristics of participants (N = 176)

Note: BMI, body mass index.
Model covariates
As described above, all child and maternal characteristics (variables listed in the Methods Section under Potential Confounds) related to maternal depressive symptoms at p < .20 in univariate multilevel models were first entered into a single multivariate model and then backward elimination was used to reduce model complexity. The final model in which all variables continued to relate to maternal depressive symptom trajectories at p < .20 included the following variables: maternal caffeine consumption, dieting, self-reported illness, vitamin use, stress, secondhand smoke, and HOME environment during pregnancy, ts (162) = −2.33, 2.37, 5.45, −1.34, 3.27, 3.04, and −3.08, respectively, ps < .20, child's Ballard optimality and neuromuscular scores as well as head circumference at birth, t (162) = −5.51, 1.70, and −1.61, respectively, ps < .20, mother's height and Peabody Picture Vocabulary Test score (Dunn & Dunn, Reference Dunn and Dunn1997), and education for the head of household, ts (162) = 5.53, −2.04, and −4.23, respectively, ps < .05. Interactions with time (i.e., differences in the maternal depressive symptom slopes) were found for maternal dieting during pregnancy, t (1278) = 1.86, p < .10, the child's Ballard optimality score, t (1278) = −2.82, p < .005, maternal prepregnancy stress, t (1278) = −2.47, p < .05, and education for head of household, t (1278) = −3.56, p < .001. These variables were included in all subsequent multilevel models. Notably, toxicant exposures (e.g., PCBs, lead) were unrelated to maternal depressive symptom trajectories and therefore were not considered as potential confounding variables. This does not rule out the possibility that toxicant exposures have effects on children's cardiovascular and adrenocortical systems independent of maternal depression trajectories (e.g., Gump et al., Reference Gump, Stewart, Reihman, Lonky, Darvill and Parsons2008).
Children's baseline cardiovascular and HPA levels
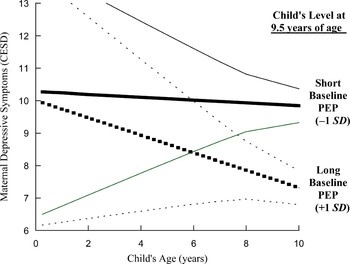
After covariate control for potential confounds, maternal depressive symptom trajectories were considered as a function of baseline cardiovascular and initial adrenocortical levels. As shown in Figure 1, a shorter baseline PEP was associated with significantly higher levels of recent maternal depressive symptoms, t (152) = −3.33, p < .005. However, baseline PEP was not associated with significantly different slopes of maternal depressive symptoms over time, t (1269) = −1.78, p < .10. This (and subsequent) figures are plotted using predicted values generated by SAS from the multilevel model when entering a value of ±1 SD from the mean for the child's predictor variable (e.g., baseline PEP) and entering all covariates at their mean level. For PEP at baseline, −1 SD from the mean in the present sample (low) corresponds to a value of 83.38 ms and +1 SD (high) corresponds to a value of 102.68 ms. No other significant differences in baseline impedance-derived, BP, or HR variables were found (ps > .50).
Maternal depression trajectories for children found to have relatively short or long baseline PEP at 9.5 years of age (standard error bands shown with lighter lines around each trajectory).

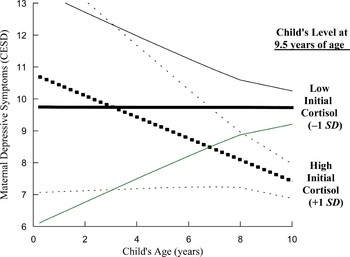
Lower initial cortisol was associated with a significantly smaller change in depressive symptoms over time (i.e., a smaller slope) and significantly higher levels of recent maternal depressive symptoms, t (1234) = 2.72, p < .01, and t (156) = 3.10, p < .005, respectively. In other words, children with lower initial cortisol had mothers showing chronic elevation in depressive symptoms following childbirth. These maternal depressive symptom trajectories are shown in Figure 2. For initial cortisol, −1 SD from the mean in the present sample (low) corresponds to a value of 0.14 µg/dl and +1 SD (high) corresponds to 0.18 µg/dl.
Maternal depression trajectories for children found to be low or high in initial cortisol at 9.5 years of age (standard error bands shown with lighter lines around each trajectory).

Children's cardiovascular and HPA responses to acute stress
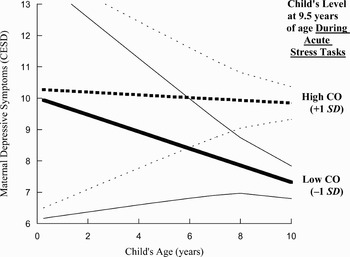
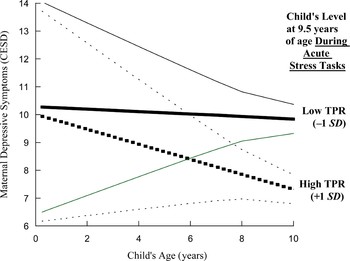
In multilevel models we considered maternal depressive symptom trajectories as a function of their child's cardiovascular responses to acute stress. Heightened SV and CO responses to acute stress in children were associated with significantly higher levels of recent maternal depressive symptoms, ts (158) = 2.57 and 2.87, ps < .05. The CO change from baseline is illustrated in Figure 3, with −1 SD from the mean in the present sample (low) corresponding to a value of −0.30 l/min and +1 SD (high) corresponding to 0.46 l/min. In addition, a diminished TPR response to acute stress was associated with significantly higher levels of recent maternal depressive symptoms, t (156) = −2.35, p < .05. This maternal depressive symptom trajectory was nearly identical to CO and SV, although reversed (see Fig. 4). Cortisol reactivity was not significantly associated with maternal depressive symptom trajectories (ps < .10). However, initial cortisol was significantly associated with SBP and TPR responses to acute stress (rs = .16, ps < .05), after controlling for BMI, gender, and SES.
Maternal depression trajectories for children with low or high CO responses to acute stress at 9.5 years of age (standard error bands shown with lighter lines around each trajectory).

Maternal depression trajectories for children with low or high TPR responses to acute stress at 9.5 years of age (standard error bands shown with lighter lines around each trajectory).

Children's depressive symptoms
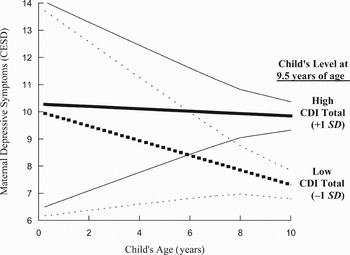
As shown in Figure 5, the total score on the CDI was associated with significantly different trajectories of maternal depressive symptoms. Greater depressive symptoms in children were associated with significantly higher levels of recent maternal depressive symptoms, t (160) = 2.30, p < .05. For children's depressive symptoms, −1 SD from the mean in the present sample (low) corresponds to a CDI score of 0.55 and +1 SD (high) corresponds to score of 13.59. Analysis of the CDI subscales revealed that greater anhedonia and negative mood in children was associated with higher levels of recent maternal depressive symptoms, t (160) = 3.27, p < .001, and t (160) = 1.93, p = .05, respectively. Notably, there was no evidence that children's depressive symptoms mediated the aforementioned effects with cardiovascular and adrenocortical levels or vice versa. Results above did not significantly change in multivariate models including both cardiovascular or adrenocortical measures as well as the child's depressive symptoms. Furthermore, children's depressive symptoms were unrelated to initial cortisol (r = .01, p > .25).
Maternal depression trajectories for children found to be either low or high in depressive symptoms at 9.5 years of age (standard error bands shown with lighter lines around each trajectory).

Maternal trajectories of elevated depressive symptoms (CES-D scores ≥ 16)
We repeated the analyses above using maternal trajectories of elevated depressive symptoms (i.e., using a dichotomous score of either <16 or ≥16 for the CES-D). Using this analytic approach, the results with baseline levels remained essentially unchanged. A shorter baseline PEP was associated with significantly higher levels of recently elevated maternal depressive symptoms, t (152) = −2.30, p < .05. No other significant differences in baseline impedance-derived variables were found (ps > .50). As in the analysis of maternal depressive symptoms, lower initial cortisol was associated with a significantly smaller change in depressive symptoms over time (i.e., a smaller slope) and significantly higher levels of recently elevated maternal depressive symptoms, t (1234) = −2.46, p < .01 and t (156) = −2.34, p < .05, respectively. The analysis of trajectories of elevated maternal depressive symptoms yielded a somewhat different pattern of associations with their children's cardiovascular responses to acute stress. Unlike the analysis of depressive symptoms, SV, CO, and TPR responses to acute stress in children were not significantly associated with trajectories of elevated maternal depressive symptoms (ps > .20). However, using trajectories of elevated maternal depressive symptoms, children's greater DBP responses were associated with significantly higher levels of recent maternal depressive symptoms, t (159) = 2.41, p < .05. As in the analysis of depressive symptom trajectories, greater depressive symptoms in children were associated with significantly greater levels of recently elevated maternal depressive symptoms, t (160) = 2.18, p < .05. Analysis of the CDI subscales revealed that greater anhedonia and negative mood in children was associated with greater levels of recently elevated maternal depressive symptoms, t (152) = 2.63, p < .01, and t (160) = 1.94, p = .05, respectively.
Discussion
Mothers with chronically elevated depressive symptoms during the 10 years following childbirth had children exhibiting greater SV and CO as well as reduced TPR responses to acute stress tasks at 9.5 years of age. This pattern is consistent with a “cardiac” response to acute stress (Sherwood & Turner, Reference Sherwood and Turner1995), a response presumed to result from sympathetic nervous system stimulation of cardiac and vascular β-adrenergic receptors. This pattern of response is consistent with the early stages of “hyperkinetic borderline hypertension” (Julius, Reference Julius1995), a pathophysiological process beginning with chronically heightened CO and low vascular resistance and eventually leading to reduced CO through blunted β-adrenergic responsiveness (Julius, Randall, Esler, Kashima, & Ellis, Reference Julius, Randall, Esler, Kashima and Ellis1975) and greater vascular resistance through vascular remodeling (Folkow, Reference Folkow1982). Our further finding of heightened baseline blood pressure suggests that this transition to borderline hypertension (i.e., SBP > 130 or DBP > 90) might have already begun at 9.5 years of age for these children. Furthermore, the analysis of trajectories of elevated maternal depressive symptom scores (i.e., CES-D scores ≥ 16) revealed greater DBP responses to acute stress (but no longer significant associations with increases in SV and CO reactivity), suggesting that this process may be accelerated when these children are confronted with chronically elevated maternal depression rather than merely chronically elevated depressive symptoms.
In the present study, we have only a single measure of the children's cardiovascular and adrenocortical functioning at 9.5 years of age, and therefore we cannot establish the potential influence of maternal depression trajectories on children's age-related changes in cardiovascular and adrenocortical functioning. For example, adolescents (ages 15–17) have been shown to have a more β-adrenergic response to stress responses relative to children (ages 8–10; Allen & Matthews, Reference Allen and Matthews1997). In addition, although the prevalence of borderline hypertension in children at this age is low (in the range of 2–5%; McCrory, Reference McCrory and Loggie1992), it is expected to increase with age (Muntner, He, Cutler, Wildman, & Whelton, Reference Muntner, He, Cutler, Wildman and Whelton2004).
Effects of maternal depressive symptoms on children's cardiovascular and adrenocortical functioning did not occur specifically during an early “sensitive period,” as shown with other outcomes (e.g., the child's cognitive and language development; Sohr-Preston, Reference Sohr-Preston2006). The pattern of maternal depressive symptoms that uniquely produced significant effects in their child was chronically elevated maternal depressive symptoms during the first 10 years of the child's life. An increase in cardiovascular reactivity to acute stress specifically in the context of chronic stress has been demonstrated in some other research (Lepore, Miles, & Levy, Reference Lepore, Miles and Levy1997)
In addition to these differences in cardiovascular responses to acute stress, mothers with chronically elevated depressive symptoms had children that exhibited significantly lower initial cortisol levels in the absence of significant associations with cortisol reactivity to acute stress. This pattern of findings is consistent the conclusion reached in a recent review of this literature (Gunnar & Donzella, Reference Gunnar and Donzella2002), namely, that lower basal cortisol is associated with early life adversity, such as chronic stress (Flinn & England, Reference Flinn and England1995), a negative family environment (Granger et al., Reference Granger, Serbin, Schwartzman, Lehoux, Cooperman and Ikeda1998), or physical abuse (Cicchetti & Rogosch, Reference Cicchetti and Rogosch2001). In apparent contrast, one recent study found significantly heightened morning cortisol for children born to mothers exhibiting postnatal depression (Halligan, Herbert, Goodyer, & Murray, Reference Halligan, Herbert, Goodyer and Murray2004). However, this study did not find associations between postnatal maternal depression and evening cortisol nor was maternal depression measured over the child's life span. Therefore, it is possible that chronically elevated maternal depression (as opposed to early maternal depression) is uniquely associated with hypocortisolism by 9.5 years of age. The “hypocortisolism” (Fries, Hesse, Hellhammer, & Hellhammer, Reference Fries, Hesse, Hellhammer and Hellhammer2005) we observed is presumed to arise from an increased sensitivity to the negative feedback of circulating corticosteroids (Houshyar, Galigniana, Pratt, & Woods, Reference Houshyar, Galigniana, Pratt and Woods2001). Although our fundings suggest that 10 years of exposure to maternal depressive symptoms is associated with hypocortisolism in children. However, in the absence of a longitudinal data for these children, it is not known whether shorter or longer exposure to maternal depressive symptoms would have resulted in different consequences to the adrenocortical system.
Hypocortisolism may permit increased cardiovascular responses to acute stress (Roy, Kirschbaum, & Steptoe, Reference Roy, Kirschbaum and Steptoe2001; Sapolsky, Romero, & Munck, Reference Sapolsky, Romero and Munck2000); however, there may be a notable exception for patients with stress-related disorders, wherein hypocortisolism is associated with augmented catecholamine responses to acute stress events (Fries et al., Reference Fries, Hesse, Hellhammer and Hellhammer2005). In the present study, lower basal cortisol was associated with significantly reduced SBP and TPR responses to acute stress, suggesting a permissive role for basal cortisol. However, the association of adrenal, cortical, and cardiovascular responses with maternal depressive symptoms were independent (i.e., unchanged when entered simultaneously in the prediction of maternal depressive symptom trajectories). This pattern suggests that hypocortisolism was not the mechanism whereby maternal depressive symptoms trajectories affected cardiovascular responses to acute stress. Perhaps chronically elevated maternal depressive symptoms induce β-adrenergic sensitivity (Sherwood & Turner, Reference Sherwood and Turner1995) and thereby the “cardiac” response to acute stress we observed.
Although hypocortisolism may not have been directly involved in the cardiovascular effects we observed, these two systems may be integrally related in the organism's adaptation to chronic background stress. Perhaps chronic maternal depressive symptoms upregulate cardiac reactivity as a means to “increase the capacity and tendency of individuals to detect and respond to environmental dangers and threats” (Ellis, Jackson, & Boyce, Reference Ellis, Jackson and Boyce2006) and simultaneously downregulate the HPA axis as a means to protect the organism from the harmful effects of high allostatic load (Hellhammer, Schlotz, Pirke, & Stone, Reference Hellhammer, Schlotz, Pirke and Stone2004). Put simply, perhaps chronic background stress produces the potentially damaging (but adaptive) upregulation in cardiac reactivity balanced with a compensatory (and protective) downregulation in the HPA axis. Hypocortisolism may be a fairly common phenomenon associated with stress and challenge in human development that provides the means for remaining resilient in the face of a continuously stressful life (Gunnar & Vazquez, Reference Gunnar and Vazquez2001; Heim et al., Reference Heim, Ehlert and Hellhammer2000).
In the present study, children reporting more depressive symptoms (particularly anhedonia and negative mood, subscales of the CDI) had mothers showing chronically elevated depressive symptoms. This finding is consistent with prior research suggesting that children with depressed mothers are at increased risk of developing depression (Cummings & Davies, Reference Cummings and Davies1994; Gelfand & Teti, Reference Gelfand and Teti1990; Goodman, Reference Goodman, Walker and Dworkin1992; Gotlib & Lee, Reference Gotlib, Lee, Mundt, Hahlweg and Fiedler1996). Hypercortisolemia and nonsuppression of cortisol secretion following dexamethasone administration in depressed patients is well documented (Heuser, Reference Heuser1998). Therefore, evidence in the current study of reduced initial cortisol and heightened depressive symptoms suggests one possible mechanism whereby depression in mothers is transmitted to their children, namely, through the dysregulation of the child's HPA axis (Halligan et al., Reference Halligan, Herbert, Goodyer and Murray2004; Halligan, Herbert, Goodyer, & Murray, Reference Halligan, Herbert, Goodyer and Murray2007; Ronsaville et al., Reference Ronsaville, Municchi, Laney, Cizza, Meyer and Haim2006). An association between children's depressive symptoms and cortisol levels, absent in the present study of prepubertal children (cf. Puig-Antich et al., Reference Puig-Antich, Dahl, Ryan, Novacenko, Goetz and Goetz1989), may yet develop in adolescence (Forbes et al., Reference Forbes, Williamson, Ryan, Birmaher, Axelson and Dahl2006).
There are a few concerns with the current study that should be discussed. First, children's cardiovascular, adrenocortical, and emotional functioning was assessed only once, at 9.5 years of age. Therefore, we were unable to address potential effects of maternal depressive symptoms on the developmental changes in children such as the hypothesized emergence of an association between depressive symptoms and cortisol levels in adolescence. Second, although a number of potential confounds were measured and controlled, there are other unmeasured variables that might account for the association between maternal depressive symptom trajectories and adrenocortical and cardiovascular functioning at 9.5 years of age. For example, chronic marital discord and stress could precipitate both maternal depression and, independently, alter their child's adrenocortical and cardiovascular functioning. Our present study does however control for prenatal maternal stress in all analyses. Third, we do not have any information regarding paternal behavior and depression. Negative paternal behaviors could produce chronic maternal depression and marital stress, and thereby function as chronic stress for the children. We do not have a more detailed history of marital satisfaction and status, and therefore it is still possible that marital dissolution was a consequence of maternal depression rather than contributor to the depression. Fourth and finally, although cortisol levels are presumed to affect the development of depression (Goodyer, Herbert, & Tamplin, Reference Goodyer, Herbert and Tamplin2003), we did not demonstrate an association between cortisol and depressive symptoms in the current study. However, our ability to measure a cortisol response to acute stress was somewhat constrained because children's cortisol level following the cold pressor task did not differ significantly from our initial cortisol sample. Therefore, our initial cortisol sample may not have represented a true baseline level but rather may have reflected the child's response to the novel psychological setting (cf. Luecken, Reference Luecken1998) or activities prior to testing (Larson, Gunnar, & Hertsgaard, Reference Larson, Gunnar and Hertsgaard1991). Another possibility is that children's depressive symptom scores (generally low in our sample) had a restricted range making it difficult to observe associations with cortisol reactivity.
Conclusions
The current study shows that mothers with chronically elevated depressive symptoms following childbirth have children that exhibit a heightened cardiac response to acute stress tasks at 9.5 years of age. This pattern of response and corresponding increase in baseline blood pressure is consistent with the early stages of hyperkinetic borderline hypertension (Julius, Reference Julius1995). Mothers exhibiting chronically elevated depressive symptoms following childbirth also had children with diminished initial cortisol levels, perhaps reflecting an appropriate adaptation to the predicted future social environment (Ellis et al., Reference Ellis, Jackson and Boyce2006). Finally, chronically elevated maternal depressive symptoms were associated with greater depressive symptoms in their children. Whether these cardiovascular and adrenocortical effects of maternal depressive symptom trajectories place these children at an increased risk of cardiovascular disease in adulthood will await further longitudinal study.