INTRODUCTION
Perennial ryegrass is the dominant forage grass species in temperate agricultural regions worldwide. In temperate agricultural regions, when utilized well, home-grown feed is cheaper than purchased feed (Fulkerson & Doyle Reference Fulkerson and Doyle2001). Matching production systems to grass growth has been identified as the most profitable system for meat and milk production (O'Donovan et al. Reference O'Donovan, Lewis and O'Kiely2011).
Evaluation of the most appropriate grass species for local conditions is widely conducted by many countries globally, including member states of the EU, New Zealand, Australia and individual states within the USA. In the Republic of Ireland, the Department of Agriculture, Food and the Marine (DAFM) are responsible for the value for cultivation and use (VCU) grass variety evaluation trials, which are part of the published recommended list (RL) system. Varieties are submitted annually by grass breeders across Europe for performance evaluation under the Irish evaluation system. Prior to 1995 the RL focused solely on total dry matter (DM) yield, but since 1995 a number of economically important traits have been published including spring and autumn growth data, as well as DM digestibility (DMD) and water-soluble carbohydrate content of grasses. In response to industry requirements and establishing normality with other RLs, in 2014 DAFM introduced a simulated grazing management protocol (eight to nine harvests per year) in addition to the two-cut silage management protocol, which was previously operated. The objective of the simulated grazing management protocol was to ensure that the protocol under which varieties were selected matched the production systems at farm level. Internationally, in the last decade, there has been a clear move to quantify the seasonal distribution of DM yield and an increased focus on grass DMD to improve animal performance through grazing in grass variety evaluation trials (O'Donovan et al. Reference O'Donovan, Lewis and O'Kiely2011; Wims et al. Reference Wims, McEvoy, Delaby, Boland and O'Donovan2013; Cashman et al. Reference Cashman, McEvoy, Gilliland and O'Donovan2016). Despite the improvements in plant breeding, long-term sward persistency is a trait that requires considerably more investigation. This is despite the fact that re-seeding is expensive and the length of time that a cultivar lasts in a sward has a significant effect on profitability (Shalloo et al. Reference Shalloo, Creighton and O'Donovan2011). Little research effort has focused on this trait despite the fact that in countries such as New Zealand, grassland persistency is a key economic issue for grassland farmers (Clark Reference Clark and Mercer2011).
Grass tiller numbers decline with age in swards and the rate of this decline varies depending on variety (Camlin & Stewart Reference Camlin and Stewart1978), soil fertility and management among other factors. As the number of tillers declines, the proportion of open space in the sward increases, which can in turn become invaded by unsown weed and grass species (which are less productive) (Marriott et al. Reference Marriott, Fisher, Hood and Smith1997). This has important implications for sward nutritive value and production. Sward density is assessed in the VCU trials using sward ground score (GS), which is a visual estimation of the proportion of perennial ryegrass present in the sward (Charles & Valentine Reference Charles and Valentine1978). Clouting & Hawkins (Reference Clouting and Hawkins1966) reported that grass persistency can be measured by evaluating the decline in percentage of ground covered by sown species, i.e. ground score change (GS∆). Sward renewal is an expensive practice (Doyle & Wilkins Reference Doyle, Wilkins and Corrall1984; Shalloo et al. Reference Shalloo, Creighton and O'Donovan2011), hence variety persistency and lifetime performance are important issues to address at farm level (Creighton et al. Reference Creighton, Gilliland, Delaby, Kenendy, Boland and O'Donovan2012).
The objectives of the present paper were to describe a total economic merit index for perennial ryegrass varieties, the Pasture Profit Index (PPI). This includes all key production traits as well as persistency, secondly to develop the methodology for application of the PPI within the Irish grass evaluation system and finally to identify the relative contributions (weightings) of each trait within the PPI with updated economic values.
MATERIALS AND METHODS
There are three main components to the present study, which include:
-
• Trait definition and their capture in VCU protocols;
-
• Development and description of a methodology to quantify the relative economic merit of each variety based on individual traits;
-
• Application of economic values to individual variety data and rank varieties based on their total economic merit.
Four main trait groups, which have a large influence on grass-based system profitability (McEvoy et al. Reference McEvoy, O'Donovan and Shalloo2011) form the basis of the PPI. These traits encompass various aspects of the grazing system, including DM production (spring, summer and autumn), grass quality (April–July), silage DM production (first and second harvests) and sward persistency. The mechanism for the calculation of each trait's economic impact is outlined in McEvoy et al. (Reference McEvoy, O'Donovan and Shalloo2011). In summary, the economic values for a one-unit change in each trait were determined using the Moorepark Dairy Systems Model (Shalloo et al. Reference Shalloo, Dillon, Rath and Wallace2004), which simulated a physical change in each trait of interest independently. The difference between the farm net margin before and after the change was simulated and divided by the physical change in the trait of interest, in order to determine the economic value for a one-unit change in each trait (McEvoy et al. Reference McEvoy, O'Donovan and Shalloo2011).
Trait definition
Value for cultivation and use variety performance data
Data from the DAFM VCU trials between the years 2011 and 2012 were available to quantify relative performance of each perennial ryegrass variety for each trait. In total, 39 varieties were evaluated under the VCU protocol. These perennial ryegrass varieties were sown in experimental plots at five locations in 2010 and 2011 throughout Ireland. Site locations were: Backweston, Co. Kildare (53°22′N, 6°30′W); Raphoe, Co. Donegal (54°52′N, 7°36′W); Fermoy, Co. Cork (52°08′N, 8°17′W); Athenry, Co. Galway (53°18′N, 8°45′W) and Kildalton, Co. Kilkenny (52°21′N, 7°20′W). Eighteen intermediate heading (nine diploid and nine tetraploid) and 21 late heading (13 diploid and eight tetraploid) perennial ryegrass varieties were sown. The experiment was a randomized complete block design with three replicates (blocks) of each variety sown at each site. To account for individual seed weight diploid varieties were sown at a seeding rate of 30 kg/ha, while tetraploid varieties were sown at 40 kg/ha and all plots were 7 × 1·63 m in size. A simulated grazing management regime (defoliations made every 3–4 weeks from mid-March to mid-October) with eight defoliations was implemented at the Backweston, Raphoe, Fermoy and Athenry sites over two harvest years, 2011 (year 1) and 2012 (year 2). At the Kildalton site, a two-cut silage management regime was imposed, with the first defoliation in early April, followed by the first silage harvest in late May and the second silage harvest in late June. Three simulated grazings followed, with the final defoliation in mid-October. Fertilizer nitrogen (N) was applied following all defoliations until mid-September. A total of 310 kg N/ha was applied per year across protocols. Annual soil fertility analyses were completed at each site to determine required phosphorus (P), potassium (K) and sulphur (S) levels, which were applied based on soil fertility guidelines to meet grass growth requirements.
Across all sites all plots were harvested with a Haldrup mower (Haldrup GmbH, Ilshofen, Germany) to a residual height of approximately 4·5 cm. All harvested material was weighed and a 300 g sample was dried at 60 °C in an oven for 48 h to determine DM content. The dried samples from the Backweston site were milled and analysed for DMD using near-infrared spectroscopy technology (Burns et al. Reference Burns, Gilliland, Grogan, Watson and O'Kiely2013).
Data from the four simulated grazing management sites were used to determine the variety performance for the seasonal DM yield parameters. Seasonal production was defined as spring (all herbage harvested prior to April 10), mid-season (herbage harvested from April 11 to August 10) and autumn (herbage harvested from August 11 to the final harvest in November). First and second cut silage harvest data were determined from the respective cuts at the Kildalton site.
Variety persistency
Ground score is a visual estimation of the proportion of sward perennial ryegrass content. It is scored on a scale of 0 to 9, where 0 = 0% perennial ryegrass content and 9 = 100% perennial ryegrass content (Camlin & Stewart Reference Camlin and Stewart1976). Ground score was estimated at the end of years 1 and 2 (i.e. December 2011 and 2012) in the VCU trials, at the four simulated grazing management sites. Estimates were validated using inclined point quadrat (Wilson Reference Wilson1960) taken across the sward density range. The difference in GS between these 2 years was defined as GSΔ. For each one-unit loss in GS, a corresponding loss in DM yields of 1683 kg DM/ha was applied (Cashman et al. Reference Cashman, O'Donovan, Gilliland, McEvoy and Diskin2014). The rate of GSΔ post year 2 was assumed to be 54% of the rate of change between years 1 and 2 (Cashman et al. Reference Cashman, O'Donovan, Gilliland, McEvoy and Diskin2014). Re-seeding was deemed necessary when a variety reached 50% of its initial DM yield. Therefore, using GSΔ and the projected yield, the number of years required for a cultivar to reach 50% of its initial yield was calculated and used to determine the rates of re-seeding in the sward.
Statistical analysis
Statistical analyses were conducted using the SAS statistical package (SAS Institute 2009).
Value for cultivation and use dataset
A linear mixed model using PROC HPMixed was used to analyse the VCU dataset. Variety, sowing year and harvest year were included as fixed effects. Location was nested within block and location-block was nested within plot were included as random effects, with the following model:
 $$Y_{ijkl} = \mu + H_i + S_j + V_k + B_l (L_m ) + P_n (B_l L_m ) + \varepsilon _{ijklnm} $$
where μ = mean; H i = harvest year effect (i = 1–2); S j = sowing year effect (j = 1–2); V k = variety effect (k = 1–39); B l = Block effect (l = 1–3); L m = location effect (m = 1–4); P n = plot effect (n = plot number); and e ijklnm = residual error term.
Silage dry matter yield and quality dataset
Information on silage DM yield and quality data were obtained from a linear mixed model in PROC HPMixed using the same model as described for the VCU data. Data however were only available from one site. The following model was used:
 $$Y_{ijk} = \mu + H_i + V_j + B_k + P_{\rm l} (B_k ) + e_{ijkl} $$
where μ = mean; H i = harvest year effect (i = 1–2); V j = variety effect (k = 1–39); B k = Block effect (k = 1–3); P l = plot effect (l = plot number) and e ijkl = residual error term.
Ground score change dataset
Information on GSΔ were obtained using a model similar to that outlined for silage and quality but omitting harvest year as GSΔ was calculated on the difference between years 1 and 2 at four individual sites.
Across the three datasets (i.e. VCU, silage DM yield and quality and GSΔ) least-square means and the corresponding standard error were generated for each variety.
Economic values
As is normal with industry indices, economic values are adjusted based on projected input and output prices at 24–36-month intervals. The economic values for each trait (Table 1) were updated according to current price information (Teagasc 2013) and were applied to the difference between the relative performance of each variety for a trait and a base value for each trait. The update of these input values is very important as it reflects the industry price challenges and ensures that the economic values assigned for each trait reflects the direction of the industry. This is a similar approach to the methodology assigned to other indices (e.g. Irish dairy cow – economic breeding index (Veerkamp et al. Reference Veerkamp, Dillon, Kelly, Cromie and Groen2002)).
Economic values (€ per ha/year) for dry matter yield, quality, persistency and silage yield

DM, dry matter; DMD, dry matter digestibility.
Base values and variety rankings
In order to compare all varieties on an economic merit index, base values were established for each trait to determine the relative difference in performance for each variety. Veerkamp et al. (Reference Veerkamp, Dillon, Kelly, Cromie and Groen2002) reported a similar strategy for the development of an economic breeding index for dairy cows. Where available, commercial farm data were integrated as the base values (DM yield and sward persistency). Where commercial farm data were not available, average data from the VCU plot trials were used (grass quality and silage DM production).
Base value for dry matter production
The base level of DM production was calculated using the average level of DM production on commercial grassland farms in Ireland, i.e. 9·1 t DM/ha (Shalloo Reference Shalloo and French2009). As no data were available on the seasonality of DM yield at farm level, the entire DAFM VCU dataset was used to determine the proportion of DM yield in the spring, mid-season and autumn periods. In this dataset, the mean level of DM production during harvest years 1 and 2 across all varieties was 10·8 t DM/ha of which 0·13, 0·66 and 0·20 was grown during the spring, mid-season and autumn periods, respectively. These proportions were then applied to the mean production at farm level (9·1 t DM/ha), which resulted in relative DM yields of 1·22 (spring), 6·02 (mid-season) and 1·86 t DM/ha (autumn), respectively.
It is anticipated that this base value will remain in place for the next number of years and that the base value updates will happen on an infrequent basis and whenever new and more relevant data becomes available.
Base value for quality
To determine the base level for quality the VCU dataset of 39 varieties was used. The base value for quality was determined using the data from two harvest years, with the average of all varieties and all replicates used to determine the base value for each individual month.
The monthly base value for quality (g/kg DMD) was as follows: 849·6 in April, 848·6 in May, 814·4 in June and 810·2 in July.
Base value for silage dry matter yield
The base values for first and second cut silage DM yield were determined using the 2 years averaged data on 39 varieties at the Kildalton site (VCU data), with all the varieties and all replicates included in the generated values. The base value for first and second cut silage DM yield was 3785 and 3693 kg DM/ha, respectively.
Base value for variety persistency
The economic value for persistency was calculated in the current study; the economic value was determined based on a re-seeding cost of €672 per ha calculated based on up to date costs and prices (Teagasc 2013). The economic merit of each variety for persistency was determined by dividing the re-seeding cost by the number of years a variety persists, with varieties surviving the yield threshold for 12 years (Creighton et al. Reference Creighton, Kennedy, Shalloo, Boland and O'Donovan2011) or longer getting a value of €0 and all varieties having a shorter period having a negative economic value.
Twelve years were set as the maximum length a variety could persist before re-seeding was considered optimum because of the availability of better varieties. Therefore, the base value was 12 years (Creighton et al. Reference Creighton, Kennedy, Shalloo, Boland and O'Donovan2011): this was the calculated longevity of swards on specialist dairy farms. The number of years in which a variety yielded greater than 50% of its first full year DM yield was quantified as the number of years for which that variety persisted. The methodology is outlined below to quantify persistency in € per ha/year:
 $$\eqalign{&\displaystyle{{{\rm cost}\;{\rm of}\;{\rm reseeding}\;( - \euro \,{\rm per}\,{\rm ha})} \over {{\rm no}. \,{\rm of}\;{\rm years}\;{\rm cultivar \; persists}\;{\rm (max}\,{\rm 12}\,{\rm years)}}} \cr & \qquad+ \displaystyle{{{\rm cost}\;{\rm of}\;{\rm reseeding}\;(\euro\, {\rm per}\,{\rm ha})} \over {12}}}$$
Relative contribution (trait weighting)
Defining the relative weighting of each trait within the economic index is crucial to understand the importance of each trait, which cannot be determined by the economic value alone. The relative contribution on an individual trait is depicted as the product of the genetic standard deviation times the economic value of that trait divided by the sum of the same calculation for all traits in the index (VanRaden Reference VanRaden2002):
 $${\rm Emphasis}_i = \displaystyle{{\left \vert {a_i \times \sigma _i} \right \vert} \over {\sum\nolimits_{\,j = {\rm 1}}^n {\left \vert {a_j \times \sigma _j} \right \vert}}} (100)$$
where a i and a j are the economic value for traits i and j, respectively and σ i and σ j are the genetic standard deviation for traits i and j, respectively.
Conaghan & Casler (Reference Conaghan and Casler2011) reported estimates for heritability (h2) and genetic standard deviation for key grass performance traits. The estimated genetic standard deviation values which were used to calculate the relative emphasis for the present study were: 0·40 for DM yield, 0·50 for persistency and 0·25 for in vitro DMD.
RESULTS
Variety performance
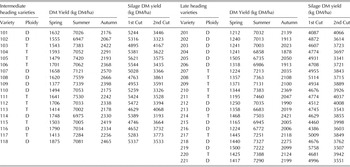
Table 2 presents the total DM yield data for the 39 varieties included in the current study. There was a significant effect of variety (P < 0·001) on spring, mid-season and autumn DM yield. The difference in spring DM yield was 0·710 t DM/ha between the highest yielding variety (Cv118) and the lowest yielding variety (Cv215). In the mid-season period, there was 0·876 t DM/ha difference in DM yield between the highest (Cv108) and lowest (Cv213) yielding varieties. In autumn, the difference was 0·79 t DM/ha between the highest and lowest yielding varieties with Cv108 (2·67 t DM/ha) and Cv204 (1·88 t DM/ha), respectively. Mean silage DM yields were 5·0 ± 0·37 t DM/ha (first cut) and 3·7 ± 0·46 t DM/ha (second cut). Varieties Cv219 and Cv103 had the highest first (5·76 t DM/ha) and second (4·17 t DM/ha) cut DM yields, respectively, whereas Cv201 (4·09 t DM/ha) and Cv114 (3·19 t DM/ha) had the lowest DM yields for first and second cut silage, respectively.
Biological dry matter yield data for 39 cultivars in the value for cultivation and use dataset

DM, dry matter; D, diploid; T, tetraploid.
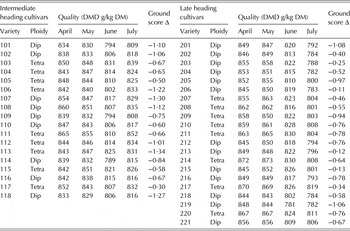
Table 3 presents the DMD and GSΔ of each variety. The mean DMD (g/kg DM) of the varieties was across the mid-season period 849 ± 9·6 (April), 848 ± 11·1 (May), 814 ± 11·8 (June) and 810 ± 16·4 (July). In April and May Cv214 had the highest DMD value, while Cv103 had the highest DMD in June and Cv111 had the highest DMD in July; Cv118 had the lowest DMD in April and May and Cv219 had the lowest DMD in June and July.
Biological quality and ground score change data for 39 varieties in the value for cultivation and use dataset

DM, dry matter; DMD, dry matter digestibility; Dip, Diploid; Tetra, Tetraploid.
There was large variation between varieties in terms of GSΔ. The variety with the largest GSΔ was Cv113 (−1·34) compared with Cv206, which had the smallest GSΔ (−0·11). This difference in GSΔ equated to a 7-year difference in the length of time that a variety would persist before re-seeding was required.
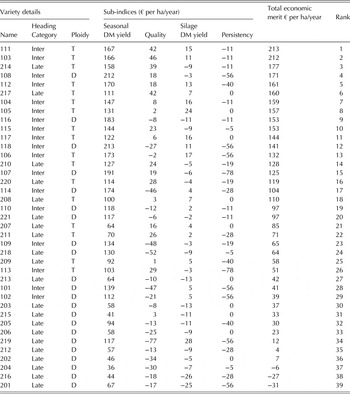
Economic merit and varieties
Table 4 presents the economic performance of each variety for each trait within the PPI, termed economic merit. Table 4 also includes the economic merit of each variety for the sub-indices. Combining the economic values and agronomic data to a total economic merit index, the PPI, gives a clear picture of the benefit of one variety over another. There was variability from one variety to another across all sub-indices. For seasonal DM yield, the extremes in economic merit ranged from €36 to €213. When focusing on grass quality, the range in economic merit was from −€77 to €46. For silage the range in economic merit was from −€26 to €28. The range in sward persistency economic merit was from −€78 (a variety surviving only 5 years) to €0 (a variety persisting for >12 years). Within the sub-index values, varieties could have low economic merits for some of the four individual traits, but could still perform well within the total economic merit index. This emphasizes the importance of using the sub-indices to choose grass varieties for particular requirements. When a variety has a poor economic merit across a number of the sub-indices then it is likely to have a low overall ranking.
Total economic merit index (€ per ha per year) and rank of 39 perennial ryegrass varieties

DM, dry matter; D, diploid; T, tetraploid.
Relative contribution
The relative contribution of the seasonal yield traits within the index were spring 15·4%, summer 5·7% and autumn 9·3%. The relative contribution of first cut silage DM yield was 9·4% and of second cut silage DM yield was 5·5%. The relative contribution of April quality was 0·4%, of May quality was 5·0%, of June quality was 7·8% and of July quality was 7·1%. The relative contribution of persistency within the index was 34·4%.
DISCUSSION
The Food Harvest 2020 (DAFF 2010) and now the updated Food Wise 2025 reports (DAFM 2015), both Irish government policy documents, set clear production targets for Irish ruminant production systems. Both reports highlight the importance of maintaining Ireland's grass-based competitiveness and sustainability in the pursuit of projected ruminant targets. There are clear improvements required in the areas of grass production and utilization across dairy, beef and sheep enterprises. Current levels of perennial ryegrass proportions within swards are low on commercial dairy farms (O'Donovan et al. Reference O'Donovan, Kennedy, Lalor, Berry, Butler and Dillon2013), with the average sward comprising just 0·30 to 0·40 perennial ryegrass. The low level of grassland re-seeding that occurs on commercial farms is partly responsible for this poor figure (Grogan & Gilliland Reference Grogan and Gilliland2011). Recent research has shown that the rate of genetic gain of perennial ryegrass for DM production was +0·51% per year under silage management and +0·35% per year under simulated grazing management (McDonagh et al. Reference McDonagh, McEvoy, O'Donovan, Gilliland, Hopkins, Collins, Fraser, King, Lloyd, Moorby and Robson2014). Relative to other crops such as wheat (1·0% per year; Calderini et al. Reference Calderini, Dreccer and Slafer1995) and maize (2·6% per year; Tollenaar Reference Tollenaar1989), these gains are small and may help explain the below optimum levels of re-seeding observed at Irish farm level.
Total economic merit indices have previously been used to rank animals economically (Veerkamp et al. Reference Veerkamp, Dillon, Kelly, Cromie and Groen2002) and have been adopted successfully in many countries including New Zealand, USA and Ireland. A number of studies have attempted to identify the most valuable traits affecting grass-based ruminant production in Ireland (Dillon et al. Reference Dillon, Crosse, Stakelum and Flynn1995; Drennan & McGee Reference Drennan and McGee2009) and internationally (Casler Reference Casler2001; Wilkins & Humphreys Reference Wilkins and Humphreys2003; DAFF 2009). The traits of importance for the Irish total economic merit grass index (PPI) were identified as those which have the largest effect on the economic performance of a grassland system (O'Donovan et al. Reference O'Donovan, Lewis and O'Kiely2011). Additionally, it was considered of critical importance that the traits selected must be easily measurable in grass evaluation (Wilkins & Humphreys Reference Wilkins and Humphreys2003) and improvement in each trait must be achievable through plant breeding.
Various efforts in the past have focused on the development and application of economic values for pasture performance (Doyle & Elliott Reference Doyle and Elliott1983; Brookes et al. Reference Brookes, McRae, Gray, Cameron, Baker, Crush and Humphreys1993; Chapman et al. Reference Chapman, Bryant, McMillan and Khaembah2012). One of the most comprehensive of these was conducted by McEvoy et al. (Reference McEvoy, O'Donovan and Shalloo2011), but that analysis did not include a defined persistency trait or a full description on how the index could be applied (using base values).
The generation of base values for economic ranking of varieties within the PPI provides a mechanism for ranking individual varieties based on their relative performance centred on a number of key traits, which affect the profitability of grass-based ruminant production systems. At present, limited commercial farm data are available to determine the base values for grass DM production. The base values for seasonal grass DM production, grass quality and silage DM production were calculated from the performance of varieties currently within the VCU dataset, as there are no commercial farm data available. Commercial farm data are currently being collected through PastureBase Ireland (Griffith et al. Reference Griffith, O'Donovan, Geoghegan, Shalloo, Hopkins, Collins, Fraser, King, Lloyd, Moorby and Robson2014) and these data will be incorporated within the index in the future. Generation of farm data for grass quality and silage production will also be of benefit to the industry as it will be possible to analyse the effect of variety performance on farm for such traits.
Perennial ryegrass persistency
Many factors are associated with poor pasture persistency, pasture thinning and failure, only some of which are genetic (Stewart & Hayes Reference Stewart and Hayes2011). Previous research has suggested that the most appropriate method of monitoring variety persistency is to link DM production to changes in sward perennial ryegrass content for each variety (Camlin & Stewart Reference Camlin and Stewart1976). Another study suggested that pasture persistency is determined by the DM yield stability and tiller density of a variety over years (Stewart & Hayes Reference Stewart and Hayes2011). In a 4-year assessment of persistency, Camlin & Stewart (Reference Camlin and Stewart1978) reported that little extra precision was gained by delaying assessment until the third or fourth years as the rank order of varieties with respect to persistency remained largely unchanged. In another study, it was stated that persistency assessments made at the end of the second harvest year provide reliable predictions of the relative persistency of varieties (Camlin & Stewart Reference Camlin and Stewart1978). Varieties are known to vary in persistency and it has been suggested that better persistency is associated with high tiller density at any one point in time (Camlin & Stewart Reference Camlin and Stewart1978; Wilkins & Humphreys Reference Wilkins and Humphreys2003). Camlin & Stewart (Reference Camlin and Stewart1978) also stated that despite low plant and tiller densities and a higher proportion of bare ground, even in the fourth harvest year, tetraploid varieties produced high yields from sown varieties and were no worse than average for weed ingress level.
The present study attempted to separate GS from GS∆, as GS∆ is more reflective of the level of sward persistency and its change than GS itself. The approach used in the present study was to quantify the relationship between GSΔ and yield change, allowing the potential lifetime performance of the variety to be estimated and thus determining the requirements for re-seeding. Therefore, all of the persistency related costs are directly related to an annual re-seeding cost. Other studies have used different approaches around yield stability over time (Malcolm et al. Reference Malcolm, Smith and Jacobs2014; Ludemann et al. Reference Ludemann, Jacobs and Smith2015). While there are pros and cons with all approaches, the methodology chosen for the present study was framed to avoid any level of double-counting of production effects from the persistence effects. By separating out these two components, similar to the approach in the current study, the two components are treated independently. This allows both traits to be included in the same index.
The ability of a variety to maintain its DM yield and level of perennial ryegrass content across years determines variety longevity. The development of a persistency trait around GS∆ acts as a predictor trait for yield stability over time and therefore the requirements for re-seeding. An important concept used in the present study was that of applying the GS∆ measurement, rather than absolute GS, and linking it to the DM production of the sward as an indicator of a variety's useful life. One of the definite difficulties in estimating persistency is the use of short-term cutting plots in grass variety evaluations, because the short-term performance has to be extrapolated to predict longer term persistency. There is a fine line to be treaded around providing useful accurate information, in a timely fashion, and cost around the grass evaluation process. This delicate balance will require close monitoring and research in relation to on-farm variety evaluations. Tools such as PastureBase Ireland (Griffith et al. Reference Griffith, O'Donovan, Geoghegan, Shalloo, Hopkins, Collins, Fraser, King, Lloyd, Moorby and Robson2014) will allow for the continuous supply of on-farm variety evaluation process on commercial farms to be generated, thus allowing the long-term GS∆ to be assessed as well as quantifying variety lifetime DM production performance. In fact, both these concepts need to be fused together to track the lifetime persistency and DM production profile. Over time the generation of this new data could allow adjustments to be introduced to variety persistency evaluation. Ideally a molecular marker which could track allele frequency expressed over the varieties lifetime would be the gold standard measurement to adapt to; again, current research plans are focussing in this direction.
Economic performance
The economic values were calculated based on the assumption of an intensive grass-based dairy production system. Beard (Reference Beard1988) reported that genetic progress in animal selection could be maximized in economic terms if selection was based on the method of index selection. This selection methodology should be directed towards a breeding objective comprising the sum of the breeding values for traits of economic importance weighted according to their relative economic value (Beard Reference Beard1988). In general, the traits measured in VCU trials dictate the direction of grass breeding programmes. In the Republic of Ireland, the VCU protocol has refocused in recent years to capture new traits of key economic importance on commercial grassland farms thereby redirecting grass-breeding objectives towards these goals (Grogan Reference Grogan and Lynch2013). The PPI quantifies the effect of each trait on the variety performance and identifies the appropriate emphasis that should be placed on each trait, and then combines all of the information together in a single total economic merit index. It is crucial to the development of appropriate grass varieties for the grassland industry that the VCU protocol continues to reflect the key traits of importance at commercial farm level and that these are then ranked through one single index.
Sub-indices within the PPI identify the relative strengths and weaknesses of individual traits or groups of traits of varieties. Summing the merits of individual traits gives the total variety merit index, although it is acknowledged to be unlikely (but possible) that any one variety will possess all positive traits. Within the varieties in the present study there was a range in total economic merit from −€31 to €213 per ha/year. The highest ranking variety (Cv111) achieved the highest total economic merit even though it had a negative economic merit for persistency. The lowest performing varieties had several traits with negative values indicating weaknesses in a number of traits. As the index develops it will influence the direction of breeding and evaluation programmes in a positive way and will ensure that a clear focus is placed on the requirements of grassland farmers.
Relative contribution (trait weightings)
In cattle breeding, selection indices quantifying the change in relative contribution over time has been a useful tool to identify the response to selection achieved through animal breeding. Over time, as new traits are incorporated into the index or as the economic values of existing traits change, there will be an adjustment to the emphasis on each trait. In the interim, the PPI presents clear information to the grassland industry to ensure the focus of their breeding programme is on the traits of economic importance for a grass-based production system. The weightings within the PPI are balanced, on DM production traits, grass quality and sward persistency. It is likely, as with all indices, that new traits will be developed and will gain further importance in the future. Integrating on-farm variety performance is the most likely next step; however, traits such as suitability for animal grazing and disease resistance probably will also be considered.
IMPLICATIONS
The use of the PPI enables the identification of varieties which will provide the greatest economic contribution to a ruminant grazing system. The sub-indices identify the relative strengths and weaknesses of individual varieties. The index ranks varieties based on their economic benefits and will ultimately result in an increase in the use of superior varieties which result in higher profitability for the industry as a whole. It will allow grass seed retailers and farmers to choose varieties that will meet their requirements and maximize profitability. The index will be strengthened further by the adoption of commercial grassland farm data from PastureBase Ireland. These data will feed directly into providing more baseline production data and in addition will give the long-term performance of grass varieties on commercial farms. It is important that the VCU protocol used in the evaluation of perennial ryegrass varieties reflects the requirements of the end users in the grassland industry. The use of protocols around simulated grazing and silage ensures that varieties which excel in either protocol can be identified.
The authors would like to acknowledge the Technical assistance of Michael Feeney, Flor Flynn and Jim Nash. Research Stimulus Funding (RSF) from the Department of Agriculture, Food and the Marine and Irish Dairy farmers dairy levy funding is also gratefully acknowledged.