An estimated 4% of hospitalized patients develop a healthcare-associated infection (HAI) each year in the United States. These infections are associated with increased mortality, length of stay, and cost.Reference Magill, Edwards and Bamberg 1 In response, mandatory public reporting of HAIs has emerged as a method to increase accountability and incentivize hospitals to decrease their infection rates.Reference Fung, Lim, Mattke, Damberg and Shekelle 2
Although most states in the United States currently require public reporting of selected HAI rates, the impact of this strategy on clinical practice is unclear.Reference Muller and Detsky 3 Similar strategies have had unanticipated effects in the past. For example, in procedural outcomes, public reporting has been associated with decreased utilization of the associated intervention.Reference Klevens, Edwards and Richards 4 – Reference Joynt, Blumenthal, Orav, Resnic and Jha 6 Quality measures have also unexpectedly shifted clinical practice, with the measure of time to first antibiotic for pneumonia leading to inappropriate antibiotic use.Reference Fung, Lim, Mattke, Damberg and Shekelle 2 , Reference Pines, Isserman and Hinfey 5
Previous research on public reporting of HAI has evaluated reporting accuracy, infection rates, and organizational implications.Reference Fung, Lim, Mattke, Damberg and Shekelle 2 , Reference Muller and Detsky 3 , Reference Backman, Melchreit and Rodriguez 7 , Reference Uchida, Stone, Conway, Pogorzelska, Larson and Raveis 8 Few studies have analyzed the potential effects on clinical practice. We hypothesized that clinicians who feel pressured to lower reportable rates of central line–associated bloodstream infection (CLABSI) could be avoiding the diagnosis by sending fewer blood cultures or prescribing longer antibiotic courses. We therefore aimed to determine whether mandatory public reporting of CLABSI was associated with changes in the use of blood cultures and antibiotics. We examined this question in pediatric and neonatal intensive care units (ICUs), where CLABSI is the most common HAI.
METHODS
Study Design
We conducted an interrupted time-series analysis of blood culture and antibiotic utilization in pediatric ICUs (PICUs) and neonatal ICUs (NICUs) located in states with mandatory reporting of CLABSI. We identified state-specific implementation dates by contacting infection preventionists at each hospital and collected data from each hospital during the 18 to 24 months before and after its implementation date.
To determine temporal trends across the study period, we analyzed hospitals that had not implemented mandatory public reporting of CLABSI. Specifically, we collected data across the collective study period (2004–2012) from children’s hospitals in states that had not implemented mandatory or voluntary public reporting of any HAI. The Boston Children’s Hospital Committee on Clinical Investigation approved the study protocol.
Data Source
We obtained data from the Pediatric Health Information System (PHIS), an administrative database that includes demographic, coding, and billing data from tertiary care pediatric hospitals in the United States. At the time of our study, 43 hospitals were included in the PHIS database. PHIS data quality and reliability are ensured jointly by the Children’s Hospital Association and participating hospitals. For our analyses of hospitals with and without mandatory reporting, data from 21 hospitals were exported as combined monthly totals for each PICU or NICU. Hospitals with more than 6 months of inconsistent or missing data for patient days, number of blood cultures, or antimicrobial days were excluded.
Outcome Definitions
We evaluated rates of monthly blood cultures and antibiotic days per 1,000 patient-days. For antibiotic utilization, we evaluated the number of patient-days on which any “broad-spectrum” intravenous antibiotic was ordered, a measure we call “antibiotic days” that is equivalent to “length of therapy” in prior studies.Reference Polk, Hohmann, Medvedev and Ibrahim 9 Our definition of “broad-spectrum” was similar to previous definitions and included vancomycin, linezolid, daptomycin, third- and fourth-generation cephalosporins, carbapenems, β-lactams combined with β-lactamase inhibitors, fluoroquinolones, aminoglycosides, and tigecycline.Reference Gerber, Newland and Coffin 10 We also evaluated antibiotic “days of therapy” (DOT), a measure that counts the individual antibiotics on each day.Reference Polk, Hohmann, Medvedev and Ibrahim 9 Whereas 10 days of 2 antibiotics equals 10 antibiotic days (length of therapy), the same course equals 20 DOT.
Covariate Selection
We collected data for independent variables that previous studies had associated with antibiotic use, blood culture use, and/or CLABSI. These variables included age at admission,Reference Claridge, Pang, Leukhardt, Golob, Carter and Fadlalla 11 case-mix index,Reference Gerber, Newland and Coffin 10 parenteral nutrition,Reference Wylie, Graham and Potter-Bynoe 12 vasopressor use,Reference Wylie, Graham and Potter-Bynoe 12 infection,Reference Gerber, Newland and Coffin 10 surgery,Reference Gerber, Newland and Coffin 10 mechanical ventilation,Reference Claridge, Pang, Leukhardt, Golob, Carter and Fadlalla 11 dialysis,Reference Odetola, Moler, Dechert, VanDerElzen and Chenoweth 13 blood transfusion,Reference Wylie, Graham and Potter-Bynoe 12 , Reference Elward and Fraser 14 radiology studies,Reference Yogaraj, Elward and Fraser 15 extracorporeal membrane oxygenation,Reference Odetola, Moler, Dechert, VanDerElzen and Chenoweth 13 complex chronic conditions,Reference Elward and Fraser 14 , Reference Feudtner, Hays, Haynes, Geyer, Neff and Koepsell 16 and central venous catheter (CVC) placement.Reference Wylie, Graham and Potter-Bynoe 12 , Reference Yogaraj, Elward and Fraser 15
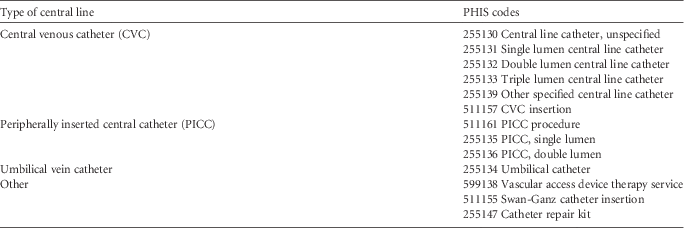
In our definition of radiology studies, we included only studies that would require patient transport, specifically magnetic resonance imaging or computed tomography.Reference Yogaraj, Elward and Fraser 15 CVC placement was identified by procedure and supply codes (Table 1). We also evaluated immunodeficiency, solid organ or hematopoietic stem-cell transplant, surgical complication, and medical complication as potential covariates.
PHIS Codes Used to Capture Central Venous Catheter Utilization

NOTE. PHIS, Pediatric Health Information System.
For all covariates, we collected data as (a) the number of days contributed by patients with a particular diagnosis or procedure or (b) the number of days on which a particular procedure, diagnosis, or medication was recorded. Covariates with more than 20% unrecorded data were excluded from our analysis. These included transplant, medical complication, dialysis, extracorporeal membrane oxygenation, and transfusion.
CVC Subgroup Analysis
We performed a subgroup analysis on patients with CVCs. We identified this population on the basis of diagnostic and billing codes for central line procedures, care, and complications (Table 1). To validate our identified combination of CVC codes, we reviewed patient-level data at our institution. From the 1,183 patients identified by our CVC codes, we randomly selected 50 medical charts to verify CVC placement. We also generated a list of unique patients with known CVC on the basis of our CLABSI cases for 2009 and calculated the proportion of these patients who were captured by the designated codes.
Statistical Analysis
We modeled all outcomes as log-transformed rates, using generalized linear mixed-effects models with auto-correlated residuals to determine the adjusted rate ratios (ARRs). We incorporated random effects for intercept and slope.
For our adjusted models, we included covariates that changed from before to after implementation and were associated with the specified outcome. Association with outcome was evaluated by generalized linear models. Changes between pre- and postimplementation periods were evaluated by 2-sided t test, with log-transformation of rate variables and clustering by hospital. Covariates were selected for entry at P<.2 and then dichotomized by median for incorporation into adjusted models.
For the 4 hospitals with 9 years of data, we used generalized estimating equations to determine annual trend. Because this group represented a small sample with different baseline characteristics from our “study” hospitals, including case mix index, surgery rates, malignancy rates, and CVC use, we did not attempt to directly compare this group to study hospitals. Unless otherwise specified, 2-sided P<.05 indicated statistical significance. Statistical analyses were performed with SAS, version 9.3 (SAS Institute).
RESULTS
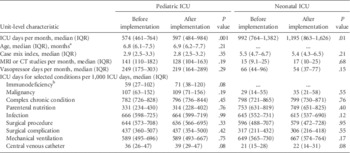
We identified 17 hospitals in 9 states that had implemented mandatory public reporting of CLABSI during our study period and provided consistent data in PHIS for the NICU or PICU. We identified 4 hospitals in 4 states that had never passed mandatory or voluntary reporting requirements. One study hospital was located in a state that required reporting only in the NICU and was therefore excluded from the PICU group. One hospital had 21 months of missing data in the NICU and was excluded from the NICU group only. As a result, 16 hospitals constituted each of the PICU and NICU groups. Implementation dates for public reporting ranged from July 2005 through April 2010 and lagged behind legislation dates by 6 to 27 months. Hospital characteristics before and after implementation are shown in Table 2. Although ICU days per month increased between the 2 periods, no covariates changed significantly.
Intensive Care Unit (ICU) Characteristics Before and After Implementation of Mandatory Public Reporting of Central Line–Associated Bloodstream Infection

NOTE. CT, computed tomography; IQR, interquartile range; MRI, magnetic resonance imaging.
a Age not included in neonatal ICU analysis.
b Immunodeficiency with >20% unrecorded data in the neonatal ICU.
Blood Culture Utilization
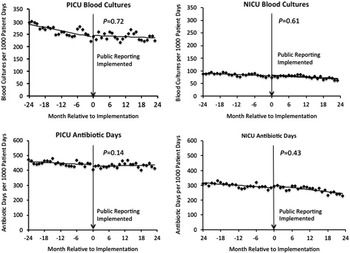
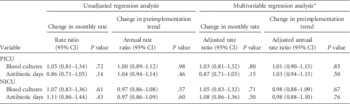
The median monthly blood culture rate was 228 (interquartile range [IQR], 180–290) per 1,000 patient-days in the PICU and 79 (60–100) per 1,000 patient-days in the NICU. The median culture rate per ICU admission was 1.14 (IQR, 0.81–1.65) in the PICU and 1.32 (1.02–1.77) in the NICU. Before implementation, there was no significant trend in blood culture utilization in the PICU (annual ARR, 0.92 [95% CI, 0.84–1.01], P=.10) or NICU (0.96 [0.88–1.05], P=.35) (Figure 1). Interrupted time-series analysis demonstrated no significant changes in the rate of blood culture utilization and no new trends after mandatory reporting (Table 3 and Figure 1).
Unadjusted monthly rates of blood culture and antibiotic utilization before and after implementation of mandatory public reporting of central line–associated bloodstream infection. Time is shown relative to state-specific implementation months (month 0) with fitted trend lines indicating the period before and after implementation. P values represent the change in monthly rate after implementation of mandatory reporting. NICU, neonatal intensive care unit; PICU, pediatric intensive care unit.

Changes in Blood Culture and Antibiotic Utilization After Implementation of Mandatory Public Reporting of Central Line–Associated Bloodstream Infection

NOTE. NICU, neonatal intensive care unit; PICU, pediatric intensive care unit.
a Multivariable regression models were adjusted for covariates that varied between pre- and postimplementation periods and were associated with the selected outcome. In the PICU, blood cultures were adjusted for radiology study and immunodeficiency; antibiotic days were adjusted for radiology study and malignancy. In the NICU, both outcomes were adjusted for radiology study, vasopressor days, infection, and mechanical ventilation.
Antibiotic Utilization
Over the entire study period, the median (IQR) monthly antibiotic days per 1,000 patient-days (length of therapy) was 441 (368–523) in the PICU and 286 (220–374) in the NICU. There were no significant trends in the preimplementation period in the PICU (annual ARR, 1.00 [95% CI, 0.93–1.07], P=.97) or NICU (0.94 [0.86–1.02], P=.14) (Figure 1). Implementation of mandatory public reporting did not impact the monthly rate or annual trend for antibiotic days (Table 3 and Figure 1).
As a second measure of antibiotic utilization, we evaluated antibiotic DOT. Median (IQR) monthly DOT per 1,000 patient-days was 638 (507–793) in the PICU and 390 (290–532) in the NICU. In adjusted interrupted time-series analysis, mandatory public reporting did not impact the monthly rate of antibiotic DOT in the PICU (ARR, 0.86 [95% CI, 0.67–1.11], P=.25) or NICU (1.12 [0.84–1.50], P=.44). There was also no change in trend for antibiotic DOT after mandatory public reporting in the PICU (annual ARR, 1.03 [95% CI, 0.92–1.16], P=.59) or NICU (0.98 [0.85–1.12], P=.72).
Patients With CVCs
In assessing HAI surveillance data from our hospital, we found that all ICU patients with CLABSI (n=32), and therefore known CVC, were identified by our selected PHIS codes (Table 1) during 2009. In a random subset of 50 PICU or NICU patients from our hospital identified in PHIS with these codes, 49 (98%) had a central line documented in their medical record during this same period. No single diagnostic code captured more than 51% of identified patients.
The PHIS codes with the highest capture were central line catheter unspecified (51%), PICC procedure (18%), and PICC single lumen (16%). Central venous catheter insertion identified less than 1% of the population. In the PICU, patients who had at least 1 CVC code accounted for 59% of patient-days, 47% of blood cultures, and 69% of antibiotic days. In the NICU, this population accounted for 71% of patient-days, 59% of blood cultures, and 74% of antibiotic days. Similar to our full study population, there was no significant change in the rate of blood culture or antibiotic utilization in the NICU or PICU after implementation of mandatory public reporting among patients with a CVC code (Online Supplementary Table).
Hospitals Without Mandatory Public Reporting
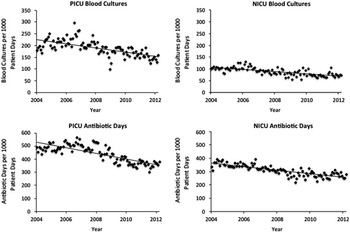
Monthly rates of blood cultures and antibiotic days (length of therapy) for the 4 hospitals without public reporting are displayed in Figure 2. Between 2004 and 2012, monthly blood culture rates decreased in the PICU (annual ARR, 0.96 [95% CI, 0.96–0.97], P<.0001) and NICU (0.95 [0.92–0.97], P<.0001). Antibiotic utilization rates showed no significant decline in the PICU (annual ARR, 0.97 [95% CI, 0.93–1.01], P=.16) but decreased significantly in the NICU (0.95 [0.93–0.97], P<.0001).
Unadjusted monthly rates of blood culture and antibiotic utilization in 4 pediatric and neonatal intensive care units without mandatory public reporting of central line–associated bloodstream infection. Data represent the years spanned by our analysis of hospitals with mandatory public reporting, 2004–2012. Trend lines are fit to the unadjusted values. NICU, neonatal intensive care unit; PICU, pediatric intensive care unit.

DISCUSSION
In this study, we examined whether mandatory public reporting of HAIs might have incentivized clinicians to use more antibiotics and fewer diagnostic tests. To our knowledge, this is the first study to examine the effect of mandatory public reporting on clinical practice in a pediatric population. We reasoned that if mandatory public reporting of CLABSI had led to improved infection prevention practices and fewer clinical events, we would see reductions in both blood culture rate and antibiotic utilization. On the other hand, if clinicians were “gaming the system,” we might observe lower blood culture rates but increased antibiotic utilization. We found that blood culture rates in the NICU and PICU decreased marginally during the study period but were not impacted by implementation of mandatory public reporting requirements. Antibiotic utilization did not increase in either unit type and was unaffected by public reporting. Our results suggest that clinicians have not been “gaming the system” in response to mandatory public reporting of HAI.
Our methods evaluated blood culture and antibiotic utilization by longitudinal analysis of monthly rates in study hospitals over state-specific 3- to 4-year periods, as well as longitudinal analysis of monthly rates in 4 hospitals without mandatory reporting during the 9 years spanned by the study. The magnitudes of annual rate changes were similar in all approaches. Specifically, we observed small decreases in blood culture utilization, stable antibiotic use in the PICU, and small decreases in antibiotic use in the NICU. The changes reached the level of significance only in the 9-year longitudinal analysis, likely reflecting the larger number of data points.
Previous studies of blood culture utilization have focused on inappropriate use in the emergency department,Reference Roque, Oliver and Anderson 17 , Reference Sturmann, Bopp, Molinari, Akhtar and Murphy 18 outpatient clinic,Reference Laupland, Church and Gregson 19 and neurosurgical ICU.Reference Darby, Linden, Pasculle and Saul 20 , Reference Hillier and Everett 21 Studies in the PICU have been limited to the immediate postoperative period or to specific periods surrounding an educational campaign.Reference Kiragu, Zier and Cornfield 22 , Reference Gross, Van Antwerpen, Hess and Reilly 23 In contrast, we measured blood culture rates across staggered 3- to 4-year periods in multiple children’s hospitals. Blood culture rates, which were 1.14 cultures per admission in the PICU and 1.32 cultures per admission in the NICU, were similar to the 0.3 to 1.7 cultures per admission or discharge in prior studies.Reference Darby, Linden, Pasculle and Saul 20 , Reference Gross, Van Antwerpen, Hess and Reilly 23 In contrast to our findings, other investigators have reported increasing blood culture utilization over time, including studies in a Danish health system from 1981 to 1994, a Greek hospital from 1995 to 2002, and US emergency departments from 2001 to 2004.Reference Madsen, Schønheyder, Kristensen and Sørensen 24 – Reference McCaig, McDonald, Cohen and Kuehnert 26 Our results could reflect trends unique to the ICU or more current temporal trends.
Antibiotic utilization and trends in our study were similar to previous reports. Gerber et alReference Gerber, Newland and Coffin 10 evaluated broad-spectrum antibiotic use in pediatric hospitals using PHIS data and a measure equivalent to our measure of antibiotic days. They limited their analysis to 1 year (2008) and found that hospitalized children received 468 days of antibiotics per 1,000 patient-days. Our median rate of antibiotic utilization was similar in the PICU, at 441 antibiotic days per 1,000 patient-days, and lower in the NICU, at 286 antibiotic days per 1,000 patient-days, likely reflecting the known difference in antibiotic utilization between the 2 types of units.Reference Grohskopf, Huskins and Sinkowitz-Cochran 27 Prior NICU studies have reported a median of 360 DOT days per 1,000 patient-days, similar to our median NICU DOT rate of 390.Reference Zingg, Pfister, Posfay-Barbe, Huttner, Touveneau and Pittet 28
The trend of antibiotic DOT was reported to be constant between 2002 and 2007 in a subset of pediatric patients treated at primarily adult centers, ranging from 539 to 557 per 1,000 patient-days.Reference Pakyz, Gurgle, Ibrahim, Oinonen and Polk 29 Our median DOT rate in the PICUs of tertiary children’s hospitals was higher at 638, but our trend in antibiotic days remained similarly constant over time. In the NICU, prior studies found a 2.8% annual decline from 2001 to 2008.Reference Zingg, Pfister, Posfay-Barbe, Huttner, Touveneau and Pittet 28 We found that NICU antibiotic utilization decreased 5% per year from 2004 to 2012 in hospitals without mandatory public reporting. The reason for the small difference in trends between the PICU and NICU is unknown, but it has been suggested that the NICU environment is more amenable to protocols that decrease inappropriate antibiotic use, a strategy used increasingly over the past decade.Reference Zingg, Pfister, Posfay-Barbe, Huttner, Touveneau and Pittet 28
Implementation of mandatory public reporting of CLABSI did not significantly alter blood culture or antibiotic rates. Although previous studies have shown shifts in clinical practice to meet certain quality indicators, public reporting of HAIs could have less impact on clinicians at the point of care, particularly if they are not responsible for HAI surveillance or held accountable for hospital HAI rates.Reference Pines, Isserman and Hinfey 5 , Reference Joynt, Blumenthal, Orav, Resnic and Jha 6 Reforms involving nonpayment for HAIs provide a comparable paradigm. Similar to our findings, nonpayment for catheter-associated urinary tract infections did not prompt clinicians to shift their behavior and did not change the already decreasing rates of these infections.Reference Meddings, Reichert, Rogers, Saint, Stephansky and McMahon 30 , Reference Morgan, Meddings and Saint 31 Furthermore, results were similar in states with and without mandatory reporting.Reference Lee, Kleinman and Soumerai 32
We were able to assess our results in a subset of ICU patients known to have a CVC. Our selected PHIS codes adequately captured patients with a central line, but no single code was able to capture the majority of this population. The ICU days contributed by patients with at least 1 CVC code accounted for greater than 50% of patient-days, blood cultures, and antibiotic days. These proportions are based on a denominator of total patient-days and are expectedly higher than the central line utilization ratios of 20% to 47% reported in PICUs and NICUs.Reference Cox, Flaspohler and Jennings 33 , Reference Blanchard, Fortin and Rocher 34
Our study has limitations. Use of monthly unit-level outcomes precludes the extension of our results to individual patients. Administrative data are inherently subject to the potential for misclassification. Our analysis of particular covariates, such as extracorporeal membrane oxygenation, was limited by low monthly rates. Our study was not designed to examine CLABSI rates, a minor driver of antibiotic use, nor institution-specific guidelines on antibiotic use.Reference Wirtschafter, Padilla, Suh, Wan, Trupp and Fayard 35 Finally, we noted prolonged lag times between initial legislation and implementation of public reporting but were unable to incorporate the impact of the initial legislation.
Although we could not examine all potential drivers of blood culture and antibiotic utilization, our study is robust in assessing the impact of mandatory public reporting. Our results are similar across 2 measures of antibiotic utilization and in a subset of patients with a CVC. We incorporated staggered, state-specific implementation dates and corresponding study periods for each hospital. With our findings consistent across multiple years, it is unlikely that a single piece of legislation or new guideline would account for our results. Finally, we had a large, geographically diverse sample of pediatric hospitals and were able to evaluate temporal trends in 4 hospitals that had never implemented mandatory reporting during the study period.
Overall, we found that mandatory public reporting of CLABSI was not associated with changes in blood culture and antibiotic utilization. Our results provide one piece of reassurance that mandatory public reporting has not produced the unintended consequences encountered by some quality improvement strategies.
Acknowledgments
Financial support. Program for Patient Safety and Quality at Boston Children’s Hospital (institutional grant to K.B.F.); Translational Research for Infection Prevention in Pediatric Anesthesia and Critical Care Program of the Department of Anesthesiology, Perioperative and Pain Medicine at Boston Children’s Hospital (institutional grant to G.P.P.).
Potential conflicts of interest. All authors report no conflicts of interest relevant to this article.
Supplementary material
To view supplementary material for this article, please visit http://dx.doi.org/10.1017/ice.2015.100.