INTRODUCTION
The study of the variation in distribution and relative abundance of species, in space and time, is essential to comprehend their ecology and to ensure the sustainable exploitation of the populations. Most studies on cephalopod distribution and abundance have been carried out on very mobile species (e.g. squid and cuttlefish), with wide distribution ranges and usually fished on deep-waters with trawl nets of commercial fisheries (Guerra, Reference Guerra1981; Pierce et al., Reference Pierce, Bailey, Stratoudakis and Newton1998; Bellido et al., Reference Bellido, Pierce and Wang2001; Waluda et al., Reference Waluda, Rodhouse, Trethan and Pierce2001; Denis et al., Reference Denis, Lejeune and Robin2002; Wang et al., Reference Wang, Pierce, Boyle, Denis, Robin and Bellido2003; Sacau et al., Reference Sacau, Pierce, Wang, Arkhipkin, Portela, Brickle, Santos, Zuur and Cardoso2005; Pierce et al., Reference Pierce, Valavanis, Guerra, Jereb, Orsi-Relini, Bellido, Katara, Piatkowski, Pereira, Balguerias, Sobrino, Lefkaditou, Wang, Santurtun, Boyle, Hastie, MacLeod, Smith, Viana, González and Zuur2008). On the contrary, studies on cephalopod species in shallow waters are scarce (Mather, Reference Mather1982a, Reference Matherb; Iribarne, Reference Iribarne1991a, Reference Iribarneb; Narvarte et al., Reference Narvarte, González and Fernández2006; Scheel et al., Reference Scheel, Lauster, Vincent and Landman2007; Leite et al., Reference Leite, Haimovici, Mather and Lins Oliveira2009). Also, species of either no commercial interest or of small market value are less studied, with distribution often inferred from indirect evidence such as the occurrence in predators stomachs (Pierce et al., Reference Pierce, Valavanis, Guerra, Jereb, Orsi-Relini, Bellido, Katara, Piatkowski, Pereira, Balguerias, Sobrino, Lefkaditou, Wang, Santurtun, Boyle, Hastie, MacLeod, Smith, Viana, González and Zuur2008).
Cephalopod populations' abundance and distribution are intrinsically unpredictable because most of their life cycles are highly influenced by physical and chemical oceanographic factors. Several characteristics of the habitat (e.g. availability of shelters, prey, etc.) have shown to constrain cephalopod distribution and abundance, and consequently its associated fisheries (Laughlin & Livingston, Reference Laughlin and Livingston1982; Mather, Reference Mather1982a; Anderson, Reference Anderson1997, Reference Anderson, Hughes, Mather and Steele1999; Scheel, Reference Scheel2002; Oosthuizen & Smale, Reference Oosthuizen and Smale2003; Katsanevakis & Verriopoulos, Reference Katsanevakis and Verriopoulos2004; Leite et al., Reference Leite, Haimovici, Mather and Lins Oliveira2009). In addition, coastal species, and particularly intertidal ones, are faced with habitat degradation due to increasing pollution and urbanization in the coastal zone (Norse & Crowder, Reference Norse and Crowder2005). Describing the distribution and abundance of little known cephalopod species is the initial step to understand the mechanism that regulates its populations, and is essential to start integrating the twin objectives of conservation and sustainable management of resources (Leite et al., Reference Leite, Haimovici, Mather and Lins Oliveira2009).
In the coastal areas of San Matías Gulf (Patagonia, Argentina) high abundances of the small Patagonian octopus Octopus tehuelchus d'Orbigny 1835 support a historic artisanal fishery with regional importance (Iribarne, Reference Iribarne1991a; Narvarte et al., Reference Narvarte, González and Fernández2006). Octopus tehuelchus is a small octopus (up to 150 g), with seasonal growth and two/three years of lifespan. Spawning occurs in late summer and early autumn, and after four months of parental care, juveniles recruit mainly in spring (Iribarne, Reference Iribarne1991b; Storero et al., Reference Storero, Ocampo-Reinaldo, González and Narvarte2010, Reference Storero, Narvarte and González2012). Octopus tehuelchus inhabits rocky substrates from the low intertidal to the shallow subtidal zone, but is also observed in muddy-sandy bottoms where natural shelters are scarce (Iribarne, Reference Iribarne1990). This octopus is an opportunistic predator which feeds mainly on molluscs and crustaceans (Ré & Gómez Simes, Reference Ré and Gómez-Simes1992; Storero, Reference Storero2010).
The main objective of this study was to evaluate the seasonal distribution and density of O. tehuelchus, in three intertidal environments of San Matías Gulf, and to discuss this in relation to the factors that could contribute to the observed patterns.
MATERIALS AND METHODS
Study sites
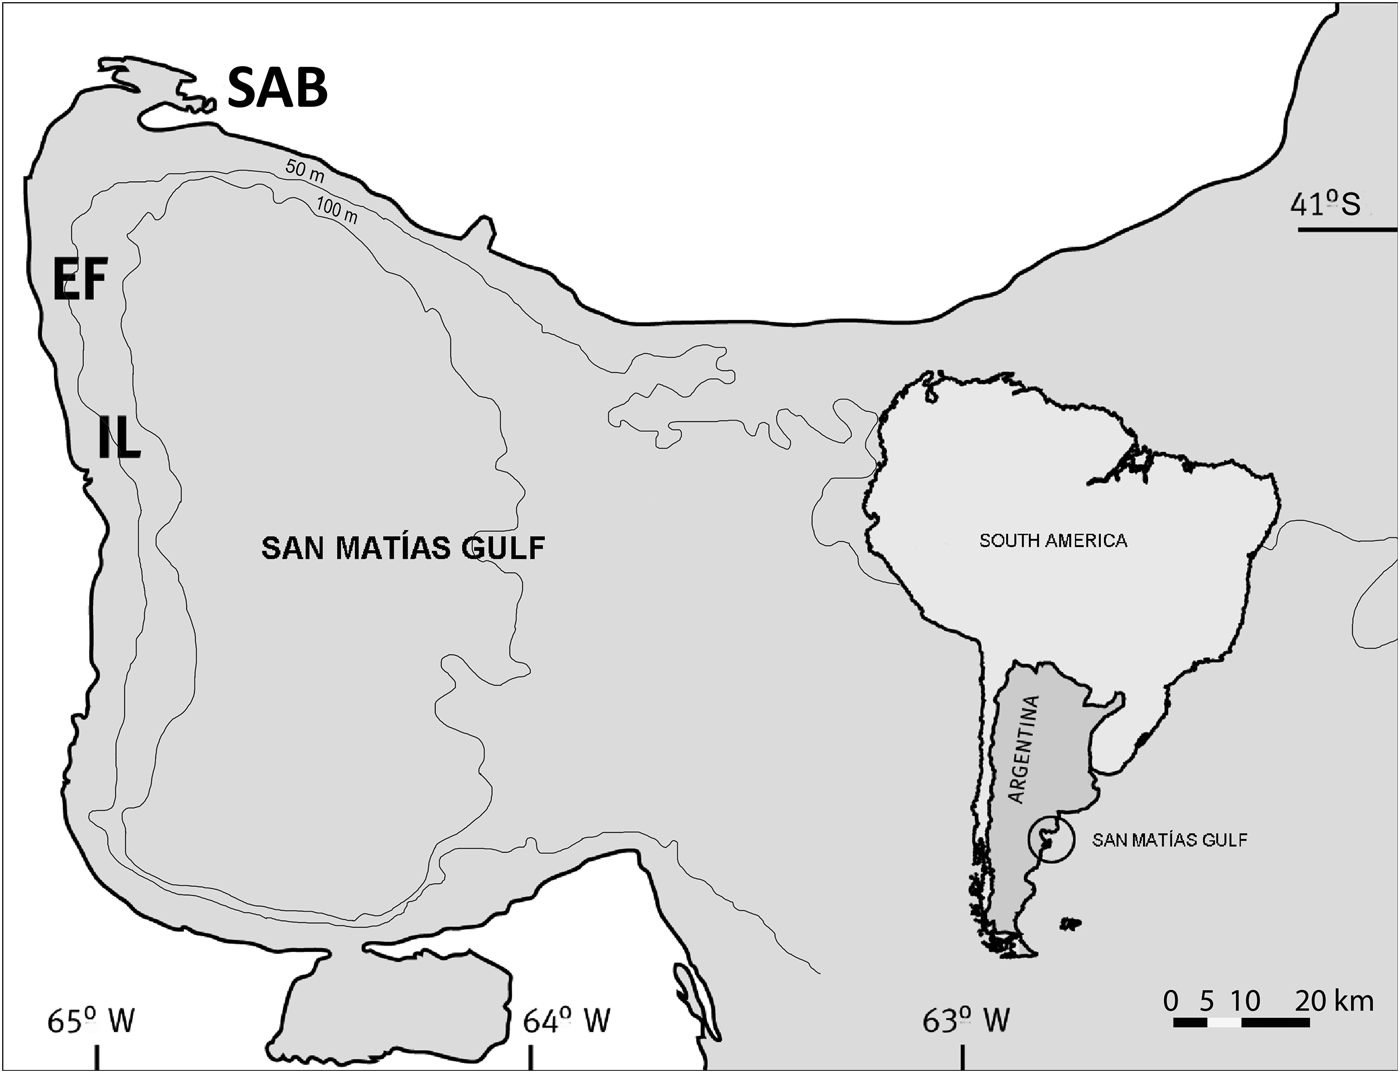
San Antonio Bay (SAB, Figure 1) is located in the north-west sector of San Matías Gulf, Argentina (40°42′S–40°50′S, 64°43′W–65°07′W). It is an estuarine shallow-water system that was declared a multi-use Marine Protected Area in 1993 (Law No. 2670 of Río Negro province, Argentina) and is characterized by having semi-diurnal tides between 6 and 9 m in range, channels, and sandy-pebbly bottoms. Because this is a multi-use reserve, some harmless interaction of human activities with the natural environment are expected. The authority regulates the use of the area and its resources, but there is no management plan that considers the artisanal octopus fishery. People from the surrounding urban area collect octopuses from artificial shelters (usually bottles, pipes and pots) in the intertidal, and particular management measures only regulate the pot–longline fishery in the subtidal zone.
Study sites within San Matías Gulf (Argentina). SAB, San Antonio Bay; EF, El Fuerte; IL, Islote Lobos.

The north-west region of San Matías Gulf shows extended rocky intertidal shores. El Fuerte (EF, 41°14′S, 65°08′W), located 55 km southward of SAB (Figure 1), has been the traditional fishing area for the last 60 years. During the spring and summer months, the area is regularly visited by fishers who collect octopuses using a 40 cm long iron gaff, or by turning rocks over (Iribarne, Reference Iribarne1991a).
Islote Lobos (IL, 41°26′S, 65°03′W), located 45 km southward of EF (Figure 1), also used to be a traditional fishing ground until it was declared a Marine Protected Area in 1977 (Decree No. 1402 of Rio Negro province, Argentina). Although there is no regulation of the fishery in this reserve, the fishing effort on octopuses has diminished (Narvarte et al., Reference Narvarte, González and Fernández2006). For detailed information about the three study sites and the biology of O. tehuelchus see Storero et al. (Reference Storero, Ocampo-Reinaldo, González and Narvarte2010, Reference Storero, Narvarte and González2012, Reference Storero, Narvarte and González2013).
Sampling and data analysis
Monthly transects (October 2005–September 2007) were carried out in SAB, EF and IL, with a few months when it was not possible to sample in the three sites because of logistic reasons. Because the presence of octopuses in the intertidal can only be detected by a skilled observer (i.e. capable of identifying the food debris in the entrance of the shelter and of manually collecting octopuses with an iron gaff), transects were carried out by a researcher who followed the path of a skilled fisher, marking the exact position where each octopus was collected. Two highly efficient fishers (Narvarte et al., Reference Narvarte, González and Sica1996) were used during the entire study period, one in SAB and the other one in EF and IL. Specific instructions were given to collect every octopus (including juveniles). By standardizing fishing gear, survey design, operational tactics and efficiency of fishers, we minimized the differences in detectability (catchability), and the results only depended on local octopus densities.
Between 6 and 26 transects (300 m2, 100 m long × 3 m wide) were carried out monthly, depending on the weather conditions and the tide height. The collection points were recorded using a sub-meter accuracy differential GPS (Trimble®). Octopus density (number of octopuses recorded per transect) was averaged monthly and compared between months and sites with a two-way ANOVA. Density data were square root transformed to meet the assumptions of the analysis and the Tukey t-test was used for a posteriori comparisons (α = 0.05).
To evaluate the spatial distribution of octopus, the nearest neighbour index (R) was calculated monthly. This index is the relationship between the observed and expected distance between two points, with the expected distance being the mean distance between neighbours in a hypothetical random distribution (Clarke & Evans, Reference Clarke and Evans1954). For aggregated patterns R < 1 and for scattered patterns R > 1. Also, this index has an associated test under the null hypothesis of random distribution of points in space.
In the three study sites, the coastlines at low-tide were mapped using satellite images and were used to analyse the seasonal distribution and densities of O. tehuelchus. Panchromatic satellite data from a CBERS 2B HRC (High Resolution Camera) were used. One image was selected for each site: SAB Image No.168-D-146-1 (Date 23/12/2008, 14:25 hours, INPE 2010) root mean square error (RMSE) = 7.17; EF Image No. 168-c-146-3 (Date 20/01/2008, 14:23 hours, INPE 2010) RMSE = 7.07; and IL Image No. 168-D-146-5 (Date 23/12/2008, 14:25 hours, INPE 2010) RMSE = 2.75. The images were selected considering the hour of low tide in accordance with the temporal resolution of the sensor (130 days). Selected images differed from the low tide time predicted by tables by 25 to 50 minutes (Servicio de Hidrografía Naval, 2007). Images were rectified, spatially corrected and low-tide lines were manually drawn (from visual interpretation on screen at scale 1:5000) using ArcGIS™ 9.3 (ESRI©). For complex topographic zones (in SAB and IL), low-tide lines were adjusted with pan-sharpened scenes of high spatial resolution from Google Earth™ (satellite QuickBird, 2010© DigitalGlobe). The image used for SAB was Image No. Jan 01-2005 (RMSE = 3.54), and the image used for IL was Image No. Feb 22-2004 (RMSE = 1.58), geometrically co-registered with the panchromatic image.
To evaluate the variation of octopus distribution with respect to the low-tide level, distances between the point of collection of each octopus and the nearest low-tide line were calculated, averaged per transect, and grouped seasonally.
RESULTS
Density
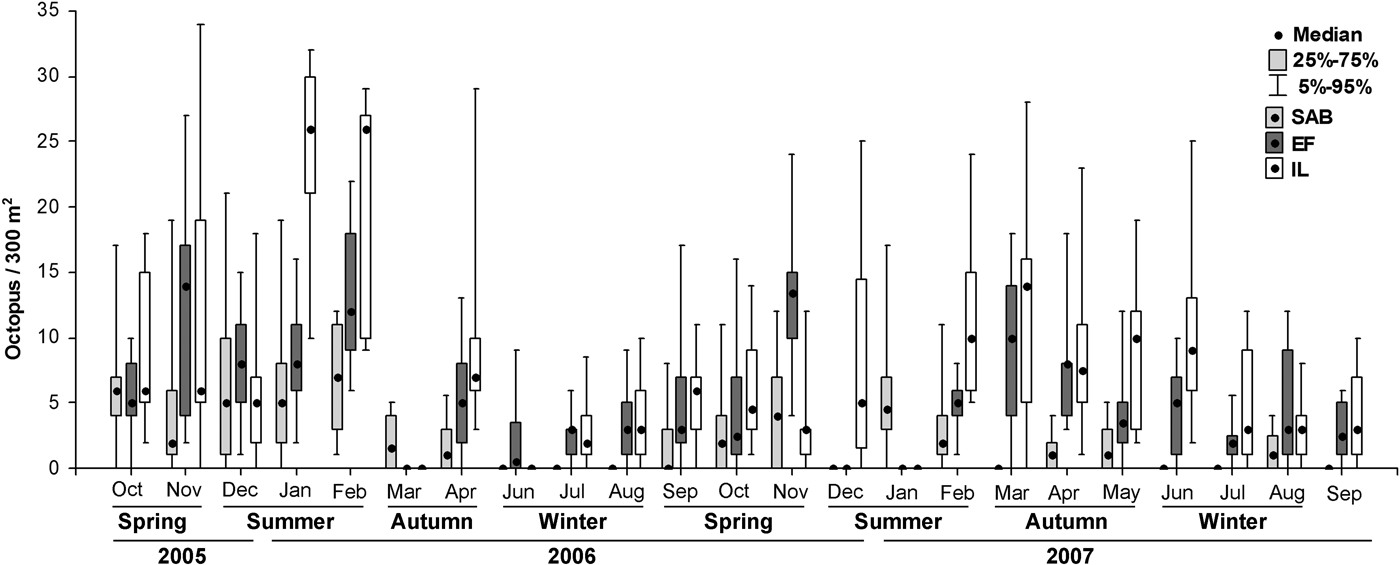
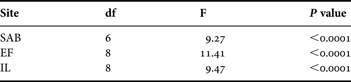
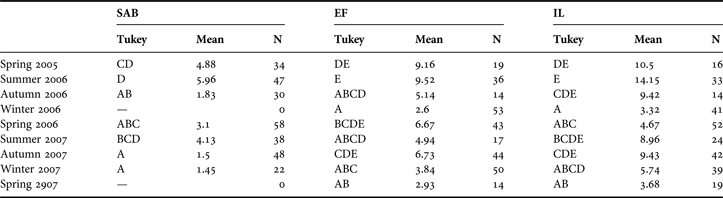
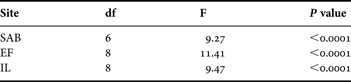
In the three study sites octopus density was variable, ranging from 0 to 34 individuals per transect (0–0.11 octopus m−2). The analysis showed significant differences between sites and months, and the interaction between variables also was significant (ANOVA, F(55,791) = 9.89, P < 0.0001). Thus, sites and months (grouped by seasons) were compared with two one-way ANOVAs. Octopus densities varied between sites (ANOVA, F(2,844) = 37.69, P < 0.0001). IL had the highest densities (mean ± standard deviation = 7.32 ± 1.16) followed by EF (5.55 ± 0.94) and SAB (3.40 ± 0.85). Within each site, octopus densities varied between seasons (Table 1). In general at the three sites, the highest densities were observed during warm months (spring–summer, October to March) and the lowest during cold ones (autumn–winter, April to September) (Table 2; Figure 2).
Monthly densities by site. SAB, San Antonio Bay; EF, El Fuerte; IL, Islote Lobos.
Results of the one-way ANOVAs to test for differences in octopus densities between seasons (within each site). SAB, San Antonio Bay; EF, El Fuerte; IL, Islote Lobos.
Results of the Tukey's test to compare octopus densities per transect (300 m2) between seasons (within each site). SAB, San Antonio Bay; EF, El Fuerte; IL, Islote Lobos. Within each column, seasons with the same letter are not significantly different. N, number of transects carried out by season.
Spatial distribution
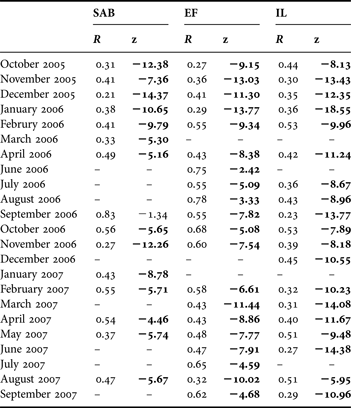
An aggregated pattern was observed for the entire study period in the three sites and there was only one exception to this pattern in September 2006 in SAB (Table 3). The nearest neighbour proportion (R) varied between 0.21 and 0.83 in SAB, 0.27 and 0.78 in EF and 0.23 and 0.53 in IL.
Nearest neighbour values (R) and test values (z). All tests were significant (aggregated pattern of distribution), except SAB September 2006, which showed a random pattern of distribution.
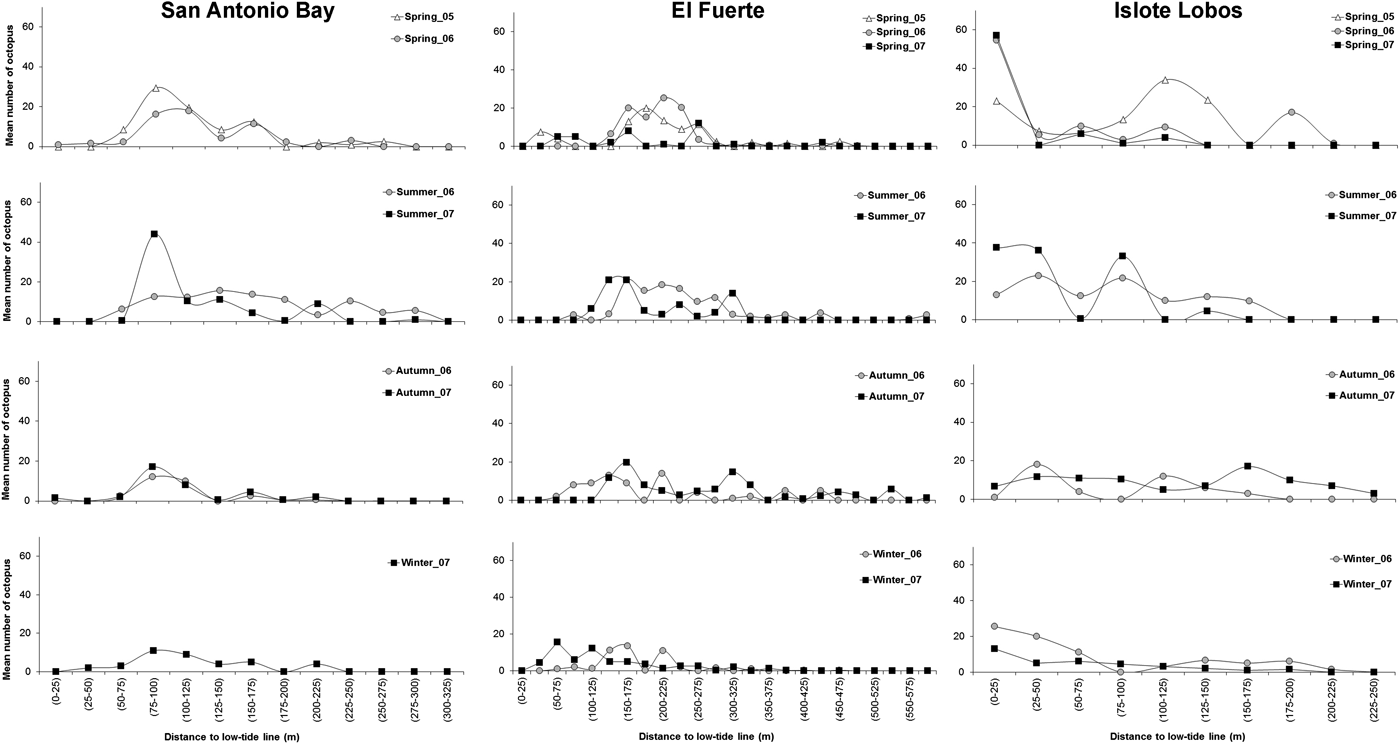
Considering the estimated low-tide line, the distribution pattern of octopuses varied between seasons. In general, during spring–summer months octopuses were widely distributed in the intertidal, from the low-tide line to 300 m (in SAB), 500 m (in EF) and 200 m (in IL) approximately (Figure 3). Conversely, a different pattern was observed during cold months. In autumn, although there is a decrease in densities (more evident in IL and SAB than in EF), the octopuses remained widely distributed throughout the intertidal. In winter, the highest densities were observed in the low intertidal (i.e. close to the low-tide line), with lower abundance on the mid-supra littoral. In SAB, the pattern was less obvious and the spatial distribution did not seem to have strong variations between seasons compared with the other study sites (Figure 3).
Mean number of octopus by season in relation to the distance of the low-tide line (m).
DISCUSSION
This study shows that the seasonal distribution and density of Octopus tehuelchus vary in different intertidal environments of north Patagonia. Previous studies reported the highest densities of this species (up to 26 octopuses per 200 m2 = 0.13 octopus m2) from the intertidal down to 15 m depth (Iribarne, Reference Iribarne1990). In the intertidal zone, Narvarte et al. (Reference Narvarte, González and Fernández2006) observed the highest abundances during summer in IL (11.7 octopus collected in 5 minutes) compared with EF (6.6 octopus collected in 5 minutes). Our results showed, using the same method in the three study sites, that the sites have different density patterns. Islote Lobos and El Fuerte had the highest densities, probably because these rocky intertidals offer high availability of shelters (of different shape and size) for O. tehuelchus (Storero, Reference Storero2010). On the contrary, the lowest densities observed in SAB are probably due to the low availability of natural shelters, which have already been mentioned as a limiting factor for O. tehuelchus (Iribarne, Reference Iribarne1990). Within SAB, most shelters consist of valves of different molluscs and empty barnacles or artificial shelters (e.g. bricks, bottles and cans) placed by people to provide shelter for octopuses and collect them.
Given the differences in capture rates of O. tehuelchus between sites, and thus presumably octopus density, Iribarne (Reference Iribarne1991a) hypothesized that differences in capture rates could depend on either, the area exposed to fishing or the behaviour of the octopuses (i.e. if the harvesting pressure is enough to daily deplete the fishing zone, the largest catches should follow the nights of highest tides). With this respect, the observed differences in densities may be affected by the fishing intensity, since it is rather different in the three sites. San Antonio Bay is mainly exploited with artificial shelters and probably this extra income of shelters may increase octopus abundances in the bay (Osovnikar et al., Reference Osovnikar, González, Narvarte, Salas, Cabrera, Ramos, Flores and Sánchez2006). On the other hand, El Fuerte is the main fishing area of this octopus (Millán, Reference Millán2007; Storero et al., Reference Storero, Narvarte and González2013), and during summer (the main fishing season) the high fishing pressure may influence the estimated densities. Finally, although the fishing activity in the Marine Protected Area of Islote Lobos is not regulated, the area has a low fishing pressure that may favour the highest abundances of this species (Narvarte et al., Reference Narvarte, González and Fernández2006; Storero et al., Reference Storero, Narvarte and González2013).
The small Patagonian octopus showed an aggregated spatial distribution in the intertidal environments of San Matías Gulf. This may be related to the life habits of this species, the availability and distribution of prey in the intertidal and the need of hard substrata to hide during low tide. The resources and conditions usually are not homogeneously distributed in both space and time and the organisms aggregate when and where they find resources and conditions that favour reproduction and survival (Begon et al., Reference Begon, Townsend and Harper2006). We did not measure relative small-scale habitat differences (e.g. habitat structure) that could help us elucidate the aggregated spatial distribution of O. tehuelchus. However, field observations allow us to suggest that the aggregated pattern may be related to octopus remaining within the shelters in the pools of the intertidal during low tide, in general near the patches of mussels, which are one of the preferred item prey (Storero, Reference Storero2010). Other cephalopod species have also shown an aggregated distribution pattern related to the environmental and biological conditions (Leite et al., Reference Leite, Haimovici, Mather and Lins Oliveira2009), the need of hard structures on soft bottoms or holes and crevices on hard substrata (Anderson, Reference Anderson1997; Oosthuizen & Smale, Reference Oosthuizen and Smale2003; Katsanevakis & Verrriopoulos, 2004), the distribution of shells used as shelter (Mather, Reference Mather1982a) and the presence of soft substrates and boulders in the intertidal and shallow subtidal (Scheel, Reference Scheel2002).
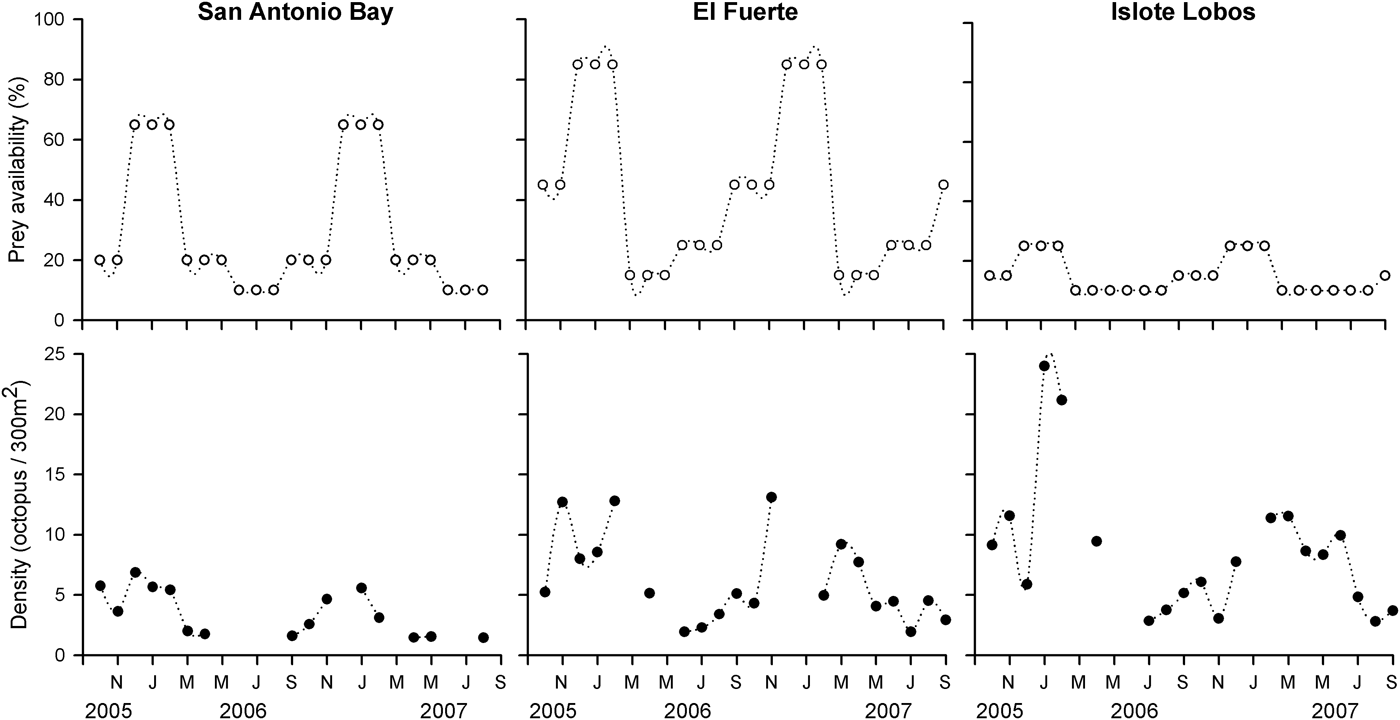
The availability of preferred prey (e.g. mussels, crabs and polychaetes) within the three coastal environments could be one of the main explanations for the variations in density and spatial distribution of O. tehuelchus between sites. Preliminary observations of the annual variation in prey availability for the three sites (Figure 4 modified from Storero, Reference Storero2010) indicate that Islote Lobos has the lowest availability of prey so it would not explain the high densities observed in this site. Thus, it remains to ask for other physical, oceanographic or biological characteristics of the habitat that may account for the differences in abundance between the sites studied. For example, the uneven spatial distribution of natural populations of Octopus joubini seems to be the result of environment (i.e. availability of shells in which to hide) and not of attraction to conspecific (Mather, Reference Mather1982a). Moreover, octopuses' shelter occupancy is shaped both by choice and by interspecific competition (Mather, Reference Mather1982b). On the contrary, for Enteroctopus dofleini, neither den availability nor seasonal temperature changes appear to drive the distribution, and according to Scheel et al. (Reference Scheel, Lauster, Vincent and Landman2007), patch selection by octopuses should be modelled as a function of trade-off between foraging success and predation risk.
Annual densities of preferred prey and octopus by site. Modified from Storero, Reference Storero2010.
The spatial distribution of O. tehuelchus along the intertidal varied seasonally. During warm months this species has the highest growth rates (Storero et al., Reference Storero, Ocampo-Reinaldo, González and Narvarte2010), the highest feeding rates (Ré & Gómez-Simes, Reference Ré and Gómez-Simes1992) and is widely distributed throughout the intertidal zone (this study). During this season, the population is composed mainly of year-old individuals that rapidly grow and, by the end of the summer achieve the sexual maturity and reproduce (Storero et al., Reference Storero, Ocampo-Reinaldo, González and Narvarte2010, Reference Storero, Narvarte and González2012, Reference Storero, Narvarte and González2013). On the contrary, during cold months most individuals were found near the low-tide line. During this season the population is composed of large and senescent individuals that are completing their life cycle, and post-spawning females that are taking care of eggs in the shelters (Storero et al., Reference Storero, Ocampo-Reinaldo, González and Narvarte2010, Reference Storero, Narvarte and González2012, Reference Storero, Narvarte and González2013). Previous studies suggested that these individuals are the least mobile of the population and that they have the lowest feeding rates (Iribarne, Reference Iribarne1991b; Ré & Gómez-Simes, Reference Ré and Gómez-Simes1992; Storero et al., Reference Storero, Narvarte and González2013). Moreover, Iribarne (Reference Iribarne1991b) reported that O. tehuelchus females move to the subtidal zone to brood at the beginning of the cold season. As mentioned by several authors, the activity and physiology (e.g. locomotion, forage, reproduction, spawn, larval settlement, etc.) of different marine coastal species are synchronized with tides, thus allowing the organism to adapt their activities (Iribarne, Reference Iribarne1991a; Morgan, Reference Morgan1996).
Finally, for coastal and intertidal species, such as O. tehuelchus, the habitat characteristics seem to be highly important, being one of the main factors that affect its abundance and distribution. Identifying the sites with higher and lower abundance of the species and its annual variations, is the initial step to design and reinforce marine protected areas, or to propose strategies of differential use of areas (e.g. exclusive zones for fishing, zones of recreation/tourism and recovery zones), with the aim of conservation and sustainable management of this fishery resource.
ACKNOWLEDGEMENTS
We would like to thank ‘Suncho’ Fidel and ‘Cacho’ Montenegro for fishing most of the octopuses, Sandro Acosta, Néstor Dieu and Pablo Sacco for their technical assistance, and Matías Ocampo Reinaldo for his comments. This work is part of a doctoral thesis developed by L.S. in the Universidad Nacional de Córdoba.
FINANCIAL SUPPORT
This work was funded by PID 371 (Agencia Nacional de Promoción Científica y Tecnológica). L.S. acknowledges financial support from CONICET.