I. INTRODUCTION
With the trend of miniaturization and the need for high-performance electronic devices, electronic packaging requires higher input/output (I/O) interconnections, smaller feature size, and better performance. Flip-chip packages are a promising solution to these demands, and they have been proven to provide a good electrical and thermal performance.Reference Ho, Wang, Ding, Zhao and Dai1 However, more I/O interconnections will be needed for better performance of electronic devices in the near future, and the joint area of each individual solder bump will continue to decrease quickly. At present, the size of each solder bump is 100 μm or less in diameter, and each solder joint is designed to carry 0.2 A.Reference Tu2 However, the difference in electrical resistance and feature size between the solder and the adjacent trace causes a drastic increase in the current density and leads to serious electromigration (EM) damage near the contact area between the line and the bump.Reference Yeh, Choi and Tu3 The actual current density through the solder joint may approach almost 104 A/cm2 or more with decrease in the bump size. In addition, the temperature of these solder joints often reaches 100 °C during device operation as Joule heating is proportional to the square of the current density. As a consequence, under such high current density and high operation temperature, diffusion of atoms can occur easily. Hence, EM is becoming more important as a reliability issue as the size of electronics packaging continues to decrease.Reference Tu2–Reference Chan and Yang5
EM is a diffusion-controlled mass transport phenomenon driven by the directional electron flow. Typical failures induced by EM are either under bump metallization (UBM) consumption, such as Cu and Ni, or void formation and propagation at the cathode interface in flip-chip solder joints. Most researchers observed that UBM consumption leads to fast failure of the bump under high current stressing.Reference Yeh, Choi and Tu3 However, in some joints, damage process due to UBM consumption occurred much faster than in neighboring joints, and each bump showed a different time to failure even though the bumps were tested under the same experimental conditions. To predict the EM lifetime, Black’s equation and Weibull analysis have been adopted; however, the predicted lifetimes did not match well with the measured ones, particularly under a higher current density.Reference Chan and Yang5 Various possible reasons for this abnormal phenomenon have been reported, such as stress gradient, temperature gradient, and different current directions.Reference Tu2 However, it is still unclear and further investigation is necessary to identify the different microstructural evolutions of each solder bumps during EM.
Today, most lead-free solder alloys are composed mainly of Sn, which has a highly anisotropic diffusion characteristic depending on the axis direction.Reference Dyson6–Reference Yeh and Huntington9 In particular, interstitial diffusion of noble and near-noble atoms along the c-axis of Sn is faster than that along the a-axis. For example, the diffusion coefficient of Cu atoms along the c-axis of Sn is about 500 times faster than that along the a-axis and 1012 times faster than self-diffusion of Sn at room temperature.Reference Dyson, Anthony and Turnbull7 In addition, Sn–Ag–Cu solder balls that are mostly used for flip-chip solder joints often fit into a few large randomly oriented Sn grains with a size from 100 to 600 μm after the reflow process.Reference Telang, Bieler, Lucas, Subramanian, Lehman, Xing and Cotts10 Thus, the crystallographic orientation of Sn is believed to play an important role in EM reliability.Reference Lu, Shih, Lauro, Goldsmith and Henderson11 In this study, the EM behavior of Cu/Sn–3.0 wt% Ag–0.5 wt% Cu/Cu solder ball joints with respect to the crystallographic orientation of Sn grains was clarified under high current density.
II. EXPERIMENTAL
A. Test vehicle and test conditions
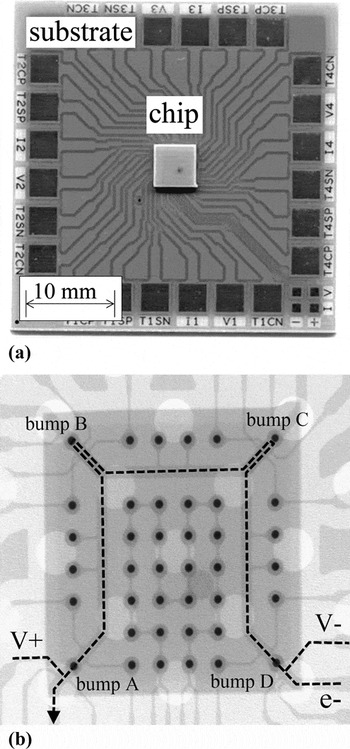
Figure 1 shows a picture of the test vehicle and x-ray transmission (XD7500; DAGE, Westlake, OH) image of the chip side. The size of the substrate was 35 mm × 35 mm × 0.8 (t) mm and the dummy chip component measured 5 mm × 5 mm × 0.8 (t) mm. The dummy chip component was made from the same printed circuit board (FR4) as the substrate to minimize the stress caused by a mismatch of the coefficients of thermal expansion between the chip and the substrate.Reference Yamanaka, Tsukada and Suganuma12 The direction of electron flow was from the right bottom corner bump to the left bottom corner bump passing through the upper right corner bump and the upper left corner bump, as shown by the dashed line. The composition of the solder balls used in this study was Sn–3.0 wt% Ag–0.5 wt% Cu (Sn3Ag0.5Cu; Senju Metal Industry Co., Tokyo, Japan) with a diameter of 130 μm, and the peak reflow temperature was 250 °C. After reflow, the solder bump height was ∼80 μm. The Cu electrode had a diameter of 300 μm with a thickness of 18 μm, and the width of the Cu line on the substrate and the chip was 200 μm. The contact area was 120 μm in diameter.
(a) Test vehicle and (b) x-ray transmission image of the chip side.

The applied DC electric current was 1.69 A; therefore, the current density, found by dividing the applied current by the area of the solder joint interface, was 15 kA/cm2. The change in resistance was monitored by in situ observation under current stressing to investigate the time to failure of the circuit.13 All tests were performed at 160 °C. To investigate the microstructural changes of the solder joint, all bumps were polished by an Ar ion beam using the cross section polisher (SM-09010; JEOL, Tokyo, Japan). Different microstructural evolution of each solder bump was observed using backscattered scanning electron microscopy [(BS-SEM) JEOL-5510S; JEOL]. To confirm the growth of Cu–Sn IMCs, selective etching was used to remove the Sn matrix by using a mixed solution of HCl, HNO3, and C2H5OH.
B. Crystallographic orientation of Sn
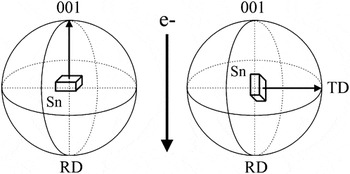
The effect of crystallographic orientation of Sn was investigated using electron backscattered diffraction (EBSD). The EBSD system (TSL crystallography; EDAX, Kanagawa, Japan) was used to attach to SEM operated at a voltage of 15 keV. Each specimen was placed at a working distance of 15 mm and was tilted to an angle of 60° relative to the electron beam. Sn has a body-centered tetragonal (bct) structure and a c-axis different from the a-axis and the b-axis; thus, the c-axis was used to indicate the crystallographic orientation of Sn. Transverse direction (TD) was used to measure the angle between the c-axis and the electron flow direction because TD is always parallel to the Cu electrode and perpendicular to the electron flow direction. Figure 2 shows the relationship between the 001 density pole figure of Sn and electron flow. Figures 2(a) and 2(b) show when the c-axis is parallel and perpendicular to the electron flow direction; the angles with TD are 90°and 0°, respectively. In addition, rolling direction (RD) could indicate the angle between the c-axis and the electron flow. However, the angles that RD could indicate are limited to when the c-axis is exactly parallel and perpendicular. Thus, the angle between the c-axis of Sn and TD is used to determine the angle between the c-axis and electron flow direction in this paper.
Relationship between the 001 density pole figure of Sn and electron flow.

III. RESULTS
A. Resistance changes
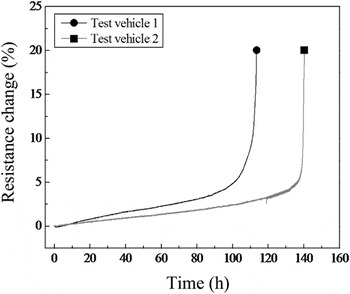
Figure 3 shows total resistance change of the test vehicle as a function of the current stressing time up to failure. The percentage increase in resistance was considered a failure of the test vehicle when resistance increased by 20% over its initial resistance.13 Before complete failure, the resistance of both the test vehicles slowly increased during EM testing because of the oxidation or degradation of the Cu line on the substrate and the Cu wires used to connect the test vehicle to the power supply for EM test.Reference Chang, Liang and Chen14 Rapid increase in the total resistance occurred when the resistance increased by 5% over its initial resistance. In the end, complete failure occurred after 110 h in test vehicle 1 and after 140 h in test vehicle 2, even though the test vehicles were tested under the same experimental conditions simultaneously.
Resistance change versus time of the test vehicles during electromigration (EM) test.

B. Different microstructural changes
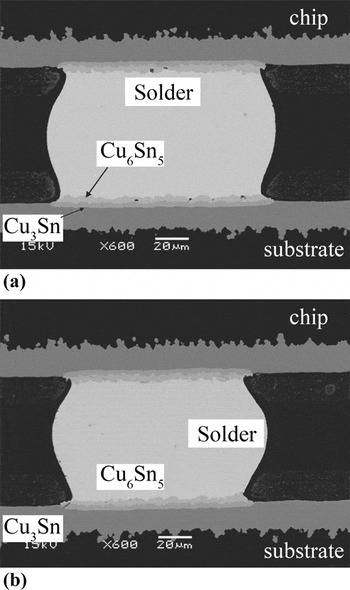
Figure 4 shows BS-SEM images of the cross-sectioned solder bumps without current stress for 110 and 140 h at 160 °C. The dominant diffusion species in the Cu–Sn system is the Cu atom, which diffuses from the Cu layer to the Sn solder through the Cu3Sn and Cu6Sn5 layers in the temperature range of 115–150 °C.Reference Tu and Thompson15 In the Cu/Sn–Ag–Cu joint, the Cu atoms that diffused from the Cu electrode reached the interfaces of Cu3Sn/Cu6Sn5 and Cu6Sn5/solder and resulted in the growth of both IMCs toward the solder. Thus, almost the same amount of layer-type Cu–Sn IMCs (Cu3Sn+Cu6Sn5) was formed uniformly on both the chip and the substrate side toward the solder. The thicknesses of Cu–Sn IMCs were 6.4 and 7.2 μm, respectively.
Back-scattered scanning electron microscopic (BS-SEM) images of the cross-sectioned solder bumps without current stressing for 110 and 140 h at 160 °C: (a) 110 h and (b) 140 h.

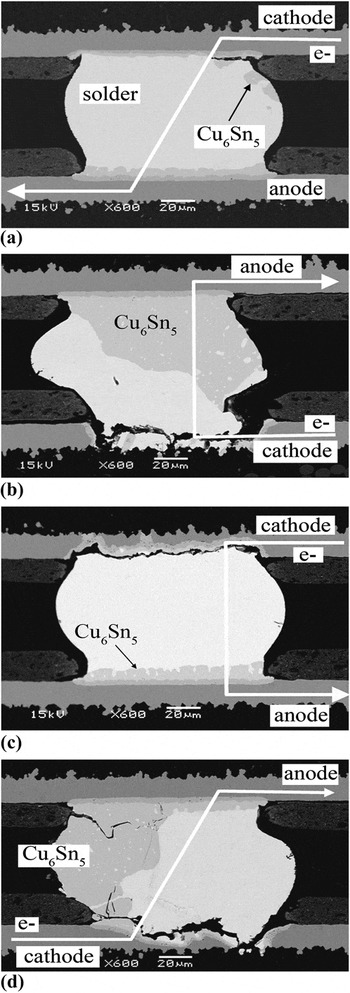
Under current stressing, various microstructural changes were observed. Figure 5 shows the microstructural changes of bumps A, B, C, and D in test vehicle 1. During the EM test, the growth of Cu–Sn IMC on the anode side was faster than that on the cathode side because the electron flows from the cathode side to the anode side. In addition, a small amount of Cu6Sn5 IMCs was observed on the right upper side of the bump, even though the electrons flowed from the upper right corner to the lower left corner. Extensive Cu dissolution and large Cu6Sn5 IMCs can be seen in bumps B and D. Severe dissolution of the Cu electrode and cracks were found on the cathode side, while large Cu6Sn5 IMCs were formed on the right side of the bump near the anode. Dissolution of Cu electrode may be attributed to the current crowding effect in the flip-chip solder joint.Reference Nah, Paik, Suh and Tu16, Reference Yeh, Choi, Tu, Elenius and Balkan17 The current crowding locations at each solder bump were the corners of the joint interface where the electrons flew in or out.Reference Yamanaka, Tsukada and Suganuma12 Thus, Cu dissolution and cracks occurred at the right and left bottom corners of the bump. In bump C, although serious Cu dissolution was observed on the cathode side, Cu–Sn IMCs barely grew on the anode side as compared to bump B. Cracking was observed along the entire interface of the cathode side.
BS-SEM images of the cross-sectioned solder bumps after EM test for 110 h (test vehicle 1): (a) bump A, (b) bump B, (c) bump C, and (d) bump D.

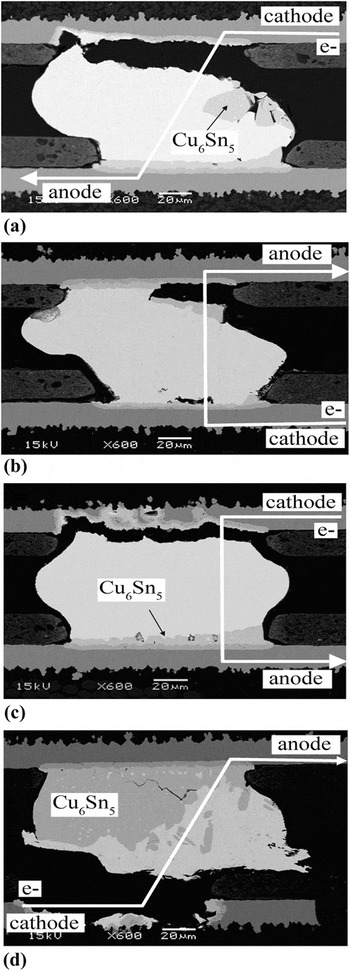
Figure 6 shows the microstructural changes of the bumps in test vehicle 2. In bump A, a small amount of Cu dissolution was observed on the cathode side and the Cu–Sn IMCs formed not only on the cathode side but also on the left side of the bump. In bump B, microstructural changes were almost the same as in bump A in test vehicle 1. Cu dissolution was barely found on the cathode side, and a few Cu–Sn IMCs were formed at the anode side. Formation of cracks on the anode side of bump B may have occurred during sample preparation as all the samples were already weakened because of the EM test. Serious Cu dissolution was observed in bump C and bump D, and the large Cu–Sn IMCs were formed only in bump D.
BS-SEM images of the cross-sectioned solder bumps after EM test for 140 h (test vehicle 2): (a) bump A, (b) bump B, (c) bump C, and (d) bump D.

C. Crystallographic orientation of Sn grains
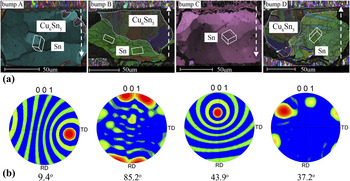
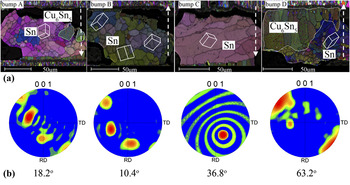
Figures 7 and 8 show the inverse pole figure orientation image maps (OIM) and the (001) density pole figure of the bumps in test vehicles 1 and 2. The dotted arrows indicate the electron flows, and the Sn unit cells at the location of the grains show the grain orientation. In Fig. 7(a), bump A is composed of one primary grain of Sn and the c-axis of the Sn grains is almost parallel to the Cu electrode. In this case, EM caused hardly any damage because the interstitial diffusion of Cu atoms along the c-axis is slower here than at the other bumps. However, bumps B, C, and D, at which extensive Cu dissolution was observed, had different orientations. The bumps also consisted of one or few randomly oriented grains, but the angles between the c-axis of the dominant grains close to the cathode side and the Cu electrode were large compared to those at bump A. Also, bump B, at which most of the Cu electrode dissolved in test vehicle 1, had the largest angle among the bumps. Fast failure of the test vehicle seems to occur at this bump, which had the largest angle of all the bumps in the same test vehicle. In the case of bump C, only a few Cu–Sn IMCs were observed on the anode side despite the dissolution depth of Cu atoms on the cathode side. The direction of the c-axis was toward the rear of the cross-sectioned solder bump. In Fig. 7(b), each bump shows irregular orientations of Sn grains. As described earlier, in bump A, the angle between the c-axis and Cu electrode was only 9.4°, which means it was almost perpendicular with electron flow. Bump B had an angle (85.2°) larger than that of the other bumps; thus, fast failure occurred at this bump because of the fast dissolution of Cu atoms on the cathode side. Also, same diffusion phenomenon with respect to the axis direction occurred in test vehicle 2. In Fig. 8, bumps C and D that had large angles (36.8° and 63.2°) in the group show serious Cu dissolution compared to the other bumps. Bumps A and B that had small angles (18.2° and 10.4°) with respect to the Cu electrode showed slight microstructural changes and small Cu dissolution. From these results, it is observed that fast failure of the test vehicle occurred due to the fast Cu diffusion from the cathode side when the c-axis had a large angle with respect to the Cu electrode. Slight microstructural changes and enhanced EM resistance was observed when the c-axis had a small angle with respect to the Cu electrode during EM testing.
(a) Electron backscattered diffraction (EBSD) inverse pole figure orientation image maps (OIM). (b) (001) Density pole figure of the bumps in test vehicle 1.

(a) EBSD inverse pole figure OIM. (b) (001) Density pole figure of the bumps in test vehicle 2.

D. Cu6Sn5 IMCs formation
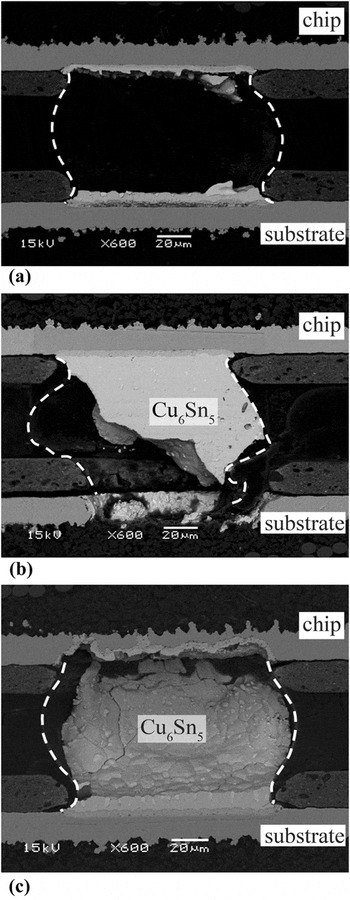
Another important finding was that, at the anode joint interface, Cu6Sn5 IMC grew in unexpected directions. During EM in conventional flip-chip solder joints, the thickness of the Cu–Sn IMCs increases until almost all the Cu atoms in the electrode are consumed. This is due to the much thinner layer of Cu metallization than the solder bump and the abundant supply of Sn. Most of the Cu atom supply for Cu6Sn5 formation on the anode side came from the cathode side of Cu metallization, and the driving force of Cu migration was generated by the electron wind force in the EM test; therefore, many Cu atoms may have accumulated and relocated to the Cu6Sn5 IMCs at the current crowding area. However, Cu6Sn5 IMCs were formed near the right upper corner, as shown in Fig. 5(a), and on the left side of the bump, as shown in Fig. 5(d). In addition, only a few Cu6Sn5 IMCs were found at bump C as shown in Fig. 5(c), even though a large amount of Cu atoms dissolved on the cathode side. If Cu atoms migrated along the c-axis of Sn grains, Cu6Sn5 IMCs might have formed inside the solder bump beyond the cross-sectioned area. To confirm this, Sn matrix of bumps A, B, and C in test vehicle 1 was selectively etched, as shown in Fig. 9.
BS-SEM images of bumps in test vehicle 1 after selective etching: (a) bump A, (b) bump B, and (c) bump C.

As expected, Cu6Sn5 IMCs were formed along the c-axis of the Sn grains in all bumps, even close to the anode side [Fig. 9(a)]. In particular, Fig. 9(c) confirms that the Cu atoms that disappeared on the cathode side formed Cu6Sn5 IMCs in the forward direction of the c-axis, not in the direction of electron flow. Also, a large Cu6Sn5 IMC formation was observed inside the solder bump because of the fast diffusion rate of Cu atoms along the c-axis. It was also confirmed that the formation of Cu6Sn5 IMCs in all the solder bumps was strongly related to the direction of the c-axis of the Sn grains rather than the direction of the electron flow.
IV. DISCUSSION
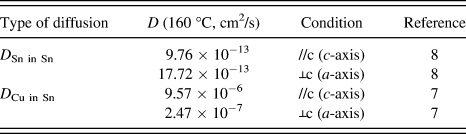
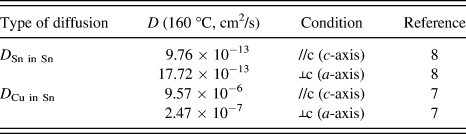
As shown in Figs. 5 and 6, each solder bumps clearly had a different microstructural behavior after current stressing, even though the bumps were in the same test vehicle. Also, in Figs. 7 and 8, we confirmed that the extensive Cu electrode dissolution and fast failure occurred when the c-axis of Sn grains was perpendicular to the Cu electrode. On the contrary, slight microstructural changes were observed when the c-axis of Sn grains was parallel to the Cu electrode. The reason for this difference in EM behavior can be attributed to the different Cu diffusion rates on the cathode side. The diffusion coefficient of the Cu atoms in a Sn matrix is dependent on the crystal orientation of Sn. Sn has a bct crystal structure with additional atoms located at (0.5, 0, and 0.25) and at (0, 0.5, and 0.75) and has a highly anisotropic diffusion characteristic. With the lattice constants a = b = 0.583 nm being much larger than that of the c-axis, c = 0.318 nm, the rate of diffusion depends strongly on the axis direction of Sn. In particular, the atoms of near-noble metals, such as Cu, Au, and Ag, have very fast rates of interstitial diffusion through the orthogonal site along the c-axis of Sn grains.Reference Dyson6, Reference Dyson, Anthony and Turnbull7Table I shows the anisotropic diffusion coefficients of Cu and Sn atoms in a Sn matrix with respect to the axis direction at 160 °C. The diffusivity of Cu along the c-axis is about 9.56 × 10⁻⁶ cm2/s, and it is about 40 times faster than that along the a-axis of Sn.
Diffusion coefficients, as given in the literature.
The general equation for total atomic flux can be described asReference Huang, Tsai, Lin and Kao18

where J chem indicates the chemical flux of Cu from Cu–Sn IMCs to Sn bump and J EM,Cu is the Cu flux in the solder because of the EM. The driving force of J chem is the Cu concentration gradientReference Liu, Ke, Chuang and Wang19 at the interface, and the direction is always from the Cu pad to the Sn bump at the cathode side.
In addition, the EM Cu flux can be described asReference Huntington, Nowick and Burton20

where C Cu is the atomic concentration of Cu, D Cu is the diffusion coefficient of Cu in Sn, k is the Boltzmann constant, T is absolute temperature, Z* is the effective charge number for Cu in Sn, e is the electron charge, and E is the applied electrical field. From this equation, it is clear that J EM,Cu is proportional to D Cu. Thus, the flux of Cu atoms along the c-axis (J EM,Cu,c) is larger than that along the a-axis (J EM,Cu,a).
Figure 10 shows the damage process with respect to the axis direction at the cathode joint interface during EM. Dissolution of Cu electrode occurred at the very beginning of the soldering process. After a short period of time, molten solder became saturated with Cu and Cu–Sn IMCs started to form, forming a continuous layer on the Cu electrode. The interface of the solder and IMCs reached a thermodynamic equilibrium state and dissolution of the Cu atoms stopped [Fig. 10(a)].Reference Shangguan21 During EM, however, concentration gradient of Cu atoms occurred at the solder near the cathode interface by J EM,Cu, and the Cu atoms in the IMCs on the cathode side dissolved out to the solder matrix by J chem because the driving force of J chem is Cu concentration gradient. Thus, dissolution flux of Cu (J diss) from the Sn–Cu IMCs can be expressed as the combination of J chem and J EM,Cu. As a result, different diffusion coefficients of Cu with respect to the axis direction of Sn causes different J EM,Cu and J chem. Consequently, different rates of dissolution of Cu pad were observed with respect to the axis of the Sn on the cathode side [Fig. 10(b)]. Finally, fast circuit failure occurred when the c-axis of Sn was parallel to the electron flow direction on the cathode side [Fig. 10(c)].
Schematic of the damage process during EM with respect to the axis direction: (a) without current stressing, (b) during current stressing, and (c) after circuit failure.

V. CONCLUSION
EM behaviors of Cu/Sn–3.0 wt% Ag–0.5 wt% Cu/Cu solder ball joints were examined, and remarkable difference in EM behavior depending on the crystallographic orientation of Sn was observed. Most bumps showed different microstructural changes, and failure of the test vehicle occurred due to the Cu dissolution on the cathode side. When the c-axis of Sn was parallel to the electron flow, fast dissolution of the Cu atoms occurred on the cathode side, resulting in fast circuit failure and huge growth of Cu–Sn IMCs. When the c-axis of Sn was perpendicular to the electron flow, slight microstructural changes compared to the other bumps were observed. Different EM behaviors with respect to the crystallographic orientation of Sn could be one of the possible reasons for different EM lifetimes. Understanding the cause of the failure might help in predicting EM lifetimes or enhancing EM resistance.