I. INTRODUCTION
Metal-matrix composites (MMCs) possess many advantages over monolithic materials, including higher specific strength, good wear resistance, higher thermal conductivity than ceramic materials, lower coefficient of thermal expansion, etc., and they have been used in the aircraft, space, defense, and automotive industries. Reference Ted Guo and Tsao1 On the other hand, owing to their higher strength combined with lighter weight beyond conventional metals and alloys, MMCs have been extensively applied in the automobile, aerospace, and electronics industries. Reference Wang, Li, Fan, Pan, Chen and Zhang2 Aluminum (Al) is an attractive material due to its low density, good corrosion resistance, high thermal and electrical conductivity, and high damping capacity. However, aluminum itself has insufficient hardness and wear-resistance for typical tribological applications. Reinforcing the ductile aluminum matrix with hard ceramic particles has been found to significantly improve the wear resistance of aluminum. This may result in utilizing aluminum matrix composites (AMCs) as wear resistant materials in automobiles, aircraft, and other applications. Reference Mohammad Sharifi and Karimzadeh3 Particulate-reinforced MMCs are the most attractive as commercial materials because of relatively low production costs and the possibility of using conventional shaping methods (extrusion, forging, and rolling) for component manufacture. Reference Slipenyuk, Kuprin, Yu, Spowart and Miracle4 Particle-, whisker-, and fiber-reinforced MMCs can sustain higher loadings than the unreinforced equivalent matrixes. Reference Corrochano, Cerecedo, Valcárcel, Lieblich and Guitián5 Ceramic-reinforced MMCs exhibit improved strength and wear resistant properties. Reference Rajkumar and Aravindan6 Corrochano et al. studied the effect of ball milling on the microstructure of powder metallurgy (PM) AMCs reinforced with MoSi2 intermetallic particles. Reference Corrochano, Lieblich and Ibáñez7
One of the most common processes for manufacturing MMCs is the PM process. PM is considered as a good technique in producing MMCs. An important advantage of this method is its low processing temperature compared to melting techniques. Therefore, interaction between the matrix and the reinforcement phases is prevented. On the other hand, good distribution of the reinforcing particles can be achieved. Reference Rahimian, Parvin and Ehsani8 Mehdi Rahimian et al. studied the effect of production parameters on microstructure and wear resistance of PM Al–Al2O3 composite. The range of sintering temperature and time were 500, 550, and 600 °C and 30, 45, 60 and 90 min, respectively. Reference Rahimian, Parvin and Ehsani8
MMCs were prepared using Zn–21Al–2Cu (zinalco) as base alloy, by means of PM techniques. Alumina particles were used as reinforcement in concentrations of 7, 14, and 27% in volume. Samples of the base alloy and of the different composites were sintered in air at 473 K in periods of 10, 20, 40, and 80 h. The measurements of density, hardness, and yield strength in compression were performed in green and sintered materials. Reference Martınez Flores, Negrete and Torres Villasenor9 Improvement in physical and mechanical properties of aluminum/zircon composites fabricated by PM method combining aluminum and zircon (ZrSiO4) will yield a material with the best corrosive resistance and mechanical properties like strength at high temperatures. Reference Abdizadeh, Ashuri, Tavakoli Moghadam, Nouribahadory and Reza Baharvandi10 The investigation on the effect of sintering temperature and time intervals on workability behavior of Al–SiC PM composites during cold upsetting was attempted in the present work. Three levels of sintering temperature and time have been considered to evaluate their effect on workability behavior. Reference Bensam Raj, Marimuthu, Prabhakar and Anandakrishnan11 The secondary processing techniques, such as forging, extrusion, etc., are known to refine the grain structure and improve physical properties of metals. The processing is also advantageous in context of reproducibility of finished parts and improved surface finish, as compared to its cast counterpart. Reference Dikshit, Gurjar, Dasgupta, Chaturvedi, Pathak and Jha12
Ramesh et al. studied the workability performance along with the consolidation behavior of aluminum (Al) and Al–5% silicon carbide (SiC) PM composites during cold upsetting. Reference Ramesh, Prabhakar and Narayanasamy13 To date, the Taguchi method has been widely and successfully used for determination of the optimum process parameters in various subject areas, such as aerospace, food, sports, communications, environment, construction, energy, materials manufacturing, milling, welding, mechanical engineering, and dental science. Reference Hamidreza Sadeghi, Moosavi, Karami and Behnia14 Now a days, many researchers using statistical technique to optimize the process parameters for synthesizing PM Materials. Recently, artificial neural network modeling has been applied to study the workability behavior of Al–SiC composite, Reference Sivasankaran, Narayanasamy, Ramesh and Prabhakar15 to study the drilling process parameters of Al–Al2O3–Gr hybrid composites Reference Hayajneh, Mahmood Hassan and Mayyas16 and to analyze the mechanical properties of Al2024–B4C composites synthesized through P/M route. Reference Varol, Canakci and Ozsahin17 Ravindran et al. used factorial techniques to study the wear behavior of Al hybrid composites with graphite addition. Reference Ravindran, Manisekar, Narayanasamy, Selvakumar and Narayanasamy18 Dasgupta et al. used Taguchi method for the optimization of process parameters in decalcification of samarium–cobalt intermetallic powder. Reference Dasgupta, Singh, Sahoo, Anitha, Awasthi and Singh19 Beygi et al. fabricated FeNi–Al2O3 nanocomposites and optimized the mechanical properties using Taguchi method. Reference Beygi, Zare and Sajjadi20
The present work aims to find the suitable process parameters for synthesize PM Al–10% MoO3 (Molybdenum-tri-oxide) composite using the application of Taguchi. Cold upset test was conducted for the sintered preforms to find out strength coefficient. An orthogonal array, the signal to noise ratio (S/N), and the analysis of variance (ANOVA) are used to investigate parameter effects on the strength coefficient. From the ANOVA and the S/N ratio response graphs, the significant parameters and the optimal combination level of PM parameters were obtained.
II. EXPERIMENTAL DETAILS
Atomized Al powder of 99.7% purity was used for the matrix material and MoO3 powder was used as reinforcement materials. The reinforcement material (MoO3) is blended with matrix material (Al) in the weight percentage to yield the Al + 10% MoO3 composite for the present work. The required mass of Al and MoO3 was blended in ball mill for 12 hours. The balls and powders weight ratio was 1:1 and the speed of the drum was calculated by the formula N = 32/√D, where D = Diameter of the drum. Reference Ravichandran, Naveen Sait and Anandakrishnan21
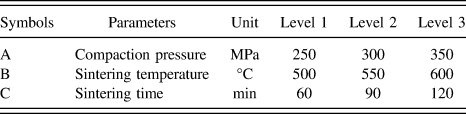
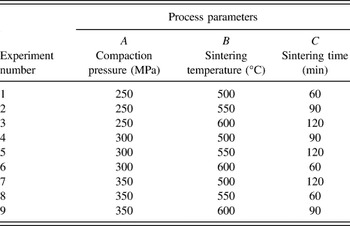
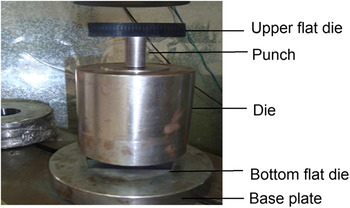
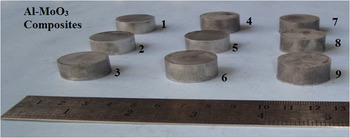
To make sintered preforms the PM parameters such as compaction pressure, sintering temperature, and sintering time are to be selected. These three PM parameters are very important to fabricate PM components with full density and strength. Reference Bensam Raj, Marimuthu, Prabhakar and Anandakrishnan11 In this study, an L9 orthogonal array with four columns and nine rows was used. Three levels of PM parameters and their levels are shown in Table I. The experimental layout for the three parameters using the L9 orthogonal array is shown in Table II. The powder mixtures were compacted as cylindrical billets of diameter 24 mm and the height 12 mm using computerized universal testing machine of 400 kN capacities with suitable punch and die by applying three levels of compaction pressure. The compaction process setup is shown in Fig. 1. Graphite mixed with lubricant oil was used as lubricant during compaction. Figure 2 shows the Al–10% MoO3 PM green compacts. An indigenously developed ceramic coating was applied on the free surfaces of the compacts to avoid oxidation and dried under room temperature for a period of 12 hours. The ceramic coated compacts were sintered in an electric muffle furnace at the three levels of temperatures such as 500, 550, and 600 °C for three levels of time periods of 60, 90, and 120 minutes and cooled to room temperature in the furnace itself.
Process parameters and their levels.

Experimental layout using an L9 orthogonal array.

Compaction process setup.

Photograph showing Al–10% MoO3 powder metallurgy green compacts.

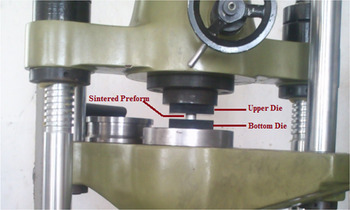
The sintered preforms were cleaned and measurements such as initial height (H 0), diameter (D 0), and mass (m) were measured. The cold upsetting was carried out for the sintered specimens in a hydraulic press with two flat high speed steel dies as shown in Fig. 3. The details of cold upsetting procedure had been well explained in our previous publications. Reference Ravichandran, Naveen Sait and Anandakrishnan21,Reference Ravichandran, Naveen Sait and Anandakrishnan22
Photograph showing cold upset set up.

III. RESULTS AND DISCUSSION
A. Finding of strength coefficient (K)
The relationship between true axial stress (σz) and true axial strain (εz) after the yield point perfectly fits a power law curve with the R
2 value very close to 1. Furthermore, the power law expression is given by
 $\sigma = K{\varepsilon ^n}$
where σ is the true axial stress, ε is the true axial strain, n is the strain hardening index, and K is the strength coefficient. The procedure for finding the strength coefficient from the stress–strain curve is reported elsewhere.
Reference Ravichandran, Naveen Sait and Anandakrishnan21
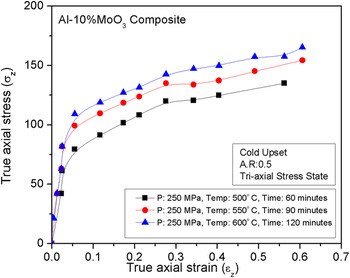
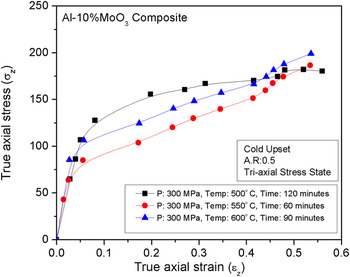
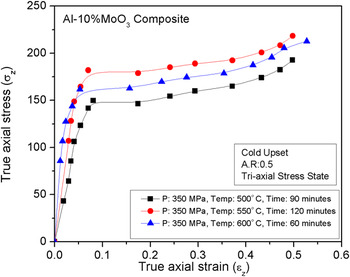
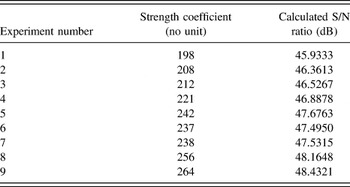
Figs. 4–6 show the graph drawn between true axial stress and true axial strain for the samples prepared as per L9 array during cold upsetting. With the help of these graphs the strength coefficient of all the preforms was calculated and represented in Table III. The strength coefficient for the pure Al was reported as 175.5 22 in the previous studies.
Reference Ravichandran, Naveen Sait and Anandakrishnan22
True axial stress–strain diagram of Al–10% MoO3 composite (compaction pressure at 250 MPa).

True axial stress–strain diagram of Al–10% MoO3 composites (compaction pressure at 300 MPa).

True axial stress–strain diagram of Al–10% MoO3 composite (compaction pressure at 350 MPa).

Experimental results for strength coefficient and calculated S/N ratios.

B. Statistical analysis
1. Analysis of S/N ratio
Taguchi recommends analyzing the S/N ratio using the conceptual approach that involves graphing the effects and visually identifying the factors that appear to be significant. Reference Dongxia, xiaoyan, dingyong, Zuoren and Hui23 The term “signal” represents the desirable value for the output characteristic and the term “noise” represents the undesirable value for the output characteristic. Therefore, the S/N ratio is the ratio of the mean to the square deviation (SD). Taguchi uses S/N ratio to measure the quality characteristic deviating from the desired value. Reference Kemal Bilici, Irfan Yükler and Kurtulmus24 The S/N ratio can be calculated using Eqs. (1) and (2).
 $${S \mathord{\left/ {\vphantom {S {N\,}}} \right. \kern-\nulldelimiterspace} {N\,}}{\rm{ratio}} = - 10\log \left( {{\rm{MSD}}} \right)\quad ,$$
Where MSD is the mean square deviation for the output characteristic.
For the strength coefficient, higher the better quality characteristic is taken. The MSD for the higher the better quality characteristic is expressed as
 $${\rm{MSD}} = {1 \over n}\sum\nolimits_{i = 1}^n {{1 \mathord{\left/ {\vphantom {1 {T_i^2}}} \right. \kern-\nulldelimiterspace} {T_i^2}}} \quad .$$
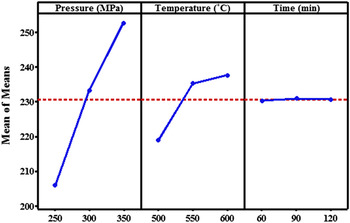
Table III shows the strength coefficients and the calculated S/N ratio of designed experiments. The variability can be expressed by S/N ratio, where the experimental condition having the maximum S/N ratio is considered as the optimal condition. It is shown in Fig. 7 that the compaction pressure and sintering temperature are more significant for the strength coefficient, whereas sintering time is insignificant.
The mean S/N response graph for strength coefficient.

2. Interaction effects of factors
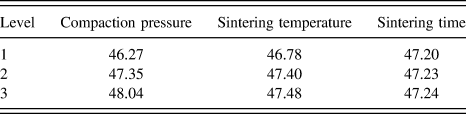
S/N response table for the strength coefficient is given in Table IV and it shows the mean S/N ratio for each level of the process parameters. Fig. 7 shows the S/N response graph for strength coefficient drawn using the results given in Table IV. In Fig. 7, the dashed line shows the total mean S/N ratio of the experiments. The graphs of Fig. 7 show the level effects of each process parameter. For example, the mean S/N ratio increases from A 1 to A 3. That means that the strength increases with the increase of the compaction pressure. Similarly increase in sintering temperature increase the strength coefficient. In this analysis, the compaction pressure has been determined to be the most effective parameter and sintering time has been found to be a minor effect on strength coefficient based on S/N ratio.
Response table for S/N (larger is better).

In any interaction graph, the parallel lines indicate the absence and nonparallel lines indicate significant presence of interaction effect of factors on the response. Interaction plot for the strength coefficient with respect to the compaction pressure, sintering temperature and sintering time are shown in Fig. 8. From the plot it is observed that the interaction of compaction pressure with sintering temperature is insignificant at low sintering temperatures and significant at higher temperature, the reason could be poor bonding between the particles at low sintering temperature and low compaction pressure, which in turn decreases the strength coefficient of the composite. The interaction of compaction pressure with sintering time is insignificant at low pressure and significant at higher pressure. The maximum strength coefficient is observed when the compaction pressure with medium sintering time. The higher compaction pressure increases the strength coefficient because of cold welling of powder particles during compaction and thus decreases the porosity. The interaction of sintering temperature with sintering time is significant at high temperature and insignificant at low temperature for the strength coefficient. Bensam Raj et al. reported that as sintering temperature and compaction pressure increase, the porosity level decreases and the relative density increases for the Al–SiC composites and it increases the all induced stresses during upsetting. Reference Bensam Raj, Marimuthu, Prabhakar and Anandakrishnan11
Interaction plot for strength coefficient.

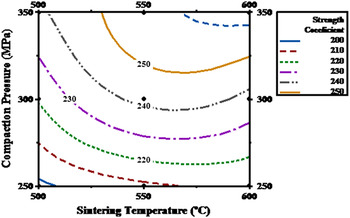
In present work, nine different process parameter combinations were used. Therefore, the effect of each parameter on the strength coefficient cannot be clearly understood from the result of Table IV. Minitab statistical software was used to explain the process parameter effect. From the results of Table IV, diagrams were drawn to display the process parameters effects on the strength coefficient. These diagrams are shown in Figs. 9–11. These diagrams illustrate the combine effects of any two parameters on the strength coefficient. In each graph, one process parameter effect was omitted. From Fig. 9, it is clearly understand that the compaction pressure between 300 and 350 MPa gives the maximum strength coefficient (250) for the Al–10% MoO3 composites at a sintering temperature of 550 °C. The lowest strength coefficient has been observed for the compaction pressure of 250 MPa and for a sintering temperature of 500 °C.
Contour plot for strength coefficient with respect to compaction pressure and sintering temperature.

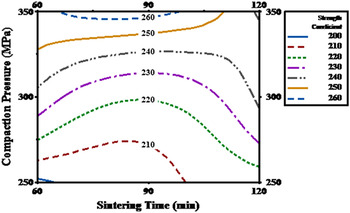
Contour plot for strength coefficient with respect to compaction pressure and sintering time.

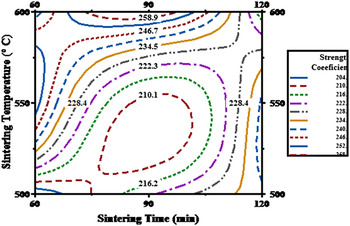
Contour plot for strength coefficient with respect to sintering temperature and sintering time.

Figure 10 shows the contour graph drawn between the compaction pressure and sintering time. From the figure it is observed that the high compaction pressure (350 MPa) and average sintering time (90 minutes) are required to obtain the maximum strength coefficient for Al–10% MoO3 composites. Figure 11 explains the effect of sintering temperature and sintering time on the strength coefficient of the Al–10% MoO3 composites. It is observed that the maximum strength coefficient can be achieved when the sintering temperatures between the 550–600 °C and the sintering time is 90 minutes.
3. Analysis of variance
The purpose of the ANOVA is to investigate the importance of the parameters on the quality characteristic. Further, statistical ANOVA was applied to decide whether the effect of the input factors is significant. Reference Beygi, Zare and Sajjadi20 Statistically, there is a tool called an F test named after Fisher to see which design parameters have a significant effect on the quality characteristic. In performing the F test, the mean of squared deviations (SSm) due to each design parameter needs to be calculated. The mean of squared deviations (SSm) is equal to the sum of squared deviations (SSd) divided by the number of degrees of freedom associated with the design parameter. Then, the F value for each design parameter is simply the ratio of the mean of squared deviations (SSm) to the mean of squared error.
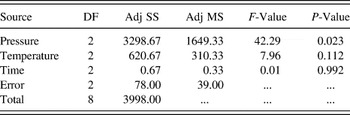
Table V shows the results of ANOVA on strength coefficient. It is found that the compaction pressure and the sintering temperature are important parameters, because their F values are 42.29 and 7.96, respectively. The compaction pressure found the dominant factor on the strength of the composite. The sintering temperature was also found to be effective on strength. The F value of the sintering time is only 0.01, therefore this parameter has an insignificant effect on the strength. Compaction pressure is identified as most significant factor with contribution percentage of 82.51%. The sintering temperature and sintering time are contributed only with 15.52 and 0.01%, respectively. These results are well agreed with findings of Rahimian et al. who reported for the Al–Al2O3 composites that the increase of sintering temperature increases the bonding between the particles and increases the compressive strength. Also they observed that increasing the sintering time from 60 to 90 minutes had no practical effects on the compressive strength after sintering at 550 °C. Reference Rahimian, Parvin and Ehsani8 Sintering characteristic of Al2O3-reinforced 2xxx series Al composite powders was investigated to obtain enhanced densification. The diffusion of the liquid phase was faster in the composite powder sintered specimen than in the blended powder sintered specimen. The liquid phase is thought to have infiltrated into the spaces between ceramic agglomerates. The results show that a greater amount of liquid phase is needed to enhance the sinterability of 2xxx series Al composite materials. Reference Ho Min, Pil Kang, Gun Kimb and Do Kim25
Results of the ANOVA for strength coefficient.

S = 6.24500; R-sq = 98.05%; R-sq(adj) = 92.20% and R-sq(pred) = 60.49%.
Adj SS: Adjusted sum of squares, Adj MS: Adjusted mean squares, DF: Degrees of freedom.
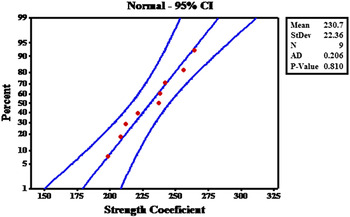
The common effects of process parameters on strength coefficient are shown in Figs. 9–11. From these figures, the optimal parameters for the strength coefficient can be predicted as: the compaction pressure 350 MPa, the sintering temperature 600 °C, and the sintering time 90 minutes. This result is very close to the S/N and ANOVA results. The residuals (errors) are found to be normally distributed along the straight line in the normal probability plot for strength coefficient as shown in Fig. 12.
Normal probability plot for strength coefficient.

4. Confirmation test
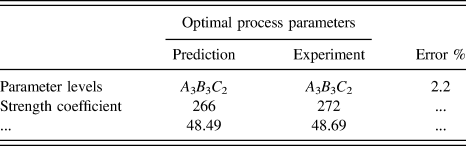
Once the optimal level of the design parameters has been determined, the final step is to predict and verify the improvement of the quality characteristic using the optimal level of the design parameters. Five samples were done with A 3 B 3 C 2 parameters and their average strength coefficient was obtained. Table VI shows the comparison of the predicted strength coefficient and actual strength coefficient of this composite preforms. A very low percentage error of 2.2% is obtained between the predicted and experimental value showing a very good correlation as shown in Table VI.
Results of the confirmation experiment.

C. Scanning electron microscope (SEM) and x-ray diffraction (XRD) analysis
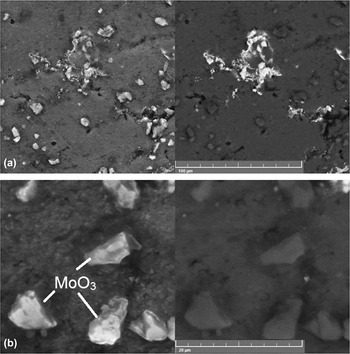
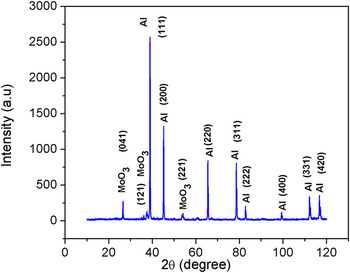
The optimization of the mechanical properties of AMCs is largely dependent on the microstructure of the material. A thorough characterization of the composite microstructure is required to understand the mechanical properties of AMCs. Reference Corrochano, Lieblich and Ibáñez7 Figures 13(a) and 13(b) show the SEM images with two different magnifications of Al–10% MoO3 composites sample fabricated using optimized process parameters. Figure 13(a) shows the uniform distribution of the MoO3 particles in Al matrix. Figure 13(b) shows the clear morphology of the reinforcement particles in the matrix. Apart from the compaction pressure, sintering time and sintering temperature, the uniform distribution of the reinforcements also could be one of the reasons for the improvement of the strength of the composite. Reference Slipenyuk, Kuprin, Yu, Spowart and Miracle4 The XRD pattern of Al–10 wt% MoO3 composites is shown in Fig. 14. The crystallinity of the pure Al was clearly evident by the sharp diffraction peaks at the respective diffraction angles, which can be readily indexed for cubic structure and are compatible with the standard JCPDS data (Card No. 85-1327). The crystalline nature of the Al is clearly evident by the sharper diffraction peaks presenting at corresponding diffraction angles to the consequent (111), (200), (220) and (311) (222) (4 00) (331) (420) planes with MoO3 phases of (041) (121) and (221). The XRD analysis also reveals the presence of MoO3 phases, but no other intermetallic phase was found.
SEM images of Al–10% MoO3 composite (a) low magnification (b) higher magnification.

XRD pattern of Al–10% MoO3 composite.

IV. CONCLUSION
The cold upsetting test was conducted for the Al–10 wt% MoO3 PM composites to evaluate the strength coefficient with the help of the Taguchi method. The following results were obtained by the experimental and the analytical results:
-
(1) The optimum parameters for the maximum strength of Al–10% MoO3 composite were identified as 350 MPa compaction pressure, 600 °C sintering temperature, and 90 minutes sintering time.
-
(2) From the ANOVA analysis, the compaction pressure was the most dominant parameter for strength followed by the sintering temperature. The sintering time has been identified as insignificant factor.
-
(3) SEM analysis of the sintered composite made as per the Taguchi predicted results shows the uniform distributions of the reinforcement and homogeneous in size.
-
(4) XRD analysis of the composite reveals the presence of MoO3 particles and no other intermetallic compounds were formed during sintering.