A unique longitudinal relation obtains when one intrapersonal characteristic influences another over time apart from temporal stability in each and their concurrent covariation. Such developmental paths are conservative and robust and imply that one characteristic shapes another in more than a transient way. Here, in two independent prospective longitudinal multimethod multi-informant converging analyses, we report such pathways between language and internalizing and externalizing behavior problems from early childhood to early adolescence. There are two primary questions addressed by our developmental analyses. What are the adolescent language outcomes for young children with different levels of behavioral adjustment? What are the adolescent behavioral adjustment outcomes for young children with different levels of language skills? Two secondary questions were presumptive to these primary questions. Are language and internalizing and externalizing behavioral adjustment stable individual-difference constructs from childhood to adolescence? What are the interconnections between language and these two forms of behavioral adjustment at different time points from childhood to adolescence?
Language and Behavioral Adjustment in Childhood and Adolescence
Language is a fundamental skill and a cornerstone of multiple cognitive and socioemotional aspects of development (Gleason & Ratner, Reference Gleason and Ratner2008; Hoff, Reference Hoff2008). It is also a necessary ingredient of successful social adjustment and functioning in society. Behavioral adjustment is likewise a basic ontogenetic functional adaptation. Extremes of maladjustment are commonly dichotomized into two empirically established distinctive syndromes of behavior problems (Achenbach, Reference Achenbach2000; Campbell, Reference Campbell1995). Internalizing or overcontrolled behavior problems are reflected in withdrawal, anxiety, depression, and dysphoria as well as feelings of inferiority, self-consciousness, shyness, hypersensitivity, and somatic complaints. Externalizing or undercontrolled behavior problems are characterized by defiance, impulsivity, disruptiveness, aggression, antisociality, and overactivity as well as problems with attention, self-regulation, and noncompliance (Achenbach, Howell, Quay, & Conners, Reference Achenbach, Howell, Quay and Conners1991; Allen & Prior, Reference Allen and Prior1995; Bornstein, Hahn, & Haynes, Reference Bornstein, Hahn and Haynes2010; Caspi, Henry, McGee, Moffitt, & Silva, Reference Caspi, Henry, McGee, Moffitt and Silva1995).
Studies from child psychiatry, developmental science, and psycholinguistics have historically hinted at comorbidity between language and behavioral maladjustment at various developmental periods from infancy through adolescence to adulthood (Beitchman et al., Reference Beitchman, Wilson, Johnson, Atkinson, Young and Adlaf2001; Fuijiki, Brinton, & Todd, Reference Fuijiki, Brinton and Todd1996; Johnson et al., Reference Johnson, Beitchman, Young, Escobar, Atkinson and Wilson1999; Mawhood, Howlin, & Rutter, Reference Mawhood, Howlin and Rutter2000; Petrill, Reference Petrill, Butler and Meaney2005; Rapin, Reference Rapin1998; Stattin & Klackenberg-Larsson, Reference Stattin and Klackenberg-Larsson1993; Stevenson, Reference Stevenson, Beitchman, Cohen, Konstantereas and Tannock1996; Williams & McGee, Reference Williams, McGee, Beitchman, Cohen, Konstantareas and Tannock1996). Moreover, these associations have obtained after controlling for ethnicity, socioeconomic status (SES), academic attainment, and test motivation (Evans, Reference Evans1996; Lynam, Moffitt, & Stouthamer-Loeber, Reference Lynam, Moffitt and Stouthamer-Loeber1993). Specific to the age range examined in the two present studies, approximately one-half of school-aged children who have psychosocial and emotional disorders exhibit problems with language and communication (Baker & Cantwell, Reference Baker and Cantwell1977), and teachers and parents both rate 5-year-old speech/language-impaired children as having more behavioral problems than do typically developing children (Beitchman, Nair, Clegg, Ferguson, & Patel, Reference Beitchman, Nair, Clegg, Ferguson and Patel1986). Rates of language impairment reach 24% to 65% in samples of children identified as exhibiting disruptive behaviors (Benasich, Curtiss, & Tallal, Reference Benasich, Curtiss and Tallal1993), and 59% to 80% of children identified as exhibiting language delays also exhibit disruptive behaviors (Beitchman et al., Reference Beitchman, Wilson, Brownlie, Walters, Inglis and Lancee1996; Brinton & Fujiki, Reference Brinton and Fujiki1993).
The literature linking language proficiency and behavioral adjustment is consistent and convergent, but most research in the field has been cross-sectional and descriptive or correlational, and so it is more suggestive than determinative because it has failed to institute proper or meaningful controls on method, design, or analysis to disentangle direction of effects, specificity of effects, or covarying effects. For example, longitudinal connections between language and behavioral adjustment could reflect their high initial association or their stability. One goal of the developmental path analyses undertaken here was to overcome these shortcomings and disambiguate mutually confounding considerations to expose potentially causative connections.
Modeling Possible Developmental Paths
What directional relations obtain between language and internalizing and externalizing forms of behavioral adjustment across childhood and into adolescence? Several possibilities present themselves (Hinshaw, Reference Hinshaw1992; Masten & Curtis, Reference Masten and Curtis2000). Poor behavioral adjustment might limit language development, perhaps because children are too depressed, self-consumed, or occupied with acting out to acquire competent language. Anxiety (internalizing) or aggression (externalizing) during social interactions might undermine the use of language. Aggressive children tend to generate more action-oriented, and fewer verbal, solutions in response to social dilemmas (Lochman, Lampron, & Rabiner, Reference Lochman, Lampron and Rabiner1989).
Alternatively, language might play a central role in the emergence and development of internalizing and externalizing behavior problems (Lynam & Henry, Reference Lynam, Henry, Hill and Maughan2001). Achieving verbal competency constitutes a key criterion by which children are judged by others and by themselves. Language deficiencies could negatively influence children's perceptions or judgments of themselves or others and could lead over time to the development of behavioral adjustment problems. Limited verbal abilities may reduce the capacity for self-control and inhibit social problem solving, and children who are less able to reason or assert themselves verbally may aggress to gain control in social exchanges. General failures to master cognitive tasks create vulnerabilities for future social and emotional failures (Cicchetti & Schneider-Rosen, Reference Cicchetti, Schneider-Rosen, Rutter, Izard and Read1986). Likewise, competency-based models of depression propose that feedback from others (parents, peers, or teachers) across different domains of performance (including language) affects self-image and subsequently the development of depressive symptoms (Cole, Reference Cole1990, Reference Cole1991). Insofar as language helps to regulate both self-control and achievement, children with less optimal language skills might, out of frustration, become depressed/withdrawn or aggressive/disruptive. It is hardly surprising that, when children experience difficulty understanding others and expressing themselves, psychosocial and emotional adjustment problems ensue. Children who are poor communicators do not send clear messages and therefore may be difficult to understand and respond to appropriately, and they may have fewer positive interactions with others. In short, language failures might contribute to socioemotional symptomatology.
It is also possible that language and behavioral adjustment develop from common underlying endogenous or exogenous influences (Hill, Reference Hill2001) so that they emerge simultaneously and unfold in tandem. Neurodevelopmental delay of basic attentional, perceptual, and motor functions could be linked to language deficits, inhibition, or aggression (Moffitt, Reference Moffitt, Morris and Tonry1990; Moffitt & Silva, Reference Moffitt and Silva1988). Parental rearing practices, maternal education, or family SES constitute other possible shared generators. In a nutshell, language-behavioral adjustment associations could reflect third variables that have established histories of predictive significance for both.
The developmental paths design implemented in the present studies allowed us to examine temporal influences between language and internalizing and externalizing behavior problems. In addition, it allowed examination of how the two forms of behavioral adjustment influence one another. Internalizing behavior problems could constrain the development of externalizing behavior problems because behavioral inhibition diminishes risk taking and/or involvement with deviant peers (Mesman, Bongers, & Koot, Reference Mesman, Bongers and Koot2001). Less inhibited children are more likely to increase in externalizing behavior problems. Alternatively, internalizing behavior problems may augment externalizing behavior problems (Bornstein et al., Reference Bornstein, Hahn and Haynes2010; Burt, Obradović, Long, & Masten, Reference Burt, Obradović, Long and Masten2008; Masten et al., Reference Masten, Roisman, Long, Burt, Obradović and Riley2005; Moffitt, Caspi, Harrington, & Milne, Reference Moffitt, Caspi, Harrington and Milne2002; Pine, Cohen, Cohen, & Brook, Reference Pine, Cohen, Cohen and Brook2000). There is also evidence that externalizing behavior problems generate internalizing behavior problems over time (Kiesner, Reference Kiesner2002; Lahey, Loeber, Burke, Rathouz, & McBurnett, Reference Lahey, Loeber, Burke, Rathouz and McBurnett2002). Children's externalizing behavior problems at age 3 predict both internalizing and externalizing behavior problems at age 12 (Pihlakoski et al., Reference Pihlakoski, Sourander, Aromaa, Rautava, Helenius and Sillanpää2006).
Of course, other developmental paths between these two forms of behavioral adjustment, even involving language, are possible. For example, language might serve as an intervening link between internalizing and externalizing behavior problems (see Mesman et al., Reference Mesman, Bongers and Koot2001; Mesman & Koot, Reference Mesman and Koot2001, for an analogous three-term chain). Relevant data addressing this possibility are lacking.
Stability and Covariation of Language and Behavioral Adjustment Across Childhood
Secondary to these principal pathways questions, the two studies presented here also provided data on the stabilities in language and internalizing and externalizing behavior problems as well as their concurrent covariations. Stability describes consistency in the relative ranks of individuals in a group with respect to some characteristic through time, and covariation describes the association of distinct constructs at any given time (Bornstein & Bornstein, Reference Bornstein, Bornstein and Darity2008; Hartmann, Pelzel, & Abbott, Reference Hartmann, Pelzel, Abbott, Bornstein and Lamb2011). Stability and covariation constitute important developmental issues in their own right. In addition, in the assessment of developmental paths among constructs, it is important to account for the stability and covariation of the constructs to rule out alternative explanations of longitudinal effects in terms of initial associations persisting or consistency in any one construct carrying lagged associations.
Stability of language in children
In the age range of the current study (including the important transition from preschool to school), across multiple tests at each age and across multiple informants, children show moderate to strong stability in individual differences of language. For example, Bornstein, Hahn, and Haynes (Reference Bornstein, Hahn and Haynes2004) reported language stability in age-appropriate maternal questionnaires and interviews, teacher reports, experimenter assessments, and transcripts of children's own spontaneous speech. Furthermore, that stability does not normally differ for girls and boys (Bates, Bretherton, & Snyder Reference Bates, Bretherton and Snyder1988; Bornstein, Tamis-LeMonda, & Haynes, Reference Bornstein, Tamis-LeMonda and Haynes1999; Feldman et al., Reference Feldman, Dollaghan, Campbell, Kurs-Lasky, Janosky and Paradise2000).
Stability of behavioral adjustment in children
Behavior problems that manifest early in life frequently endure (Rutter, Reference Rutter1989), and their stability is high from 3 to 4 years on and even increases with increasing age (Hemphill, Reference Hemphill1996; Koot & Verhulst, Reference Koot and Verhulst1992; McConaughy, Stanger, & Achenbach, Reference McConaughy, Stanger and Achenbach1992; Verhulst & vam der Ende, Reference Verhulst and vam der Ende1995). Thus, relatively high stability is found for both internalizing and externalizing behavior problems (Achenbach, Howell, McConaughy, & Stanger, Reference Achenbach, Howell, McConaughy and Stanger1995; Hofstra, vam der Ende, & Verhulst, Reference Hofstra, vam der Ende and Verhulst2002; Kim-Cohen et al., Reference Kim-Cohen, Caspi, Moffitt, Harrington, Milne and Poulton2003; Masten et al., Reference Masten, Roisman, Long, Burt, Obradović and Riley2005; Mesman & Koot, Reference Mesman and Koot2001; Moffitt & Caspi, Reference Moffitt and Caspi2001). In a review of longitudinal studies, Koot (Reference Koot, Verhurst and Koot1995) concluded that one-third to one-half of children with deviant behaviors remained deviant after 2 to 6 years. In general, somewhat higher stabilities are reported for externalizing behavior problems than for internalizing behavior problems (Burt et al., Reference Burt, Obradović, Long and Masten2008), although it could be that externalizing behavior problems are easier to observe and recognize than are internalizing behavior problems.
Covariation of language and behavioral adjustment in children
As indicated earlier, correlations between externalizing behavior problems and internalizing behavior problems are moderate to high (Achenbach & Edelbrock, Reference Achenbach and Edelbrock1983; Caspi et al., Reference Caspi, Henry, McGee, Moffitt and Silva1995), and studies of community and clinical samples alike have shown associations of childhood antisocial behaviors with symptoms of anxiety and depression (Burt et al., Reference Burt, Obradović, Long and Masten2008). The two also have been found to be comorbid with deficits in language skills (Lynam & Henry, Reference Lynam, Henry, Hill and Maughan2001). Thus, the distinct domains of language and behavioral adjustment appear to relate meaningfully to one another through the course of development (Burt et al., Reference Burt, Obradović, Long and Masten2008; Masten, Burt, & Coatsworth, Reference Masten, Burt, Coatsworth, Cicchetti and Cohen2006; Masten et al., Reference Masten, Roisman, Long, Burt, Obradović and Riley2005).
Overview of the Two Studies
A step in investigating developmental pathways among children's language and their internalizing behavior problems and externalizing behavior problems is to untangle direction, specificity, and sources of mutual effects over and above their temporal stability and concurrent covariation. We attempted to do this in two longitudinal designs that cumulatively spanned the ages from 4 to 14 years. In Study 1, we investigated developmental pathways in a two-wave 2.5-year study of children across the transition from preschool to grade school. Findings of Study 1 were cross-validated in Study 2 on a second independent sample. We expanded the scope of our investigation in Study 2 to a three-wave 10-year span from early childhood to late childhood to early adolescence. Data were gathered from the principal stakeholders in children's development: child, mother, and schoolteacher. Constructs were assessed by multiple measures. We used path analysis to conduct long-term, longitudinal, robust tests of developmental pathways involving three domains: language, internalizing behavior problems, and externalizing behavior problems. This approach allowed for examination of longitudinal cross-domain paths while controlling for both within-domain cross-time stabilities and cross-domain within-time covariation.
Few studies collect measures of at least three constructs across at least three time intervals, fewer assess longitudinal effects over and above stability and covariation in the constructs, and fewer still attempt cross-validation with independent samples. Guided by extant research, we developed three main hypotheses. First, we expected to find stability of language and behavioral adjustment from childhood to adolescence as well as their covariation at each time point. Second, we hypothesized cross-domain cross-time predictions between language and internalizing behavior problems, and perhaps between language and externalizing behavior problems, between adjacent time points even after controlling for stability and covariation. Third, we hypothesized that internalizing behavior problems and externalizing paths would be correlated across time after controlling for stability, covariation, and cross-domain cross-time correlations of language with internalizing and externalizing behavior problems. In follow-up analyses, we also hypothesized that the final path model would hold controlling for key variables and third-variable causes.
General Methods
Certain features of the participants, procedures, preliminary data analyses, and analytic plans were common to the two longitudinal studies. They are reported here.
Participants
Each sample consisted of normal, healthy, firstborn girls and boys. Families were mostly European American (Study 1: 96.5% and Study 2: 100%) and monolingual English speaking but drawn from a broad range of socioeconomic class (Hollingshead, Reference Hollingshead1975; Four Factor Index of Social Status assessed at the first data collection wave, Study 1: M = 58.29, SD = 7.20, range = 35–66, and Study 2: M = 55.99, SD = 9.20, range = 29–66; see Bornstein, Hahn, Suwalsky, & Haynes, Reference Bornstein, Hahn, Suwalsky, Haynes, Bornstein and Bradley2003). Families were recruited in a US East Coast metropolitan area through announcements in local newspapers, contacts with local nursery schools and childcare centers, and mass mailings. The two community samples were therefore socioeconomically heterogeneous in terms of maternal education and family SES, although they overrepresented families with higher SES. We recruited an ethnically homogenous European American sample because they are currently the majority cultural group in the United States (the vast majority of the population of the United States self-identifies as European American in descent; Humes, Jones, & Ramirez, Reference Humes, Jones and Ramirez2011; Tilton-Weaver & Kakihara, Reference Tilton-Weaver, Kakihara and Arnett2008; US Census Bureau, 2008) and because we wanted to understand the matrix of associations surrounding language and behavioral adjustment in one group before embarking on more complex studies and analyses with ethnically diverse samples (by including only European Americans, we intentionally avoided an ethnicity confound that might cloud our findings if ethnic groups were combined; Jager, Reference Jager2011; Twenge & Crocker, Reference Twenge and Crocker2002).
Procedures
Children, their mothers, and teachers all provided data. Prior to data collection, mothers were informed of the nature of the study, including that the child's teacher would be asked to provide information about the child in the school setting. For both studies, mothers completed questionnaires that supplied demographic information about the child's health status, their own education history, marital status, family language, and the like. Each mother also received a packet to give to the child's teacher that contained a letter explaining the study and requesting the teacher's assistance in providing information, a postage-paid return envelope, and questionnaire(s). Informed consent/assent was obtained from mothers, teachers, and adolescents. Participants were modestly compensated for their time, and these studies were approved and monitored by our institutional review board.
Preliminary analyses and analytic strategy
At each wave, we examined concurrent correlations of child age with any scale scores that were not age standardized to determine if age adjustments were warranted. In neither study did child age correlate with any concurrent outcome measures; child age was therefore excluded as a covariate. Based on a path analytic approach, we computed language and behavioral composite scores at each wave relative to their indicators for that developmental period. Prior to data analysis, distributions of language and behavior adjustment measures were examined for normality and outliers (Tabachnick & Fidell, Reference Tabachnick and Fidell2007). Transformed variables were used in analyses (as indicated); for clarity, untransformed data are presented in reports of descriptive statistics.
We fit path models using maximum likelihood functions and followed the mathematical models of Bentler and Weeks (Reference Bentler, Weeks, Krishnaiah and Kanal1980) as implemented in EQS 6.1 (Bentler, Reference Bentler1995; Bentler & Wu, Reference Bentler and Wu1995). Prior to fitting path models, we inspected bivariate plots to confirm that variables in the models were linearly related and that no curvilinear effects obtained between pairs of variables. Influential cases were evaluated by scatter plot inspection and numeric statistics from preliminary regressions (Cook D, the studentized deleted residual, and the leverage). In the course of fitting path models, we evaluated Mardia (Reference Mardia1970) coefficients of multivariate kurtosis, case(s) that contributed disproportionately to parameter estimates, and the stability of parameter estimates. To evaluate the significance of parameter estimates in the final models, we report the standardized coefficients but evaluated their probabilities using robust standard errors for the unstandardized coefficients.
The results in each study are discussed in the following order. First, descriptive statistics for all language and internalizing and externalizing behavior problem measures are reported. Second, zero-order concurrent and predictive relations between language and internalizing and externalizing behavior problems are evaluated (where r ≈ .10 is interpreted as a small effect, r ≈ .25 as a medium effect, and r ≈ .40 as a large effect; Cohen, Reference Cohen1988). Third, analytic models were tested to establish the direction and timing of developmental pathways.
In preliminary analyses, we assessed child gender as a moderating variable. However, inspection of the correlations and multisample analysis of the path models indicated no significant differences between girls and boys in either study; therefore, gender was not considered further. All analyses are based on each study's full sample.
Study 1: Pathways From 4.5 to 7 Years
Participants
The first study sample consisted of 85 children (45 girls, 40 boys), their mothers, and teachers, who provided data at two ages. On average, children were 4.52 years old (SD = 0.25, range = 4.08–4.92) at the first assessment wave when all were attending preschool, and they were 6.83 years old (SD = 0.35, range = 5.75–7.58) at the second assessment wave when all were in Grade 1. At the first assessment, mothers averaged 34.63 years of age (SD = 3.73, range = 25.20–45.00); 3 mothers had completed high school, 11 had partial college, 26 had completed college, and 45 had graduate professional training or had completed graduate degrees. Initially, 113 children were recruited, so 28 were lost to follow up. These 28 children and the 85 in the final study sample did not differ in any of the child language, internalizing behavior problem, or externalizing behavior problem measures (see below), except children who were lost to follow-up scored higher on the Preschool Behavior Questionnaire (PBQ; Behar & Stringfield, Reference Behar and Stringfield1974) hostile–aggressive subscale than did those who were followed up at Grade 1.
Procedures
At 4.5 years, data on child language were derived from experimenter assessments and maternal and teacher reports. At 7 years, data on child language were derived from experimenter assessments. The child's preschool and Grade 1 teachers were independently queried about the child's internalizing and externalizing behavior problems using a standardized instrument.
Language
At 4.5 years the Test of Language Development—Primary (TOLD-P; Newcomer & Hammill, Reference Newcomer and Hammill1982) and the Verbal Scale of the McCarthy Scales of Children's Abilities (McCarthy, Reference McCarthy1972) were administered to the child, and mothers and teachers completed the Vineland Adaptive Behavior Scales communication domain (VABS; Sparrow, Balla, & Cicchetti, Reference Sparrow, Balla and Cicchetti1984, Reference Sparrow, Balla and Cicchetti1985) via interview and questionnaire, respectively. At 7 years the Wide Range Achievement Test—Revised Edition (Jastak & Wilkinson, Reference Jastak and Wilkinson1984) was administered to the child during a laboratory visit. The TOLD-P is a standardized instrument for assessing language comprehension and production in children 4 years through 8 years, 11 months. The spoken language quotient (M = 100, SD = 15), a measure of general language that reflects the child's ability in semantics, syntax, speaking, and listening, is derived from five subtests. The TOLD-P standardization sample consisted of 1,836 children; split-half reliability coefficients for the subtests range from 0.71 to 0.95 for children at 4 years. The MCSA was used to assess children's ability to express themselves verbally and the maturity of their verbal concepts. The Verbal Scale (M = 50, SD = 10) had a split-half reliability coefficient of 0.88 for a standardization sample of 104 children at 4 years, 6 months. The VABS: Interview Edition—Survey Form communication domain was used to obtain mothers' estimates of their children's communication skills. The standard score (M = 100, SD = 15) for the communication domain is the converted sum of raw scores for the receptive, expressive, and written subdomains and had a split-half reliability coefficient of 0.93 for a standardization sample of 200 children at 4 years. The VABS–Classroom Edition provides a teacher's assessment of the child's communication skills in the classroom. The standard score (M = 100, SD = 15) for the communication domain is the converted sum of raw scores for the receptive, expressive, and written subdomains. The Wide Range Achievement Test—Revised Edition was administered at 7 years to measure multiple language capacities, including basic knowledge of reading (word recognition and pronunciation) and written spelling. Standard score (M = 100, SD = 15) norms are based on a sample of over 5,000 individuals ranging in age from 5 years to adulthood. The reliability coefficients for 6- and 7-year-old children vary from 0.96 to 0.97 for reading and 0.91 to 0.94 for spelling.
Internalizing and externalizing behavior problems
Children's teachers completed the PBQ (Behar & Stringfield, Reference Behar and Stringfield1974), a standardized screening instrument for early detection of behavioral adjustment in children 3 to 6 years. The total disturbed behavior (TDB) score is the sum of three subscale scores and six additional “behavior problem” items. The PBQ has high interrater (r = .84) and test–retest (3–4 months apart; r = .87) reliabilities in a sample of 89 preschool children (Behar, Reference Behar1977). The mean TDB score from standardization samples of 496 preschool children in a “normal” group was 8.01 (SD = 7.72) and of 102 children in a “deviant” group was 21.32 (SD = 6.80); mean TDB scores differentiated beyond the .001 level of significance between the two groups (Behar & Stringfield, Reference Behar and Stringfield1974). To better characterize behavioral variables from teacher reports, based on previous research on the factor structure of the PBQ (Fowler & Parke, Reference Fowler and Park1979), we created an aggregated standardized score from each questionnaire representing internalizing and externalizing behavior problems. The child's Grade 1 teacher completed the Revised Behavior Problem Checklist (RBPC; Quay & Peterson, Reference Quay and Peterson1983), which provides reliable and valid information about dimensions of behavior deviance in children (Short, Reference Short1991). Norms are based on both normal and clinical samples, and interrater reliabilities range from 0.52 to 0.85. Two aggregated standardized scores representing internalizing and externalizing behavior problems were computed based on the manual for the RBPC (Quay & Peterson, Reference Quay and Peterson1987). The Grade 1 internalizing behavior problems score was derived from the RBPC anxiety–withdrawal and psychotic behavior scales. The Grade 1 externalizing behavior problems score was derived from the RBPC conduct disorder, socialized aggression, attention problems–immaturity, and motor excess scales.
Covariates
Child nonverbal intelligence
The Perceptual-Performance Scale of the McCarthy Scales of Children's Abilities was administered at 4.5 years to evaluate children's reasoning abilities through imitation, logical classification, and visual organization in a variety of spatial, visual–perceptual, and conceptual tasks.
Maternal education
Maternal education was measured using the Hollingshead (Reference Hollingshead1975) Four Factor Index 7-point education scale when the child was 4.5 years of age.
Maternal parenting knowledge
The Concepts of Development Questionnaire (Sameroff & Feil, Reference Sameroff, Feil and Sigel1985) was used to evaluate mothers' understanding of child growth and development on a scale ranging from categorical to compensating to perspectivistic. At the categorical level, child development is seen as determined by a single cause. Compensating level items assess a parent's awareness of the interaction between the child and his or her environment in producing developmental outcomes. At the perspectivistic level, child behavior is seen as the outcome of complex, transactional processes. The total score, which combined the amount of agreement to the compensating–perspectivistic items and the amount of disagreement to the categorical items, was used in analysis. Sameroff and Seifer (Reference Sameroff and Seifer1983) reported significant concurrent correlations between mothers' concepts of development scores and measures of their 4-year-olds' cognitive and social competence.
Family SES
Family SES was assessed using the Hollingshead (Reference Hollingshead1975) index when the child was 4.5 years old.
Statistical analyses
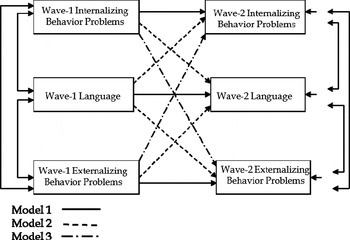
A series of nested path analysis models was examined to test the three hypotheses of the present study involving the interconnections between language and internalizing and externalizing behavior problems at different time points from early to middle childhood. Figure 1 presents the three hypothesized path models we tested. Model 1 tested our first hypothesis about stability of each domain between adjacent time points as well as within-time covariation among domains. Model 2 added four cross-domain paths to test our second hypothesis about cross-domain cross-time predictions between language and internalizing behavior problems, and between language and externalizing behavior problems, between adjacent time points. Model 3 added two paths to test our final hypothesis about cross-domain cross-time predictions between internalizing and externalizing behavior problems between adjacent time points.
The summary of the free parameters estimated for the nested path models.

The choice of the final model was based on the robust Satorra–Bentler scaled chi-square statistic (S-B χ2; Satorra & Bentler, Reference Satorra, Bentler, Storey and Cressy1988, Reference Satorra, Bentler, Von Eye and Clogg1994) and the robust comparative fit index (CFI; Bentler, Reference Bentler1990). The standardized root mean square residual (SRMR; Browne & Cudeck, Reference Browne, Cudeck, Bollen and Long1993) is reported because of the relatively small sample sizes (N ≤ 250; Hu & Bentler, Reference Hu and Bentler1999). Cutoff values close to 0.95 for CFI and close to 0.09 for SRMR are indicative of a relatively good fit between the hypothesized model and the observed data (Hu & Bentler, Reference Hu and Bentler1999). In addition, the chi-square difference test for nested models was computed with each more parsimonious model compared to the next more complex model. A significant chi-square difference test implied that the successive complex model fit the data significantly better than the previously more parsimonious one. To enhance the cross-validation adequacy of models, the Akaike information criterion (AIC; Akaike, Reference Akaike1987; Kaplan, Reference Kaplan2000) was monitored for its decreasing value in all nested models.
The final path model was evaluated controlling for key variables and third-variable causes. We considered child nonverbal abilities, maternal education and parenting knowledge, and family SES as potential covariates. To qualify as a covariate in the path model, a candidate variable had to correlate significantly (p < .05) with the composite scores in the expected direction. We postulated within-time correlations between covariates and child outcomes (e.g., Wave 1 covariates with Wave 1 outcomes) and direct paths from covariates at an earlier time to child outcomes at a later time (i.e., from Wave 1 covariates to Wave 2 outcomes) in the path models. Covariates were allowed to correlate within ages.
Results
Descriptive statistics
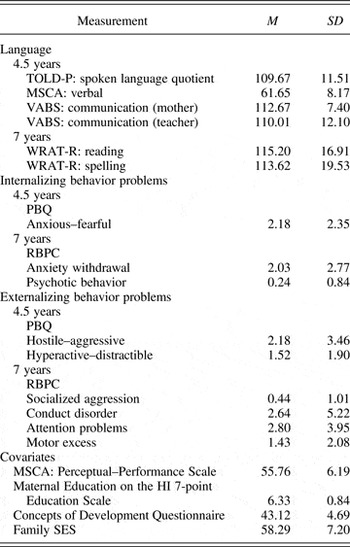
Table 1 shows the means and standard deviations for all child measures and potential covariates for the total study sample. At 4.5 and 7 years, all child language and internalizing and externalizing behavior problem scores fell within or around one standard deviation of means reported in standardization samples.
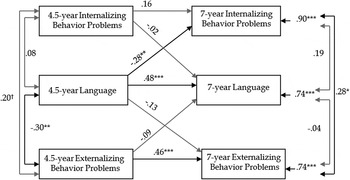
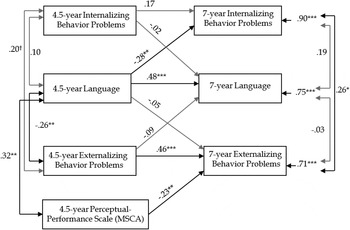
The Study 1 standardized solution for the final model on the total sample (N = 85). The numbers associated with single-headed arrows are standardized path coefficients, and the numbers associated with double-headed arrows are standardized covariance estimates. The arrows associated with dependent variables are error variances and represent the amount of variance not accounted for by paths in the model. †p = .06. *p < .05. **p < 01. ***p < .001.

Study 1 descriptive statistics of language, behavioral adjustment measures, and potential covariates

Note: TOLD-P, Test of Language Development—Primary (Newcomer & Hammill, Reference Newcomer and Hammill1982); MSCA, McCarthy Scales of Children's Abilities (McCarthy, Reference McCarthy1972); VABS (Mother), Vineland Adaptive Behavior Scales: Interview Edition Survey Form (Sparrow et al., Reference Sparrow, Balla and Cicchetti1984); VABS (Teacher), Vineland Adaptive Behavior Scales—Classroom Edition (Sparrow et al., Reference Sparrow, Balla and Cicchetti1985); WRAT-R, the Wide Range Achievement Test—Revised edition (Jastak & Wilkinson, Reference Jastak and Wilkinson1984); PBQ, Preschool Behavior Questionnaire (Behar & Stringfield, Reference Behar and Stringfield1974); RBPC, Revised Behavior Problem Checklist (Quay & Peterson, Reference Quay and Peterson1983); SES, socioeconomic status.
Language and behavior problem composite scores
Summary scores representing language and externalizing behavior problems at ages 4.5 and 7 years and for internalizing behavior problems at age 7 years were each computed as the mean standard scores of all relevant scale scores obtained at each respective age and were used in path analysis models. The anxious–fearful subscale of the PBQ was the sole indicator of age 4.5-year internalizing behavior problems; it was used as an observed variable in the models, and no mean standard score was computed for age 4.5-year internalizing behavior problems.
Correlations among scale scores for language, externalizing behavior problems, and internalizing behavior problems at each of the two ages were all positive and, in most cases, significant. The correlation between the two indicators of language at age 7 years was r (83) = .87, p < .001. Correlations between the two indicators of externalizing behavior problems at age 4.5 years was Spearman ρ (83) = 0.61, p < .001, and between the two indicators of internalizing behavior problems at age 7 years it was ρ (83) = 0.16, p = .14. Before testing our hypotheses, measurement models of language and behavior problem constructs that consisted of more than two indicators were evaluated for the fit of the observed scale scores as indicators of the composites. Excellent model fits were achieved for both language at age 4.5 years and externalizing behavior problems at age 7 years: for 4.5-year language, S-B χ2 (2) = 3.96, p = .14 (robust CFI = 0.95, SRMR = 0.05, AIC = –0.04), with factor loadings ranging from .42 to .85; for externalizing behavior problems at age 7 years, S-B χ2 (2) = 4.55, p = .10 (robust CFI = 0.95, SRMR = 0.05, AIC = 0.55), with factor loadings ranging from 0.38 to 0.80. Factor loadings were all significant at the .05 level or better. The Cronbach α reliability coefficients were 0.67 and 0.74 for 4.5-year language and 7-year externalizing behavior problem composite variables, respectively.
All four 4.5- and 7-year internalizing and externalizing behavior problem aggregate scores required log10 transformations to approximate normality and resolve problems of outliers (Tabachnick & Fidell, Reference Tabachnick and Fidell2007). In the path models, univariate measures of kurtosis and normalized estimates of Mardia multivariate coefficients indicated no significant problems of nonnormality, and no single case contributed disproportionately to parameter estimates.
Zero-order correlations
Stability of language and behavioral adjustment
Children's language and their externalizing behavior problems showed strong stability from ages 4.5 to 7 years, rs (83) = .50 and .51, respectively, ps < .001. Children's internalizing behavior problems were positively, but nonsignificantly, stable, r (83) = .17, ns.
Concurrent and predictive relations between language and behavioral adjustment
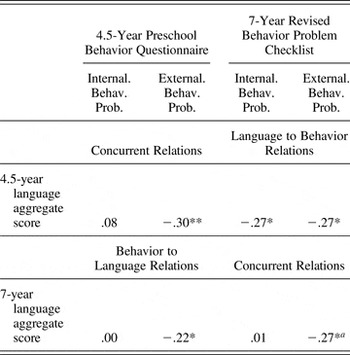
Table 2 presents concurrent and predictive relations between language and the two behavioral adjustment measures. The diagonal sections of Table 2 provide evidence for concurrent associations between language and behavioral adjustment problems in 4.5- and in 7-year-old children. No significant concurrent relations emerged between language and internalizing behavior problems at either age. However, children with lower language skills exhibited more externalizing behavior problems at 4.5 years and 7 years, and vice versa. Internalizing and externalizing behavior problems were marginally related at 4.5 years, r (83) = .20, p = .07, and significantly so at 7 years, r (83) = .35, p = .001.
Study 1 concurrent and predictive relations between language and behavioral adjustment measures at 4.5 and 7 years
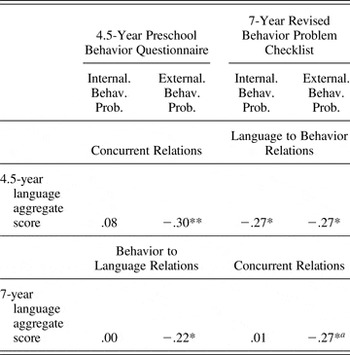
aOne case emerged as an influential case (Cook D = 0.33) and was removed from this analysis; before removing this case, r (83) = −.19, p = .075.
*p < .05. **p < .01.
The lagged zero-order correlations of language to behavior adjustment (Table 2, top right) suggest that inferior language ability at 4.5 years predicts more internalizing and externalizing behavior problems at 7 years, whereas the behavior problems to language correlations (Table 2, bottom left) indicate only that more externalizing behavior problems at age 4.5 years predict inferior language skills at age 7 years. For internalizing behavior problems at age 4.5 years to externalizing behavior problems at age 7 years, and vice versa, both rs (83) = .17, ns.
Path analysis models
Comparison of the nested models
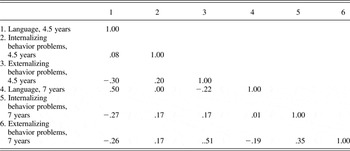
Table 3 shows model fit indices and comparisons of the nested path models. Both Models 1 and 2 demonstrated good fit to the data. Inspection of the chi-square difference test indicated that Model 3 did not fit the data significantly better than Model 2. Although the chi-square difference test suggested Model 2 fit the data only marginally better than did Model 1, evaluations of the robust S-B χ2 statistic, robust CFI, and SRMR indicated substantial improvement of Model 2 over Model 1. An examination of AIC supported this conclusion; Model 2 had the optimal balance of fit and parsimony and was the final model of Study 1. Figure 2 presents the standardized solution of Model 2. Appendix A presents a table of the pairwise covariance matrix of all variables in the final model.
Study 1 model fit indices and comparisons for nested path models

Note: Model 3 was a just-identified model. S-B χ2, Satorra–Bentler chi-square statistic; CFI, comparative fit index; SRMR, standardized root mean square residual; AIC, Akaike information criterion.
aThe chi-square difference test was computed using chi-square statistics, not the Satorra–Bentler scaled chi-square statistics.
Hypothesis 1: Stability and covariation. Language and externalizing behavior problems showed strong stability from 4.5 to 7 years; internalizing behavior problems were not stable. At 4.5 years, language and externalizing behavior problems were negatively correlated. There were no other within-time correlations at 4.5 years. At 7 years, the error variances of internalizing and externalizing behavior problems were positively correlated. There were no other within-time correlations at 7 years.
Hypothesis 2: Cross-domain cross-time predictions between language and internalizing behavior problems, and between language and externalizing behavior problems. Controlling for its relations with 4.5-year internalizing and externalizing behavior problems, 4.5-year language predicted 7-year internalizing behavior problems above and beyond age 4.5-year internalizing behavior problems: children with poorer language skills at 4.5 years had more internalizing behavior problems at 7 years.
Hypothesis 3: Cross-domain cross-time predictions between internalizing and externalizing behavior problems. The path model did not provide evidence for these expectations.
Covariate analyses
Four potential common cause covariates considered in this analysis were child nonverbal intelligence, maternal education and parenting knowledge, and family SES. We asked whether longitudinal stabilities, concurrent relations, and the longitudinal cross-domain effect persisted when they were controlled. At the zero-order level, maternal education and parenting knowledge and family SES were not significantly correlated with any child outcomes; they were therefore excluded as covariates. Child nonverbal intelligence assessed at age 4.5 years correlated with 4.5-year language, r (83) = .35, p = .001, and predicted 7-year language, r (83) = .22, p < .05, as well as internalizing behavior problems, r (83) = –.22, p < .05, and externalizing behavior problems, r (83) = –.33, p < .01. We therefore added child nonverbal intelligence to the final path model (Figure 2) and reevaluated the longitudinal cross-domain effect. Two out of the four significant correlations between child nonverbal intelligence and child outcomes at the zero-order level attenuated to nonsignificance with longitudinal stability, within-time covariation, and the path in the model. Figure 3 presents the standardized solution to the final covariate model, S-B χ2 (6) = 4.73, p = .58 (robust CFI = 1.00, SRMR = 0.05, AIC = –7.27). The significant longitudinal cross-domain path between 4.5-year language and 7-year internalizing behavior problems remained significant controlling for child nonverbal intelligence in the model.
The Study 1 standardized solution for the final model with covariate analyses on the total sample (N = 85). The numbers associated with single-headed arrows are standardized path coefficients, and the numbers associated with double-headed arrows are standardized covariance estimates. The arrows associated with dependent variables are error variances and represent the amount of variance not accounted for by paths in the model. †p = .06. *p < .05. **p < 01. ***p < .001.

Study 2: Pathways From 4 to 10 to 14 Years
Participants
The second study sample consisted of 139 children (55 girls, 84 boys), their mothers, and their teachers, who provided data at three ages. On average, children were 4.05 (SD = 0.09, range = 3.87–4.62), 10.24 (SD = 0.14, range = 9.99–10.81), and 13.83 (SD = 0.25, range = 13.48–14.82) years old at the first, second, and third assessment waves. At the first assessment, mothers averaged 35.31 years of age (SD = 5.30, range = 20.59–49.63); two mothers had not completed high school, 6 had completed high school, 25 had partial college, 48 had completed college, and 58 had graduate professional training or had completed graduate degrees. Initially, 267 children were recruited, so 128 children were lost to follow up. These 128 children and the 139 in the final study sample did not differ on any child language, externalizing behavior problem, or internalizing behavior problem measures except that children lost to follow up scored lower on the 10-year Wechsler Intelligence Scale for Children, Third Edition (WISC-III; Wechsler, Reference Wechsler1991)) information and vocabulary subtests (see below). In the course of fitting path models, one additional case was identified as a multivariate outlier, contributing disproportionately to parameter estimates; this case was also removed from the final analyses.
Procedures
Children and their mothers provided data at all three waves; at 10 years, children's teachers also provided data. At all three waves, a laboratory visit was scheduled for the mothers and children; in addition, two home visits were scheduled at 10 years. (In the case of a small number of families living at significant distances from the laboratory, only home visits were made.) At 4 years, the child completed a variety of activities with an experimenter. Prior to the 10- and 14-year visits, packets of questionnaires for child, mother, and father were mailed to the family, with the request that they be completed in time for the visit. During each visit, children and mothers completed questionnaires and were interviewed, and children were tested. About 1.5 months after in-person data collection, mothers were interviewed by telephone. At 10 years, mothers were asked to recruit their children's teachers into the study. Teachers who agreed to participate were given a packet of questionnaires to complete and mail directly back to study personnel.
Language
At 4 years, language was assessed using two verbal subtests of the Wechsler Preschool and Primary Scale of Intelligence—Revised (WPPSI-R; Wechsler, Reference Wechsler1989) and the Vineland Adaptive Behavior Scales—Interview Edition, Survey Form communication domain (VABS; Sparrow et al., Reference Sparrow, Balla and Cicchetti1984). At 10 years, three verbal subtests on the WISC-III (Wechsler, Reference Wechsler1991) were administered. At 10 and 14 years, language was assessed by subtests of the Woodcock–Johnson Psycho-Educational Battery—Revised Test of Achievement (WJ-R; Woodcock & Mather, Reference Woodcock and Mather1989) and the VABS communication domain. The WPPSI-R is an individually administered intelligence test for children aged 3 years to 7 years, 3 months. Scaled scores (M = 10, SD = 3) of two verbal subtests were used. In a standardization sample of 200 4-year-old children, split-half reliability coefficients ranged from 0.88 to 0.89. The VABS: Interview Edition Survey Form, communication domain was used to obtain mothers' estimates of their children's communication skills at 4, 10, and 14 years. The same procedures were followed as in Study 1 at 4.5 years. The WISC-III is an individually administered intelligence test for children from ages 6 to 16 years. Scaled scores (M = 10, SD = 3) of three verbal subtests were used. The WISC-III was standardized on a sample of 2,200 children who matched census data and were representative of the US population on ethnicity, geographic region, gender, age, and parent education. Reliability coefficients were .81 to .87. Two subtests from the WJ-R were administered at 10 and 14 years to assess children's achievement in language skills. The WJ-R was standardized on a nationally representative sample from 24 months to 95 years of age. Raw scores were converted to standard scores (M = 100, SD = 15).
Internalizing and externalizing behavior problems
Two forms of behavioral adjustment were assessed by parent and teacher reports on symptom checklists. At 4 years, internalizing behavior problems were assessed using the anxious–fearful subscale of the PBQ (Behar & Stringfield, Reference Behar and Stringfield1974). At 10 years, internalizing behavior problems were assessed using the anxious–depressed, somatic complaints, and withdrawal scales of the Child Behavior Checklist/4–18 (CBCL/4–18; Achenbach, Reference Achenbach1991a) and Teacher Report Form (TRF; Achenbach, Reference Achenbach1991b). At 14 years, internalizing behavior problems were assessed using the anxious–depressed, somatic complaints, and withdrawal scales of the CBCL and Youth Self-Report (YSR; Achenbach, Reference Achenbach1991c). At 4 years, externalizing behavior problems were assessed using the hostile–aggressive and hyperactive–distractible subscales on the PBQ. At 10 years, externalizing behavior problems were assessed using the aggressive behavior and delinquent behavior scales of the CBCL/4–18 and the TRF. At 14 years, externalizing behavior problems were assessed using the aggressive behavior and delinquent behavior scales of the CBCL/4–18 and the YSR. The PBQ, a standardized screening instrument for detection of emotional problems in children ages 3 to 6 years, is described in Study 1. The CBCL/4–18 consists of a social competence section and a behavior/emotional problems section. The focus of Study 2 is on the 118 items that make up the behavior/emotional problems section. Internalizing behavior problem scale scores were computed as the sum of the anxious–depressed, somatic complaints, and withdrawal scores. Externalizing behavior problem scale scores were the sum of the aggressive behavior and delinquent behavior scores. The raw summary scores of internalizing and externalizing scale scores were used. The TRF, the teacher version of the CBCL, includes 118 items, of which 93 are in common with the CBCL. Teachers based their ratings on observation of the child during the previous 2 months. The YSR includes 103 items describing a broad range of problem behaviors. Children completed the YSR as an assessment of their behavioral and emotional problems over the last 6 months. The YSR yields two broad-based factors, internalizing problems and externalizing problems, both of which were used. Internal consistencies for younger children (n = 46) were excellent for internalizing (α = 0.90) and externalizing behavior problems (α = 0.88). The Achenbach System of Empirically Based Assessment, which includes the YSR, has strong test–retest reliability (r = .79–.95). Criterion related validity has also been established (Achenbach & Rescorla, Reference Achenbach and Rescorla2001). The α coefficients for the current sample were 0.89 and 0.88 for internalizing and externalizing behavior problems, respectively.
Covariates
Child nonverbal intelligence
Child nonverbal intelligence was measured by the WPPSI-R (Wechsler, Reference Wechsler1989) at age 4 years and by the WISC-III (Wechsler, Reference Wechsler1991) at age 10 years.
Maternal verbal intelligence
Maternal verbal intelligence was estimated using the Peabody Picture Vocabulary Test—Revised (Dunn & Dunn, Reference Dunn and Dunn1981).
Maternal education
Maternal education was measured on the Hollingshead (Reference Hollingshead1975) Four Factor Index 7-point education scale at all three ages.
Maternal parenting knowledge
The Knowledge of Infant Development Inventory (Bornstein, Cote, Haynes, Hahn, & Park, Reference Bornstein, Cote, Haynes, Hahn and Park2010; MacPhee, Reference MacPhee1981) is a 75-item criteria-referenced questionnaire that assesses evidence-based knowledge of parental practices, developmental processes, health and safety guidelines, and norms and milestones relevant to children's growth. Proportion correct of total items was used.
Maternal social desirability
The short form of the Social Desirability Scale (SDS-SF; Reynolds, Reference Reynolds1982) uses 13 items in Crowne and Marlowe's (Reference Crowne and Marlowe1960) SDS to assess a respondent's tendency to reply to questions in a socially desirable fashion. The reliability of the SDS-SF is 0.76, and the correlation with the full SDS is .93 (Reynolds, Reference Reynolds1982). The SDS-SF was assessed for mothers at child ages 10 and 14 years and was explored as a potential covariate for maternal reports of children's language and internalizing and externalizing behavior problems.
Family SES
Family SES was assessed using the Hollingshead (Reference Hollingshead1975) Four Factor Index of Social Status at all three ages.
Results
Preliminary analyses and analytic strategy
Prior to analysis, missing data points (8.20% of the total data points) were imputed using the expectation-maximization algorithm (Dempster, Laird, & Rubin, Reference Dempster, Laird and Rubin1977); data were missing completely at random, Little missing completely at random test χ2 (683) = 708.12, p = .25.
Several variables required transformation to approximate normality and resolve problems of outliers. Age 10-year internalizing and externalizing behavior problem scores were reexpressed using square roots of their reciprocals. (The transformed variables were multiplied by –1 to keep the sign of the correlation coefficients the same as if the untransformed variables were used.) Age 14-year internalizing behavior problem scores were reexpressed using a log10 transformation, and age 14-year externalizing behavior problem scores were reexpressed using a cube-root transformation.
Four nested path analysis models were examined to test the interconnections between language and behavioral adjustment at different time points from early to late childhood to early adolescence. Model 1 tested our first hypothesis about stability of each domain between adjacent time points as well as within-time correlations among domains. Model 2 tested the negative longitudinal cross-domain path between Wave 1 language and Wave 2 internalizing behavior problems that was identified in Study 1. Model 3 added four cross-domain paths from late childhood to early adolescence to test our second hypothesis about cross-domain cross-time prediction between language and internalizing behavior problems, and between language and externalizing behavior problems. Model 4 added two paths from late childhood to early adolescence to test our third hypothesis about cross-domain cross-time predictions between internalizing and externalizing behavior problems. As in Study 1, the last goal was to determine whether significant longitudinal cross-domain paths of the final model would persist when meaningful covariates were taken into consideration. We considered child nonverbal intelligence, maternal verbal intelligence, education, parenting knowledge, social desirability bias, and family SES as potential covariates.
Descriptive statistics
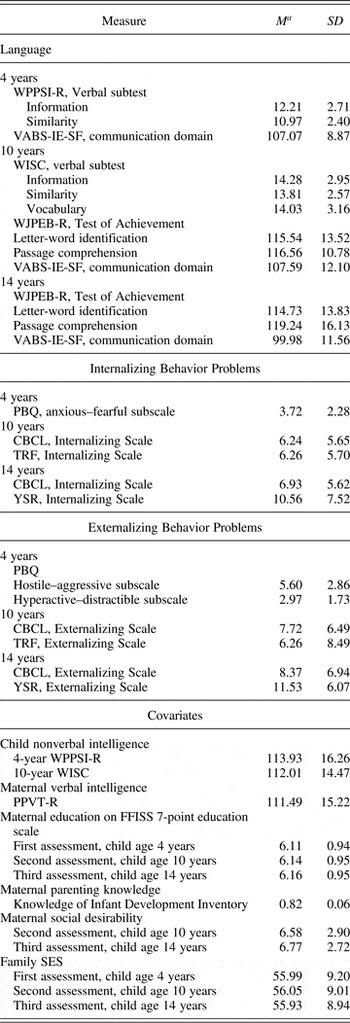
Table 4 presents the means and standard deviations of outcome measures and potential covariates for all participants. All mean scores fell within or around one standard deviation of means reported in normal or standardization samples of children and adolescents of similar ages.
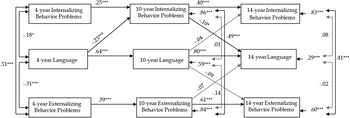
The Study 2 standardized solution for the final model on the total sample (N = 139). The numbers associated with single-headed arrows are standardized path coefficients, and the numbers associated with double-headed arrows are standardized covariance estimates. The arrows associated with dependent variables are error variances and represent the amount of variance not accounted for by paths in the model. *p < .05. **p < 01. ***p < .001.

Study 2 descriptive statistics of language, behavioral adjustment measures, and potential covariates

Note: WPPSI-R, Wechsler Preschool and Primary Scale of Intelligence—Revised; VABS-IE-SF, Vineland Adaptive Behavior Scales, Interview Edition, Survey Form; WISC, Wechsler Intelligence Scale for Children; WJPEB-R, Woodcock–Johnson Psycho-Educational Battery—Revised; PBQ, Preschool Behavior Questionnaire; CBCL, Child Behavior Checklist; TRF, Teacher Report Form; YSR, Youth Self-Report; PPVT-R, Peabody Picture Vocabulary Test—Revised; FFISS, Four Factor Index of Social Status; SES, socioeconomic status.
aAll scale scores were coded so that higher scores represent greater language or more internalizing or externalizing behavior problems.
Language and behavior problem composite scores
Summary scores representing 4-, 10-, and 14-year language, internalizing behavior problems, and externalizing behavior problems were each computed as the mean standard scores of all relevant scale scores obtained at each respective age. The anxious–fearful subscale of the PBQ was the sole indicator of 4-year internalizing behavior problems; it was used as an observed variable in the path models, and no mean standard score was computed for 4-year internalizing behavior problems.
Correlations among scale scores for language, internalizing behavior problems, and externalizing behavior problems, respectively, at all three ages were positive and significant. Correlations between the two indicators of internalizing behavior problems at 10 and 14 years were rs (137) = .38, ps < .001. Correlations between the two indicators of externalizing behavior problems at 4, 10, and 14 years were rs (137) = .36, .38, and .27, ps < .001, .001, and .01, respectively. Before testing our hypotheses, measurement models were evaluated for language at all three ages to evaluate the fit of the observed scale scores as indicators of the composites. Excellent model fits were achieved for all three models: For 4-year language, S-B χ2 (1) = 0.00, p = .97 (robust CFI = 1.00, SRMR = 0.00, AIC = –2.00), with factor loadings ranging from 0.57 to 0.73; for 10-year language, S-B χ2 (9) = 18.37, p = .03 (robust CFI = 0.97, SRMR = 0.05, AIC = 4.16), with factor loadings ranging from 0.45 to 0.88; and for 14-year language, S-B χ2 (1) = 0.53, p = .47 (robust CFI = 1.00, SRMR = 0.02, AIC = –1.51), with factor loadings ranging from 0.38 to 1.00. Factor loadings were all significant at the .001 level or better. The Cronbach α reliability coefficients were 0.68, 0.85, and 0.65, for the 4-, 10-, and 14-year language composites, respectively.
Zero-order correlations
Stability of language and behavioral problems
Across the 6-year span of the first two waves, children's language, r (137) = .64, p < .001, internalizing behavior problems, r (137) = .22, p < .01, and externalizing behavior problems, r (137) = .44, p < .001, showed moderate to strong stability. Across the 4-year span of the second to third waves, children's language, r (137) = .83, p < .001, internalizing behavior problems, r (137) = .41, p < .001, and externalizing behavior problems, r (137) = .63, p < .001, showed strong stability. Across the 10-year span of the first to third waves, children's language, r (137) = .60, p < .001, internalizing behavior problems, r (137) = .26, p < .01, and externalizing behavior problems, r (137) = .27, p = .001, showed moderate to strong stability.
Concurrent and predictive relations between language and behavior problems
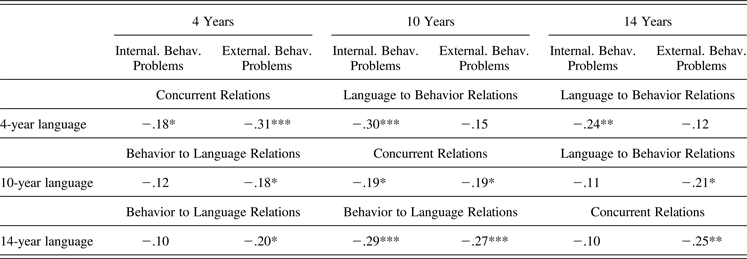
Table 5 presents concurrent and predictive relations between language and internalizing and externalizing behavior problems. The diagonal sections of Table 5 provide evidence for concurrent associations between language and behavioral adjustment at the three ages. Children who scored lower on language had more internalizing and externalizing behavior problems at ages 4 years and 10 years, and vice versa. At 14 years, poorer language skills related to more externalizing behavior problems; the concurrent relation between language skills and internalizing behavior problems was negative but not significant. The correlations between internalizing and externalizing behavior problems at 4, 10, and 14 years were rs (137) = .51, .51, and .42, respectively, all ps < .001.
Study 2 concurrent and predictive relations between language and behavioral adjustment measures at 4, 10, and 14 years

*p < .05. **p < .01. ***p ≤ .001.
The zero-order correlations of language to behavior adjustment (Table 5, top right above the diagonal) suggest that inferior language skills at 4 years predict more internalizing behavior problems at both 10 and 14 years, whereas language skills at 10 years were not related to internalizing behavior problems at 14 years. Across the 4-year span from 10 to 14 years, inferior language skills predict more externalizing behavior problems; the predictive relations were negative but not significant across the 6-year span from 4 to 10 years and the 10-year span from 4 to 14 years.
The zero-order correlations of behavior adjustment to language (Table 5, bottom left below the diagonal) indicate that more internalizing behavior problems predict inferior language skills from 10 to 14 years, and more externalizing behavior problems predict inferior language skills from 4 to 10 and 14 years as well as from 10 to 14 years. The predictive relations from 4-year internalizing behavior problems to language skills at later years were both negative but not significant. Relations between earlier and later internalizing and externalizing behavior problems were mostly significant: 4-year internalizing behavior problems to 10-year externalizing behavior problems, r (137) = .05, ns; 10-year internalizing behavior problems to 14-year externalizing behavior problems, r (137) = .34, p < .001; 4-year externalizing behavior problems to 10-year internalizing behavior problems, r (137) = .33, p < .001; and 10-year externalizing behavior problems to 14-year internalizing behavior problems, r (137) = .19, p < .05.
Path analysis models
Comparison of the nested models
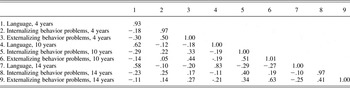
Table 6 shows model fit indices and comparisons of the nested path models. The chi-square difference test indicated that each successive model fit the data significantly better, except for the final comparison: Model 4 did not fit the data significantly better than did Model 3, despite the added two paths between externalizing behavior problems and internalizing behavior problems. Evaluations of the robust SB scaled χ2, robust CFI, and SRMR also suggested Model 3 as the overall most plausible model, and the model AIC supported this conclusion. Figure 4 presents the standardized solution of Model 3. Appendix B presents a table of the pairwise covariance matrix of all variables in the final model.
Study 2 model fit indices and comparisons for nested path models

Note: S-B χ2, Satorra–Bentler chi-square statistic; CFI, comparative fit index; SRMR, standardized root mean square residual; AIC, Akaike information criterion.
aThe chi-square difference test was computed using chi-square statistics, not the Satorra–Bentler scaled chi-square statistics.
Hypothesis 1
Stability and covariation. It was not surprising that the longitudinal stability paths for language skills and for internalizing and externalizing behavior problems were all positive and significant, which was found in the past. At 4 years, internalizing and externalizing behavior problems were, as expected, positively correlated, and both were negatively correlated with language skills. At both 10 and 14 years, the error variances of externalizing behavior problems were correlated with the error variances of internalizing behavior problems (positive). The error variances of language skills and internalizing behavior problems or externalizing behavior problems were not related at 10 or 14 years. On the whole, internalizing and externalizing behavior problems related positively to each other at all three ages, and the two related negatively to language skills during early childhood. Removing the variances that were related to other variables specified in the final model (Figure 4), the error variances between internalizing behavior problems and language skills, and between externalizing behavior problems and language skills, were not related at 10 or 14 years.
Hypothesis 2
Cross-domain cross-time predictions between language and internalizing behavior problems, and between language and externalizing behavior problems. Two cross-domain cross-time paths emerged as significant: the negative longitudinal cross-domain path from Wave 1 language to Wave 2 internalizing behavior problems identified in Study 1 was cross-validated in the Study 2 sample. Controlling for its relation with 4-year internalizing and externalizing behavior problems, 4-year language skills predicted 10-year internalizing behavior problems above and beyond 4-year internalizing behavior problems: children with poorer language skills at 4 years had more internalizing problems at 10 years. One significant longitudinal cross-domain path emerged from late childhood to early adolescence: controlling for its relation with 10-year language and externalizing behavior problems, 10-year internalizing behavior problems predicted 14-year language skills above and beyond 10-year language, internalizing behavior problems, and externalizing behavior problems. Children with more internalizing behavior problems at 10 years had poorer language skills at 14 years.
Two significant three wave cross-domain effects emerged from the final model. Age 14-year internalizing behavior problems were predicted by 4-year language skills (standardized indirect effect = –.12, p < .05), with the effect mediated by 10-year internalizing behavior problems. Age 14-year language skills were predicted by age 4-year language skills (standardized indirect effect = .53, p < .001), with the effect mediated by age 10-year internalizing behavior problems (standardized indirect effect = .02, and language, standardized indirect effect = .51).
Hypothesis 3
Cross-domain cross-time predictions between internalizing and externalizing behavior problems. The path model did not provide evidence for these predictions.
Covariate analyses
Potential covariates and common causes considered in this covariate model included child nonverbal intelligence, maternal verbal intelligence, education, parenting knowledge, social desirability bias, and family SES. Maternal social desirability was not related to any child outcome measures reported by mothers; it was therefore excluded as a covariate. At the zero-order level, concurrent correlations of child nonverbal intelligence assessed at age 4 years with language skills, internalizing behavior problems, and externalizing behavior problems at 4 years were all significant, rs (137) = .42, –.23, and –.20, ps < .001, .01, and .05, respectively. Child nonverbal intelligence assessed at 4 and 10 years were correlated with language skills at 10 years, rs (137) = .32 and .40, respectively, both ps < .001. Child nonverbal intelligence assessed at 4 and 10 years was correlated with language skills at 14 years, rs (137) = .34 and .35, respectively, both ps < .001.
Maternal parenting knowledge was positively related to child language skills at 10 years, r (137) = .22, p < .01. Maternal verbal intelligence was positively related to child language skills at 4, 10, and 14 years: rs (137) = .20, .37, and .32, ps < .05, .001, and .001, respectively. Maternal education assessed at 4 years was positively correlated with child language skills at 10 and 14 years, rs (137) = .22 and .17, ps < .01 and .05, respectively. Maternal education assessed at 10 years was positively correlated with child language skills at 10 and 14 years, rs (137) = .23 and .19, ps < .01 and .05, respectively. Maternal education assessed at 14 years was positively correlated with child language skills at 14 years, r (137) = .20, p < .05. Family SES assessed at 4 and 10 years was positively related to child language skills at 10 years, rs (137) = .29, p ≤ .001, and .25, p < .01, respectively, and at 14 years for family SES assessed at 4, 10, and 14 years, rs (137) = .24, p < .01, .22, p < .05, and .19, p < .05, respectively. Family SES assessed at 4 and 10 years was negatively related to child externalizing behavior problems at 10 years, rs (137) = –.18 and –.19, respectively, ps < .05, and at 14 years for family SES assessed at 4, 10, and 14 years, rs (137) = –.20, p < .05, –.27, p < .001, and –.30, p < .001, respectively.
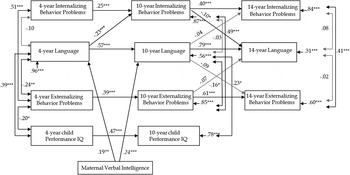
In two separate path models (maternal education was a component of family SES, and they are linearly related and so could not be evaluated in the same model), we added child nonverbal intelligence at ages 4 and 10 years, maternal verbal intelligence, parenting knowledge, and in one model maternal education assessed at all three ages and in the other model family SES assessed at all three ages, as exogenous variables to the final model (Figure 4) and reevaluated developmental cross-domain effects. Many of the significant zero-order correlations of child nonverbal intelligence, maternal verbal intelligence, education, parenting knowledge, and family SES with child outcomes attenuated to nonsignificance with longitudinal stability, within-time covariation, and the cross-domain paths in the model. Maternal parenting knowledge and education and family SES assessed at all three ages were removed from the covariate analysis because they did not correlate or predict any child outcomes in the path model with all other variables in the model.
Figure 5 presents the standardized solution to the final covariate model controlling for maternal verbal intelligence and child nonverbal intelligence, S-B χ2 (41) = 55.09, p = .07 (robust CFI = 0.98, SRMR = 0.08, AIC = –26.91).
The Study 2 standardized solution for the final model with covariate analyses on the total sample (N = 139). The numbers associated with single-headed arrows are standardized path coefficients, and the numbers associated with double-headed arrows are standardized covariance estimates. The arrows associated with dependent variables are error variances and represent the amount of variance not accounted for by paths in the model. *p < .05. **p < 01. ***p < .001.

Similar results were obtained controlling for significant control variables and third-variable causes: the significant longitudinal cross-domain paths between 4-year language skills and 10-year internalizing behavior problems, and between 10-year internalizing behavior problems and 14-year language skills remained significant controlling for maternal verbal intelligence and child nonverbal intelligence. The two significant three-wave cross-domain effects of 4-year language skills on 14-year internalizing behavior problems mediated by 10-year internalizing behavior problems, standardized indirect effect = –.11, p < .05, and 4-year language skills on 14-year language skills mediated by 10-year language and internalizing behavior problems, standardized indirect effect = .48, p < .001, remained significant controlling for maternal verbal intelligence and child nonverbal intelligence.
General Discussion
In two independent longitudinal cohorts we evaluated developmental pathways between children's language skills and their behavioral adjustment in terms of internalizing and externalizing behavior problems. Across the ages of 4.5 to 7 years (Study 1) and 4 to 10 to 14 years (Study 2), respectively, we twice found that children with inferior language skills at age 4 years had more internalizing behavior problems at age 7 years (Study 1) and 10 years (Study 2) and more internalizing behavior problems at age 14 years (Study 2). These developmental paths obtained over and above the temporal stability of language and behavioral adjustment across age and covariation between these characteristics at each age. These results are consistent with a concept of “developmental cascades” in which functioning in one intrapsychic domain is thought to influence other domains both directly and indirectly from one period of life going forward (Masten & Cicchetti, Reference Masten and Cicchetti2010). At most ages in the two studies, language was inversely related to externalizing behavior problems, and internalizing and externalizing behavior problems tended to relate positively to one another. The nature of our path analyses also permitted conservative replies to two secondary questions on stability and concurrent covariation among the constituent constructs, that is, when other relations are controlled. Finally, these paths, stabilities, and covariances obtained separate and apart from child nonverbal intellectual functioning, maternal intelligence, education, parenting knowledge, and social desirability bias, as well as family SES.
Language and internalizing behavior problems
The general cascading pattern observed in both cohorts indicated that language proficiency in early childhood affected behavioral adjustment in late childhood, which in turn contributed to behavioral adjustment in early adolescence. Framed in the positive, young children who are more competent verbally have fewer internalizing behavior problems later. Over and above whatever developmental paths and bidirectional influences may have already occurred prior to the start of this study, inferior language skills in early childhood forecast internalizing adjustment problems into adolescence.
Language is multidimensional, with receptive and expressive phonological, semantic, syntactic, and pragmatic components. We do not know exactly which language competencies or what about language competencies in early childhood keep behavioral adjustment problems at bay. This is a question for future research. Nonetheless, the two studies together employed multiple language measures; that similar paths obtain between language and internalizing behavior problems, even when language is variously operationalized, further enhances the results. Children's language used during social interactions has been employed to quantify how they socialize with others, and children who are language delayed tend to score low on measures of social development (Eckerman, Davis, & Didow, Reference Eckerman, Davis and Didow1989; Howes & Matheson, Reference Howes and Matheson1992). Moreover, competency-based models of child development generally suggest the lack of language in early childhood contributes to later internalizing behavior problems (Cole, Reference Cole1990, Reference Cole1991). It could be, for example, that children deficient in language have difficulty connecting with peers and, as a result, experience loneliness and have less opportunity to learn and practice the social skills they need for successful peer interaction.
Our analyses rule out some process explanations. With respect to possible developmental models, language and internalizing and externalizing behavior problems in children could be generated and influenced by the same (genetic or environmental) factors, emerge at the same time, and develop in tandem. Alternatively, children's early language development may be jeopardized because they are withdrawn or aggressive. Perhaps language facility instead protects against behavior problems. Applying a developmental path analytic approach, we found strong and consistent evidence for the third possibility, that poorer early childhood language skills predict later internalizing behavior problems. Internalizing and externalizing behavior problems never predicted language. Although we cannot refute alternative explanations concerning the direction of cause and effect, the temporal designs of these studies and their independent concordant findings strongly suggest that poorer early language skills predict later internalizing behavior problems. Moreover, our common cause analyses explored whether inclusion of childhood nonverbal intelligence and diverse factors in mothers' and children's general environments might affect observed cross-domain effects. Overall, links between language skills and internalizing behavior problems obtained over and above the inclusion of these broad individual and family resource factors.
By the time children in Study 2 were 4 years of age, their language skills already linked to their internalizing behavior problems. Children as young as 2 years have been reported to exhibit similar relations. Kaler and Kopp (Reference Kaler and Kopp1990) found that toddlers' compliance with adult commands related to how well they understood language. Comparing groups of expressive-language delayed children with language-normal children of the same age for developmental and behavioral difficulties, Carson, Klee, Perry, Muskina, and Donaghy (Reference Carson, Klee, Perry, Muskina and Donaghy1998) found that children with language delay scored higher than typically developing children on a total internalizing scale (anxious/depressed and withdrawn scales, and sleep problems), but scores for the two groups did not differ on a total externalizing scale. In accord with our findings, these investigations imply that children as young as 2 years with language delay might be more vulnerable to internalizing emotional distress or behavioral difficulties than language-normal children.
Why should early language competency be developmentally linked to one type of behavioral adjustment (internalizing) but not to another (externalizing) even as the two types of adjustment are correlated? Perhaps the advantages bestowed by greater language skills (e.g., facilitating a child's social relationships with both peers and adults) are undermined by the abrasive nature of negative behavioral outbursts. Alternatively, perhaps the mechanisms underlying the development of language are more closely linked to or set the stage for the development of internalizing strategies for dealing with negative behavioral tendencies. It is not surprising that unhappy children with anxiety and depression also exhibit some degree of behavioral acting out and vice versa (hence, the correlation between internalizing and externalizing). Perhaps children with the tendency to develop externalizing behavior problems react so impulsively that their access to language and its organizing effects is preempted. It is noteworthy that externalizing children are often coached to “Use your words” in place of acting out, an impulse that does not come naturally to them. Thus, we suspect that factors other than or in addition to language may be implicated in behavioral cascades involving externalizing behavior problems, and it may prove productive to examine the role of temperament in that mix.
Stability and covariation
In these two studies, we measured stability in language and internalizing and externalizing behavior problems, both at the zero-order level and in the context of path models that exposed unique stabilities of these variables. Stability has many variations and interpretations (see Bornstein & Bornstein, Reference Bornstein, Bornstein and Darity2008; Hartmann et al., Reference Hartmann, Pelzel, Abbott, Bornstein and Lamb2011). Kagan (Reference Kagan1971) distinguished and defined two central kinds of stability. Homotypic stability is the maintenance of rank order in individuals in the same manifest behavior through time (e.g., vocabulary size in language). Heterotypic stability is the maintenance of rank order in individuals on different manifest behaviors through time where the different behaviors are theoretically related and presumably share the same stable latent construct or process (e.g., vocabulary size and grammatical correctness in language). Our stability estimates included homotypic stabilities in language and behavioral adjustment measured in the same ways at different ages as well as heterotypic stabilities in different and age-appropriate assessments of constructs and processes underlying both language and behavioral adjustment. Consistent with one of the main principles of developmental task theory (Sroufe, Reference Sroufe1979), our results demonstrate moderate to strong stabilities within the domains of language and behavioral adjustment as assessed by developmentally appropriate indexes across time. The longitudinal stabilities of language and internalizing and externalizing behavior problems support the notion that these constructs, broadly construed, exhibit developmental consistency independent of measurement variability across the study time points.
Our stability assessments also provide insight into individual variation and how it maintains in development. Stable characteristics in ontogeny are informative as to the nature of those characteristics per se as well as the individuals they describe. Insofar as a characteristic is ontogenetically stable, we know that individuals who do well or do more at one time are likely to do well or do more later. Looked at another way, a major predictor of developmental status at a given age is competence at an earlier age. In addition, consistent child ability or performance likely affects the child's environment and thereby his or her own development. For example, adults adjust their language to match the language of children: mothers fine-tune the semantic and syntactic contents of their utterances to match their children's level of understanding (e.g., Bellinger, Reference Bellinger1980; McLaughlin, White, McDevitt, & Raskin, Reference McLaughlin, White, McDevitt and Raskin1983).
As mentioned earlier, the linkages between internalizing and externalizing behavior problems are complex. These behavior problem domains were concurrently and positively associated with one another from the outset of this study and rather consistently from early childhood to early adolescence. However, over and above stability in each across waves, as well as their intercorrelation at each wave, internalizing and externalizing behavior problems never uniquely influenced one another.
Two studies with limitations and strengths
These two studies have a number of limitations but also display notable strengths. Our sample sizes were modest for the complex analyses undertaken. Sample size may also have affected our ability to detect nonzero paths; replication with larger samples might reveal additional significant paths. Our community samples were relatively advantaged and high functioning. Although a wide range of SES was represented, the means for both SES and maternal education were elevated. Furthermore, child functioning was generally above average. The samples were also ethnically homogeneous and normal with respect to language and internalizing and externalizing behavior problems. All these considerations define the population to which the developmental pathways we found can be generalized. It could be, for example, that language affects internalizing behavior problems only in the normal range of functioning and not for samples with more severe clinical disorders.
To focus this analysis, we limited the scope of our studies to only one major developmental task domain and two major symptom domains. Other domains of developmental task competence (like adaptive behavior and social competence) have been implicated in the cascade literature as also linking to these symptoms (Bornstein, Hahn, et al., Reference Bornstein, Cote, Haynes, Hahn and Park2010; Masten, Reference Masten2005). Another limitation of the present study design is the unequal and widely spaced longitudinal relations among broad constructs that prevent firm conclusions about precisely when or how cross-domain links developed.
The operationalization and assessment of developmental pathways in these studies are both stringent and conservative, and the replication in two independent cohorts is rare. Study 2 extended Study 1 from two to three waves, added dependent variables, and took into consideration more covariates. The first assessment for this study took place in early childhood, before children had begun school, which allowed a test of the early onset of pathways. Children were evaluated across particularly critical transitions in their development, namely, their entry into formal schooling and into adolescence. However, due to concerns of model complexity, additional common cause third variables and interacting constructs, such as academic achievement and social competence, were not included. Likewise, examination of additional child characteristics (e.g., temperament) might have made for a more definitive study. The inclusion of these constructs in the future is warranted and may extend our understanding of the cross-domain linkages uncovered in this set of studies.
The path analysis modeling approach we took made it possible to reduce the influence of key confounds and initial covariances between domains; it allowed us to control for spurious effects related to covariance with child age and nonverbal intelligence, maternal intelligence, education, and parenting knowledge, as well as family SES, important markers of general psychosocial advantage; and it afforded tests of alternative theoretical or antecedent–consequent models. Moreover, shared source and method variance, potential biases due to single reporters and single instruments, were avoided in our multi-informant, multimethod designs. An additional advantage of the path approach is revealed in comparison with the zero-order relations. If we had suspended our analyses at the point of correlations, we would have concluded that language is concurrently (negatively) related to externalizing behavior problems, not internalizing behavior problems, and even that early externalizing behavior problems relate to later language. The path analyses showed, however, that unique longitudinal relations obtained from language to internalizing behavior problems only. The cascade approach was also able to discriminate between alternative temporal models.
Implications for prevention, intervention, education, and policy
According to epidemiological studies, rates of language impairment or delay in the general population range from 3% to 15%, depending on severity (Cummings, Iannotti, & Zahn-Waxler, Reference Cummings, Iannotti and Zahn-Waxler1989; Silva, Reference Silva, Yule and Rutter1987). In this set of studies, language skills in early childhood emerged as a key domain in children's later development due to effects that spread to their behavioral adjustment over time, suggesting that programs aimed at improving child language may also promote their psychological well-being. An early focus on language may therefore yield a high return on investment in strategically timed and targeted interventions designed to ameliorate or obviate behavioral problems (Heckman, Reference Heckman2006; Masten et al., Reference Masten, Burt, Coatsworth, Cicchetti and Cohen2006). By identifying the processes, timing, and conditions of spreading effects, it is possible to learn when to do what to interrupt negative spirals. Our research suggests that one way to prevent problems in one domain (internalizing) is to intervene earlier in another domain (language). One implication of our results is, therefore, that promotion of language early in development is warranted and not only to facilitate language development per se. What gives rise to individual variation in language? It is perhaps not surprising that positive parenting in infancy enriches language in early childhood. Language skills in the younger child have origins in relationships in the family, and on this argument parent–child language interaction is therefore a significant indirect factor in wholesome child socioemotional development (e.g., Bornstein, Haynes, & Painter, Reference Bornstein, Haynes and Painter1998; van IJzendoorn, Dijkstra, & Bus, Reference van IJzendoorn, Dijkstra and Bus1995).
Our findings specifically suggest a number of implications for different stakeholders in young children's healthy development. For parents, the promotion of early positive development in terms of language may foster verbal development and protect against the later emergence of internalizing behavior problems. For practitioners, the positive focus on language offers a valuable guideline for facilitating a child's developmental status. Furthermore, because behavior problems in the early years are seldom transient (i.e., the stability of behavior problems is high), the identification of early formative potent preventatives or countermeasures is vital to children's healthy psychological development.
Conclusions
Cross-domain effects appear to reflect processes with significance for understanding the etiology of mental health problems and for intervening to promote competence and prevent or remediate symptoms (Masten et al., Reference Masten, Burt, Coatsworth, Cicchetti and Cohen2006; Rutter, Kim-Cohen, & Maughan, Reference Rutter, Kim-Cohen and Maughan2006). Here, we found that language skills in early childhood have implications for positive behavioral adjustment in terms of diminished internalizing behavior problems in future periods of development. Delineation of the directions, timing, and processes involved in such developmental paths has implications for developmental theory and for programs of intervention. These studies extend the evidence for developmental paths from successes (or failures) in one domain during one period of development to successes (or failures) in another domain across subsequent developmental periods.
Study 1 pairwise variance covariance matrix of variables in the final model

Study 2 pairwise variance covariance matrix of variables in the final model