Introduction
Depression is a highly prevalent disorder affecting the aging population at a considerable prevalence rate of nearly 15% (Beekman et al. Reference Beekman, Copeland and Prince1999) and more than one-third of late-life depression (LLD) patients cannot attain full remission after antidepressant treatments (Nelson et al. Reference Nelson, Delucchi and Schneider2008). From neuroimaging and lesion studies, it is often suggested that the neurobiological mechanisms of LLD are related to dysfunction of brain networks and circuitries in the default mode network (i.e. medial prefrontal, posterior cingulate and temporal regions), the salience network (i.e. insula, anterior cingulate and orbitofrontal regions), the cognitive control network (i.e. dorsal lateral prefrontal and posterior parietal regions) and the corticostriatal network (i.e. dorsal lateral prefrontal, lateral orbitofrontal, striatum and thalamus) (Tadayonnejad & Ajilore, Reference Tadayonnejad and Ajilore2014). This was determined by studying the regions’ task-based functional activations, the functional interdependence of different brain regions, and the integrity of the structural white-matter tracts. Recently, another approach has been adopted that describes the human brain as a graph based on the data from different magnetic resonance imaging (MRI) modalities. The graphs were generated using predefined brain regions as nodes, and structural [e.g. T1-weighted or diffusion tensor imaging (DTI)] or functional [e.g. functional MRI (fMRI)] connectivity as edges. Usually, axonal projections are inferred from white-matter integrity or streamlines in DTI data and functional interdependence is inferred from correlations in the fMRI data. Under this framework, brain connectivity can be studied in terms of edge weights using an approach such as Network-based Statistics (NBS), and various graph theory network measures can be calculated to quantify the global and the regional network properties of the brain. The global network properties capture the integrity of the information transfer of the whole brain network, whereas regional network properties capture the organization of information transfer across regions in the brain network. It has also been suggested that graph theory measures may be useful in differentiating depression from normal controls and may have potential as biomarkers, bringing important clinical applications (Gong & He, Reference Gong and He2015). For instance, LLD patients have been suggested to have different structural global network properties and structural hyperconnectivity in regions within the default mode network, the salience network, and the regions connecting the two in comparison to their healthy counterparts (Ajilore et al. Reference Ajilore, Lamar, Leow, Zhang, Yang and Kumar2014b ). The structural global network property was also found to be negatively related to depression severity in LLD (Ajilore et al. Reference Ajilore, Lamar and Kumar2014a ). Compared to controls, LLD patients have different hub-like brain structures, including superior temporal gyrus, middle cingulate and putamen (Lim et al. Reference Lim, Jung and Aizenstein2013). Remitted LLD was also reported to have disrupted structural network organization (Bai et al. Reference Bai, Shu, Yuan, Shi, Yu, Wu, Wang, Xia, He and Zhang2012). Functionally, no global network differences were found between LLD and similarly aged healthy controls, but LLD has been reported to have more functionally connected posterior medial-pareital regions including the medial posterior cingulate and the supramarginal gyrus (Bohr et al. Reference Bohr, Kenny, Blamire, O'Brien, Thomas, Richardson and Kaiser2012). Conversely, decreased regional functional connectivity in LLD in regions across frontal, temporal and parietal lobes (Yuan et al. Reference Yuan, Zhang, Bai, Yu, Shi, Qian, Liu, You, Zhang and Liu2008) and between dorsolateral prefrontal cortex and dorsal anterior cingulate cortex has also been reported (Aizenstein et al. Reference Aizenstein, Butters, Wu, Mazurkewicz, Stenger, Gianaros, Becker, Reynolds and Carter2009). Methodological differences and heterogeneous samples used between studies were possible explanations for the inconsistent findings observed in the functional connectivity pattern in LLD. These functional connectivity findings were based on the resting-state fMRI data when subjects were not engaging in any external tasks. Although, changes in functional connectivity in depressed patients while performing emotion tasks was also observed (Frodl et al. Reference Frodl, Bokde, Scheuerecker, Lisiecka, Schoepf, Hampel, Möller, Brückmann, Wiesmann and Meisenzahl2010), there is still limited work focusing on both alterations of the connectivity patterns and network organization in functional networks during task states, which warrants further investigation for better understanding of the neuropsychological mechanisms of implicated cognitive and affective processing in LLD patients.
A key characteristic of LLD is loneliness, which is the perception of being socially isolated resulting from a mismatch between one's social needs and social relationships (Luo et al. Reference Luo, Hawkley, Waite and Cacioppo2012). People may not feel lonely even living a solitary life, or conversely, can feel lonely despite having a rich social life. Previous research has identified close associations between perceived loneliness and increased depressive symptoms (Cacioppo et al. Reference Cacioppo, Hughes, Waite, Hawkley and Thisted2006; Hawkley et al. Reference Hawkley, Thisted and Cacioppo2009); with a more recent study showing loneliness as a predictor of later increases in depressive symptoms over 1-year intervals (Cacioppo et al. Reference Cacioppo, Hawkley and Thisted2010). The mechanisms involved are still not clear, but it has been suggested that loneliness impairs self-regulation (Baumeister et al. Reference Baumeister, DeWall, Ciarocco and Twenge2005) and is associated with strong negative affect (Cacioppo et al. Reference Cacioppo, Hughes, Waite, Hawkley and Thisted2006). Lonely adults have poor emotion regulation and are less likely to use positive feelings to alleviate their negative mood (Hawkley et al. Reference Hawkley, Thisted and Cacioppo2009). Loneliness could adversely affect brain structures and neural processes (Cacioppo et al. Reference Cacioppo, Capitanio and Cacioppo2014). The gray-matter volume of the posterior superior temporal sulcus and the white-matter tracts involving the inferior frontal gyrus, the temporo-parietal junction and the anterior insula were found to be associated with loneliness (Kanai et al. Reference Kanai, Bahrami, Duchaine, Janik, Banissy and Rees2012a ; Tian et al. Reference Tian, Liang, Yuan, Chen, Xu and Yao2014). In lonelier people, weaker functional activations were observed in the ventral striatum when they were viewing pleasant pictures of people than that of objects, and the same was observed in the temporo-parietal junction when they were viewing unpleasant pictures of people (Cacioppo et al. Reference Cacioppo, Norris, Decety, Monteleone and Nusbaum2008). Functional activations in other regions, including the anterior insula, anterior cingulate, the medial frontal gyrus, the dorsomedial prefrontal, inferior orbitofrontal and ventral prefrontal cortexes were reported to be related to social rejection (Eisenberger et al. Reference Eisenberger, Lieberman and Williams2003; Cacioppo et al. Reference Cacioppo, Frum, Asp, Weiss, Lewis and Cacioppo2013; Powers et al. Reference Powers, Wagner, Norris and Heatherton2013) which could elicit feelings of loneliness (Leary, Reference Leary1990).
The aforementioned evidences have shown that loneliness is closely related to depression level and might be a potential intervention target (Masi et al. Reference Masi, Chen, Hawkley and Cacioppo2011; VanderWeele et al. Reference VanderWeele, Hawkley, Thisted and Cacioppo2011; Perissinotto et al. Reference Perissinotto, Stijacic Cenzer and Covinsky2012). However, little is known about the linkage between loneliness and the brain and how loneliness can be related to LLD, which is characterized by compromised affective processing. To fill this important research gap, the current study explored how loneliness was associated with the structural and functional brain connectivity and network in LLD. NBS, an unbiased connectome-wide approach, was employed to investigate connectional strength and to examine whether there was any connection linking brain regions that was related to loneliness. Differences between LLD and healthy elderly subjects were then examined in terms of the graph theory network properties [i.e. Small-Worldness (SW), nodal strength and betweenness centrality] within the loneliness-related sub-network identified in NBS. SW characterizes a network that is highly clustered with short average characteristic path length and helps determine whether the brain network has the small-world property. We focused on nodal strength and nodal betweenness centrality that describe the overall connectional strength directly connected to the region and the proportion of shortest paths traversing the region respectively, as both provide good indications of the hub-like feature of the region in the brain. We also investigated how loneliness was associated with affective processing in LLD by capturing the blood oxygen-level dependent signals during a task-based fMRI paradigm of viewing affective stimuli. NBS and graph theory analyses were also applied to the task-based fMRI data similar to the DTI data to characterize the functional connectivity and network properties of LLD when they were processing different types of affective stimuli (i.e. Positive, Negative, or Neutral).
In previous research, structural hyperconnectivity was identified in regions within the default mode network and the salience network in LLD (Ajilore et al. Reference Ajilore, Lamar, Leow, Zhang, Yang and Kumar2014b ). Gray-matter volumetric reduction and disruption of white-matter integrity were detected in LLD within the salience network (Ballmaier et al. Reference Ballmaier, Toga, Blanton, Sowell, Lavretsky, Peterson, Pham and Kumar2004; Egger et al. Reference Egger, Schocke, Weiss, Auffinger, Esterhammer, Goebel, Walch, Mechtcheriakov and Marksteiner2008; Steffens et al. Reference Steffens, Taylor, Denny, Bergman and Wang2011) that was important for affective processing and mediation of motivated behaviors (Lindquist et al. Reference Lindquist, Wager, Kober, Bliss-Moreau and Barrett2010). It was also reported that aberrant connectivity of the network was related to number of episodes in depression (Meng et al. Reference Meng, Brandl, Tahmasian, Shao, Manoliu, Scherr, Schwerthoffer, Bauml, Forstl, Zimmer, Wohlschlager, Riedl and Sorg2014). Functionally, the connectivity and network patterns were less conclusive in LLD patients where both increased and decreased functional connectivity have been reported in different studies (Yuan et al. Reference Yuan, Zhang, Bai, Yu, Shi, Qian, Liu, You, Zhang and Liu2008; Aizenstein et al. Reference Aizenstein, Butters, Wu, Mazurkewicz, Stenger, Gianaros, Becker, Reynolds and Carter2009; Bohr et al. Reference Bohr, Kenny, Blamire, O'Brien, Thomas, Richardson and Kaiser2012). We speculated that perceived loneliness, with an adverse effect on the brain, could be associated with the aberrant connectivity and networking prominent in LLD. Therefore, we hypothesized that (1) perceived loneliness would be associated with structural connections within the salience network and that structural hyperconnectivity would exist in this loneliness-related sub-network in LLD. Additionally, negative emotion is associated with alteration of functional activity in areas within salience and corticostriatal networks as proposed by the limbic-cortical model of depression (Mayberg, Reference Mayberg1997). Regions within the two networks were also consistently recruited in social rejection scenarios (Cacioppo et al. Reference Cacioppo, Frum, Asp, Weiss, Lewis and Cacioppo2013). Therefore, we also hypothesized that (2) perceived loneliness would also be related to functional connectivity in the salience and corticostriatal networks differently when LLD patients were viewing negative stimuli.
Materials and method
Participants
A total of 54 participants aged >60 years was included in the current study. Of these, 31 were classified into the LLD group by two geriatric psychiatrists based on the diagnostic interview of unipolar major depressive disorder according to the Structural Clinical Interview of Diagnostic and Statistical Manual of Mental Disorders, Fifth Edition (DSM-5; APA, 2013). These LLD participants were recruited from a psychiatric out-patient clinic of the Chang Gung Memorial Hospital and experienced their first lifetime major depressive episode at age >50 years. Antidepressants were maintained during the scan due to ethical reasons but their medications in use had not changed at least for 2 weeks prior the scan. Their duration of use of hypnotics was also recorded. Healthy and age-matched elderly controls were recruited by advertisement. All participants were right-handed, as evaluated by the Edinburgh Inventory for Handedness (Oldfield, Reference Oldfield1971), and had normal or corrected-to-normal vision. Participants were included only if they did not have any other histories of major psychiatric disorders or cognitive impairment. Additionally, those with a score <24 in the Mini-Mental State Examination (Folstein et al. Reference Folstein, Folstein and McHugh1975) and a history of other neurological diseases were excluded to ensure no confounding effect from cognitive impairment or other neurological changes.
This study was approved by the Institutional Review Board in the Chang Gung Memorial Hospital, and informed consent was obtained from all participants.
Psychological measures
The 17-item Hamilton Rating Scale for Depression (HAMD) was used to measure the severity of depression in the subjects (Hamilton, Reference Hamilton1960). The HAMD has been used widely in psychological and neuropsychiatric studies as an indicator of depressive symptoms and severity of depression, and it has a very high interrater reliability on both single items and the total score (Müller & Dragicevic, Reference Müller and Dragicevic2003). It has also been administered to late-life depressed samples in previous MRI studies (Guo et al. Reference Guo, Cheng, Cao, Xiang, Chen and Zhang2014).
The 20-item UCLA-Loneliness Scale (LS) was used to measure the perceived loneliness of the subjects (Russell, Reference Russell1996). It was one of the popular measures that was sensitive to perceived loneliness and was distinct from the objective measure of social isolation with its application extended to older adults and the elderly (Cacioppo et al. Reference Cacioppo, Hawkley and Thisted2010; Hawkley & Cacioppo, Reference Hawkley and Cacioppo2010). It has also been used in studying the relationship between loneliness and depressive symptoms (Cacioppo et al. Reference Cacioppo, Hughes, Waite, Hawkley and Thisted2006).
MRI data acquisition and preprocessing
DTI data, task-based fMRI data, and T1-weighted structural images were acquired on a 3.0 T GE 750 scanner (GE Healthcare Systems, USA) using an 8-channel head coil.
DTI data was collected in 32 diffusion gradient directions (b = 1000) with two non-diffusion-weighted (b = 0) references using the following parameters: TR = 7500 ms, TE = 80 ms, flip angle = 90°, FOV = 220 × 220 mm2, voxel size = 1.7 × 1.7 × 2.2 mm3. Task-based fMRI data was collected with the following parameters: TR = 2000 ms, TE = 30 ms, flip angle = 90°, FOV = 220 × 220 mm2, voxel size = 3.44 × 3.44 × 4 mm3. T1-weighted structural imaging data was collected with: TR = 8 ms, TE = 3 ms, FOV = 250 × 250 mm2, voxel size = 0.98 × 0.98 × 1 mm3. The T1-weighted images were used for registration during the preprocessing of the fMRI data.
DTI: preprocessing and quantification of structural brain connectivity
The DTI data for each subject was first corrected for eddy current using FSL (Jenkinson et al. Reference Jenkinson, Beckmann, Behrens, Woolrich and Smith2012). Subsequently, the data was fitted with the tensor model, and the streamline tractography algorithm was then applied with whole-brain seeding using DSI Studio (Yeh et al. Reference Yeh, Verstynen, Wang, Fernández-Miranda and Tseng2013) based on the following parameters and other default settings: number of reconstructed streamlines = 100 000, turning angle = 60°, fractional anisotropy >0.1125, step size = 0.4297, minimum length of streamlines = 10, and maximum length of streamlines = 500.
The Automated Anatomical Labeling (AAL) atlas (Tzourio-Mazoyer et al. Reference Tzourio-Mazoyer, Landeau, Papathanassiou, Crivello, Etard, Delcroix, Mazoyer and Joliot2002) comprising 90 cerebral regions was nonlinearly registered to the DTI native space and each region represents a node of the brain network. Structural connection (i.e. edge), with its weight between any pairs of nodal regions, was described by the number of reconstructed streamlines passing the two regions, forming individual raw association matrices denoting the individual's structural brain network.
fMRI: task-based paradigm
The functional brain activations of 47 subjects were measured while they were performing the emotion-processing task (EPT; Lee et al. Reference Lee, Leung, Hou, Tang, Yin, So, Lee and Chan2012) in the scanner. The EPT is an affective processing task where participants passively viewed 20 positive, 20 negative, and 20 neutral human and non-human pictures from the International Affective Picture System. The pictures used had the highest valence and arousal ratings in published norms during MRI scanning (Bradley & Lang, Reference Bradley, Lang, Coan and Allen2007). All the pictures appeared randomly once on a dark background for 3 s in a 60-trial run, with trials separated by varying durations (i.e. 500, 1000, 1500, 2000 or 2500 ms). The ratings of valence from 1 (very negative) to 9 (very positive) and arousal from 1 (not arousing) to 9 (very arousing) of each picture were collected from each subject off-scanner.
fMRI: preprocessing and functional activations
The fMRI data was preprocessed using FEAT in FSL (Beckmann et al. Reference Beckmann, Jenkinson, Woolrich, Behrens, Flitney, Devlin and Smith2006). Each individual's fMRI data was first corrected for motion artifact (i.e. referencing to the middle volume), spatially smoothed (full width at half maximum = 8 mm), high pass temporal filtered (128s), skull-stripped and pre-whitened. The fMRI data of each subject was then normalized to the Montreal Neurological Institute (MNI) standard space through registering to the patient's own skull-stripped T1-weighted volume.
The preprocessed fMRI data was first fed into first level single-subject analyses. The onset and duration of each trial were convolved with the double-gamma hemodynamic response function to approximate the neural event associated with oxy- and deoxy-hemoglobin changes in the blood flow. A general linear model approach was used and three regressors and their temporal derivatives were derived from the positive, negative and neutral pictures. Individuals’ functional activations were investigated in the following two contrast conditions: Positive minus Neutral, and Negative minus Neutral. The results from the two contrast conditions were then brought to the second level group analyses by independent t contrasts using mixed effects high-level modeling (i.e. FLAME 1 of FEAT in FSL).
fMRI: quantification of functional brain connectivity
The beta-series correlation approach was employed for which its validity for studying functional connectivity has already been confirmed (Rissman et al. Reference Rissman, Gazzaley and D'Esposito2004). The preprocessed fMRI data was fed again into first-level single-subject analyses using FEAT in FSL. In this approach, a separate regressor was created for each trial of each task condition (i.e. 20 regressors for Positive, 20 regressors for Negative, 20 regressors for Neutral) and was convolved with the double-gamma hemodynamic response function. Using the general linear model, the parameter estimate, or beta, for each trial at each voxel was obtained and all of them were then sorted by task conditions into beta-series. The AAL atlas (Tzourio-Mazoyer et al. Reference Tzourio-Mazoyer, Landeau, Papathanassiou, Crivello, Etard, Delcroix, Mazoyer and Joliot2002) comprising 90 cerebral regions was then registered to the fMRI native space via the corresponding skull-stripped T1-weighted volume and each region represents a node of the functional brain network. Mean parameter estimate was extracted for each trial for each nodal region. Functional connection (i.e. edge), with its weight between any pairs of nodal regions, was then described by the Pearson's correlation between the beta-series of the two regions separately for each task condition. Only edges that were significant after Bonferroni correction were kept to avoid spurious correlations, yielding individual raw association matrices denoting the individual's functional brain network per task condition.
Statistical analysis
Group characteristics and emotion-processing task ratings
Student's t tests were used to compare the characteristics and the psychological measures, and the χ2 test was used to compare the male-to-female ratio between the LLD group and the healthy elderly. Repeated-measures analysis of variance (rmANOVA) was employed to examine their arousal and valence ratings of affective stimuli.
Task-based functional activations
Moderation of group on the relationship between loneliness and task-based functional activations was analyzed by t contrasts. Group differences in functional activations were also explored. All the t contrasts adopted the voxel-wise threshold at z > 2.3 (p < 0.01) and cluster extent threshold of p < 0.05.
Structural and functional brain connectivity
Similar analytic approach was used on structural and task-based functional raw association matrices. One-sample t tests were first employed separately on individual structural and task-based functional raw association matrices within LLD group and within healthy controls to extract all edges that were significant at 0.05 levels after false-discovery-rate (FDR) corrections. These identified edges within either group were then combined to form a mask. NBS analyses were then performed within the mask to investigate structural or functional connectivity. Using the NBS Connectome toolbox v. 1.2 (Zalesky et al. Reference Zalesky, Fornito and Bullmore2010), general linear models were set up and moderation of group on the relationship between loneliness and structural and functional connections was first tested. Specifically for structural connectivity, as no moderation effect was identified, indicating that the association between loneliness and structural connections did not differ between groups, all the subjects were considered together to investigate the relationship between loneliness and structural connectivity across the whole elderly sample with HAMD as covariate regressor. Group differences of structural and functional connectivity between LLD group and healthy controls were also explored. An initial T threshold equivalent to p < 0.05 uncorrected was used in the univariate t statistics computed for each edge to identify a set of supra-threshold edges. Non-parametric permutation approach with 1000 permutations was then used to identify the structural or functional connections within the set of supra-threshold edges that survived the cluster extent threshold at p < 0.05.
Structural and functional brain network
To further investigate whether the relationships of loneliness with structural and functional connectivity were related to differences in topological organization of structural and functional brain in LLD, graph theory approach was then employed to retrieve graph theory measures for individual's structural and functional brain network of each task condition. A wide range of density thresholds (i.e. 0.0 ⩽ density ⩽ 0.6 in steps of 0.01) were first applied on all individual structural and functional matrices using the Matlab-based package GAT (Hosseini et al. Reference Hosseini, Hoeft and Kesler2012). At each network density, weighted association matrix was obtained for each subject, and the corresponding graph theory measures, including SW, nodal strength and nodal betweenness centrality were retrieved (Rubinov & Sporns, Reference Rubinov and Sporns2010). For a network G with N nodes and K edges at a particular density, SW was described as the ratio between the normalized clustering coefficient and the normalized characteristic path length, with SW numerically larger than 1 denoting a network having small-world property:
 $$SW = \left( {\displaystyle{{C/C_R} \over {L/L_R}}} \right),$$
where C is the cluster coefficient of network G and C R is the mean clustering coefficient of 100 random networks having the same number of nodes, edges and degree distributions as network G. L is the characteristic path length of network G and L R is the mean characteristic path length of 100 random networks having the same number of nodes, edges and degree distributions as network G. Nodal strength s i of each node i was defined as:
 $$s_i = \sum\limits_{i \ne j \in N} {w_{ij}}, $$
where w ij is the edge weight (i.e. number of streamlines or Pearson's correlation) between nodes i and j. Nodal betweenness centrality b i of each node i was defined as:
 $$b_i = \displaystyle{1 \over {(n - 1)(n - 2)}}\sum\limits_{\scriptstyle {\hskip10pt h,j \in N} \hfill \atop \scriptstyle h \ne i,h \ne j,i \ne j \hfill} {\displaystyle{{\rho _{hj}^i} \over {\rho _{hj}}}}, $$
where n is the number of nodes (i.e. 90), ρ hj is the number of shortest paths between nodes h and j, and ρi hj is the number of shortest paths between nodes h and j passing through node i. A minimum density threshold (i.e. 0.23) was then chosen so that all structural networks were not fragmented, and a maximum density (i.e. 0.30) was chosen based on the SW to avoid random networks (i.e. not random when SW > 1) that are less likely to represent a biologically valid network (Kaiser & Hilgetag, Reference Kaiser and Hilgetag2006). This maximum density was also chosen in accordance with the depression literature (Korgaonkar et al. Reference Korgaonkar, Fornito, Williams and Grieve2014). The area under the curve (AUC; Ginestet et al. Reference Ginestet, Nichols, Bullmore and Simmons2011) of the graph theory measures (i.e. nodal strength and nodal betweenness centrality) within the defined threshold density range (i.e. 0.23~0.30) of each individual's structural and task-based functional association matrices were then calculated for further analyses on network topological organization. Moderation of group on the relationship between loneliness and AUC of graph theory measures of structural and functional brain networks was analyzed. For structural networks, group differences were compared by Student's t tests in nodal regions that have structural connections related to loneliness. For functional networks, group differences were compared by Student's t tests in nodal regions with functional connections that have different associations with loneliness between LLD and controls. All the calculations were performed using Matlab-based functions implemented in the Brain Connectivity Toolbox (http://brain-connectivity-toolbox.net/) and statistical analyses were carried out in the Matlab environment. The significance of the analyses on graph theory measures was determined at 0.05 levels with FDR corrections.
Results
Group characteristics
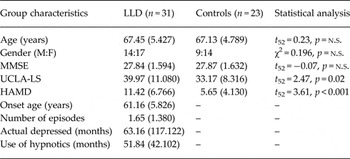
The age, gender ratio and MMSE scores did not differ between groups (all p’s > 0.05), confirming that the two groups were matched, and the LLD group had higher scores in the LS (t 52 = 2.47, p = 0.02) and the HAMD (t 52 = 3.61, p < 0.001) (Table 1).
Group characteristics of LLD subjects and controls

LLD, Late-life depression; MMSE, Mini-Mental State Examination; UCLA-LS, UCLA Loneliness Scale; HAMD, Hamilton Rating Scale for Depression; n.s., not significant.
Student's t test or χ2 test were used.
The results are expressed as the means (standard deviations);
Loneliness and structural brain
Association between loneliness and structural brain connectivity
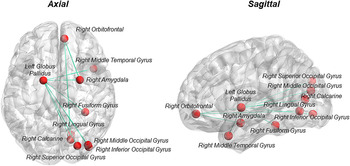
From NBS analyses, group did not moderate the relationship between scores in LS and any structural connections. Across all subjects, scores in LS were identified to be negatively associated with edge weights of edges within a sub-network component comprising of 10 nodal regions and 10 edges. This loneliness-related sub-network identified from the whole elderly sample included edges of right middle temporal gyrus, amygdala, fusiform gyrus, inferior occipital gyrus, middle occipital gyrus, superior occipital gyrus, and calcarine fissure connecting to left globus pallidus, and edges from right calcarine fissure, lingual gyrus and amygdala connecting to superior frontal gyrus (Fig. 1).
Summary of significant sub-network that is associated with subjects’ scores in UCLA Loneliness Scale using network-based statistical analysis. The nodes and edges of this sub-network are overlaid on the ICBM152 brain surface (http://surfer.nmr.mgh.harvard.edu/) and the axial and sagittal views are shown.

Group comparison in structural brain connectivity and network
From NBS analyses, no significant differences in structural connection between LLD and controls were identified. Using graph theory analyses, the group differences in AUC of nodal degree and betweenness centrality of the 10 regions within the loneliness-related sub-network were then examined by individual Student's t tests. None of the nodal graph theory measures showed any significant differences between LLD and controls after FDR corrections for multiple comparisons (Supplementary Table S1).
Loneliness and functional brain of affective processing
Association between loneliness and arousal and valence ratings
Moderation of group on the relationship between scores in LS and the subjects’ arousal and valence ratings of the emotional stimuli (i.e. Positive, Negative, Neutral) did not yield any significant results (all p’s > 0.05). Therefore, partial Pearson's correlations between scores in LS and all subjects’ arousal and valence ratings were performed, controlling for HAMD. It was found that all the arousal ratings negatively correlated with scores in LS (Positive: r 44 = −0.33, p = 0.02; Negative: r 44 = −0.33, p = 0.03; Neutral: r 44 = −0.42, p = 0.004). The correlations were similar after further controlling for group.
Association between loneliness and functional activations during affective processing
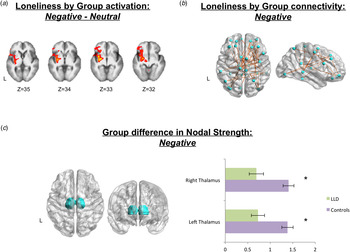
Significant moderation of group on the relationship between scores in LS and the subjects’ functional activations was observed in contrast condition Negative minus Neutral, forming a large cluster comprising mainly insula, putamen, globus pallidus and brain stem, along with frontal regions including inferior frontal gyrus, frontal pole, and frontal orbital cortex (k = 4670, Z peak = 3.69, MNI coordinates of Z peak: −24, −4, −4) (Fig. 2a ), of which the percent signal change negatively correlated with scores in LS in LLD (r 25 = −0.39, p = 0.04) but positively correlated with that in controls (r 18 = 0.52, p = 0.02). Similar findings were observed after controlling for HAMD in partial Pearson's correlation. No moderation was observed in contrast condition Positive minus Neutral.
(a) The functional clusters having significantly different associations with scores in Loneliness scale (LS)between late-life depression (LLD) and controls in the Negative minus Neutral contrast condition are overlaid in red-yellow on the corresponding template in standard Montreal Neurological Institute space. (b) The functional nodes and edges having significantly different associations with scores in LS between LLD and controls during Negative condition are overlaid on the ICBM152 brain surface (http://surfer.nmr.mgh.harvard.edu/) and the axial and sagittal views are shown. (c) The regions of interest, both left and right thalamus, are overlaid on the ICBM152 brain surface (http://surfer.nmr.mgh.harvard.edu/) with the corresponding bar charts with standard error showing the significant group differences in the area under the curve of nodal strength in the two regions. L, Left.

Association between loneliness and functional connectivity during affective processing
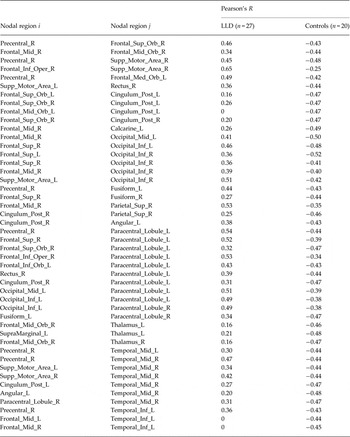
From NBS analyses, significant moderation of group on the relationship between scores in LS and the subjects’ functional connectivity was observed in connections linking a widespread of regions in Negative and Neutral conditions. Therefore, a more stringent T threshold (p < 0.01) with cluster extent threshold at p < 0.05 was applied and reported. For the Negative condition, 33 nodes within a sub-network component of 46 edges were related to scores in LS positively in LLD but negatively in controls, mainly involving frontal regions, along with posterior part of cingulum, thalamus, and some temporal and occipital areas (Table 2, Fig. 2b ). For the Neutral condition, 67 nodes within a sub-network component of 132 edges were related to scores in LS more positively in controls than that in LLD (Supplementary Table S2). No moderation effect of group on the relationship between scores in LS and subjects’ functional connectivity in Positive condition was identified.
Pearson's correlation between functional connections of nodal pairs and scores in UCLA-Loneliness Scale in LLD subjects and controls during Negative task condition

The Pearson's R of the connections between any two nodes (i, j) that were identified to have significant Loneliness by Group interaction are reported for LLD and controls.
LLD, Late-life depression; Precentral_R, right precentral gyrus; Frontal_Sup_L, left superior frontal gyrus, dorsolateral; Frontal_Sup_R, right superior frontal gyrus, dorsolateral; Frontal_Sup_Orb_L, left superior frontal gyrus, orbital part; Frontal_Sup_Orb_R, right superior frontal gyrus, orbital part; Frontal_Mid_L, left middle frontal gyrus, lateral part; Frontal_ Mid_R, right middle frontal gyrus, lateral part; Frontal_Mid_Orb_L, left middle frontal gyrus, orbital part; Frontal_Mid_Orb_R, right middle frontal gyrus, orbital part; Frontal_Inf_Oper_R, right opercular part of inferior frontal gyrus; Frontal_Inf_Orb_L, left orbital part of inferior frontal gyrus; Supp_Motor_Area_L, left supplementary motor area; Supp_Motor_Area_R, right supplementary motor area; Frontal_Med_Orb_L, left superior frontal gyrus, medial orbital part; Rectus_R, right gyrus rectus; Cingulum_Post_L, left posterior cingulate gyrus; Cingulum_Post_R, right posterior cingulate gyrus; Calcarine_L, left calcarine sulcus; Occipital_Mid_L, left middle occipital; Occipital_Inf_L, left inferior occipital; Occipital_Inf_R, right inferior occipital; Fusiform_L, left fusiform gyrus; Fusiform_R, right fusiform gyrus; Parietal_Sup_R, right superior parietal lobule; SupraMarginal_L, left supramarginal gyrus; Angular_L, left angular gyrus; Paracentral_Lobule_L, left paracentral lobule; Paracentral_Lobule_R, right paracentral lobule; Thalamus_L, left thalamus; Thalamus_R, right thalamus; Temporal_Mid_L, left middle temporal gyrus; Temporal_Mid_R, right middle temporal gyrus; Temporal_Inf_L, left inferior temporal gyrus.
Group comparison in arousal and valence ratings
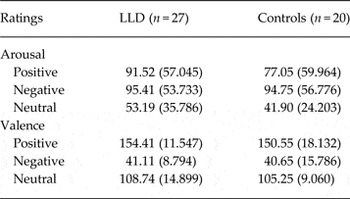
From the rmANOVA, no significant condition by group interaction was observed in the subjects’ valence ratings (F 2,90 = 0.24, p = 0.79). There was a significant main effect of condition on valence ratings (F 2,90 = 896.41, p < 0.001) but no main effect of group was identified (F 1,90 = 1.19, p = 0.28). Post-hoc pairwise comparisons with Bonferroni adjustment revealed that valence ratings differed between any two conditions (all p’s < 0.001) with the mean ratings in the order of Positive > Neutral > Negative. Similarly, no significant condition by group interaction was observed in their arousal ratings (F 2,90 = 0.83, p = 0.44). There was a significant main effect of condition on arousal ratings (F 2,90 = 39.52, p < 0.001) but no main effect of group was identified (F 1,90 = 0.45, p = 0.51). Post-hoc pairwise comparisons with Bonferroni adjustment revealed that arousal ratings differed between any two conditions (all p’s < 0.05) with the mean ratings in the order of Negative > Positive > Neutral. The means of task ratings are presented in Table 3.
Emotion-processing task ratings from late-life depression (LLD) subjects and controls

Means with standard deviations in parentheses are presented.
Group comparison in functional activations of affective processing
The LLD group exhibited larger functional activations in both Positive minus Neutral and Negative minus Neutral contrast conditions. In the Positive minus Neutral contrast, a large cluster comprising mainly frontal pole, paracingulate gyrus, and frontal medial and orbital cortex with some activations in the subcortical regions such as caudate, nucleus accumbens and putamen was observed to be more activated in LLD (k = 2177, Z peak = 3.62, MNI coordinate of Z peak: −14, 54, −6); while in the Negative minus Neutral contrast, a very widespread and large cluster comprising frontal pole, frontal orbital cortex, middle temporal gyrus, precuneus and cingulate regions along with subcortical regions including hippocampus caudate, putamen, globus pallidus, nucleus accumbens, amygdala, and also brain stem was observed to be more activated in LLD as well (k = 42 826, Z peak = 4.67, MNI coordinates of Z peak: 60, −56, −26).
Group comparison in functional brain connectivity and network of affective processing
From NBS analyses, the LLD group and controls did not show any differences in the functional connectivity in any of the task conditions. Using graph theory analyses, significant group differences were observed in the nodal strength of thalamus (left thalamus: t 45 = 3.39, p = 0.02; right thalamus: t 45 = 3.63, p = 0.02) (Fig. 2c ) that has functional connections associated with scores in LS differently between LLD and controls in Negative condition.
Discussion
The findings partially supported our first hypothesis that perceived loneliness was associated with structural brain networking in regions within the salience network (i.e. amygdala), with an additional component that connected left globus pallidus with temporal and occipital regions. No structural hyperconnectivity within this loneliness-related sub-network was identified. Functionally, connectivity within the default mode network and the corticostriatal network was found to be positively associated with the perceived loneliness in LLD but negatively with that in controls when processing negative stimuli. We further revealed that the thalamus from the corticostriatal network had decreased hub-like networking pattern in LLD. This finding only partially aligned with our initial hypothesis. We believe that verifying the two hypotheses would increase our knowledge of the neurobiological model of LLD at the brain connectivity and networking levels, and importantly, would provide some evidence on how loneliness could be closely related to the disease from a social neuroscientific perspective. To the best of our knowledge, this was the first study investigating how perceived loneliness in LLD was related to their brain connectivity and networking during affective processing.
Loneliness is associated with structural brain networking
Studies investigating the structural brain networking in LLD are scarce. In the current study, we identified loneliness-related sub network connecting the frontal (i.e. superior frontal gyrus) to the limbic area (i.e. amygdala), and an additional component that connected left globus pallidus with temporal and occipital regions. From the literature, amygdala was found to be not just responsible for affective processing (e.g. Lindquist et al. Reference Lindquist, Wager, Kober, Bliss-Moreau and Barrett2010), but it also plays an important role in social cognition and social connectedness (Kanai et al. Reference Kanai, Bahrami, Roylance and Rees2012b ). Strength of functional connectivity connecting from amygdala to frontal regions could predict the social networking size (Bickart et al. Reference Bickart, Hollenbeck, Barrett and Dickerson2012). There was also research suggesting superior frontal gyrus as one of the regions that was functionally reacted to social exclusion situations (Bolling et al. Reference Bolling, Pitskel, Deen, Crowley, Mayes and Pelphrey2011). Perceived loneliness feeling is aroused from the perception of being socially isolated when there is mismatch between one's social needs and the social relationships provided by one's social network (Luo et al. Reference Luo, Hawkley, Waite and Cacioppo2012). Our finding of higher perceived loneliness related to weaker structural connection between the amygdala and superior frontal gyrus might further imply that the perceived loneliness feeling in elderly would also be associated with structural connections emanating from amygdala. Less direct evidences were reported on the relationship between globus pallidus and/or its connectivity and loneliness. From a recent study, asymmetry of globus pallidus volume has been reported to be related to social avoidance, and that its volume was associated with interpersonal relationships (Evans et al. Reference Evans, Lazar, Boomer, Mitchel, Michael and Moore2015). Functional alterations in globus pallidus and its functional connectivity have been detected in patients with social anxiety disorder (Hattingh et al. Reference Hattingh, Ipser, Tromp, Syal, Lochner, Brooks and Stein2012; Arnold Anteraper et al. Reference Arnold Anteraper, Triantafyllou, Sawyer, Hofmann, Gabrieli and Whitfield-Gabrieli2014). The social exclusion theory of anxiety has suggested that anxiety can be elicited by one's fear of being excluded from important social groups (Baumeister & Tice, Reference Baumeister and Tice1990), as such, affective reactions including social anxiety and the loneliness feeling often exhibit as response (Leary, Reference Leary1990). Therefore, structural connections from globus pallidus might also be important in responding to social exclusion situations and hence, related to the perceived loneliness.
Our findings have revealed that perceived loneliness did not act on the structural connectivity differently in LLD as compared to controls and no alteration of nodal strength in regions within the loneliness-related sub-network in LLD patients was identified. This did not align with part of our initial hypothesis of expecting structural hyperconnectivity in the salience network in LLD. Methodological differences may be one of the possible explanations. The current study has used DTI data to study structural connectivity whereas structural hyperconnectivity observed in regions within the default mode network and the salience network was previously implied by T1-weighted data (Ajilore et al. Reference Ajilore, Lamar, Leow, Zhang, Yang and Kumar2014b ). It may reveal that there are significant dependencies of structural network measures on methodologies and warrants more careful interpretation of the alterations of structural networking patterns in the LLD patients. Another possible explanation may relate to the different LLD patient sample included in the current study. Antidepressants were maintained in the LLD patients during the scanning because of ethical reasons in the current study. We cannot rule out the possibility that the inconsistent structural networking pattern observed was related to the medication effect. Nonetheless, the current study has proved that higher perceived loneliness in LLD patients and healthy elderly is related to a large extent of brain structural disconnectivity. It suggested that there was a detectable impact of the subjective feeling of loneliness in LLD and elderly at the structural brain connectional level.
Special role of loneliness in the functional connectivity of negative affective processing in LLD
Contrasting to the non-significant moderation effect of group on the relationship between one's perceived loneliness and structural connectivity, significant moderation effect of group on the relationship between one's perceived loneliness and functional activations was observed in contrast condition Negative minus Neutral within regions including insula, basal ganglia and orbitofrontal area. Furthermore, the functional connectivity within the default mode network (i.e. middle frontal gyrus, posterior cingulate, middle and inferior temporal gyrus) and the corticostriatal network (i.e. lateral orbitofrontal and thalamus) during negative affective processing was positively associated with perceived loneliness in LLD but negatively associated with that in the healthy elderly. The default mode network is involved in perspective taking and self-reflection processes (Buckner & Carroll, Reference Buckner and Carroll2007). It activates more when one focuses on more internal and self-referential processes, and deactivates when one focuses on goal-directed tasks or the external environment (Raichle et al. Reference Raichle, MacLeod, Snyder, Powers, Gusnard and Shulman2001) Importantly, failing in down-regulating the default mode network activations when viewing negative stimuli has been reported in depressed patients and was seen as a network-based mechanism of depression (Sheline et al. Reference Sheline, Barch, Price, Rundle, Vaishnavi, Snyder, Mintun, Wang, Coalson and Raichle2009). The functional connectivity between posterior cingulate and middle temporal gyrus is identified to be more responsive to emotion (Laird et al. Reference Laird, Eickhoff, Li, Robin, Glahn and Fox2009). Furthermore, most of the other subnetworks of default mode network are found to originate in posterior cingulate cortex. Previously, posterior cingulate cortex has been reported to be related to perceived social support (Che et al. Reference Che, Wei, Li, Li, Qiao, Qiu, Zhang and Liu2014), and hence, it is intriguing to propose that perceived loneliness plays a special role in LLD and has an impact on the core anchor of the default mode network which would be related to the failure in the network down-regulation during the processing of negative emotions.
Corticostriatal circuitry, that is densely interconnected among frontal regions, basal ganglia and thalamus, plays an important role in reward processing and hedonic experience; and it was also reported to be abnormal in LLD and could be contributing to the apathy and anhedonia experience in LLD (Tadayonnejad & Ajilore, Reference Tadayonnejad and Ajilore2014). LLD patients were reported to have reduced gray matter volume over orbitofrontal cortex, putamen, and thalamus (Sexton et al. Reference Sexton, MacKay and Ebmeier2013). From the limbic-cortical model of depression, negative emotions in depressed patients were particularly related to the dysregulation of the functional circuitry, of which the basal ganglion would receive segregated afferents and efferents from both the dorsal (i.e. anterior and posterior cingulate) and ventral (i.e. subgenual, anterior insula, hypothalamus) compartments with thalamic region as a relay (Mayberg, 1997). It was also pointed out by another meta-analytic study that the thalamus closely works with the frontal system to control over other subcortical structures (i.e. striatum) for the primitive responses towards emotions (Lai, Reference Lai2014). On the other hand, thalamus has been reported to have changes in activations when people encounter social pain situations, such as romantic rejection, bereavement and social rejection scenarios (Eisenberger, Reference Eisenberger2012). As argued by Keltner & Kring (Reference Keltner and Kring1998), emotions carry social meanings and are critical in coordinating social interactions. Norris et al. (Reference Norris, Chen, Zhu, Small and Cacioppo2004) have also conducted a task-based fMRI study to investigate how different regions may react to emotional and social pictures and thalamus was one of the regions that were responsive to emotional content and more strongly with social stimuli. They argued that social stimuli is emotionally evocative that catalyzes emotional reactions, which might echo the current study's findings on how thalamic connectivity, as part of a key circuitry implicated in processing negative emotions in depressed patients, has a different association with their subjective feeling of loneliness. More interestingly, we further identified that the thalamus had decreased hub-like networking pattern in LLD. It is tentatively proposed that alterations in the functional connectivity of the corticostriatal circuitry because of the detrimental effect of being lonely might be related to the less efficient networking of the thalamus as a relay center. Prospective studies are needed for validation. It is noted that no other functional network differences in terms of nodal strength and nodal betweenness centrality were revealed in other regions, which might not align with previous findings (Yuan et al. Reference Yuan, Zhang, Bai, Yu, Shi, Qian, Liu, You, Zhang and Liu2008; Aizenstein et al. Reference Aizenstein, Butters, Wu, Mazurkewicz, Stenger, Gianaros, Becker, Reynolds and Carter2009; Bohr et al. Reference Bohr, Kenny, Blamire, O'Brien, Thomas, Richardson and Kaiser2012). As proposed earlier, inconsistent findings observed in the functional connectivity pattern in LLD might be attributed to significant methodological differences between studies. Particularly, the current study is investigating the networking differences between groups during negative affective processing instead of resting-state. Additionally, we have only focused our graph theory analyses on regions that showed different association with perceived loneliness in LLD because the current study aims to investigate the special role of loneliness in LLD at the brain connectivity and network levels, and hence, might have overlooked some of the other potential nodal networking differences.
Finally, it is also worth noting that there is no moderation effect of group on the association between subjects’ perceived loneliness and their arousal and valence ratings of the affective stimuli. This might suggest that the impact of perceived loneliness on affective processing in LLD is more sensitive at the brain connectivity and network levels, but less likely to be represented at the behavioral level.
Implications
LLD is related to dysfunction of brain networks, and this association has gained support from putative neuroimaging and lesions studies (Drevets et al. Reference Drevets, Price and Furey2008). To effectively alleviate depressive symptoms in depressed elderly, it is crucial to identify psychotherapeutic interventional targets that can promote neurobiological changes at the network level. The current study has shown how perceived loneliness is closely related to the brain connectivity and networking. Moreover, we have shown that perceived loneliness plays a unique role in the implicated affective processing in LLD in terms of functional connectivity and networking, whereas the pattern of structural connectivity associated with perceived loneliness appears to be largely similar across both LLD and healthy elderly. Our study provides first evidence indicating that perceived loneliness might be detrimental to brain circuitries that underlie affective processing in LLD. Because not all LLD patients can attain full remission after antidepressant treatments (Nelson et al. Reference Nelson, Delucchi and Schneider2008), targeting their perceived loneliness might be a useful intervention scheme for depressive patients. Previous literature has already shown how loneliness could be managed and remediated practically through providing social support, training on social skills and social cognition (Masi et al. Reference Masi, Chen, Hawkley and Cacioppo2011; VanderWeele et al. Reference VanderWeele, Hawkley, Thisted and Cacioppo2011; Perissinotto et al. Reference Perissinotto, Stijacic Cenzer and Covinsky2012). This study has increased our understanding of the neurobiological underpinnings of loneliness and has brought clinical value to treating depressive symptoms.
Limitations
We have provided initial evidence indicating that loneliness could be related to alteration of functional networking in LLD, but we could not be certain how this was related to the physiology of the brain and the disease. The LLD patients were on antidepressants due to ethical reasons but potential medication effect could have confounded our findings. We have only recruited those with medications in use that have not changed at least for 2 weeks prior the MRI scanning to avoid abrupt neural and physiological changes brought by changing of medications. In addition, the current study could not address the specificity of the findings because only LLD subjects and controls were compared. It would be interesting if additional comparisons were made, for example, between early onset depressed patients and LLD patients or between other clinical populations (e.g. bipolar disorder) and LLD patients. These comparisons could be made to investigate the potential commonalities and specificities of the disease at the brain connectivity and networking levels and the effectiveness of loneliness as an intervention target. Future work along this research direction would be informative.
Conclusions
Perceived loneliness is a crucial variable in the neurobiological model of LLD, relating to both the alteration in functional connectivity and networking in negative affective processing. Targeting at the social connectedness and loneliness feeling in LLD might be worth considered as remediation to LLD. Prospective studies in neuropsychological basis of loneliness and depression are much encouraged.
Supplementary material
For supplementary material accompanying this paper visit http://dx.doi.org/10.1017/S0033291716001033.
Acknowledgements
This work was supported by the May Endowed Professorship of The University of Hong Kong and Medical Research Grants from Chang Gung Memorial Hospital (CMRPG3C0041 and CMRPG3C0042). The funders did not play any role in study design, data collection and analysis, decision to publish, or preparation of the manuscript.
Declaration of Interest
None.