



Introduction
Autism spectrum disorder (ASD) is a lifelong neurodevelopmental disorder that affects individuals in various ways. According to the Centers for Disease Control and Prevention (CDC), one in 36 children in the United States is estimated to be affected by ASD (Maenner et al., Reference Maenner, Warren, Williams, Amoakohene, Bakian, Bilder and Shaw2023). There are multiple ASD subtypes, for example, the DSM-4 defines five subtypes of autism, including Rett syndrome, Asperger's syndrome, atypical autism, childhood disintegrative disorder, and classic autism (American Psychiatric Association, 2000). The phenotypic (symptoms and etiology) and mesoscopic (functional brain networks) aspects of ASD are widely heterogeneous (Lombardo, Lai, & Baron-Cohen, Reference Lombardo, Lai and Baron-Cohen2019; Yang et al., Reference Yang, Wang, Zhou, Wang, Chen, Yuan and Dong2023; Zabihi et al., Reference Zabihi, Oldehinkel, Wolfers, Frouin, Goyard, Loth and Marquand2019). Specifically, ASD phenotypes are heterogeneous because they cover a range of social, communication, and behavioral disorders. They also vary with age, for example, patients with IQ below 70 usually have more severe symptoms (Shao, Fu, & Chen, Reference Shao, Fu and Chen2023). Moreover, functional brain networks in ASD are heterogeneous because they reflect the brain's activity patterns and connection strengths across tasks and resting states (Shao et al., Reference Shao, Fu and Chen2023). Consequently, it is difficult to understand its pathological mechanisms, distinguish among subtypes, and apply research findings in clinical setting. Research in the past few decades has used various approaches to understand the heterogeneity of ASD, including examination of genetic, neurobiological, and behavioral factors (Caldecott, Reference Caldecott2000; Guo et al., Reference Guo, Zhai, Liu, Cao, Zhang, Cui and Gao2022; Mannion & Leader, Reference Mannion and Leader2016). However, the complex and multifactorial nature of the disorder remains a challenge for researchers and clinicians alike.
Advances in neuroimaging techniques have shed light on the neural mechanism of ASD, revealing structural and functional differences in the brains of individuals with ASD compared to typically developed (TD) individuals (Bai et al., Reference Bai, Yip, Windham, Sourander, Francis, Yoffe and Sandin2019). ElNakieb et al., used resting-state fMRI data from the Autism Brain Imaging Data Exchange database (ABIDE) and investigated the role of connectivity dynamics of resting-state networks in the diagnosis of ASD (ElNakieb et al., Reference ElNakieb, Ali, Elnakib, Shalaby, Mahmoud, Soliman and El-Baz2023). They found that compared with TD individuals, those with ASD spent more time in states with weaker FC, especially within the default mode network (DMN) and between the DMN and other networks. What's more, researchers showed that the abnormalities of resting state FC in ASD may depend on various factors, such as age, gender, IQ, task condition, data modality, analysis technique and network definition (Hull et al., Reference Hull, Dokovna, Jacokes, Torgerson, Irimia and Van Horn2017). However, the heterogeneity of the disorder hampers identification of reliable biomarkers or neuroimaging-based diagnostic tools (Ecker et al., Reference Ecker, Ronan, Feng, Daly, Murphy, Ginestet and Williams2013). In addition, there is a need for more comprehensive and standardized assessments of ASD to improve diagnostic accuracy and aid in the identification of subtypes (Bai et al., Reference Bai, Yip, Windham, Sourander, Francis, Yoffe and Sandin2019).
Traditional research methods often rely on comparisons between patient and control groups, with age included as a covariate to control for its effects. However, this approach has limitations in achieving individual-level predictions and explaining the variability in disease progression. Recent advances in neuroimaging techniques have enabled the identification of unique neural signatures associated with psychiatric disorders at the individual level (Lv et al., Reference Lv, Di Biase, Cash, Cocchi, Cropley, Klauser and Zalesky2021). For instance, machine learning algorithms can be applied to predict clinical outcomes based on imaging features, providing personalized predictions for patients (Drysdale et al., Reference Drysdale, Grosenick, Downar, Dunlop, Mansouri, Meng and Liston2017). Furthermore, traditional group comparison approaches may not be sensitive enough to detect subtle changes in brain structure or function that are characteristic of psychiatric disorders. For example, studies have shown that ASD individuals' cortical thickness (CT), surface area, and white matter volume change significantly with age (Sowell et al., Reference Sowell, Thompson, Leonard, Welcome, Kan and Toga2004). Thus, age-related changes should be taken into consideration when comparing brain measures between groups to avoid misinterpretation of the results.
Normative models(NM) have emerged as a powerful tool to address the limitations of traditional group comparison studies in neuroimaging research. By defining a range of values for a particular brain feature in a healthy cohort, NM can identify individuals who deviate from the expected patterns of brain development or aging. This approach can help to address issues related to heterogeneity, confounding factors, and individual variability in neuroimaging data (Fjell et al., Reference Fjell, Grydeland, Krogsrud, Amlien, Rohani, Ferschmann and Walhovd2015). Moreover, the method has been applied in various fields of neuroscience, including studies of ASD (Bethlehem et al., Reference Bethlehem, Seidlitz, Romero-Garcia, Trakoshis, Dumas and Lombardo2020; Ecker, Reference Ecker2019). The benefits are as follows. First, it can overcome the limitations of traditional case–control analysis methods and provide individual-level results (Zabihi et al., Reference Zabihi, Floris, Kia, Wolfers, Tillmann and Arenas2020). Second, NM offers a flexible framework considering factors like age and gender, addressing the complex heterogeneity in resting-state FC in ASD. Third, NM allows assessment of associations between FC heterogeneity and ASD subtypes or dimensions, tied to clinical presentation, genetic risk, or treatment response, in relation to other biological or behavioral variables (Rutherford et al., Reference Rutherford, Barkema, Tso, Sripada, Beckmann, Ruhe and Marquand2023). Additionally, there have been some advances in the use of normative modeling in ASD research. It has been applied to brain measures such as CT, white matter integrity, and FC (Sala-Llonch, Bartrés-Faz, & Junqué, Reference Sala-Llonch, Bartrés-Faz and Junqué2015).
Age is a crucial covariate that needs to be considered when studying brain characteristics. Numerous studies have demonstrated age-related changes in brain structure and function, particularly during childhood and adolescence (Giedd et al., Reference Giedd, Blumenthal, Jeffries, Castellanos, Liu, Zijdenbos and Rapoport1999; Shaw et al., Reference Shaw, Greenstein, Lerch, Clasen, Lenroot, Gogtay and Giedd2006). This helps ensure that observed differences are not due to age-related changes rather than the diagnostic condition. For example, white matter volume has been shown to increase with age in a linear manner until early adulthood, after which it plateaus and then declines (Lebel et al., Reference Lebel, Gee, Camicioli, Wieler, Martin and Beaulieu2012).
Large-scale fMRI data are crucial for understanding the complex relationship between brain activity and behavior, thereby guiding the clinical treatment of neurological and psychiatric disorders. Given the complexity of both brain activity and behavior, identifying a direct mapping between specific brain regions and behavioral measurements is unlikely (Gratton, Nelson, & Gordon, Reference Gratton, Nelson and Gordon2022), and collaboration at the consortium level is needed. Despite potentially revealing only small effect sizes, collaborative studies using cross-sectional methods can still provide stronger effect sizes than mature genome-wide association study methods (Sniekers et al., Reference Sniekers, Stringer, Watanabe, Jansen, Coleman, Krapohl and Posthuma2017).
FC alterations have been observed in several neurological disorders (Baggio et al., Reference Baggio, Segura, Garrido-Millan, Marti, Compta, Valldeoriola and Junque2015; Hazlett et al., Reference Hazlett, Gu, Munsell, Kim, Styner, Wolff and Piven2017), suggesting the potential use of FC as a biomarker for disease detection and monitoring. In addition, FC has not been used as a neural marker in NM research targeting ASD. Moreover, studies have shown that disruptions in the DMN play an important role in the pathogenesis of ASD (Dickie et al., Reference Dickie, Ameis, Shahab, Calarco, Smith, Miranda and Voineskos2018; von dem Hagen, Stoyanova, Baron-Cohen, & Calder, Reference von dem Hagen, Stoyanova, Baron-Cohen and Calder2013). However, the relationship between brain networks and the changes in FC over the lifespan remains unclear. Recent large-scale analyses combining data have revealed significant heterogeneity in CT among children with ASD (van Rooij et al., Reference van Rooij, Anagnostou, Arango, Auzias, Behrmann, Busatto and Buitelaar2018). Thus, we can make the following inferences about FC in ASD: first, age is a particularly important variable in the development of autism; second, we should not focus on mean differences between all cases and all healthy controls but rather stratify subjects according to age, focusing on changes in FC and degree of variability over time, to identify extreme cases that lie on this normative variability spectrum.
However, because of the large individual differences in ASD, different patients exhibit different symptoms and etiologies. Therefore, it is difficult to identify a major trend or type of change in ASD patients. Thus, we decided to use the whole-brain FC network as an indicator and focus on changes in connectivity within and between different brain networks with age. It is crucial to consider the heterogeneity in brain connectivity and morphology in individuals with ASD, particularly in relation to age, and to investigate how these differences may impact development and long-term outcomes. We aimed (1) to determine a predicted normative value of within- and between-network FC that changes with age, defining values more than two standard deviations from the predicted value as extreme; (2) to provide an individual-level assessment of ASD with reference to the population level, describing the degree of change in connectivity with age; and (3) to elucidate the relationship between brain data and symptoms, specifically by determining the correlation between behavioral data and the strength of connectivity within and between networks, focusing on the differences between the brain regions identified through this behaviorally relevant analysis and those identified through traditional case/control methods. We constructed functional networks in each subject's brain and used these as raw materials for comparison (see Methods for the details). All code and data used can be found on GitHub (Bethlehem, Seidlitz, Romero-Garcia, Dumas, & Lombardo, Reference Bethlehem, Seidlitz, Romero-Garcia, Dumas and Lombardo2018).
Methods and materials
Participants
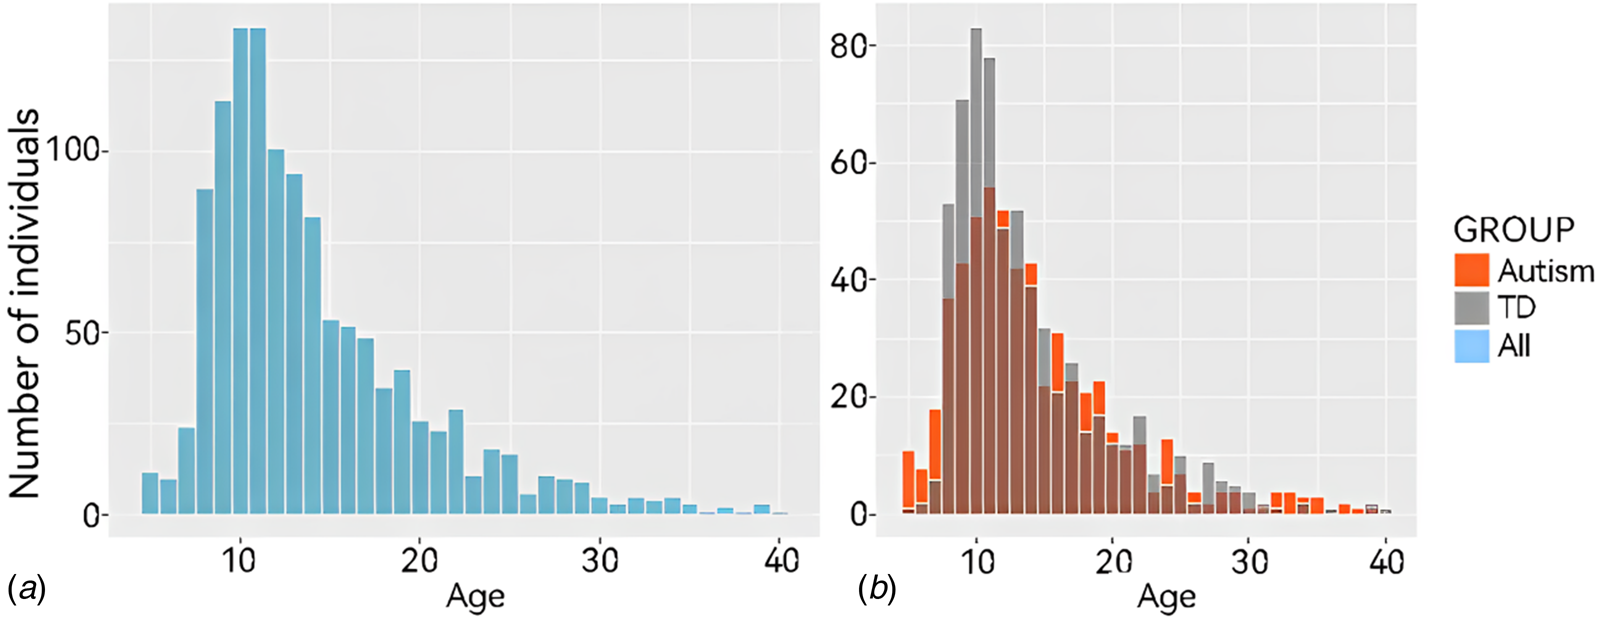
The ABIDE dataset is a large-scale open-access neuroimaging dataset for ASD, which currently includes resting-state fMRI data from 1495 individuals collected at 17 data acquisition centers. All the data analyzed in this study were sourced from the ABIDE dataset (see more details in online Supplementary file 1). We aimed to identify subtle changes in brain FC in ASD populations using a large dataset to achieve greater statistical power. After exclusion, the sample size was 642 for the TD group and 576 for the ASD group. The characteristics of the sample are shown in Table 1. And Fig. 1a and 1b provide an illustrative overview of the complete sample.
Sample characteristics after normative modeling selection
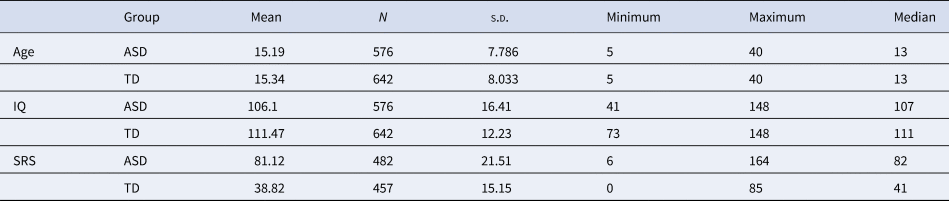
The characteristics of both cohorts are shown in the figure. Information of age, full IQ standard score, and the total score of social responsiveness scale are listed.
Age distribution of all subjects in the current study. Age distribution histograms of all participants under the age of 40. (A) Shows all participant data and (B) shows data from participants according to group (ASD or TD).
Constructing age-related normative models
Before this section, we preprocessed functional MRI data, constructed FC matrices, and conducted multisite effect correction, please check online Supplementary file 2 for detailed instructions.
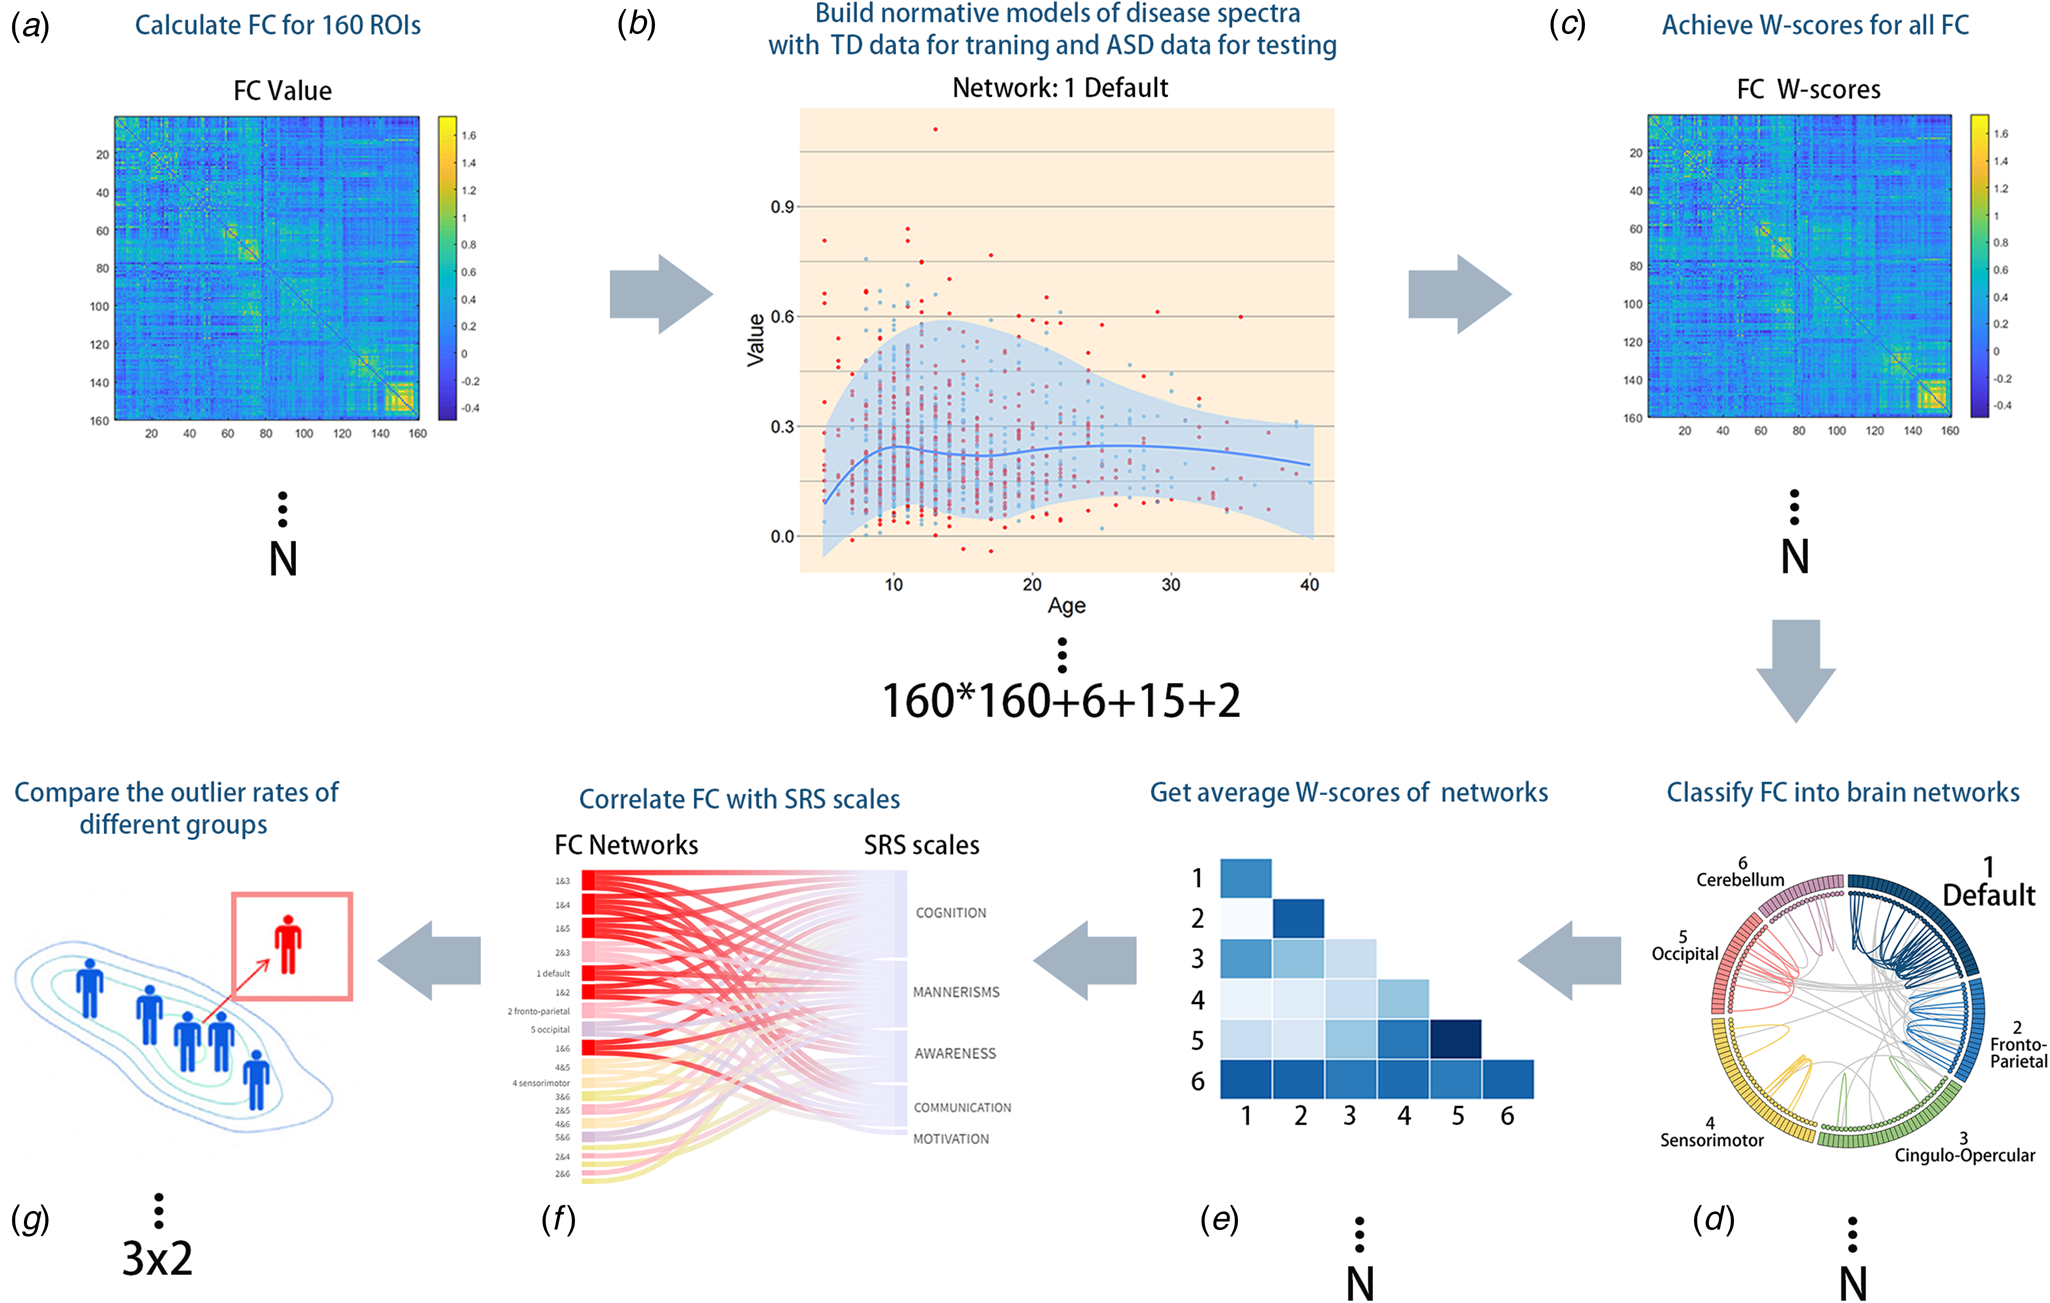
An overview of the normative modeling approach is provided in Fig. 2; this approach has been described previously (Marquand, Rezek, Buitelaar, & Beckmann, Reference Marquand, Rezek, Buitelaar and Beckmann2016). We used a method called the local polynomial regression fitting process (LOESS) to determine the local width or smoothing kernel of the regression model based on the minimum squared error model provided across the entire age range (see methodological details in online Supplementary file 3). With LOESS, the local width or smoothing kernel of the regression was determined by the model that provided the overall smallest sum of squared errors using hyperparameter optimization across 5–100% of the full age range using Brent's method as implemented in the R optim function from the stats package. We also evaluated the consistency of our outputs using percentile scoring, extensive bootstrapping, and sensitivity analyses and assessed the consistency of the NM. These methods all indicated that our results were highly consistent.
Methodological overview of the whole study. (A) We calculated the global FC of all participants. (B) LOESS regression was used to estimate the developmental trajectory of every FC to obtain an age-specific mean and standard deviation, which were then used to obtain Z'-scores and W-scores, which illustrated the deviation of each individual's functional connections. The additional number ‘6 + 15 + 2’ represents the 6 within-network NM, 15 between-network NM, and the sum of within- and between-network NM. (C) For each subject, a normative probability map, which consists of W-scores, was computed to quantify the deviation from the NM of each brain region. (D and E) FC of different brain networks was quantified to obtain the average value for further statistical analysis. (F) Participants were divided into three age groups and two diagnostic groups to observe differences between the ASD and TD groups over time. (G) FC network W-scores and SRS subscale scores were correlated to identify clinically significant networks.
NM not only yields the predicted FC for each subject but also produces the normative mean and standard deviation from the TD group. These statistical norms were then used to compute the Z'-scores of each functional connection and the W-scores of each brain network for each patient with ASD (Bethlehem et al., Reference Bethlehem, Seidlitz, Romero-Garcia, Trakoshis, Dumas and Lombardo2020), reflecting the degree of deviation of their FC from the TD norm in units of standard deviation. Age groups with fewer than 2 TD individuals were not subjected to statistical analysis. The formulas for calculating Z'-scores and W-scores are shown below:
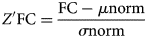
where Z'FC represents the standardized FC value, FC represents the individual's original value, μ norm represents the mean value calculated using the Loess method, and σ norm represents the standard deviation from NM, which makes this measure (i.e. Z') slightly different from the general Z score.
The Z'-score of each individual reflects the difference of their FC relative to the TD norm in terms of standard deviations. Each individual has 160 × 160 Z'-scores, and since Z'-scores are calculated for each functional connection, we can obtain a Z'-score map for each patient with ASD showing the typical deviation of each brain region relative to the TD norm.
Brain network construction
For further comparison of the TD and ASD groups, we divided the cohort into three age groups: 5–11 years, 12–17 years, and 18–30 years, representing children, adolescents, and adults, respectively.
Analyzing the 160 × 160 FC matrix is massively difficult due to the small overall average differences between groups and the low significance of individual FC scores, which are influenced by various random factors such as sleep status and head movement during scanning. To overcome these limitations, we applied the functional template ‘Dosenbach160’ to divide the brain into six functional networks and calculated the mean FC within and between networks for each subject, resulting in a reduced number of features from 25 800 (160 × 160) to 23(6 + $C_6^2$ + 2) (Dosenbach et al., Reference Dosenbach, Nardos, Cohen, Fair, Power, Church and Schlaggar2010), among which the last two scores are summary composite scores for between and within networks. The 23 scores were named W-scores, which were then used to construct 23 NM for further analysis (see in online Supplementary file 4), represented the degree of connectivity abnormality (compared to normative values) within and between each brain network. While the last two scores are called ‘overall-FC-within’ and ‘overall-FC-between’, and the former reflected the total extent of abnormality within all of the individual's networks, the later stood for the opposite. The calculation formula is as follows:

Although similar to Z'-scores, W-scores differ in that the former is derived from every single FC data point, while the latter is derived from aggregated network data.
The formula for W-score calculation involves standardizing the FC values within or between networks, calculating the mean and standard deviation of the raw within- or between-network FC scores, and using these values to compute the W-score. Within-network FC reflects the mutual dependence between different regions within a network, while between-network FC reflects the communication strength between different networks. These connections reveal the organizational principles of brain function and behavior and help us understand the interaction between different neural systems and cognitive functions (Bullmore & Sporns, Reference Bullmore and Sporns2012; Di Martino et al., Reference Di Martino, Yan, Li, Denio, Castellanos, Alaerts and Milham2014).
Normative modeling reliability
To assess the reliability of normative Z'-scores and W-scores, we performed permutations (1000 bootstrap with replacement) with the normative sample and calculated 1000 permutations for each individual and each FC. To evaluate the impact of age-related individual outliers on the global case‒control group differences, we conducted hypothesis testing on the W-scores after removing subject outliers in a networkwise manner (based on truncation at ± 2 s.d.). While we present mainly results related to DMN in this study (further explanation in Discussion section), analyses of other neural networks using the same approach were also calculated for completeness.
Constructing individual-level atypicality scores
One major advantage of NM is the probabilistic prediction of deviations from the norm for all subjects. Specifically, NM provides a multivariate measure of all brain network deviations from the normative range. This can capture FC differences from TD patterns. To better understand the most important brain differences for each subject, we estimated two summary scores (both within- and between-network) to capture their maximum deviation from typical patterns (which may be the most clinically relevant). This can be modeled using extreme value statistics, which postulates that the expected maximum value based on any random variable will converge to an extreme value distribution. Therefore, we estimated the maximum deviation for each subject by averaging the trimmed 1% highest absolute deviations across all functional connections and fitting an extreme value distribution to these deviations, which were then used to map behavioral associations and calculate the outlier rates for different age groups.
Exploratory analysis of behavioral associations
In addition to assessing the impact of differences between ASD and TD populations, we conducted exploratory analysis of the standard model W-scores. We explored whether the W-scores reflected underlying phenotypic features by performing Spearman correlation analyses with the W-scores of each brain network and the phenotypic characteristics of ASD patients, such as ADOS, SRS, SCQ, AQ, and FIQ scores. After addressing multiple comparison corrections, correlation with FDR corrected p < 0.05 was considered significant.
Results
A normative model of typical development over time
As shown in Fig. 3A, the 160 ROIs were divided into six networks comprising the DMN, frontoparietal network (FPN), cingulo-opercular network (CON), sensorimotor network (SMN), occipital network (OCN), and cerebellum network (CEN), which have been commonly used in previous studies (Power et al., Reference Power, Cohen, Nelson, Wig, Barnes, Church and Petersen2011; Wang, Hu, Weng, Chen, & Liu, Reference Wang, Hu, Weng, Chen and Liu2020).
Module partitions and details about normative models across the lifespan. (A) Module partitions. 1DMN, the default mode network; 2FPN, the frontoparietal network; 3CON, the cingulo-opercular network; 4SMN, the sensorimotor network; 5OCN, the occipital network; 6CEN, the cerebellum network; L, left; R, right. The number indicates the corresponding network below. (B) A schematic of NM. First, LOESS regression was used to estimate the FC developmental trajectory for each individual brain region to obtain age-specific means and standard deviations. This enables prediction of the FC value (the darker blue contour line) from the clinical covariates (age) along with measures of predictive confidence (the two lighter blue contour lines). For each one-year age bin, the normative scores were calculated for these means and standard deviations, and the y-value of the dark blue line represents the median. Next, for each ASD individual and each brain network, normalized means and standard deviations were used to calculate the W-score relative to their neurotypical age bin. The red and blue dots represent the values for the ASD group and TD group, respectively. (C) NM across the lifespan. NM of developmental changes in FC across the developmental range in the TD cohort. FC was predicted using a trained NM across the age range of 5–40 years of age. Dark vertices indicate the mean deviation from normative scores of six different networks over five age bins. The specific age bins are illustrated as ‘(26~33)’ above the pixel plot. The names of the networks are listed in Fig. 3. Moreover, the predicted cross-sectional developmental trajectories of FC are shown for three randomly selected networks.
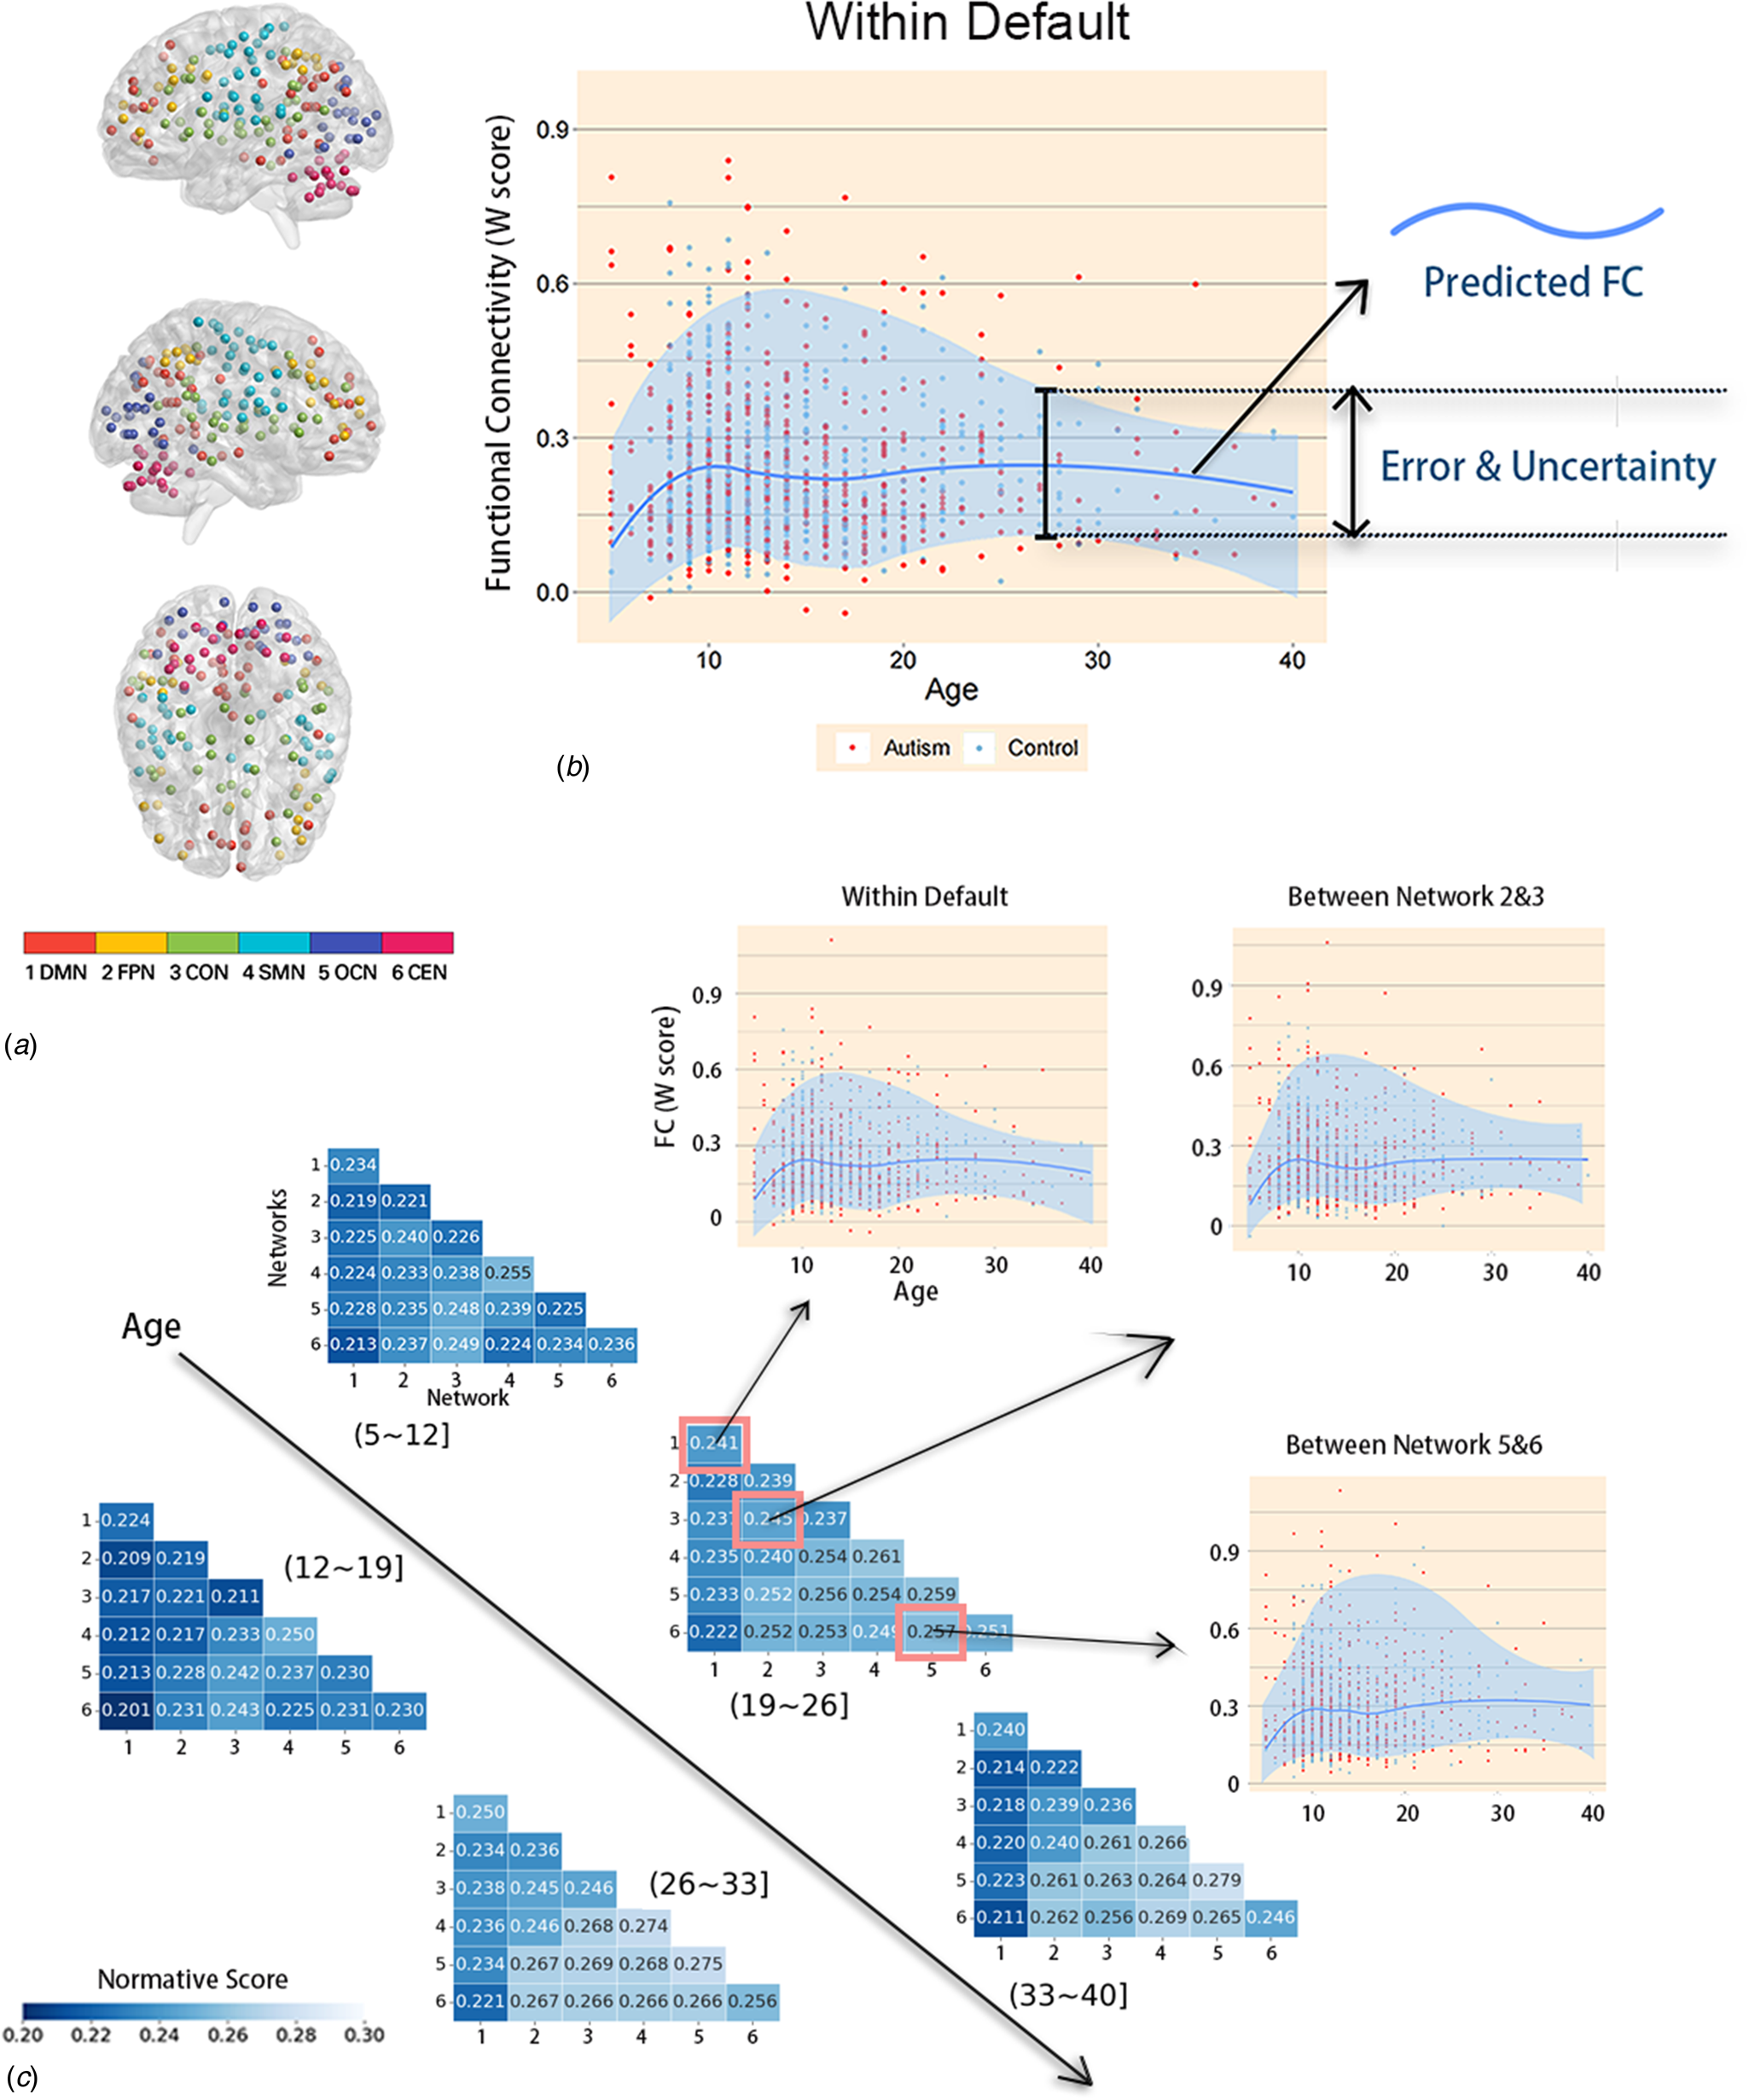
As shown in Fig. 3B, the FC of children (ages 5–12 years) first increased with age and then gradually decreased with age starting in adolescence, as observed in the DMN and frontoparietal network (FPN) in most brain network connections. This is consistent with previous research findings (Supekar et al., Reference Supekar, Uddin, Khouzam, Phillips, Gaillard, Kenworthy and Menon2013). However, the results showed that the FC of individuals with ASD did not significantly differ from that of TD individuals. In this case, there was no significant difference between overall-FC of individuals with ASD and that of TD individuals.
Figure 3C presents the developmental NM of FC derived from the TD cohort. All analyses were conducted on the FC of the 1218 subjects. LOESS regression was used, in which the local width or smoothing kernel of the regression is determined by the model to provide the smallest overall squared error. It was implemented in the R statistical package of the optimization function, using Brent's method for hyperparameter optimization (Brent, Reference Brent1973). To keep the TD and ASD groups consistent, both were divided into the same age groups. For each age group and each brain region, we calculated a normative mean and standard deviation from the TD group. These statistical norms were then used to calculate Z'-scores and W-scores for each individual with ASD and each brain region. Since Z'-scores were utilized for each FC, while W-scores were calculated for each brain functional network. We then obtained both Z'-score maps and W-score maps for each ASD participant, showing the degree of abnormality of each brain region relative to the TD norm.
Functional network partitioning: clinical diagnostic significance
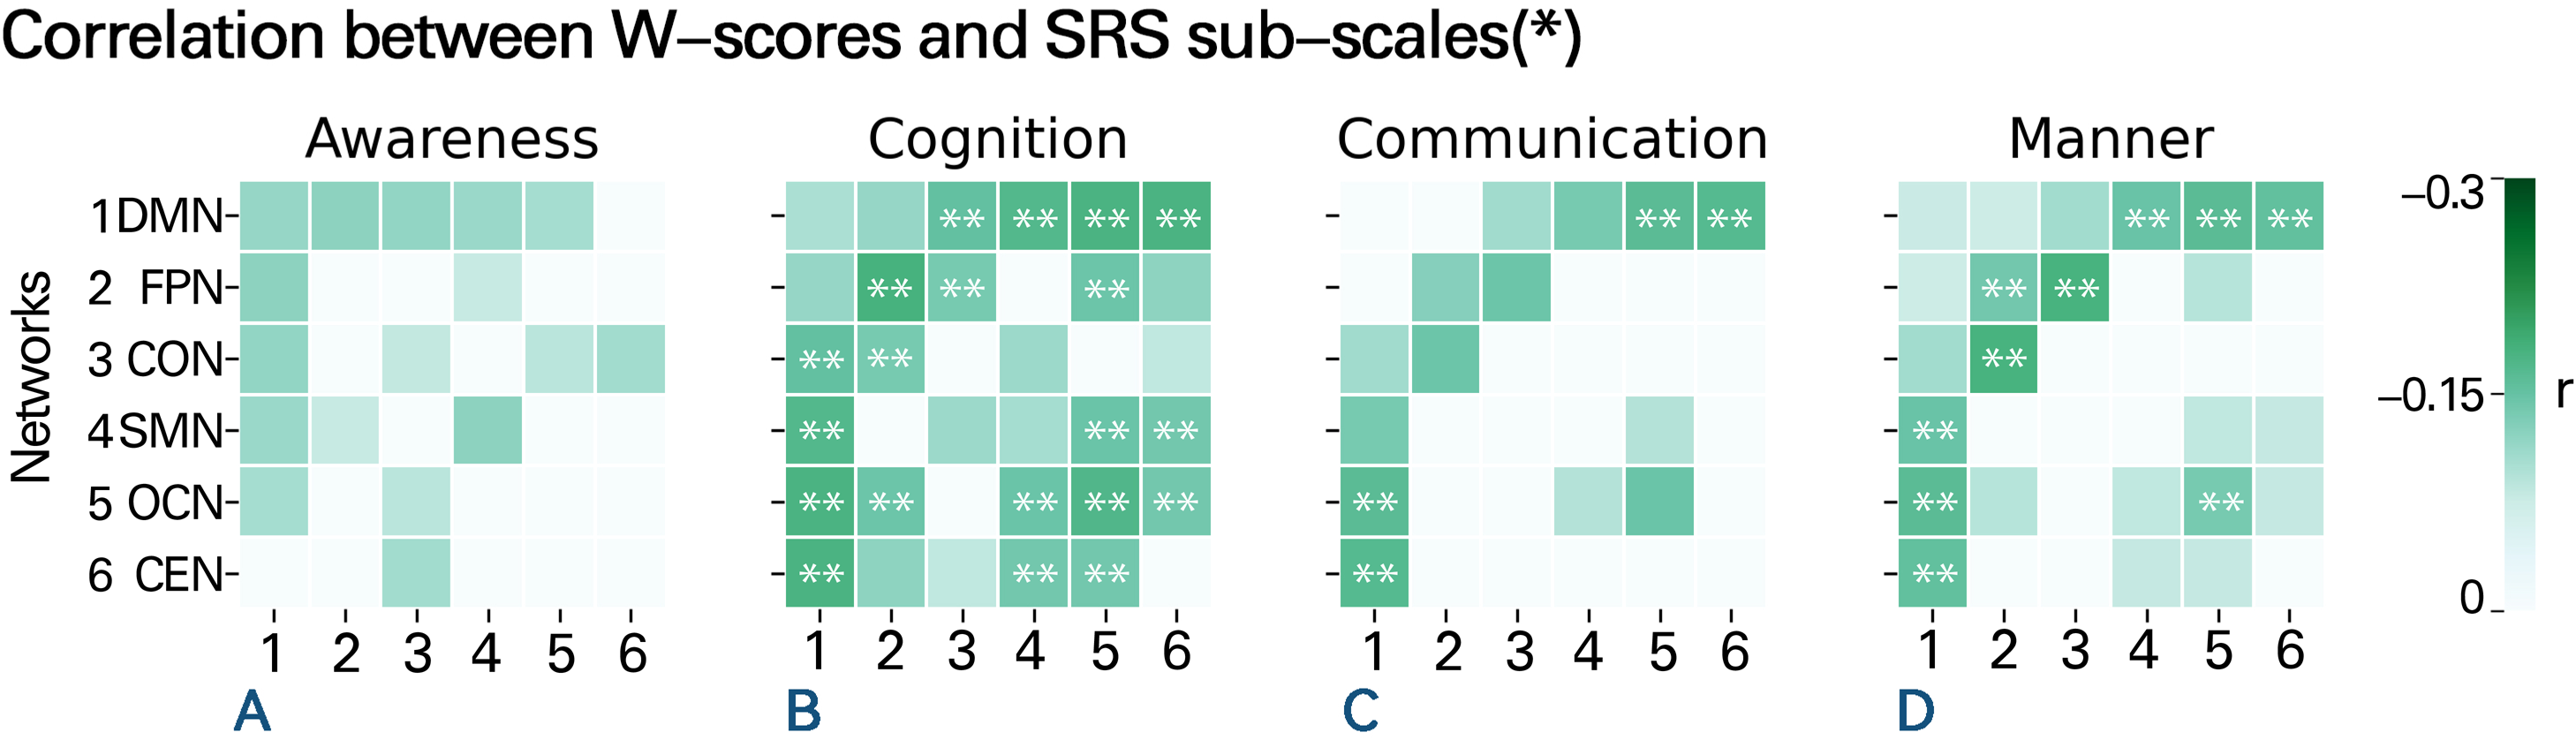
After dividing brain functional network connectivity into two types (within-network and between-networks), we identified clinically relevant networks by analyzing the distribution of network data in ASD patients relative to their questionnaire scores. The W-scores of individuals showed varying degrees of significant correlation with scores on various subscales of the social responsiveness scale (SRS). Notably, the FC of the DMN, FPN, and OCN were particularly correlated with SRS subscale scores (Fig. 4). Within the DMN, FC was significantly negatively correlated with SRS_awareness (r = −0.192, p corrected = 0.028), SRS_cognition (r = −0.101, p corrected = 0.025), and SRS_mannerisms (r = −0.153, p corrected = 0.045) subscale scores. Within the FPN, FC was significantly negatively correlated with SRS_cognition (r = −0.262, p corrected = 0.001), SRS_communication (r = −0.112, pcorrected = 0.021), and SRS_mannerisms (r = −0.183, p corrected = 0.007) subscale scores. Within the OCN, FC was significantly negatively correlated with SRS_cognition (r = −0.243, p corrected = 0.002), SRS_communication (r = −0.145, p corrected = 0.013), and SRS_mannerisms (r = −0.176, p corrected = 0.008) subscale scores (see other relevant values in online Supplementary file 5). The remaining three networks showed weaker correlations with the questionnaire data. Generally, compared to any other network FC, the FC between the DMN and any other network showed a significantly stronger negative correlation with at least three SRS subscale scores. The other network FC that were significantly negatively correlated with at least three SRS subscale scores were the FC between the FPN and CON and the FC between the SMN and OCN. The clinical symptoms reflected by FC within the FPN and OCN were similar.
Correlation between W-scores and scores on SRS subscales. Correlation between W-scores in various brain networks and the scores of the four subscales of the SRS in the ASD group. Each number on the X-axis corresponds one-to-one with the numbers on the Y-axis, representing the six different brain networks. Each colored cell represents a significant correlation, with darker colors indicating stronger correlations. Besides, the presence of ‘**’ marks within certain squares signifies conditions where p < 0.01 after FDR correction, while green squares lacking ‘**’ denote situations where p < 0.05 after FDR correction. Blank squares, on the other hand, represent non-significant correlations. The results show a negative correlation between FC values and SRS scores, indicating that weaker FC is associated with more severe social cognitive and communication deficits. Various networks are shown as numbers on the Y-axis; specific information on these networks is listed above in Fig. 3A.
The TD and ASD groups exhibited distinct developmental trajectories
Another advantage of the NM method is its ability to identify individuals with atypical FC. As ASD patients exhibit brain FC similar to that of TD individuals in the overall sample, we subsequently divided the subjects into age groups and observed changes in the FC of each network in different age groups.
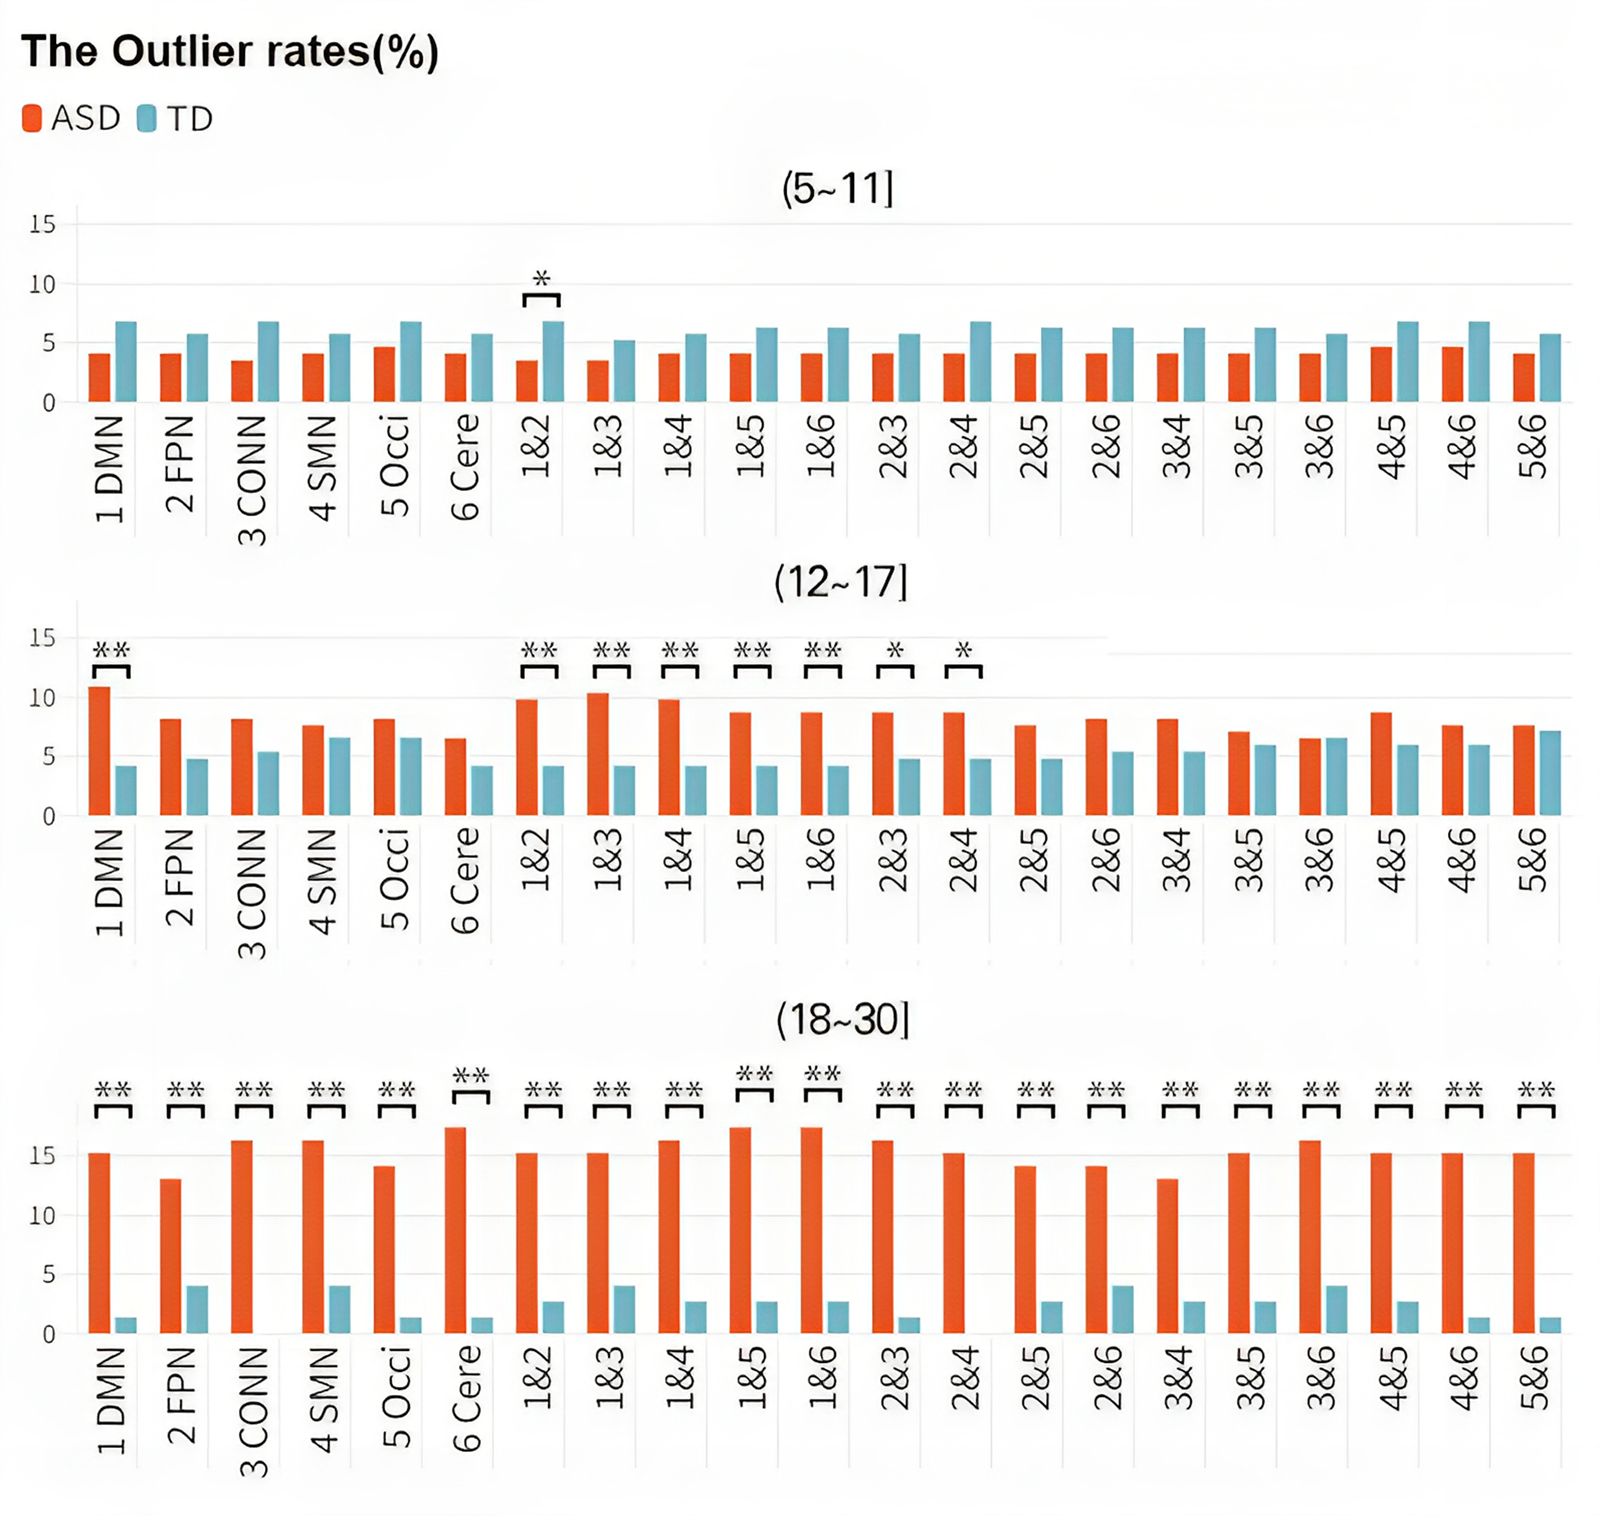
The significant main effect of the group indicated that the outlier rates were greater in the ASD cohort (8.07%) than in the TD cohort (3.75%) [F(11217) = 41.83, p corrected < 0.001]. There was also a significant main effect of Age [F(2, 1217) = 75.611, p corrected < 0.001]. Furthermore, the group × age interaction yielded a significant result [F(2, 1212) = 0.167, p corrected = 0.015]. Consequently, the developmental trends of cohorts with the same disease status differed across different age groups, and the developmental trends of ASD and TD also differed within the same age group. The outlier rate of children with ASD (aged 5–11 years) (4.07%) was slightly lower than that of TD children (6.22%), while the outlier rate of adolescents with ASD (aged 12–17 years) (8.32%) was slightly higher than that of TD adolescents (5.21%). The outlier rate of adults with ASD (aged 18–30 years) (15.42%) was significantly higher than that of TD adults (2.24%) (Fig. 5). In other words, the FC within and between brain networks of the TD group decreased with increasing age, while the corresponding indicators of the ASD group increased rapidly with age.
Discrepancies in the outlier rates among different groups. Changes in the outlier rate over age in different diagnostic cohorts. The X-axis represents different brain networks, and the Y-axis represents outlier rates. The study population was divided into three distinct age groups (children, adolescents, and adults), and each row represents a different age group. Colors distinguish the ASD and TD groups. As age increases, the outlier rate of the TD cohort decreased gradually, while the outlier rate of the ASD group increased significantly.
Discussion
Capturing and utilizing individual variability in ASD patients
In a large and heterogeneous cohort spanning a range of ASD phenotypes, traditional case‒control analyses showed small group-level differences in FC between ASD and TD cohorts. In contrast, our normative modeling approach revealed marked and widespread patterns of atypical brain network organization at the individual level in ASD participants. These patterns were highly individualized, varied across developmental stages, and were related to symptoms, particularly repetitive behaviors. This supports the view that a subset of ASD individuals exhibits developmental trajectories distinct from those of TD individuals, with each ASD individual following a highly individualized trajectory. Methodologically, our study indicates that (1) expanding beyond the case‒control paradigm is necessary to understand the heterogeneous neuroanatomy of ASD; (2) normative modeling provides an alternative conceptual framework to understand the heterogeneous neurobiology of ASD according to deviations from typical developmental patterns; (3) focusing on the ‘average ASD individual’ provides only a partial reflection of the condition. In other words, the case‒control approach focuses on common effects rather than individual variability. Capturing and utilizing this variability at the individual level is the core of precision medicine.
The NM described variations in typical brain development, showing that overall-FC development progresses relatively smoothly and that the overall-FC in ASD patients is not significantly different from that of TD individuals, which is generally consistent with previous neuroimaging studies (Anderson et al., Reference Anderson, Nielsen, Froehlich, DuBray, Druzgal, Cariello and Lainhart2011; Keown et al., Reference Keown, Shih, Nair, Peterson, Mulvey and Müller2013; Ray et al., Reference Ray, Miller, Karalunas, Robertson, Grayson, Cary and Fair2014; Redcay et al., Reference Redcay, Moran, Mavros, Tager-Flusberg, Gabrieli and Whitfield-Gabrieli2013). We observed extensive individual differences among ASD participants, namely, differences in their deviations from the NM, which explains why our classic case‒control analysis detected few significant differences and why some previous large-scale neuroimaging studies could only detect small group differences (Haar, Berman, Behrmann, & Dinstein, Reference Haar, Berman, Behrmann and Dinstein2016; van Rooij et al., Reference van Rooij, Anagnostou, Arango, Auzias, Behrmann, Busatto and Buitelaar2018). The heterogeneity of ASD is widely recognized (Abrahams & Geschwind, Reference Abrahams and Geschwind2008; Ecker, Reference Ecker2019); studies have reported decreases or increases in FC of ASD (Mak-Fan, Taylor, Roberts, & Lerch, Reference Mak-Fan, Taylor, Roberts and Lerch2012), but the sample sizes of these reports are relatively small. There are also reports of normative modeling of CT in ASD cohorts. The results of our large-sample study address the shortcomings of these studies.
Identification of clinically significant networks
We conducted a comprehensive analysis by examining the correlations of W-scores with a wide range of phenotypic information available in the ABIDE dataset. In doing so, we identified some networks that were fundamentally different from those typically detected according to average case‒control differences. These findings suggest that the standardized model is sensitive to signals related to behavioral changes. We found brain networks significantly associated with the SRS scores of the participants. Specifically, the FC within the DMN, FPN, and OCN, as well as the FC between any network and the DMN, were important in diagnosing ASD patients.
The DMN includes a set of brain regions that are more active when an individual is not focused on the outside world, instead, they are activated when an individual engages in internal thoughts or self-referential processing. Several studies have suggested that individuals with ASD exhibit atypical connectivity within the DMN. For example, one study used community structure analyses to explore functional network features of individuals with ASD and found disrupted recruitment and integration in the DMN (Yang et al., Reference Yang, Wang, Zhou, Wang, Chen, Yuan and Dong2023). Another study using dynamic FC analysis reported altered dynamics in several networks, such as the DMN, in patients with ASD (Wang et al., Reference Wang, Wang, Yang, Yuan, Wang, Potenza and Dong2022). These studies suggest that ASD is associated with atypical connectivity within the DMN, highlighting the importance of studying brain FC in ASD research.
On the other hand, the SRS is a tool used to assess the severity of ASD symptoms in individuals. The scale consists of five subscales: social communication, social interaction, social-emotional reciprocity, repetitive behavior, and the last one, interests and attention. Higher scores indicate more severe symptoms. We found a significant negative correlation between the subscale scores and the strength of FC within the abovementioned brain networks, indicating that the higher the scores were, the weaker the FC and the more severe the symptoms were, which is consistent with the impaired social abilities and executive function of ASD patients. These findings indicate that FC is a potential biomarker for assessing ASD clinical presentations and diagnosis, offering valuable insights into the neural basis of ASD and ultimately informing the development of more targeted interventions for individuals with ASD. However, the SRS is usually only administered to individuals who have already been diagnosed with ASD, which may introduce bias in general inferences about this brain-behavior relationship. More research is needed to confirm this conclusion.
The intergroup differences associated with age
Our results highlight the potential importance of examining network-level changes in brain connectivity across the lifespan in individuals with ASD and suggest that such changes may be a valuable biomarker for tracking disease progression and treatment response. We used the outlier rate as a metric reflecting the likelihood of observing atypical individuals in each age group. We found that the outlier rate of the ASD group increased significantly after adulthood, while the outlier rate of the ASD group was slightly lower than that of the TD group during childhood. Moreover, the outlier rate of the ASD group between the ages of 18 and 30 was significantly higher than that of the TD group. In statistical analysis, subjects with a W-score more than two standard deviations from the normative FC value calculated by the model were considered outliers, while typical individuals were used as a comparison. The outlier rate represents the proportion of outliers out of the total number of individuals in each age group. We added a semitransparent block to the figure to indicate the inevitable error and uncertainty. Meanwhile, the numerical dots in the area between the top blue line and the bottom blue line represents the proportion of typical individuals, whose W-scores are within 2SD higher/lower than the normative value. In this case, those points that are excluded from the typical group are statistical outliers. The outlier rates reflect the generality of the cases. It is important to emphasize the homogeneity of these cases because, as mentioned earlier, it is likely that these outliers are the ones driving most of the observed small differences between the patient and control groups. The differences found in the study suggest that it is challenging to detect genuine differences in network features during childhood. Several studies have reported similar age-related changes in brain network properties in ASD. For example, Supekar et al. (Reference Supekar, Uddin, Khouzam, Phillips, Gaillard, Kenworthy and Menon2013) reported that the atypical FC patterns in individuals with ASD become more pronounced with age. Another study by Lynch et al. (Reference Lynch, Uddin, Supekar, Khouzam, Phillips and Menon2013) reported that the FC patterns in the ASD group increasingly differed from those in the TD group with age.
We also found that FC of the DMN distinguished ASD and TD groups to a greater extent than the FC of other networks, especially FC within the DMN, between the DMN and FPN, between the DMN and CON, and between the DMN and SMN. The FPN is a network involved in higher cognitive functions such as attention, executive control, and working memory Andthe CON is a network involved in cognitive and emotional processing, such as emotion regulation, decision-making, and executive control, including the cingulate gyrus and opercular networks. The SMN is a network involved in processes such as movement, sensation, and perception, including both the central pre- and post-central gyri. The OCN is a network involved in visual processing, including the visual cortex (which will be mentioned later).
This difference is likely because these connections play a crucial role in supporting various cognitive functions, such as social cognition, attention, and sensory processing, which are known to be impaired in individuals with ASD (Just, Keller, Malave, Kana, & Varma, Reference Just, Keller, Malave, Kana and Varma2012; Kana, Reference Kana2006; Uddin, Supekar, & Menon, Reference Uddin, Supekar and Menon2013). In particular, the DMN is involved in self-referential thinking, mentalizing, and social cognition, which are altered in individuals with ASD (Kennedy & Courchesne, Reference Kennedy and Courchesne2008; Schurz, Radua, Aichhorn, Richlan, & Perner, Reference Schurz, Radua, Aichhorn, Richlan and Perner2014). Several studies have reported similar findings regarding the altered FC between the DMN and other brain networks in individuals with ASD. For example, Kennedy and Courchesne (Reference Kennedy and Courchesne2008) found that the DMN exhibited hyperconnectivity with other brain networks in individuals with ASD. In addition, Di Martino et al. (Reference Di Martino, Yan, Li, Denio, Castellanos, Alaerts and Milham2014) reported that the DMN and SMN were more strongly connected in individuals with ASD than in TD individuals. Another study by Rudie et al. (Reference Rudie, Shehzad, Hernandez, Colich, Bookheimer, Iacoboni and Dapretto2012) found that individuals with ASD had decreased inverse correlations between the activity of the DMN and that of other networks.
Overall, these findings suggest that altered connectivity within the DMN and between the DMN and other networks may contribute to the cognitive and social impairments observed in individuals with ASD. Therefore, assessing the FC within and between these networks may be a promising approach for developing biomarkers and therapeutic targets for ASD.
The summary values reflect brain information processing
To better understand the most important brain differences of each participant, we estimated not only two but 21 + 2 summary scores for each participant, including 6 values representing the internal FC of each network, 15 values representing the FC between networks, and 2 total values. These values have different meanings.
The interpretations of within-network connectivity vary slightly among studies. For example, Power et al. (Reference Power, Cohen, Nelson, Wig, Barnes, Church and Petersen2011) suggested that strongly connected network modules within the brain may reflect a function or process that is relatively more centralized or localized than other modules. Meunier, Lambiotte, and Bullmore (Reference Meunier, Lambiotte and Bullmore2010), on the other hand, argue that increased within-network connections may indicate tighter information integration or coordination.
Regarding the FC between networks, research has found that brain regions with strong connectivity have similar functional features and form specific brain networks. These brain networks are activated in different cognitive tasks, and there are interactions and regulatory relationships between different brain networks, enabling efficient information processing and integration capabilities when humans perform cognitive tasks. The FC values between networks represent the flexibility of the brain when performing different tasks and the degree of integration of the entire brain.
Potential anatomical significance of FC
To interpret the FC abnormalities through recent anatomical discoveries offers a novel perspective. Astrocytes, highly abundant within the central nervous system and recognized for their star-shaped morphology, are key players in supporting and regulating neuronal functions. This includes maintaining neuronal metabolism and modulating neurotransmission. Recent studies in the context of depression have highlighted astrocytic dysfunction as a significant contributor to FC disruptions (Liu et al., Reference Liu, Mo, Wang, An, Zhang, Zhang and Cao2022). Dysregulated calcium signaling in astrocytes can lead to excessive glutamate release, disturbing interneuronal communication and resulting in FC anomalies. We extend this understanding to propose that FC irregularities observed within the DMN of individuals with ASD might also be influenced by astrocytic dysfunction. These anatomical insights could shed light on the observed FC anomalies in the DMN of ASD.
Limitations and future directions
There are some limitations to consider in this study. First, the current data are cross-sectional, and standardized age-modeling methods cannot make individual-level judgments about trajectories. Longitudinal data would extend this standardized modeling approach. Second, to remove multisite effect, researchers suggested that the hierarchical Bayesian approach may be a better alternative to ComBat because it avoids the exclusion of meaningful variance correlated with site and can improve the accuracy of normative modeling (Bayer et al., Reference Bayer, Dinga, Kia, Kottaram, Wolfers, Lv and Marquand2022). We chose this model due to its advantages in terms of computational efficiency, automatic parameter learning, and the mitigation of issues related to local optima and overfitting, subsequent studies should try to apply different models to remove site effects in normative modeling studies. Third, the calculation of W-scores was based on two mean calculations from the raw data, which inevitably led to some loss of precision; we hope to solve this problem in the future. Fourth, although this study has a large sample size, it does not encompass the very early developmental period or the very late adulthood period; it also has few female participants, with a male-to-female ratio of approximately 5:1. Conclusions regarding female participants lack corresponding evidence, and additional female data should be collected in the future to study sex differences in ASD. In addition, there are many different normalization modeling methods, each with its own advantages and disadvantages (Marquand et al., Reference Marquand, Kia, Zabihi, Wolfers, Buitelaar and Beckmann2019). We chose to use the LOESS estimation method because it is computationally efficient and the resulting W-scores are easy to interpret. However, because it is based on an estimate of the standard deviation of the normative sample, it is potentially sensitive to small sample sizes in specific age ranges (e.g. if a particular age range has only four data points, there may be an unreliable s.d.). Therefore, we excluded age ranges (one year) containing less than or equal to two subjects. Finally, although head motion within scanners is a well-known confounding factor in resting-state studies, recent studies have shown that the same motion can also affect structural image quality and surface reconstruction (Power, Barnes, Snyder, Schlaggar, & Petersen, Reference Power, Barnes, Snyder, Schlaggar and Petersen2012; Van Dijk, Sabuncu, & Buckner, Reference Van Dijk, Sabuncu and Buckner2012). Therefore, given its impact on traditional analysis methods, we strongly encourage future research to consider motion as an important confounding factor.
Supplementary material
The supplementary material for this article can be found at https://doi.org/10.1017/S0033291724000138.
Data availability statement
The data stored at our lab-based network attachment system: http://QuickConnect.cn/others. ID:guests; PIN dong@123.COM. All people who interested in it can download directly.
Acknowledgements
This research was supported by the Innovation Team Program in Philosophy and Social Science of Yunnan Province(Research on psychological adaptation and development of China’s ethnic minority students in border areas), and TheTechnology Talent and Platform Plan of Yunnan Province Science and Technology Department (202405AC350075). The funding agencies did not contribute to the experimental design or conclusions, and the views presented in the manuscript are those of the authors and may not reflect those of the funding agencies.
Author contributions
Anhang Jiang analyzed the data, counterbalanced the multi-site, prepared the figures, tables, and wrote the paper. Xuefeng Ma, Bo Yang and Shuang Li contributed to research ideas and figure improvement; Lingxiao Wang and Shizhen Wang contributed to data analyses techniques; Guang-Heng Dong designed this research and edited the manuscript. All authors contributed to and approved the final manuscript.
Funding statement
The authors report that they have no financial conflicts of interest with respect to the content of this manuscript.
Competing interests
None.
Ethical standards
The authors assert that all procedures contributing to this work comply with the ethical standards of the relevant national and institutional committees on human experimentation and with the Helsinki Declaration of 1975, as revised in 2008.



