

In the eyes of many, the technocratic governments appointed in several countries during the eurozone crisis became the embodiment of the EU's democratic deficit, and of a tension between national sovereignty and supranational economic policy demands. However, despite the conceptual relevance of technocratic governments, their heightened salience during the eurozone economic crisis, and the key place they occupy in the contemporary debate about the EU democratic deficit, significant gaps remain in the literature and in our understanding of them. First, while the conditions leading to the appointment of technocratic governments have been widely investigated, we know much less about the impact that technocratic interludes have on people's satisfaction with democracy and on their trust in democratic representative institutions. Second, and more generally, the debate on technocracy largely lacks empirical foundations in citizens’ attitudes. The aim of this article is to contribute to this as-yet relatively unexplored territory by mapping empirically the effect of one prominent case of technocratic appointment on citizens’ attitudes towards institutions as well as on their satisfaction with democracy. We formulate four hypotheses and test them empirically in the context of the 2011 Italian economic and political crisis which led to the demise of the fourth Berlusconi government and its replacement by a fully technocratic cabinet. Our article is one of very few contributions investigating this subject empirically, and it innovates by employing a natural experiment design. We show that the appointment of the Monti government – despite being unelected and apolitical – was initially associated with an increase (rather than decrease) in people's satisfaction with the functioning of Italian democracy. We argue that this apparently puzzling result can be explained by taking into account a trade-off between perceived input and output legitimacy, which characterizes the technocratic form of government. While unelected, technocratic executives offer a powerful promise to effectively resolve the crises that typically trigger their appointment, thanks to the signalling effect of their impartiality and expertise. Consistent with this, we find the appointment of the Monti government to be associated with a marked improvement in Italians’ expectations about the future state of the economy, without a deterioration in perceived input participation. These results suggest that citizens’ attitudes towards technocracy are more complex than often assumed, and show the importance of carrying out more empirical research on the subject of technocracy and perceived technocratic legitimacy.
Technocracy, trust and democracy
During the eurozone crisis, technocratic governments have been appointed in several countries.Footnote 1 These episodes cast a new light on the long-lived EU democratic deficit debate, traditionally focused on the legitimacy of EU-level policy. The subject of technocracy has been hitherto investigated mainly for its theoretical and conceptual relevance. A sizeable literature looks at the conditions that lead to the emergence of this form of government – concluding that it tends to occur during political or economic crises (Domínguez Reference Domínguez1997; Hallerberg and Wehner Reference Hallerberg and Wehner2013, Reference Hallerberg and Wehner2018; Neto and Strøm Reference Neto and Strøm2006; Pasquino and Valbruzzi Reference Pasquino and Valbruzzi2012; Pastorella and Wratil Reference Pastorella and Wratil2017). Others have looked at the technocratic governments appointed during the eurozone crisis as a symptom that national representative democracy has been weakened for the sake of preserving the single currency and economic integration (Matthijs Reference Matthijs2014; Sánchez-Cuenca Reference Sánchez-Cuenca2017). In search of an appropriate description of what countries in the so-called eurozone ‘South’ went through, scholars have resorted to concepts such as ‘democracy without choice’ (Alonso Reference Alonso2014), ‘democratic void’ (Mair Reference Mair2013), or even ‘authoritarian liberalism’ (Streeck Reference Streeck2015). Some have been looking into the erosion of trust in EU countries’ domestic democratic institutions, showing that economic factors matter (Armingeon and Guthmann Reference Armingeon and Guthmann2014; Foster and Frieden Reference Foster and Frieden2017; Norris Reference Norris2011). Others have been addressing the relation between technocracy and populism as two organizing poles of politics in contemporary Western democracies (Bickerton and Invernizzi Accetti Reference Bickerton and Invernizzi Accetti2015; Caramani Reference Caramani2017; Leonard Reference Leonard2011; Schmidt Reference Schmidt2006).
Hypotheses
Following Duncan McDonnell and Marco Valbruzzi (Reference McDonnell and Valbruzzi2014), the ‘ideal type’ technocratic government is one where: (1) all major governmental decisions are not made by elected party officials; (2) policy is not decided within parties which then act cohesively to enact it; and (3) the highest officials (ministers, prime ministers) are not recruited through party. An ideal type unelected technocratic government thus operates in the context of a system that remains democratic overall, but it is largely immune to the constraints that typically act on elected officials within an environment of democratic accountability. In fact, technocracy and democracy tend to be seen as incompatible in the literature (Fischer Reference Fischer1990; Shapiro Reference Shapiro2005), and especially so in the context of the eurozone crisis (Matthijs Reference Matthijs2017). The most common lines of criticism to technocracy are well exposed by Giulia Pastorella (Reference Pastorella2016), who concludes that while technocratic governments are not per se a threat to democracy, they meet the standards of party democracy only because those standards have been eroded over time. Technocratic governments are often portrayed as illegitimate and unaccountable (Skelton Reference Skelton2011) due to their ability to bypass regular deliberation (Wolkenstein Reference Wolkenstein2015) and because they constitute a break in the chain of delegation on which representative democracy relies (Neto and Strøm Reference Neto and Strøm2006; Riker Reference Riker1982). However, a few scholars have argued otherwise. Michael Schudson (Reference Schudson2006), for example, posits that technocracy can create positive externalities for democracy. Philip Pettit (Reference Pettit2004) claims that depoliticization may actually be instrumental to democratic deliberation, and Pierre Rosanvallon (Reference Rosanvallon2011) suggests that the impartiality typical of technocratic governments makes them legitimate. Building on these alternative views, our first hypothesis (H1) states that:
Hypothesis 1:
The appointment of an unelected technocratic government may increase citizens’ satisfaction with the functioning of democracy.
H1 implies that we can conceive of scenarios where the appointment of unelected technocrats to executive office increases (counter-intuitively) citizens’ satisfaction with the functioning of democracy. Why would that be the case? We think the explanation is to be found in a trade-off that the technocratic form of government establishes between input and output legitimacy (Schmidt Reference Schmidt2011, Reference Schmidt2013). In principle, one would expect any political change that increases a government's output effectiveness to trigger an improvement in its perceived legitimacy, and changes that reduce citizens’ input participation to produce the opposite effect. The appointment of a technocratic government – which, as the literature abundantly shows, tends to occur in crises – is an especially interesting phenomenon because it triggers both types of change at the same time.
In a crisis, the appointment of unelected technocrats trades off a promise of increased output effectiveness (through the signalling of non-partisan expertise) against an immediately reduced input participation. Therefore, we would expect perceived input legitimacy to decrease, and perceived output legitimacy to increase. The net effect is uncertain a priori, and it will depend on which of the two opposite effects dominates. If the output effect dominates, then the appointment of an unelected technocratic government may well occur without any deterioration in citizens’ satisfaction with the functioning of democracy. If perceived input legitimacy is low to start with – such as in the case of Italy – the output effect may more easily dominate, and satisfaction with democracy may increase. Let us formulate these claims in a way that we can test empirically. On the input side, we expect the appointment of a technocratic government to have a negative effect on perceived input legitimacy, because by sidestepping elections it reduces the say that voters have within the process of democratic accountability:
Hypothesis 2.1:
The appointment of an unelected technocratic government is associated with worsened assessment of perceived input participation.
On the output side, we expect people to see a technocratic government of impartial experts as better placed to deliver a solution to the crisis that triggered its appointment, thus improving perceived output legitimacy:
Hypothesis 2.2:
The appointment of a technocratic government is associated with improved expectations of crisis resolution.
If the crisis is of an economic nature, we therefore expect to observe an improvement in citizens’ expectations regarding the future economic situation, following the appointment.
A second aspect that we want to investigate is the effect of appointing a technocratic government on citizens’ trust in the government on one hand, and in representative institutions on the other. Cultural and political factors are obvious candidates to explain citizens’ trust in government (Inglehart and Norris Reference Inglehart and Norris2016; Levi and Stoker Reference Levi and Stoker2000; Norris Reference Norris and Norris1999), but research has also highlighted how trust is affected by objective economic factors (Armingeon and Ceka Reference Armingeon and Ceka2013; Armingeon and Guthmann Reference Armingeon and Guthmann2014; Foster and Frieden Reference Foster and Frieden2017; Guiso et al. Reference Guiso, Sapienza and Zingales2016) and by perceived economic or political performance (Williams Reference Williams1985). This points to an ‘output’ dimension of trust, which is especially relevant for the technocratic mode of governance. Eri Bertsou and Giulia Pastorella (Reference Bertsou and Pastorella2016) find that citizens are more inclined to support the technocratic mode of governance when they have weaker democratic attitudes and are distrustful of representative institutions. Their work is limited to the pre-crisis period and looks at trust as an independent variable. We believe further insights can be gained by investigating this question from the opposite angle. Consistent with our discussion in the previous section, we would expect the appointment of technocrats to be associated with an increase in people's trust in the government – which would provide robustness to our claim in H2.2.
The appointment of expert technocrats to executive office during economic crises could serve as a signal to voters that the normal political game is temporarily suspended in favour of a government of experts who – by means of their technical skills and political independence – can be in a better position to resolve the crisis. If this signal works, we would expect trust to increase:
Hypothesis 3:
The appointment of a technocratic government increases citizens’ trust in domestic institutions through positive expectations of crisis resolution (consistent with H2.1).
Empirical validation of these hypotheses would suggest that the appointment of unelected technocratic executives could have counter-intuitive effects on citizens’ attitudes towards domestic institutions as well as on their satisfaction with the functioning of democracy. This does not imply that the effects will be permanent. Output legitimacy ultimately derives from the legitimacy of the outcomes – that is, if the policy measures enacted are effective in addressing the issues facing citizens. Because technocratic governments rely on the signalling effect of their expertise, their perceived legitimacy is linked to the actual output they are able to deliver. Failure – real or perceived – to resolve the crisis that triggered their appointment could cost them dearly in the longer term.
A natural experiment: the 2011 Italian crisis
We investigate the validity of our hypotheses in the context of the Italian economic and political crisis of November 2011, which resulted in the collapse of the fourth Berlusconi government and its replacement with a fully technocratic cabinet led by Mario Monti, economics professor and former European Commissioner.Footnote 2 The crisis was precipitated by the intensification of market pressure on Italy during the summer of 2011 and preceded by a period of boiling political tensions. Disagreement between Prime Minister Berlusconi and his long-time ally Gianfranco Fini degenerated into an outright split within the majority. The judicial investigations involving the prime minister uncovered a sex scandal, which inflicted a serious blow to the credibility of the Italian government both at home and abroad. In the 2011 local elections, the party headed by Berlusconi (People of Freedom, POF) underwent a historic defeat in the stronghold of Milan, where the candidate of the centre left prevailed. The defeat made the Northern League – historically an ally of the POF – uncomfortable with the alliance.
These political events formed the background to the negotiation of the annual budget law, which became a cause of disagreement within the majority. Finance Minister Giulio Tremonti was in favour of austerity, but the dismal result in the regional elections made this stance unappealing to the rest of the coalition, and the budget presented in June 2011 showed signs of a political compromise in favour of delaying fiscal consolidation. The budget failed to reassure the markets, and during July the spread on Italian 10-year government bonds reached levels unseen since 1999. On 15 July both houses of parliament approved an austerity package, but discontent was growing within the POF and market pressure did not abate.Footnote 3 In August, after the spread had reached 390 basis points, the Italian government received a letter from the European Central Bank (ECB), asking Italy to ‘urgently underpin the standing of its sovereign signature and its commitment to fiscal sustainability and structural reforms’.Footnote 4 The government approved an additional austerity package worth EUR 45.5 bn (see Sensini Reference Sensini2011), and the ECB started buying Spanish and Italian government bonds on the secondary market. By the end of August, as the ECB's purchases had succeeded in temporarily lowering bond yields, Berlusconi announced a softening revision to the emergency austerity package (see Atkins et al. Reference Atkins, Sanderson and Segreti2011).
This backtrack on fiscal consolidation created confusion in the markets and, at the urging of the president of the republic, the emergency package was again reinforced in September. This notwithstanding, the rating agency Standard & Poor's downgraded Italian debt, stating that the ‘Italian government's tentative policy response to recent market pressures suggest[ed] continuing future political uncertainty about the means of addressing Italy's economic challenges’.Footnote 5 In November, the crisis precipitated after the Greek government announced its intention to call a referendum on the austerity measures requested by its creditors. This triggered a generalized increase in yields on the government debt of weaker countries, and the spread on Italian debt reached 441 basis points. On 4 November, at the G-20 Summit in Cannes, Italy came under pressure to accept EU/International Monetary Fund (IMF) surveillance (Wintour and Elliott Reference Wintour and Elliott2011; see Benvenuti Reference Benvenuti2017). Despite claiming that he would remain in power due to the absence of eminent public figures ‘able to represent the interests of the country internationally’, Berlusconi was under pressure to resign (Benvenuti Reference Benvenuti2017).
The political crisis reached its climax on 8 November, when the government was outvoted in parliament.Footnote 6 On the same evening, the prime minister announced his intention to resign once parliament approved the budget law. On 12 November Berlusconi resigned, and one day later the president of the republic conferred the task of forming a new government on Mario Monti. On 19 November Monti announced the composition of his fully technocratic cabinet (see Marangoni Reference Marangoni2012), which remained in charge until December 2012 – when the government lost support in parliament. New elections were held in February 2013. Monti, after lengthy hesitation, decided to run and was heavily defeated.
The case of the Monti government constitutes an especially good testbed to study the effects of technocratic appointments. Not only it was a full technocratic government, but in comparison to the other such cases identified by McDonnell and Valbruzzi (Reference McDonnell and Valbruzzi2014) it is the one that most closely matches the ‘ideal type’ definition given above. No major governmental decisions were made by elected party officials, policy was not decided within parties, and the highest officials were not recruited through parties. This differentiates the Monti government from, for example, the Papademos government which came to power in Greece at about the same time. While Monti's cabinet was entirely composed of non-partisan technocrats with no previous experience in politics, Lucas Papademos's cabinet had only three such members and the others were politically affiliated. The technocratic character of Papademos's cabinet was diluted by the fact that most members had served in the previous Papandreou government. From a conceptual standpoint, the Italian case allows us to investigate citizens’ attitudes towards technocracy in a paradigmatic setting.
Research design
We exploit the 2011 Italian crisis as a natural experiment. Experimental methods have increased in popularity in both political science and economics, due to their capacity to better isolate causal effects.Footnote 7 Our research design belongs specifically to the class that Jordi Muñoz et al. (Reference Muñoz, Falco-Gimeno and Hernandez2019) label unexpected events during survey designs (UESDs). UESDs exploit the occurrence of unforeseen events during the fieldwork of opinion surveys, to gauge causal effects. In a UESD, the sample is divided into a treatment and a control group by an event occurring at time t e. Respondents interviewed before are the control group (T i = 0), while respondents interviewed after are the treatment group (T i = 1). Operationally, we can construct a treatment dummy as follows:
 $$T_i = \left\{ {\matrix{ {0\; \; \; \; \; \; \; \; \; if\; \; \; \; \; t_i \lt t_e} \cr {} \cr {1\; \; \; \; \; \; \; \; \; if\; \; \; \; \; t_i \gt t_e} \cr}} \right.$$
where t i is the time at which individual i is interviewed. The quantity of interest is the average treatment effect (ATE):
 $$ATE = [E\lpar {Y_i\lpar 1 \rpar {\rm \vert} T_i = 1} \rpar -E(Y_i\lpar 0 \rpar \vert T_i = 1)]$$
This cannot be directly computed, because we never observe the same individuals in both states of the world. Under specific assumptions, however, we can estimate the ATE by comparing mean outcomes of treatment and control groups:
 $$\lsqb {\; \overline {Y\lpar 1 \rpar } -\overline {Y\lpar 0 \rpar } \;} \rsqb \; \mathop \to \limits^p \; [E\lpar {Y_i\lpar 1 \rpar {\rm \vert} T_i = 1} \rpar -E(Y_i\lpar 0 \rpar \vert T_i = 1)] = ATE$$
Following Thad Dunning (Reference Dunning2012) and Muñoz et al. (Reference Muñoz, Falco-Gimeno and Hernandez2019), the validity of UESDs for estimating ATEs hinges on two assumptions, which we will discuss in the next sections.Footnote 8
Excludability
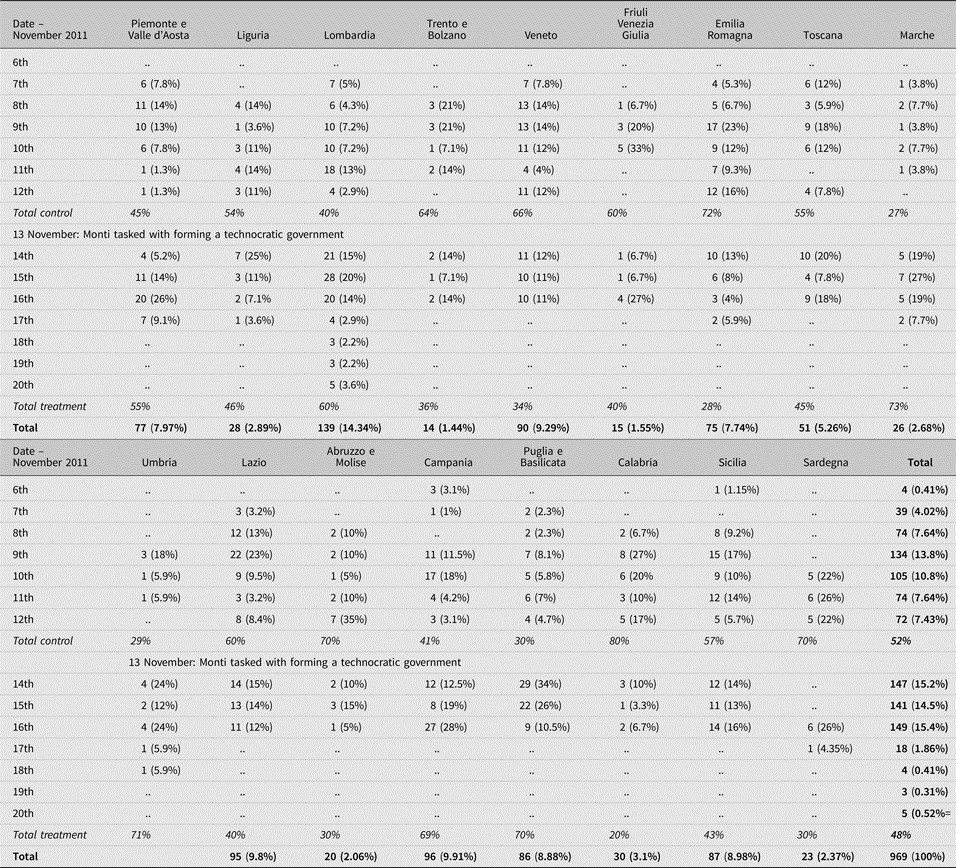
We use a cross-section wave of the Eurobarometer survey data that were collected in Italy during the days of the November 2011 crisis.Footnote 9 The survey includes a variable associating to each individual the exact date when their interview took place. The interview window was 6–20 November 2011, thus including the day when Monti was assigned the task of forming a government (13 November). We exploit the occurrence of this unexpected event during the fieldwork of the survey, to estimate the causal effect that the appointment of a technocratic government had on trust and satisfaction with democracy in Italy. In our design, the ‘treatment’ is the conferral of the task to form a government to Mario Monti. This event exogenously splits the sample into a control group (respondents interviewed before 13 November) and a treatment group (interviewed after). The daily distribution of people interviewed each day is shown in Table A1 in the Appendix: 52% of our sample was interviewed before, 48% after the event.Footnote 10
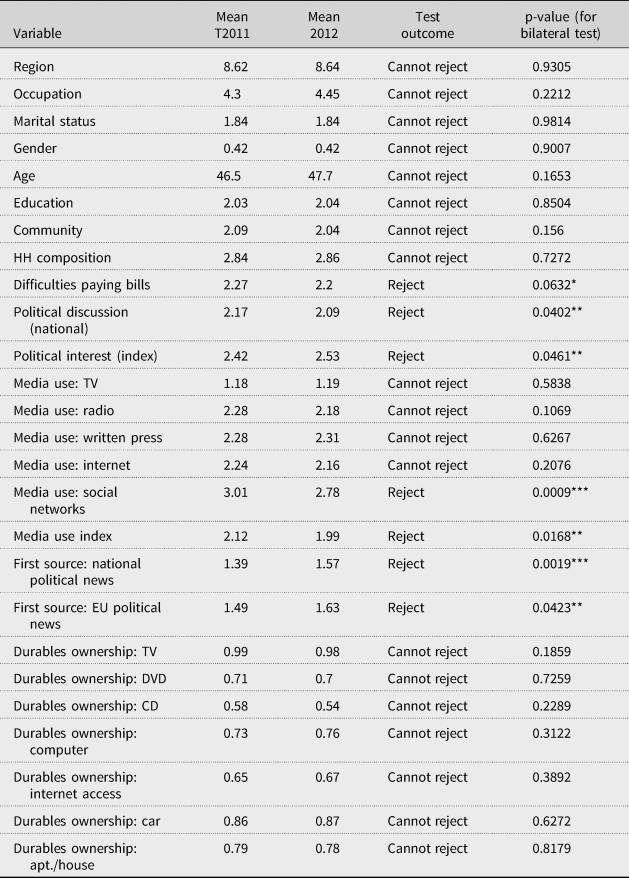
Excludability requires that any difference between respondents interviewed before and after the event is the sole consequence of the event. From an operational standpoint, this means that assignment to the treatment and control groups should be ‘as-if’ random. To test for the validity of this assumption, we ran balance tests for a variety of respondents’ features, across the two groups. The variables considered include location, demographic factors, socioeconomic features, as well as attitudinal aspects and proxy of economic status such as ownership of various durable goods. All these variables are coded numerically so we can statistically test whether the mean value of these characteristics is the same for respondents in the treatment and control groups.Footnote 11 Our results (Table 1) show that we cannot reject the null hypothesis of equal means in any of the tests we ran except one (ownership of a DVD player, which is irrelevant in the context of our research question). This strongly suggests that the treatment and control groups are statistically equivalent, except for the dates of interview, and respondents can indeed be considered ‘as if’ they had been randomly assigned to the group to which they belong.
Balance Tests

A potential threat to excludability may come from violation of the non-interference condition, which requires treatment status for one unit to be uncorrelated with the outcome for other units. This assumption is very plausible in UESDs (Muñoz et al. Reference Muñoz, Falco-Gimeno and Hernandez2019). In our framework more specifically, all people interviewed after the announcement that Mario Monti had been tasked with forming a government had very likely been exposed to this news – which received immediate and major media coverage – whereas all people interviewed before the announcement had obviously not. One possible counter-argument is that respondents interviewed before the announcement could perhaps already foresee that a technocratic government would be appointed in the near future. We believe that this argument does not invalidate our design, for three reasons. First, while there had been rumours in the summer of a possible changeover involving Monti, technocratic governments are a rare occurrence – even in Italy, which has had more technocratic governments than most countries in Western Europe. The Italian Republic has been ruled by 65 governments in its 73 years of life, but political crises typically result in cabinet reshuffles, and before 2011 there had been only one case of a fully technocratic government, in 1994.Footnote 12 Thus there is no reason to believe that before the announcement on 13 November, people would necessarily anticipate a technocratic government as the natural outcome of one of many political crises.
Second, while parallels were drawn in 2011 with the 1994 experience, there was a great deal of uncertainty as to whether a technocratic government was feasible in 2011. Until the very end, Prime Minister Berlusconi maintained that he could still command a parliamentary majority enabling him to govern (Benvenuti Reference Benvenuti2017). The former centre-left finance minister, Visco, reportedly said to the Financial Times that ‘the Monti solution would be excellent’, but ‘to have a Monti government, this one has to fail – and there's no one to make it fail’. Unlike 1994, when it had pulled the plug on the government, in 2011 the Northern League was weakened by internal power struggles and seemed to have little interest in bringing Berlusconi down. Despite tensions, the Northern League eventually supported the government during a confidence vote as late as the end of October 2011 (see Corriere della Sera 2011b). Most importantly, Monti himself had expressed scepticism during the summer about the idea that he could head a technocratic government.Footnote 13 Overall, we believe that the risk of respondents in the control group anticipating a technocratic government before 13 November is low. Even if there had been some anticipation, however, this would make it theoretically less likely that we would detect a difference in outcomes after the announcement, so it would actually strengthen – rather than weaken – our findings, if we found any statistically significant effect.
Ignorability
Ignorability requires that respondents’ treatment status be independent of their potential outcome.Footnote 14 In practice, this means that all individuals should have the same probability of being interviewed at any time during fieldwork. This is not always the case when surveys are conducted in person, as the Eurobarometer is. Table A1 reports the daily geographical distribution of interviews for our sample. Ideally, we would like to observe a 50–50 split of people interviewed before and after the event, in each region. This is not the case, as some regions are relatively more represented in the control group, and others are relatively more represented in the treatment group. We do not think that ignorability poses a threat to our design, as also suggested by the fact that the balance test for differences in regions of residence is insignificant for the whole sample (Table A2) – but we will nonetheless control for regions Fixed Effects when conducting our estimation.
Empirical results
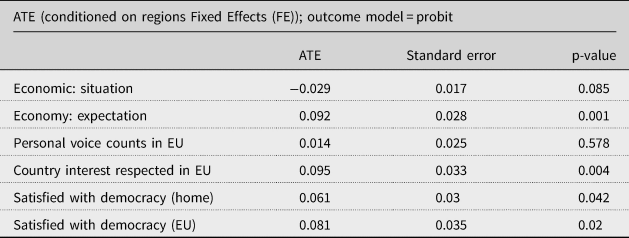
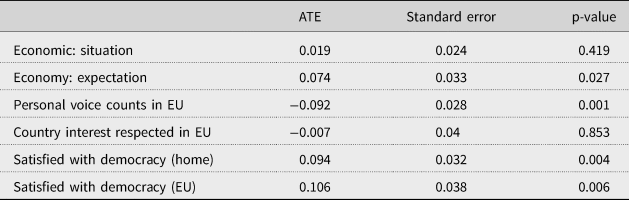
We estimate ATE via a regression adjustment where we specify the outcome as a probit model. To provide evidence in support of our H1, we need to show that the appointment of the Monti government is associated with an increase in satisfaction with democracy. Our results show that in fact there is a positive and statistically significant effect of the appointment on Italians’ satisfaction with the functioning of democracyFootnote 15 (Table 2, bottom).
ATEs: Expectations and Satisfaction

Table 2 also reports the estimated ATEs for respondents’ assessment of the current economic situation and for their economic expectations. Respondent in the treatment group appear to be slightly more pessimistic about the country's economic situation – possibly because witnessing a rare and extreme event such as the appointment of a fully technocratic government made them realize the gravity of the situation – but the effect is small and weak. Respondents in the treatment group are, however, significantly more optimistic in their expectations for future domestic economic conditions. This effect is very large – almost 10 percentage points – and strongly significant, lending support to the channel identified in H2.2.
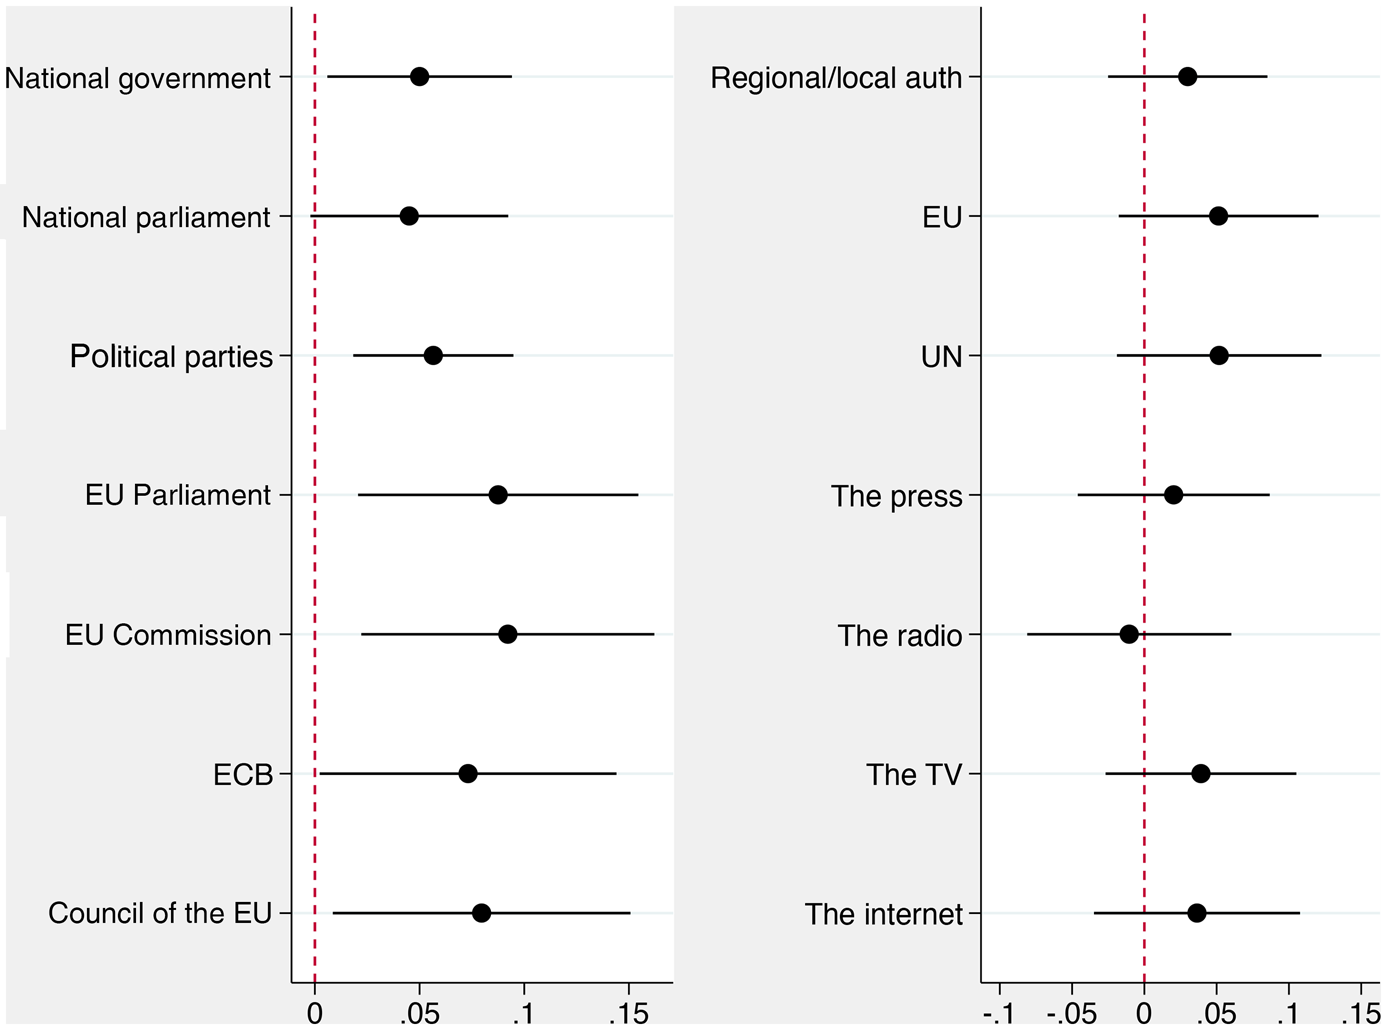
Some Eurobarometer waves include a question on whether respondents feel their voice counts in their own country. This would have been the perfect variable to use as a direct measure of perceived input legitimacy at the domestic level. Unfortunately, this question is not asked consistently across the different Eurobarometer editions, and it was not asked in the November 2011 wave of the survey that we use. The closest substitute is the answers to a different question, which asks respondents whether they think their own voice counts in the EU. No statistically significant change is detected in respondents’ perception of this (Table 2). We are aware that this is an imperfect measure of perceived input legitimacy as we frame it above, because it does not relate to the domestic environment and it does not allow us to clearly validate or invalidate H2.1. We think it is nonetheless interesting to look at this indicator, in light of the prominent role that Europe played in the Italian crisis. The Italian crisis situates itself within the broader context of the eurozone crisis, and EU institutions such as the ECB played a direct and very visible role in the unfolding of the crisis at home. Relatedly, we find that the appointment of the technocratic government is associated with a large increase in respondents’ perception that Italy's interests are respected in the EU (Table 2). This is a strong signal that the switch from the Berlusconi to the Monti government – headed by a former EU Commissioner – led to an improvement in Italians’ perception of Italy's assertiveness at the EU level – likely through the positive effect the event had on the international standing and credibility of Italy. This also helps rationalize the increase in satisfaction with the functioning of democracy in the EU, which we detect among respondents in the treatment group. Overall, our estimates show that the appointment of the Monti government was associated with a strong improvement in perceived output effectiveness, without a deterioration in perceived input legitimacy (Figure 1).
Effect of Monti's Appointment on Output and Input Factors

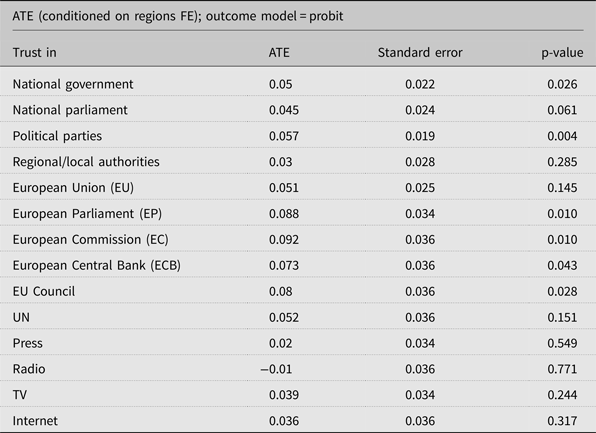
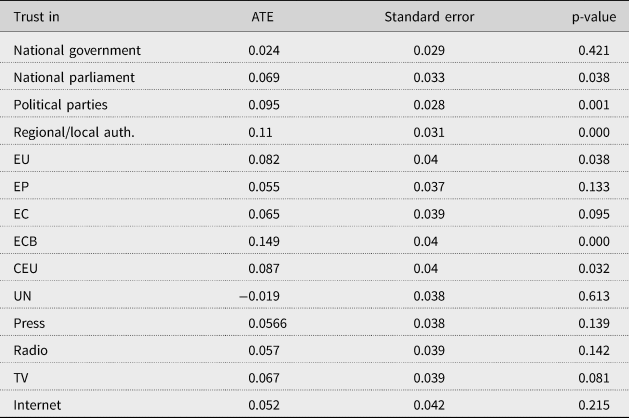
Table 3 reports estimated ATEs for trust in various domestic and EU institutions, and confirms that the appointment of the Monti cabinet had a positive effect on people's trust in the national government and – more weakly – parliament. The strongly significant increase in trust that we detect for political parties may appear prima facie puzzling, but it may be rationalized in light of the fact that political parties played a key role both in triggering the changeover through the vote of no-confidence to the Berlusconi government, and in making the technocratic solution possible through the support granted in the confirmatory confidence vote. Both votes occurred in parliament, but respondents seem to attribute (correctly) the outcome more to the independent choices of political parties than to the institution of parliament itself. We do not detect any change in trust for regional/local authorities, which is what we would expect given that these did not play any role in the 2011 political crises. Similarly, the third section of Table 3 reports ATEs estimated for placebos, i.e. institutions that we would not expect to undergo any change in trust due to the appointment of a technocratic government. These include the UN, the press, the radio, the TV and the internet.Footnote 16 As expected, no significant change in trust is found for these placebos, which lends robustness to the causal interpretation of the other effects we find.
ATEs: Domestic and EU Institutions, Placebos

The middle section of Table 3 reports estimated ATEs for trust in the EU and EU institutions. No statistically significant difference is detected for trust in the EU, but the increase in trust that we find for national institutions appears to ‘spill over’ to EU institutions as well. Why would trust in (supranational) EU institutions be affected by a domestic change in government? This may appear counter-intuitive at first, but it can be rationalized in light of two facts. The first is the already-mentioned prominent role played by EU institutions in the crisis. After bailouts were engineered for Greece, Ireland and Portugal, the prospect of Italy losing market access was associated with the collapse of the eurozone, because Italy was ‘too big to fail and too big to bail out’ (Jones Reference Jones2014; Summers Reference Summers2011). The strong involvement and concern of EU institutions in the Italian crisis became very clear at various points during the summer and autumn of 2011, in particular when the existence of the ECB letter mentioned above was made public (Benvenuti Reference Benvenuti2017). Because of the active and visible role that EU institutions played throughout the unfolding of the Italian crisis, it is thus not surprising that trust in these institutions was affected by the change in government that brought (at least temporary) relief. The second – and related – fact is the positive effect that the replacement of the Berlusconi government with a technocratic cabinet headed by a former European Commissioner had on people's perception of Italy's standing in the EU, as identified in Table 2.
Discussion
Our empirical analysis suggests that the Monti technocratic government – despite its unelected nature – did not trigger a decrease in Italians’ satisfaction with the functioning of democracy, but rather an increase. While we cannot test the effect of this appointment on citizens’ perceived legitimacy of their input at home in a fully satisfactory way – because the relevant question that we would need to perform the test was not asked in November 2011 – we do not observe any significant decrease in Italians’ perception of whether their voice ‘counts’ in the EU. At the same time, we detect a sizeable and strongly significant improvement in their perception of Italy's standing within the EU, as well as in their expectations regarding the future state of the Italian economy. This is consistent with the trade-off between perceived input and output legitimacy hypothesized above. Here we discuss the internal and external validity of these findings.
Effect of Monti's Appointment on Trust in Various Institutions

The appeal of natural experiment research designs rests on their potential for correctly identifying causal effects. UESDs have several desirable features when it comes to internal and external validity considerations (Muñoz et al. Reference Muñoz, Falco-Gimeno and Hernandez2019). In contrast to most observational survey research, UESDs rely on exogenous events to split the sample into treatment and control groups, which increases internal validity by reducing the risk of reverse causality bias. Moreover, the fact that UESDs rely on naturally occurring events provides a higher level of external validity compared with experiments controlled by researchers. In contrast to event studies that use longitudinal data, UESDs use cross-sections and focus on the immediate window of time surrounding the event, which also reduces concerns about the impact of macro-level confounders. Potential threats to the validity of the result may, however, come from what Dunning (Reference Dunning2012) calls the ‘compound treatment’ problem, arising when simultaneous events unconnected to the event of interest take place at around the same time, or when the treatment contains multiple explanatory factors.
In our case, the most relevant caveat is the fact that the shift from a non-technocratic to a technocratic government occurred together with the demise of Berlusconi, an important and very controversial figure who had dominated Italian political life since the early 1990s. The credibility of Berlusconi and of his coalition was severely damaged before the economic crisis reached its climax. The removal of a government that relied on an ineffective, internally conflictive coalition and led by an ageing prime minister weakened by scandals might have produced a positive effect on people's trust and satisfaction with democracy even if the replacement had been an alternative political government – provided that the latter had been credible enough to be perceived as a stabilizing force at a very unstable time. There is no way to clearly distinguish these effects in our data. But this does not invalidate our finding that the appointment of an unelected technocratic government is not necessarily associated with a decrease in citizens’ satisfaction with the functioning of democracy, nor make it less relevant. If a technocratic government can credibly promise to increase output effectiveness compared with the alternatives, and if it is consistent with the prevailing constitutional arrangement, then it may even increase people's satisfaction with democracy – despite the fact that it immediately reduces input participation.
A note of caution about our results concerns their external validity in terms of the time series dimension. By construction, UESDs allow us to estimate causal effects in an immediate temporal neighbourhood of the exogenous event that determines the split of the sample. However, it would be key to be able to trace the effects further into the future, especially after the actual implementation of the government's controversial austerity measures and labour market reforms. Unfortunately, the Eurobarometer is not a panel survey, so we cannot follow our treated sample over time. We can try to assess the dynamics in a quasi-experimental setting, comparing our 2011 treatment group with respondents interviewed exactly one year later. Having been interviewed one month before Monti's resignation, the November 2012 sample had had enough time to live through the implementation of the government's flagship policies. In a similar vein to what was done above, we conducted a series of balance tests to check comparability. Unlike our treatment and control groups in 2011, the 2012 sample is unbalanced compared with the 2011 treatment group (see Table A3). In particular, respondents interviewed in 2012 are significantly more likely to state that they ‘experienced difficulties paying bills’ (a proxy of perceived economic hardship). They also differ statistically in terms of their interest in and engagement with domestic political matters, as well as in their use of social media. Being connected with perceived economic status on one hand, and attitudinal approach to domestic politics on the other, these imbalances are relevant for the outcomes we are interested in.
To understand indicatively how attitudes changed between 2011 and 2012, we estimate ATEs based on a propensity score matching, where the propensity score is calculated out of covariates that we find to be unbalanced (see the note below Table A5 for more detail). The results (reported in the Appendix) point to a reversal of the positive effects that we observe in the immediate aftermath of the Monti appointment. Compared with the 2011 treatment group, respondents interviewed in 2012 are less likely to trust domestic institutions, they are less satisfied with democracy at home, and they have significantly worse expectations regarding the future state of the economy. This suggests that the signalling effect of the Monti government, which we found to be large and positive in 2011, had already started fading in 2012. This notwithstanding, the two samples do not differ significantly as to their trust in the national government – suggesting that in November 2012 the technocratic government had not yet completely lost the trust it had gained one year earlier. It may well be that Monti's decision to enter the 2013 political race was the final nail in the coffin: once he decided to descend into politics, the technocrat was no longer distinguishable from the politicians whose ineffectiveness had triggered his appointment. The 2013 election in fact saw the unexpected triumph of the Five Star Movement – a formation that campaigned as much against technocracy and experts as it did against the ‘establishment’, traditional politicians and the EU. The positive ‘spillover’ from the appointment of the Monti government to EU institutions, in fact, had already faded in 2012 – possibly pointing to the fact that once the effects of the measures adopted by the Monti government started to be visible, the role of EU institutions in its coming to office may no longer have been regarded as positive. While interesting and sensible, these results from the comparison of 2011 with 2012 need to be interpreted with care – due in particular to the above-mentioned imbalances across the two samples.
Conclusion
Scholars have been debating the issue of an EU democratic deficit for a long time. The eurozone crisis cast a new light on this question, by revealing tensions between domestic sovereignty and the policies needed to preserve the single currency and economic integration. The appointment of unelected technocratic governments charged with the task of implementing austerity measures and painful structural change has been widely seen as the embodiment of this tension. But despite the prominent role that technocratic governments have played both in the crisis and in the ensuing scholarly debate, they remain under-studied from an empirical perspective and we are especially lacking in our understanding of what attitudinal response they trigger among citizens. Although limited to the analysis of a single episode, this article contributes to this relatively undeveloped line of research. By using a natural experiment design in the context of the 2011 Italian political and economic crisis, we find that the appointment of the fully technocratic Monti government led to an increase (rather than a decrease) in citizens’ satisfaction with the functioning of domestic democracy. While unable to disentangle this effect clearly from the contemporaneous effect of the demise of Berlusconi and his controversial and delegitimized government, we do find evidence that the appointment of Monti triggered a large and significant positive effect on Italians’ expectation of crisis resolution.
We also detect a strong and significant increase in the trust in government, associated with the appointment – and this did not appear to have faded away within a year of November 2011. Interestingly, we detect a ‘spillover’ of trust towards other domestic and European institutions, which we explain by the fact that the appointment of the Monti government improved the perceived standing of Italy within the EU, at a time when it was possibly at its lowest. Most of these effects, however, proved to be short lived and were already fading away one year after the government had taken charge. Technocratic governments constitute an especially interesting object of study because their existence is predicated on a trade-off of reduced input participation in the present, against the expectation of a better output. The balance between those conflicting tensions is a priori uncertain, and it may be positive. The fact that Mario Monti fell from grace when he decided to run in the 2013 elections that followed the end of his government may be an indication that once technocrats decide to descend into politics, the signalling effect of their expertise is lost, and they become part of the problem rather than the solution. At the time of writing Italy is governed by a coalition of two parties (the League and the Five Star Movement) whose discourse has been against the traditional political establishment on one hand, and experts on the other. This may raise the question of whether – despite potentially positive short-term effects – the longer-term effect of a technocratic interlude may be of a deep erosion of trust and satisfaction with democratic institutions. Overall, our results suggest that technocratic legitimacy is a much more complex issue than is often portrayed and show that many aspects of this form of government remain underexplored, at the same time pointing to the importance of incorporating an empirical and quantitative angle into a literature that has so far been mostly theoretical.
Acknowledgements
I would like to thank David Steinberg for helping me conceptualize an early version of this article, and for his thoughtful comments thereafter. I am also grateful to Erik Jones and Matthias Matthijs as well as to three anonymous referees for providing useful comments and suggestions.
APPENDIX
Number and Percentage of Interviews per Day

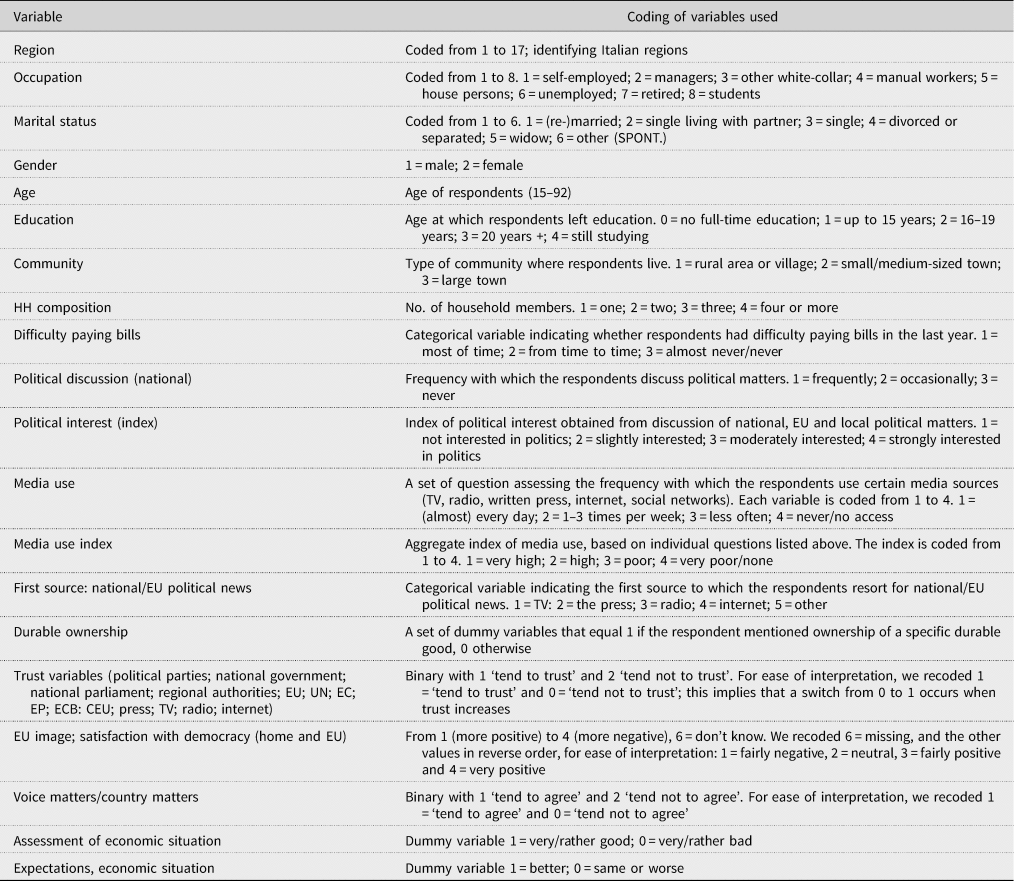
Variable Used

Quasi-Experimental Comparison 2012 vs 2011, Balance Tests

ATE 2011 vs 2012 (propensity score matching)

ATE 2011 vs 2012 (propensity score matching)