Implications
This paper presents how the evaluation of eight sustainability themes can be integrated in a single tool for an overall evaluation of the sustainability of pig farming systems, taking into account economy, environment and social demands from the general public and also from the farmers themselves. The tool is robust enough to enable the comparison of much contrasted systems. It should, however, be adapted to the context and to the purpose of the users. Therefore, this paper is more about suggesting an approach than about providing a ready-for-use tool for the integrated evaluation of the sustainability of pig farming systems.
Introduction
Following the definition of sustainable development provided by the Brundtland commission (Brundtland, Reference Brundtland1987), a number of studies on sustainable animal farming have considered the classical three pillars of sustainability, namely economic viability, environmental soundness and social acceptability (e.g. dairy: Van Calker et al., Reference Van Calker, Berentsen, Giesen and Huirne2005; egg: Mollenhorst et al., Reference Mollenhorst, Berentsen and De Boer2006; conceptual: Van Cauwenbergh et al., Reference Van Cauwenbergh, Biala, Bielders, Brouckaert, Franchois, Garcia Cidad, Hermy, Mathijs, Muys, Reijnders, Sauvenier, Valckx, Vanclooster, Van der Veken, Wauters and Peeters2007; sheep: Ripoll-Bosch et al., Reference Ripoll-Bosch, Diez-Unquera, Ruiz, Villalba, Molina, Joy, Olaizola and Bernues2012). Regarding pig farming systems, previous studies have mostly focused on one of the three pillars, environmental impact (e.g. Basset-Mens and Van der Werf, Reference Basset-Mens and Van der Werf2005), economy or social acceptance (e.g. Boogaard et al., Reference Boogaard, Boekhorst, Oosting and Sørensen2011). Multidisciplinary approaches to the sustainability of pig farming systems are therefore lacking.
Within the EU-funded research project Quality PorkChains (Q-PorkChains; www.q-porkchains.org), a study has been conducted with the aim of building a multidisciplinary tool for the evaluation of the sustainability of pig farming systems and using this tool to assess the sustainability of 15 contrasted pig farming systems. The procedure used for conducting the study and the pig farming systems that were evaluated are described in Bonneau et al., Reference Bonneau, De Greef, Brinkman, Cinar, Dourmad, Edge, Fàbrega, Gonzàlez, Houwers, Hviid, Ilari-Antoine, Klauke, Phatsara, Rydhmer, Van der Oever, Zimmer and Edwards2014. The evaluation tools for each of the eight sustainability themes are briefly outlined in Bonneau et al. (Reference Bonneau, De Greef, Brinkman, Cinar, Dourmad, Edge, Fàbrega, Gonzàlez, Houwers, Hviid, Ilari-Antoine, Klauke, Phatsara, Rydhmer, Van der Oever, Zimmer and Edwards2014) and described in detail in the relevant companion papers or in Supplementary material (see the ‘Material and methods’ section).
Material and methods
Data sets: the evaluated farming systems
In this paper, as well as in companion papers, the wording ‘Pig farming systems’ stands for a group of farms within a country, that are similar in terms of objectives, production methods and market orientation. The sustainability of a total of 15 contrasted pig farming systems in five countries (Denmark, France, Germany, the Netherlands and Spain) was evaluated. The 15 systems ranged in size from 2500 to 32 million slaughter pigs per year. They were classified in five categories, on the basis of three parameters: breeding line, targeted market segment and extent of outdoor housing (Bonneau et al., Reference Bonneau, De Greef, Brinkman, Cinar, Dourmad, Edge, Fàbrega, Gonzàlez, Houwers, Hviid, Ilari-Antoine, Klauke, Phatsara, Rydhmer, Van der Oever, Zimmer and Edwards2014): conventional (n=5; one per country; conventional breed, standard quality, outdoor index=0), adapted conventional (n=5; conventional breed, higher quality, outdoor index=0), organic (n=2; conventional breed, higher quality, outdoor index=3 to 5) and traditional (n=3; local breed, higher quality or specialty, outdoor index=2 to 6).
Data sets: the evaluation method
The evaluation tool was organised along eight themes (Bonneau et al., Reference Bonneau, De Greef, Brinkman, Cinar, Dourmad, Edge, Fàbrega, Gonzàlez, Houwers, Hviid, Ilari-Antoine, Klauke, Phatsara, Rydhmer, Van der Oever, Zimmer and Edwards2014): Animal Welfare (AW), Animal Health (AH), Breeding Programmes (BP), Environment (EN), Meat Safety (MS), Market Conformity (MC), Economy (EC) and Working Conditions (WC). It was mostly based on responses to questionnaires obtained through interviews with farmers and/or their employees; a total of over 500 questions were asked to farmers. The major part of the BP data were obtained from interviews with all nine breeding organisations providing genetic material to the farms included in the study. The MC data were obtained from eight slaughterhouse measurements and from questions asked to chain experts regarding the targeted market. Each system was represented by 3 to 13 farms, depending on the systems (8.7 farms on average).
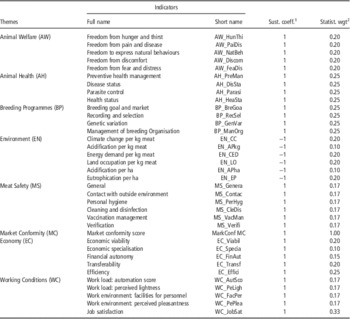
Each of the eight themes contributed to the integrated evaluation with a restricted number of most significant indicators (primary indicators), as described in Table 1. Detailed descriptions of the primary indicators listed in Table 1 are available in the theme-wise companion papers (BP: Rydhmer et al., Reference Rydhmer, Gourdine, De Greef and Bonneau2014; EN: Dourmad et al., Reference Dourmad, Ryschawy, Trousson, Bonneau, Gonzàlez, Houwers, Hviid, Zimmer, Nguyen and Morgensen2014; MC: Gonzàlez et al., Reference Gonzàlez, Gispert, Gil, Hviid, Dourmad, De Greef, Zimmer and Fàbrega2014; EC: Ilari-Antoine et al., Reference Ilari-Antoine, Bonneau, Klauke, Gonzàlez, Dourmad, De Greef, Houwers, Fàbrega, Zimmer, Hviid, Van der Oever and Edwards2014) or in supplementary material for AW, AH, MS and WC (Supplementary Material S1). To avoid indicator size effects, all data were centred to a mean of zero (by subtracting the overall average for the 15 systems) and scaled to a standard deviation of 1 (by dividing by the overall standard deviation for the 15 systems). Data were then multiplied by a sustainability coefficient (Table 1) so that higher values stood for better sustainability for all indicators. Finally, each indicator was given a statistical weight (Table 1) in such a way that each of the eight themes had the same total statistical weight in the analyses. In most cases, equal weights were given to each primary indicator within theme. The statistical weight for ‘acidification’ within the EN theme was distributed equally between ‘acidification per kg’ and ‘acidification per ha’. The distribution of weights within the EC theme was the one recommended by the IDEA method (Vilain, Reference Vilain2003). Within the WC theme, the weights for ‘work load’ and ‘work environment’ were each distributed equally between two indicators, one describing the situation as it was (‘automation score’ or ‘facilities for personnel’) and one describing how it is perceived by the personnel. The resulting data set, including a total of 37 primary indicators, is presented in Supplementary Tables S1 to 8.
Primary indicators contributed by each theme to the integrated evaluation

Sust. coeff.=sustainability coefficient; Statist. wgt=statistical weight.
1 Sustainability coefficient applied so that higher values meant better sustainability.
2 Statistical weights applied so that each of the eight themes had the same total statistical weight. Weight for ‘acidification’ distributed equally between ‘acidification per kg’ and ‘acidification per ha’. Weights within economy distributed according to Vilain (Reference Vilain2003). Weights for ‘work load’ and ‘work environment’ distributed equally between an objective and a perception indicator.
Statistical analyses
All statistical analyses were carried out in R version 2.8.1 (R Development Core Team, 2008). The matrix of correlations between indicators was calculated, using the COR procedure. A principal component analysis (PCA) was performed, using the PCA procedure, with the 37 primary indicators presented in Table 1 as active variables and the 15 farming systems as individuals, ignoring the systems’ category. Average scores per theme (theme indicators) and the overall sustainability score (OSS=average of the eight theme scores) were included in the analysis as supplementary (passive) variables. A cluster analysis was then carried out, on the basis of the results of the PCA analysis, using the AGNES procedure. The five resulting groups of systems were subsequently compared with the overall population of 15 systems, using the CATDES procedure.
Approaches for reducing the number of primary indicators
The tool that was used in this study needed a lot of information of which collection was time-consuming and costly. As such it might be too cumbersome to be used in common practice for sustainability evaluation. Three approaches were used to simplify the tool, via a reduction in the number of primary indicators:
-
∙ In the ‘clustering’ approach, the reduced set comprised the 25 primary indicators, which differed significantly at least once in the comparisons between the groups resulting from the cluster analysis and overall mean.
-
∙ In the ‘addition’ approach, all possible potential simplified theme indicators were calculated within theme as the sums of all possible combinations of primary indicators, in varying numbers from 1 to the number of primary indicators in the theme minus one. The selected simplified theme indicator was the one obtained with the minimum number of primary indicators, which correlated with the initial theme indicator with a coefficient of at least 0.95.
-
∙ In the ‘regression’ approach, all possible within-theme regressions of the theme indicator on combinations of primary indicators (from 1 to the number of primary indicators in the theme minus one) were calculated and the one with the minimum number of primary indicators giving an adjusted R 2 higher than 0.90 was selected as the simplified theme indicator.
Results
Correlations within theme
Because of its large size (45 rows by 45 columns), the correlation matrix is not presented. All the primary indicators used for the theme AW were significantly and positively correlated to the theme indicator (+0.54⩽r⩽+0.76) and, where significant, the correlations between AW primary indicators were positive. The same was observed for the themes AH (+0.60≤r≤+0.88) and BP (+0.53≤r≤+0.91). All significant within-theme correlations were also positive for the themes MS and EC. The primary indicators for MS were significantly correlated to the theme indicator (+0.55≤r≤+0.91) with the exception of MS-General (r=+0.16; P=0.57). Only three of the six primary indicators for EC were significantly correlated to the theme indicator (EC_FinAut, r=+0.65; EC_Transf, r=+0.66; EC_Effici, r=+0.85).
Regarding EN, ‘acidification per ha’ (r=−0.24; P=0.38) and ‘eutrophication’ (r=+0.02; P=0.95) were not significantly correlated to the theme indicator, whereas the remaining four primary indicators were highly and positively correlated to the theme indicator (+0.70≤r≤+0.90). ‘Acidification per ha’ was not correlated with ‘acidification per kg’ (r=−0.08; P=0.77), negatively correlated to ‘land occupation’ (r=−0.81; P<0.001) and ‘energy demand’ (r=−0.65; P=0.009) and positively correlated to ‘eutrophication’ (r=+0.84; P<0.001). ‘Land occupation’ was negatively correlated to ‘eutrophication’ (r=−0.67; P=0.006). Where significant, all other within-theme correlations were positive. Regarding WC, ‘automation’ (r=+0.21; P=0.46) and ‘facilities for personnel’ (r=+0.32; P=0.24) were not significantly correlated to the theme indicator, whereas the remaining three primary indicators were positively correlated to the theme indicator (+0.53≤r≤+0.94). Regarding work load, ‘automation score’ was negatively correlated to ‘perceived lightness’ (r=−0.52; P=0.047). Where significant, all other within-theme correlations were positive.
Correlations across themes
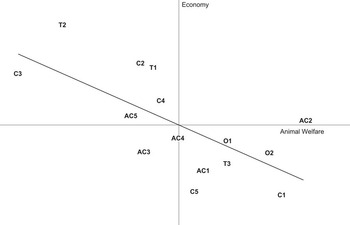
Out of the 28 possible correlations between the eight theme indicators, only four were significant. MS was correlated positively to AH (r=+0.61; P=0.016) and WC (r=+0.57; P=0.026) and negatively to MC (r=−0.59; P=0.020). AW and EC were negatively correlated (r=−0.68; P=0.006). The negative relationship between AW and EC is illustrated in Figure 1 showing that good animal welfare is usually associated with poor economic performance and vice-versa, the only exception being AC-2, which achieved the best score for AW and average score for EC.
Relationship between the sustainability scores for Economy and Animal Welfare obtained by 15 contrasted systems (C-1 to C-5 conventional; AC-1 to AC-5 adapted conventional; O-1 and O-2 organic; T-1 to T-3 traditional).

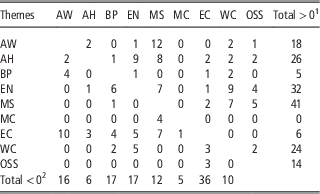
Out of 837 possible correlations between indicators, across themes, a total of 83 significant positive correlations were observed, as presented in Table 2 (above diagonal). The indicators for MS had a total of 41 significant positive correlations with the indicators of the other themes, out of the 266 possible correlations. Particularly ‘contact with outside environment’ and ‘personal hygiene’ had a total of 10 and 11 significant positive correlations, respectively, out of the 38 possible ones.
Number of significant positive (above diagonal) and negative (below diagonal) correlations between indicators, across themes
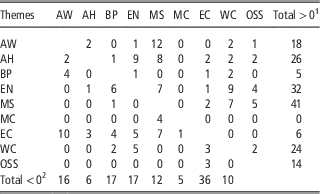
AW=Animal Welfare, AH=Animal Health, BP=Breeding Programmes; EN=Environment; MS=Meat Safety; MC=Market Conformity; EC=Economy; WC=Working Conditions; OSS=Overall Sustainability Score.
1 Total number of significant positive correlations for the theme indicated in line head.
2 Total number of significant negative correlations for the theme indicated in column head.
Out of 837 possible correlations between indicators, across themes, a total of 61 significant negative correlations were observed, as presented in Table 2 (below diagonal). The indicators for EC had a total of 36 significant negative correlations with the indicators of the other themes, out of the 266 possible correlations. Particularly ‘transferability’ had a total of 13 significant negative correlations out of the 38 possible ones.
PCA
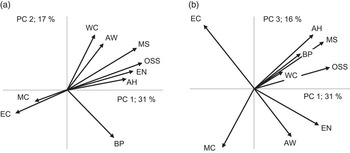
The first three components of the PCA accounted for a total of 63% of the overall variance of the data set (Figure 2 and Supplementary Table S9). The first component, accounting for 31% of the total variance, opposed EC (‘transferability’, ‘specialisation’, ‘financial autonomy’, ‘efficiency’) and MC to OSS and all other sustainability themes, the most so to EN (‘land occupation’, ‘energy demand’, ‘climate change’ and ‘acidification per kg meat’), MS (‘personal hygiene’, ‘contact with outside environment’, ‘cleaning & disinfection’, ‘vaccination management’) and AH (‘preventive management’, ‘parasite control’, ‘disease status’). The second component, accounting for 17% of the total variance, opposed all the indicators of BP to WC (‘perceived pleasantness of work environment’, ‘job satisfaction’, ‘perceived lightness of work load’), all the indicators of AW and MS and OSS. The third component, accounting for 16% of the total variance, opposed MC, AW (‘freedom from hunger and thirst’, ‘freedom from discomfort’, ‘freedom to express natural behaviour’, ‘freedom from fear and distress’) and EN (‘climate change’, ‘energy demand’, ‘land occupation’) to the remaining themes, the most so for EC (‘reliance on subsidies’, ‘efficiency’, ‘viability’, ‘transferability’), AH (‘health status’, ‘parasite control’) and MS (‘verification’, ‘vaccination management’, ‘cleaning & disinfection’).
Factor maps obtained from the PCA of the sustainability scores obtained by 15 contrasted systems (a: first and second components; b: first and third components). For clarity, the supplementary variables (theme indicators and OSS) are presented instead of the 37 active variables (primary indicators) that participated in the PCA analysis: AW=Animal Welfare; AH=Animal Health; BP=Breeding Programmes; EN=Environment; MS=Meat Safety; MC=Market Conformity; EC=Economy; WC=Working Conditions; OSS=overall sustainability score; PCA=principal component analysis.

Cluster analysis
The cluster analysis resulted in the identification of five groups, as shown on the maps of the systems against the first and second (Supplementary Figure S1) and first and third (Supplementary Figure S2) principal components of the PCA analysis.
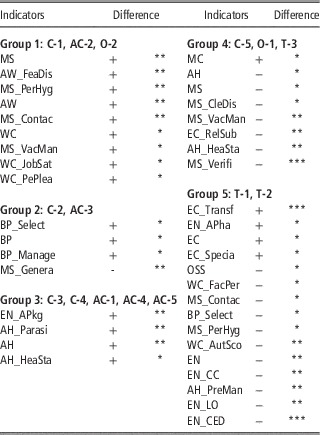
Group 1 comprised one conventional, one adapted conventional and one organic system. As shown in Table 3, it was characterised by high sustainability scores for MS (‘personal hygiene’, ‘contact with outside environment’, ‘vaccination management’), AW (‘freedom from fear and distress’) and WC (‘job satisfaction’, ‘perceived pleasantness of work environment’). Group 1 could be described as ‘people-oriented’.
Significant differences between the group means and the overall mean, for each of the four groups identified by the cluster analysisFootnote 1

1 Within group, indicators are listed from the most significant positive difference (+: group mean>overall mean) to the most significant negative difference (-: group mean<overall mean). Indicators with non-significant differences are not shown. *: P<0.05; **: P<0.01; *** P<0.001.
Group 2 included one conventional and one adapted conventional systems. It was characterised by high sustainability scores for BP (‘recording & selection’, ‘management of breeding organisation’) and low scores for the ‘general’ aspects of MS. The adapted conventional system used animals specifically selected for this system. Group 2 could be named ‘breeding-oriented’. Group 3 contained two conventional and three adapted conventional systems. It was characterised by high sustainability scores for ‘acidification per kg’ and Health (‘parasite control’, ‘health status’). Group 3 could be named ‘health-oriented’.
Group 4 was made of one conventional, one organic and one traditional system. It was characterised by high sustainability scores for MC and low sustainability scores for AH (‘health status’), MS (‘cleaning & disinfection’, ‘vaccination management’, ‘verification’) and ‘reliance on subsidies’. Group 4 might deserve the name of ‘careless’. Group 5 comprised two traditional systems. It was characterised by high sustainability scores for EC (‘transferability’, ‘specialisation’) and ‘acidification per ha’ and low sustainability scores for EN (‘energy demand’, ‘land occupation’, ‘climate change’), ‘preventive health management’, ‘automation score’, ‘facilities for personnel’, ‘personal hygiene’, ‘contact with outside environment’ and ‘recording & selection’. Group 5 was also characterised by lower than average OSS. Group 5 could be described as ‘economy above environment’.
Sustainability scores for individual systems
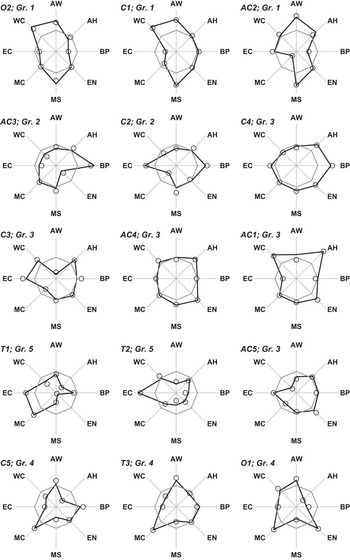
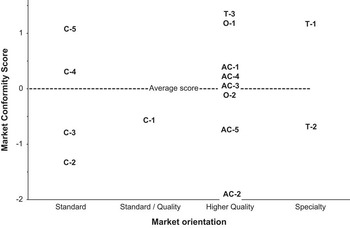
The theme indicators for each of the eight themes in the 15 systems are presented in Figure 3 (solid black lines). The three systems in group 1 ‘people-oriented’ exhibited the strengths described above for this group, pertaining to MS, AW and WC. The two systems in group 2 ‘genetic-oriented’ showed the above-mentioned strength in BP. In group 3, ‘health-oriented’ the strength on AH that was described above for the group was exhibited to a variable extent according to the systems. The three systems in group 4 ‘careless’ displayed the above-mentioned strength on MC and weaknesses on AH and MS. The two traditional systems in group 5 ‘Economy above environment’ exhibited the strength on EC and the weaknesses on most of the other sustainability themes that were described above for this group. MC scores indicate the extent to which systems were successful in producing meat quality levels in line with their targeted markets. Figure 4 shows that lower than average MC scores were achieved in three out of five conventional, two out of five adapted conventional and one out of two traditional systems.
Spider graphs of the scores obtained by individual systems (conventional C-1 to C-5; adapted conventional AC-1 to AC-5; organic O-1 and O-2; traditional T1 to T3) for the eight theme indicators: AW=Animal Welfare; AH=Animal Health; BP=Breeding Programmes; EN=Environment; MS=Meat Safety; MC=Market Conformity; EC=Economy; WC=Working Conditions. For all themes, higher scores indicate better sustainability. The scores obtained with the complete (37) and reduced (18, ‘addition’ approach) sets of primary indicators are represented by solid black lines and open circles, respectively. Grey lines: average values for the 15 systems.

Plot of Market Conformity Scores against claimed market orientation in individual systems (conventional C-1 to C-5; adapted conventional AC-1 to AC-5; organic O-1 and O-2; traditional T1 to T3).

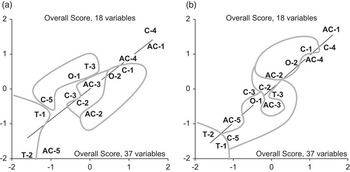
The OSS for each of the 15 systems are presented in Figure 5. The highest OSS were observed in systems belonging to groups 1 (C-1, O-2) and 3 (C-4, AC-1, AC-4). The lowest OSS were observed in group 5 (T-1 and T-2), as was already apparent from the results presented in Table 3, but also in two other systems (AC-5 in group 3 and C-5 in group 4).
Plots of the Overall Sustainability Scores obtained by individual systems (conventional C-1 to C-5; adapted conventional AC-1 to AC-5; organic O-1 and O-2; traditional T1 to T3), using the complete (horizontal axis) or reduced (vertical axis) sets of primary indicators in the ‘addition’ (a) and ‘regression’ (b) approaches. The grey lines delineate the five groups of systems identified in the cluster analysis.

Reduction of the number of indicators used for the evaluation
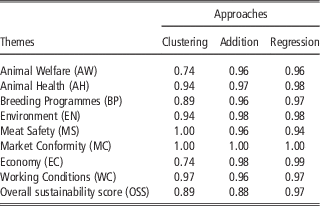
The list of primary indicators that were selected in the various approaches to derive a simplified tool is presented in Supplementary Table S10. The correlations between the theme indicators or OSS, calculated with the complete and reduced sets of primary indicators are presented in Table 4. The ‘clustering’ approach reduced the number of primary indicators from 37 to 25. The number of primary indicators representing the theme in the simplified tool was very variable according to theme, from 1 for AW to all for MS. This resulted in correlations between the theme indicators calculated from the complete or reduced sets that were also very variable, depending on the theme, from as low as 0.74 for AW and EC to 1.00 for MS. The correlation between OSS calculated with complete or reduced set of indicators was 0.89.
Coefficients of correlation between theme indicators or OSS calculated with the reduced sets of primary indicators and the same indicators calculated with the complete set

Both the ‘addition’ and ‘regression’ approaches reduced the number of primary indicators from 37 to 18 and the number of primary indicators representing each theme in the reduced set was less variable than in the ‘clustering’ approach. Both approaches were equally successful for the prediction of theme indicators, as shown by the high correlations, from 0.94 to 0.99. The patterns of theme indicators for each individual system (Figure 3) obtained with the reduced set of 18 primary indicators (‘addition’ approach; opened circles) were very similar to those obtained with the complete set of 37 primary indicators (solid black lines). The relationships between the OSS obtained with the complete and reduced sets of indicators was less satisfactory with the ‘addition’ approach (r=0.88, Figure 5a) than with the ‘regression’ approach (r=0.97, Figure 5b).
Discussion
The tool that was used in this study for the overall evaluation of 15 contrasted farming systems at farm level was able to differentiate clearly between groups of systems and to exemplify their strengths and weaknesses regarding sustainability. There were very few significant correlations between theme indicators, with coefficients of determination that were all lower than 0.48. Moreover, none of the theme indicators was close to the centre of the PCA maps, which would have indicated a low contribution to the overall observed variability. Finally, all themes contributed to the list of indicators that significantly characterised the five groups defined in the cluster analysis. This demonstrates that all eight themes were important to describe the observed variability between systems and that they were not redundant.
Considering the requirements for indicator-based sustainability assessments in agriculture, as stated in Binder et al. (Reference Binder, Feola and Steinberger2010), the proposed tool has a number of strengths as follows:
-
∙ It is clearly multidimensional, not limited to technical and environmental issues, and fully integrates the social and economic aspects.
-
∙ the social aspects include demands from the people working in the farms (WC) further to those from the overall society regarding citizen (AW, EN) and consumer (MS, MC) expectations.
-
∙ The animal is included as a stakeholder with two themes that are devoted to its fundamental needs as individual (AW and AH), although these themes also answer societal (AW) and economic (AH) demands. The BP theme also partially addresses the animal’s fundamental needs as a population.
-
∙ Being a top-down tool (which is in some respects a weakness as discussed below), it is less resource demanding than the methods involving full participation of stakeholders. It can therefore be used on a relatively high number of farms, rather than limited to a small number of cases.
However, the tool also has a number of weaknesses:
-
∙ It is limited to the farm level, making it less comprehensive than those considering approaches at regional level or across stages, such as MMF (López-Ridaura et al., Reference López-Ridaura, Masera and Astier2002), SAFE (van Cauwenbergh et al., Reference Van Cauwenbergh, Biala, Bielders, Brouckaert, Franchois, Garcia Cidad, Hermy, Mathijs, Muys, Reijnders, Sauvenier, Valckx, Vanclooster, Van der Veken, Wauters and Peeters2007) or SSP (Binder et al., Reference Binder, Schmid and Steinberger2012).
-
∙ It is mostly top-down. Binder et al. (Reference Binder, Feola and Steinberger2010) consider bottom-up participatory approaches such as MMF (López-Ridaura et al., Reference López-Ridaura, Masera and Astier2002) and SSP (Binder et al., Reference Binder, Schmid and Steinberger2012) to be more suitable, although this results in those methods being less generic and more resource-demanding.
-
∙ It does not include the multifunctionality aspects.
-
∙ Although genetic diversity is taken into account in the BP theme, its weight is relatively small compared with more operational aspects.
The most striking conflicts of interest between themes was observed for EC, which was negatively related to all other themes, particularly so with AW. Good performers in AW, with poor economic performance were found in all four categories of systems, whereas two conventional and two traditional systems performed well in EC to the detriment of AW. Besides this striking conflict of AW and EC, there have been some negative and also positive relations between the investigated themes. Positive correlations were observed between MS and AH or WC. These relationships might be explained by the general positive effects of good hygiene and management practices. There are several links between preventive measures to increase meat safety (Fosse et al., Reference Fosse, Seegers and Magras2009, Reference Fosse, Laroche, Oudot, Seegers and Magras2011) and animal health (Ribbens et al., Reference Ribbens, Dewulf, Koenen, Mintiens, De Sadeleer, de Kruif and Maes2008). Porcher (Reference Porcher2011) described the physical and mental effects of unclean housing facilities and sick animals on caretakers in pig farms. The relationship of lung function and respiratory symptoms in pig and farmers was already described by Bongers et al. (Reference Bongers, Houthuijs, Remijn, Brouwer and Biersteker1987).
With the exception of EC, where the recommendations of the authors of the methods were followed, the sustainability indicators used in the present study were all given the same statistical weight within theme. It is acknowledged that there was no other basis for that choice than simplicity and lack of evidence for giving different statistical weights to the various indicators. Because there is potentially an infinite number of combination of weighting factors for the 37 primary indicators, no attempt was made to run sensitivity analyses to check to what extent the results would be altered by giving different weights to the various indicators. This introduces a degree of subjectivity in the method and can therefore be perceived as a weakness. It can be argued, however, that the relative importance given to the various indicators depends on the context and on the objectives of the sustainability evaluation. In a very similar way, the validity of the OSS as it was calculated here (sum of the theme indicators without any differential weighting of the themes), can be questioned. The relative importance to be given to each theme actually depends on the context (geographical, technical, economic, political, …) where the systems are situated and also on the purpose of the evaluation (see the ‘Conclusions’ section).
The simplification of the tool obtained from reducing the set of primary indicators to the 25 ones that participated significantly in the definition of the groups (‘clustering’ approach) was not very satisfactory because some of the themes were poorly represented and poorly predicted by the reduced set of primary indicators. Moreover, the achieved reduction in the number of primary indicators was not really impressive. The results of the other two approaches were more encouraging, halving the number of primary indicators, while achieving very good predictions of the theme indicators. The ‘regression’ approach provides a better prediction of the OSS than the ‘addition’ approach. However, it is very likely more sensitive to the particular set of data on which the regressions are calculated. Moreover, the validity of the OSS as it was calculated here, can be questioned, as discussed above. The ‘addition’ approach is therefore more robust and should be preferred to the ‘regression’ one. The list of indicators listed in the ‘Addition’ column of Supplementary Table S10 appears to be the best compromise for a simplified tool for the overall evaluation of sustainability of pig farming systems. It has to be noticed, however, that, because genetic variation (including uniqueness of the breed) is excluded in the simplified scoring, the simplification results in lower scores for BP in all traditional systems. Despite the fact that the addition approach was preferred to the regression one, it cannot be ruled out that the proposed simplification is dependent on the systems that are studied. The only way to check that would be to use both the complete and simplified tools on a totally different set of systems.
The approach considered in this paper for reducing the amount of information that has to be collected was purely based on statistics and only addressed indicators, which each resulted from the combination of a number of basic variables. It has the advantage of reducing the number of primary indicators, hence the number of basic variables (questions to farmers or other stakeholders) that are needed. Other considerations should also be taken into account, including time needed and cost to get the information, degree of willingness of the farmers to give the information, etc. These aspects are discussed in the companion papers dealing with the theme evaluations. They may vary according to the systems that are evaluated, so that no general recommendations can be given. Rather, people willing to perform an evaluation study will have to consider realistic approaches, taking into account the peculiarities of the systems they want to evaluate, for getting the information pertaining to the primary indicators that are retained in the short list.
Because the tool was tested on much contrasted systems, it can be speculated that it is quite robust and can apply to very diverse situations, even in its simplified form. The downside to its robustness is likely to be a reduced capacity to identify slight differences between systems. It is worth noticing, however, that the five studied conventional systems, that were expected to be rather similar, were actually rated very differently, with OSS spanning almost the whole range of variation observed in the present study, from the best to the third lowest score.
The systems achieving higher than average OSS were found in two different groups, showing that there are several different ways to be globally sustainable. Two systems (C-4 and AC-4; see Figure 3) had no real weakness and achieved at least average (or very close to average) scores for all of the eight themes. System AC-1 had only one weakness on EC that was compensated by very good scores on AH and WC. Three other systems (O-2, C-1 and AC-2) achieved high OSS in a less balanced way, with particular strengths on AW and MS that counterbalanced real weaknesses in several other themes. The two non-conventional systems, O-2 and AC-2, depend on genetic material from conventional breeding programmes. Thus, selection is not based on traits of special importance for these systems, which results in lack of availability of animals with important traits for these systems.
The systems achieving lower than average OSS were found in three different groups, showing that there are also several different ways to be globally poorly sustainable. Two systems (T-1 and T-2 in group 5 ‘economy above environment’), exhibiting the lowest OSS, were unsustainable in most dimensions, except for EC. This result comes in direct conflict with the commonly held public opinion that traditional systems are the most sustainable (De Greef et al., Reference De Greef, Houwers and Bonneau2013). They achieve poorly on AW. They have a very high environmental impact, in relation with the poor technical performance of the local genotypes and the high slaughter weights that are typical of those systems (Barba et al., Reference Barba, Delgado, Sereno, Dieguez, Forero, Jaume and Peinado2001; Labroue et al., Reference Labroue, Marsac, Luquet, Gruand, Mourot, Neelz, Legault and Ollivier2001). They are poorly sustainable regarding the management of their breeding work (mainly due to their small scale), while the differentiation of those systems, hence their very existence, is heavily based on the use of a special genotype. These systems also achieved poorly regarding the enforcement of good practices to ensure MS, although outdoor rearing of the animals leads to specific risks, as discussed by Vaarst et al. (Reference Vaarst, Padel, Hovi, Younie and Sundrum2005). It has to be considered, however, that those traditional systems offer services that are not directly related to food production, particularly via contributing to keep human activity, hence human presence, in low density areas and to maintain landscapes (Casabianca and Vallerand, Reference Casabianca and Vallerand1994; Lopez-Bote, Reference Lopez-Bote1998). The provision of such services is not included in our sustainability evaluation tool. One system (AC-5 in group 3) had serious weaknesses regarding WC and the adequacy of the achieved MC to the targeted market, which were not compensated by any real strength. Three systems (C-5, O-1 and T-3) had a well-identified strength in adequacy of the achieved MC to the targeted market that was more than counterbalanced by more or less serious weaknesses regarding AH and MS. It seems likely that substantial progress could be obtained from a more rigorous application of good practices in hygiene and health management. OSS was further hampered by additional weaknesses on either EC and WC (C-5 and T-3) or BP (O-1). The O-1 system depended on genetic material from a conventional breeding programme. Thus, selection was not based on traits of special importance for organic production, for example, disease resistance.
In all, seven out of the 10 systems claiming market orientation towards ‘higher quality’ or ‘specialty’ achieved average or better than average MC scores, indicating that they were successful in obtaining the relevant meat quality levels consistent with their targeted market. Only two out of the five conventional systems aiming at standard quality achieved that, although the targeted level of quality was lower and therefore easier to achieve. This suggests that, in a majority of the observed systems, results are in accordance with claims regarding meat quality. Yet, this was not the case for three of them, particularly so for system AC-2. This latter system was, however, the only one which escaped the negative relationships between EC and AW (see the ‘Discussion’ section). It can be speculated that the image of the system was sufficiently good on other respects (AW and/or other) to overcome the lack of improvement in meat quality.
It is interesting to notice that the groups resulting from the cluster analysis do not fully recover the categories that were considered a priori on the basis of breeding line, targeted market segment and extent of outdoor housing. This means that there is a very high variability within category regarding sustainability, and that systems belonging to various categories may exhibit very similar strengths and weaknesses (groups 1 and 4 are quite exemplary in this respect).
Conclusions
The tool presented in this paper has the advantage of being robust and therefore enables comparing much contrasted systems. At the same time, it is sensitive enough to discriminate between conventional systems across Europe. It is, however, not intended to be a universal tool for the evaluation of the sustainability of pig farming systems. Rather it should be adapted depending on expectations and context. If the purpose is to help scientists or chain decision makers to compare farms within a system, it will be necessary to adapt the questionnaires to avoid those questions that are irrelevant to the system and ask for more details on some aspects that have not been taken into consideration for being too specific to the system. The relative weights given to the various themes should also be adapted in accordance to the main aims of the chain. If the purpose is to help scientists or policy-makers compare systems within a territory, the relative weight given to each of the eight themes should also be adapted according to the reality of the context and also according to the priorities of the users of the tool: economic development, environment, country planning, etc. In short, the present paper is more about suggesting an approach than about providing a ready-for-use tool for the integrated evaluation of the sustainability of pig farming systems. Key lesson is that the chosen eight themes are clearly complementary. Sustainability of farming systems cannot be assessed with a single overall index, rather via indexing the underlying sustainability themes.
Acknowledgements
The authors gratefully acknowledge from the European Community financial participation under the Sixth Framework Programme for Research, Technological Development and Demonstration Activities, for the Integrated Project Q-PORKCHAINS FOOD-CT-2007- 036245. The views expressed in this publication are the sole responsibility of the author(s) and do not necessarily reflect the views of the European Commission. Neither the European Commission nor any person acting on behalf of the Commission is responsible for the use, which might be made of the information. The information in this document is provided as is and no guarantee or warranty is given that the information is fit for any particular purpose. The user thereof uses the information at its sole risk and liability.
Supplementary material
To view supplementary material for this article, please visit http://dx.doi.org/10.1017/S1751731114002122