1 Introduction
Reverse osmosis membrane (ROM) filtration systems are utilized in wastewater recovery (Benito & Ruiz Reference Benito and Ruiz2002; Cath et al. Reference Cath, Gormly, Beaudry, Flynn, Adams and Childress2005; Rahardianto, McCool & Cohen Reference Rahardianto, McCool and Cohen2008; Shannon et al. Reference Shannon, Bohn, Elimelech, Georgiadis, Mariñas and Mayes2008; Greenlee et al. Reference Greenlee, Lawler, Freeman, Marrot and Moulin2009; McCool et al. Reference McCool, Rahardianto, Faria, Kovac, Lara and Cohen2010; Rahardianto, McCool & Cohen Reference Rahardianto, McCool and Cohen2010), seawater desalination (Fritzmann et al. Reference Fritzmann, Löwenberg, Wintgens and Melin2007; Elimelech & Phillip Reference Elimelech and Phillip2011; Matin et al. Reference Matin, Khan, Zaidi and Boyce2011), landfill water treatment (Peters Reference Peters1998; Chianese, Ranauro & Verdone Reference Chianese, Ranauro and Verdone1999), etc. Typically, ROMs perform one of the final stages of water treatment and are designed to filter ions or soluble substances. Bio-active films (Bucs et al. Reference Bucs, Linares, Vrouwenvelder and Picioreanu2016) and porous materials (Shih et al. Reference Shih, Rahardianto, Lee and Cohen2005; Rahardianto et al. Reference Rahardianto, Shih, Lee and Cohen2006) are two of the media frequently used as separation membranes. The selective membrane only allows de-mineralized/deionized water to penetrate, and forms a physical boundary between the purified water flux (i.e. the permeate flux), collected on the draw side of the membrane, and the pre-treatment (feed) water. High pressure is applied and maintained on the concentrated (feed) side to drive the permeate flux of treated water. As with any filtration process, ROM performance is largely impacted by fouling. The filtered solute (mineral or ion) accumulates on the membrane surface by creating a blockage. Fouling is the primary process affecting filtration performance since it (i) reduces the clean water permeate flux and (ii) increases the energy (i.e. the driving pressure drop) required to generate a unitary permeate flux. Optimization of filtration systems has primarily focused on maximizing membrane permeability and selectivity, while minimizing the reduction of permeate induced by fouling. However, it is critical to consider factors other than permeability and selectivity in materials design (Park et al. Reference Park, Kamcev, Robeson, Elimelech and Freeman2017).
While the type of foulant greatly depends on solute and membrane properties, its impact on ROM performance and operation costs is similar. In bio-active membranes, microbial growth is the primary cause of fouling (Bucs et al. Reference Bucs, Linares, Vrouwenvelder and Picioreanu2016). Instead, perm-selectivity of porous ROM membranes to the solvent (e.g. clean water) leads to a localized increase of solute concentration on the feed side, also known as concentration polarization (CP) (Brian Reference Brian1965; Jonsson & Boesen Reference Jonsson and Boesen1977; Sablani et al. Reference Sablani, Goosen, Al-Belushi and Wilf2001; Kim & Hoek Reference Kim and Hoek2005; McCutcheon & Elimelech Reference McCutcheon and Elimelech2006). CP refers to the rise of concentration relative to the bulk concentration at a membrane surface and it is due to the rejection of solute by membrane selectivity. Quoting from Lyster & Cohen (Reference Lyster and Cohen2007), the ‘rejection of salt ions at a membrane surface in cross-flow reverse osmosis results in increased solute concentration near the membrane surface (i.e. concentration polarization)’. As a result, solute precipitates from the solution and accumulates or crystallizes on the membrane surface (Shih et al. Reference Shih, Rahardianto, Lee and Cohen2005; Rahardianto et al. Reference Rahardianto, Shih, Lee and Cohen2006).
Beside surface chemistry, the fouling propensity of a membrane depends greatly on its surface topological properties, such as roughness, and its morphology (or shape). Literature and experience show that modification of membrane surfaces with chemical coatings can be effective but not sufficient for controlling membrane fouling. The discovery that sub-micron patterning of a membrane surface can improve its fouling resistance provides an orthogonal membrane design parameter (Maruf et al.
Reference Maruf, Rickman, Wang, Mersch, Greenberg, Pellegrino and Ding2013a
,Reference Maruf, Wang, Greenberg, Pellegrino and Ding
b
, Reference Maruf, Greenberg, Pellegrino and Ding2014). As a result, different mechanisms at vastly different scales have been proposed to control fouling (Zhang et al.
Reference Zhang, Liu, He, Su, Zhao, Elimelech and Jiang2016): (i) modifications of membrane/separator morphology at the system scale (
 ${\sim}\text{cm}$
) (Ma & Song Reference Ma and Song2006; Guillen & Hoek Reference Guillen and Hoek2009; Suwarno et al.
Reference Suwarno, Chen, Chong, Puspitasari, McDougald, Cohen, Rice and Fane2012; Xie, Murdoch & Ladner Reference Xie, Murdoch and Ladner2014; Sanaei & Cummings Reference Sanaei and Cummings2017); (ii) modifications of the membrane topology at the micro-scale (
 ${\sim}\text{mm}-\unicode[STIX]{x1D707}\text{m}$
) (Elimelech et al.
Reference Elimelech, Zhu, Childress and Hong1997; Bowen & Doneva Reference Bowen and Doneva2000; Vrijenhoek, Hong & Elimelech Reference Vrijenhoek, Hong and Elimelech2001; Kang et al.
Reference Kang, Liu, Lin, Cao and Yuan2007a
; Ba, Ladner & Economy Reference Ba, Ladner and Economy2010; Battiato, Bandaru & Tartakovsky Reference Battiato, Bandaru and Tartakovsky2010; Ladner et al.
Reference Ladner, Steele, Weir, Hristovski and Westerhoff2012; Maruf et al.
Reference Maruf, Rickman, Wang, Mersch, Greenberg, Pellegrino and Ding2013a
,Reference Maruf, Wang, Greenberg, Pellegrino and Ding
b
, Reference Maruf, Greenberg, Pellegrino and Ding2014; Battiato Reference Battiato2014; Ling, Tartakovsky & Battiato Reference Ling, Tartakovsky and Battiato2016); and (iii) chemical or surface treatment to alter the interaction force between the membrane and the foulant at the nano-scale (
 ${\sim}\text{nm}$
) (Kang et al.
Reference Kang, Gao, Chen, Jie, Cao and Yuan2007b
; Sanaei et al.
Reference Sanaei, Richardson, Witelski and Cummings2016).
Attempts to control fouling in ROM commercial systems have been primarily limited to the inclusion of spacers transverse to the main flow direction. These have shown limited success since they fail to sufficiently perturb the flow field in the proximity of the membrane boundary, where fouling is localized. Furthermore, spacers increase the flow resistance, i.e. the energy input to sustain a given pressure drop. More promising has been the use of micro/nano-patterns embossed above the membrane. These are able to more effectively perturb the flow locally, and only mildly impact the overall dissipation of the system. Surface treatment can effectively modify interaction properties, for instance wettability, roughness and molecular attraction between the membrane and the foulant, however such modifications generally undergo irreversible degradation during filtration.
Despite the fact that a number of studies have experimentally or analytically demonstrated the impact of morphological and topological alteration on, e.g. solute dispersion and fouling at the system (macro-) scale (Battiato et al. Reference Battiato, Bandaru and Tartakovsky2010; Griffiths, Howell & Shipley Reference Griffiths, Howell and Shipley2013; Maruf et al. Reference Maruf, Wang, Greenberg, Pellegrino and Ding2013b ; Battiato & Rubol Reference Battiato and Rubol2014; Ling et al. Reference Ling, Tartakovsky and Battiato2016, Reference Ling, Oostrom, Battiato and Tartakosvky2018; Rubol, Battiato & de Barros Reference Rubol, Battiato and de Barros2016; Rubol, Ling & Battiato Reference Rubol, Ling and Battiato2018), ROM systems are still primarily optimized by trial and error. This is due to the lack of quantitative understanding of the impact of morphological and/or topological modifications on membrane fouling at prescribed operating conditions. While (semi-)analytical methods can provide general guiding principles and basic process understanding for highly idealized systems (Kang et al. Reference Kang, Gao, Chen, Jie, Cao and Yuan2007b ; Battiato Reference Battiato2012; Ling et al. Reference Ling, Tartakovsky and Battiato2016; Sanaei et al. Reference Sanaei, Richardson, Witelski and Cummings2016; Sanaei & Cummings Reference Sanaei and Cummings2017), their direct applicability to the optimization and design of real systems is questionable. On the other hand, laboratory experimentation of promising designs, and their consequent optimization, may be prohibitively expensive. A number of two-dimensional (2-D) and 3-D numerical simulators have been developed to study fouling (Bhattacharyya et al. Reference Bhattacharyya, Back, Kermode and Roco1990; Lyster & Cohen Reference Lyster and Cohen2007; Park & Kim Reference Park and Kim2013; Bucs et al. Reference Bucs, Radu, Lavric, Vrouwenvelder and Picioreanu2014, Reference Bucs, Linares, Vrouwenvelder and Picioreanu2016; Xie et al. Reference Xie, Murdoch and Ladner2014; Kang et al. Reference Kang, Lee, Lee and Kim2017). Yet, they generally do not account for unsteady effects and the coupling between hydrodynamics and membrane fouling, which dynamically alters the permeate flux distribution, i.e. the boundary condition for the flow field (Lyster & Cohen Reference Lyster and Cohen2007). The flow field is influenced by the local blockage of the membrane, which further impacts the distribution of the solute in the bulk, its CP and, finally, fouling formation. A number of models have been proposed to represent different mechanisms leading to fouling (e.g. standard and complete blocking, cake filtration, etc.), and their impacts on system scale performance, quantified by, e.g. energy input and permeate flux (Griffith, Kumar & Stewart Reference Griffith, Kumar and Stewart2014; Griffith, Kumar & Stuart Reference Griffith, Kumar and Stuart2016; Sanaei & Cummings Reference Sanaei and Cummings2017). However, the fouling mechanism is generally not dynamically coupled to the local hydrodynamics, and its dynamic feedback on flux reduction is not accounted for. Attempts to incorporate unsteady effects included the definition of time-dependent absorption functions to model fouling growth (Bucs et al. Reference Bucs, Radu, Lavric, Vrouwenvelder and Picioreanu2014, Reference Bucs, Linares, Vrouwenvelder and Picioreanu2016): although the growth function is time dependent, the governing equations for flow and transport remain at the steady state. An explicit treatment of the dynamic coupling between bulk transport, surface fouling and hydrodynamics is necessary to elucidate the mechanisms that control (i) the onset of fouling, (ii) the development of a stable fouling pattern and (iii) the dynamic flux reduction as a result of clogging.
In this work, we develop a three-dimensional model and computational framework to study fouling spatio-temporal evolution which captures (i) the two-way coupling between bulk concentration, flow velocity and foulant accumulation on the membrane surface, (ii) the relationship between CP close to the membrane surface and fouling on the membrane and (iii) the initiation and development of the foulant spatial pattern. Such a framework allows us to quantitatively investigate the impact of surface topology (i.e. roughness) and morphology (i.e. wiggliness, shape) on fouling, and to identify dynamical conditions under which such alterations are warranted. Here, we intend to lay out the foundations of a mathematical framework to address some of the open questions outlined by Park et al. (Reference Park, Kamcev, Robeson, Elimelech and Freeman2017), who state that
‘there is a real need for fundamental modeling, at length scales ranging from atomistic to continuum, to provide rational guidance for designing future membranes. [
 $\ldots$
] In all cases, better understanding of structure-property-performance relationships in new, as well as existing, membrane materials is urgently needed’.
The paper is organized as follows. In § 2, we introduce the model in dimensional (§ 2.1) and dimensionless (§ 2.2) form, and derive universal scaling laws in the long time limit for a rectangular flat membrane (§ 2.3). In § 3, we first perform a convergence study (§ 3.1) and then validate the model against unsteady permeate flux measurements and steady-state fouling patterns (§ 3.2). Section 4 investigates the impact of morphological and topological modifications of the membrane shape (i.e. wiggliness) and surface (i.e. roughness) on both foulant accumulation, clean water permeate flux and operating pressure drop. We focus on 18 membrane designs which include 9 purely morphological (M-), 6 purely topological (T-) and 3 hybrid (H-) designs which include both topological and morphological modifications (§ 4.1). We then introduce new scaling variables (§ 4.2) and derive scaling laws (§ 4.3) valid for all designs. We finally show how the previous framework can be used for membrane shape and surface optimization (§ 4.4). We provide concluding remarks in § 5.
2 Model
2.1 Governing equations
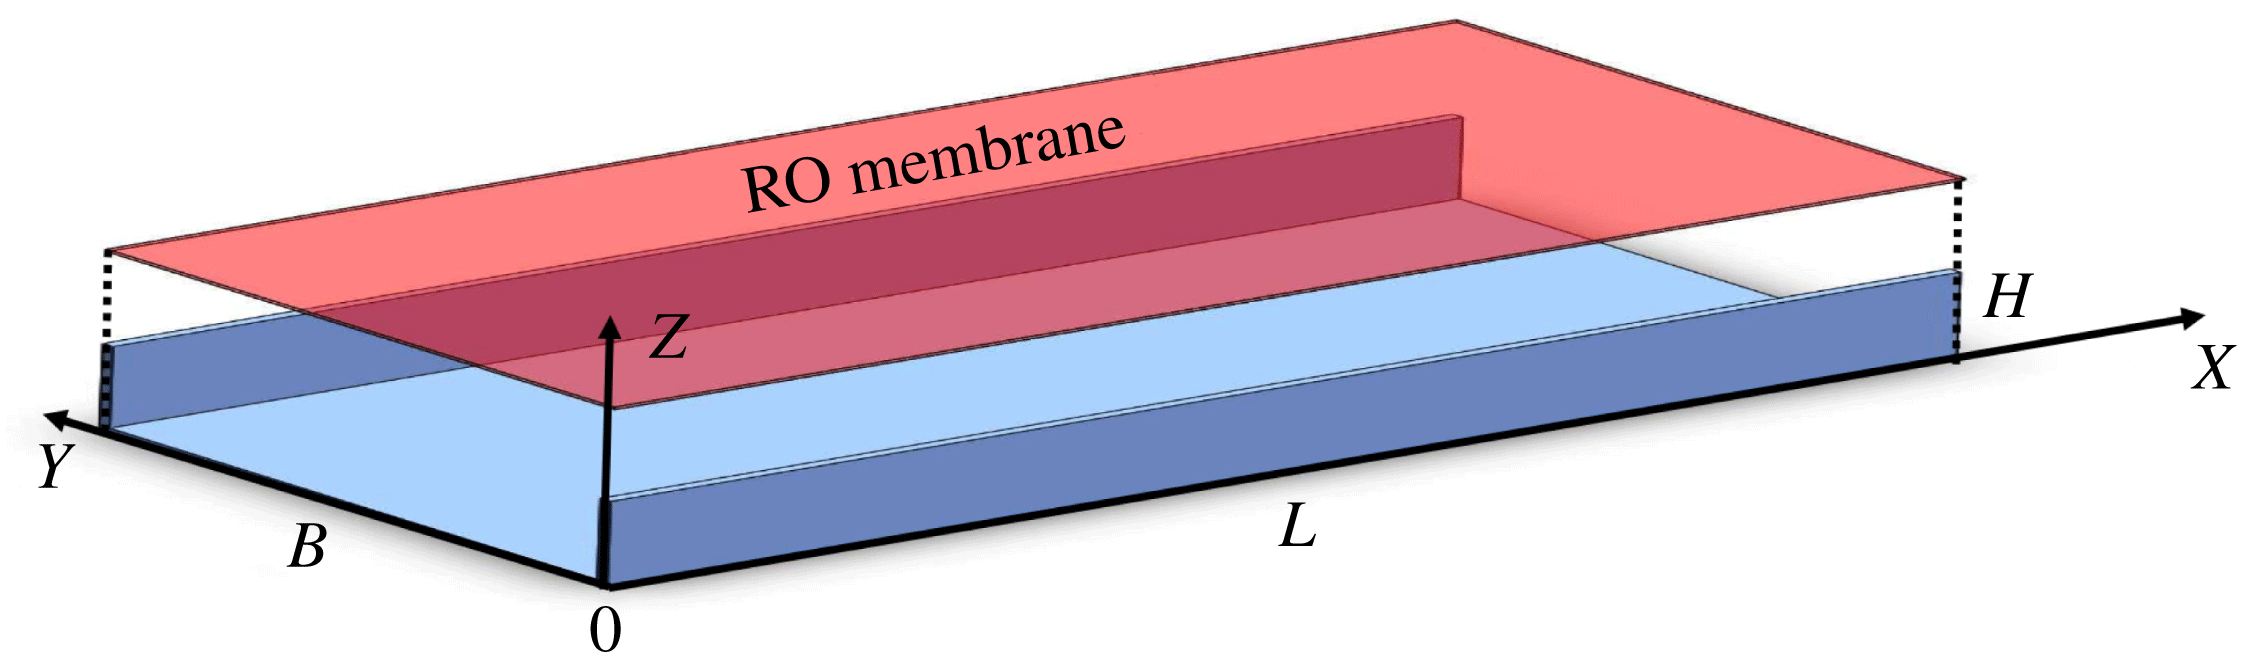
We consider a pressure-driven flow in a channel of length
 $L$
and rectangular cross-section (in the
 $(Y,Z)$
-plane) whose top side, located at
 $Z=H$
, consists of a flat ROM lying in the
 $(X,Y)$
-plane, parallel to the mean flow. The clean water is cross-filtered from the feed solution, conveyed to the membrane through the flow channel, as the membrane is permeable to water molecules only and impermeable to the solute dissolved in the feed. The concentrated solution (feed) enters the channel from the inlet section located at
 $X=0$
and exits the domain at
 $X=L$
. Solute rejection by the membrane (aka membrane perm-selectivity) leads to the emergence of local solute concentration gradients in the feed at the membrane/solution interface and to subsequent accumulation of foulant on the membrane, in the interior of the computational domain (
 $0<Z\leqslant H$
). A schematic of the domain is shown in figure 1.
Three-dimensional sketch of the computational domain (exploded-view), where the red boundary represents the ROM and the blue boundaries are the flow channel walls.

We focus on fouling accumulation as a function of both time and space. The filtration process is described by a set of coupled transient equations for the velocity field
 $\boldsymbol{U}$
, the bulk concentration
 $C_{b}$
of solute within the feed solution and the foulant surface concentration
 $C_{s}$
on the ROM. The flow field
 $\boldsymbol{U}(\boldsymbol{X},T)=(U,V,W)$
satisfies the transient incompressible Navier–Stokes and continuity equations
 $$\begin{eqnarray}\displaystyle & \displaystyle \frac{\unicode[STIX]{x2202}\boldsymbol{U}}{\unicode[STIX]{x2202}T}+(\boldsymbol{U}\boldsymbol{\cdot }\unicode[STIX]{x1D735})\boldsymbol{U}+\unicode[STIX]{x1D735}\hat{P}=\unicode[STIX]{x1D735}\boldsymbol{\cdot }(\unicode[STIX]{x1D708}\unicode[STIX]{x1D735}\boldsymbol{U}), & \displaystyle\end{eqnarray}$$
 $$\begin{eqnarray}\displaystyle & \displaystyle \unicode[STIX]{x1D735}\boldsymbol{\cdot }\boldsymbol{U}=0, & \displaystyle\end{eqnarray}$$
 $\hat{P}$
[
 $L^{2}T^{-2}$
] is a rescaled pressure and is defined as
 $$\begin{eqnarray}\hat{P}={\displaystyle \frac{P^{\star }}{\unicode[STIX]{x1D70C}}},\end{eqnarray}$$
with
 $P^{\star }$
fluid pressure, and
 $\unicode[STIX]{x1D708}$
and
 $\unicode[STIX]{x1D70C}$
the kinematic viscosity and density of the bulk solution, respectively. Gravitational effects are neglected. Equations (2.1) are subject to inlet, outlet, cross-flow velocity and no-slip boundary conditions at the inlet, outlet, on the ROM and the three impermeable walls, respectively,
 $$\begin{eqnarray}\displaystyle & \displaystyle \boldsymbol{U}=(U_{in},0,0),\quad \boldsymbol{n}\boldsymbol{\cdot }\unicode[STIX]{x1D735}\hat{P}=0\quad \text{for}\quad \boldsymbol{X}=(0,Y,Z), & \displaystyle\end{eqnarray}$$
 $$\begin{eqnarray}\displaystyle & \displaystyle \boldsymbol{n}\boldsymbol{\cdot }\unicode[STIX]{x1D735}\boldsymbol{U}=0,\quad \hat{P}=P_{out}\quad \text{for}\quad \boldsymbol{X}=(L,Y,Z), & \displaystyle\end{eqnarray}$$
 $$\begin{eqnarray}\displaystyle & \displaystyle \boldsymbol{U}=(0,0,W_{H}),\quad \boldsymbol{n}\boldsymbol{\cdot }\unicode[STIX]{x1D735}\hat{P}=0\quad \text{for}\quad \boldsymbol{X}=(X,Y,H), & \displaystyle\end{eqnarray}$$
 $$\begin{eqnarray}\displaystyle & \displaystyle \boldsymbol{U}=(0,0,0),\quad \boldsymbol{n}\boldsymbol{\cdot }\unicode[STIX]{x1D735}\hat{P}=0\quad \text{for}\quad Y=\{0,B\},\quad \text{or}\quad Z=0, & \displaystyle\end{eqnarray}$$
 $W_{H}$
is the local permeate flux through the membrane. It is defined as the difference between
 $W_{m}$
, the clean water flux, i.e. the membrane flux in absence of fouling, and
 $W_{f}$
, the flux reduction due to foulant accumulation, i.e.
 $$\begin{eqnarray}W_{H}=W_{m}-W_{f}.\end{eqnarray}$$
In (2.4),
 $W_{m}$
and
 $W_{f}$
are defined as follows
 $$\begin{eqnarray}W_{m}=\frac{k_{m}}{\unicode[STIX]{x1D708}B}\unicode[STIX]{x1D6FF}\hat{P},\end{eqnarray}$$
with
 $k_{m}$
[
 $\text{mD}=9.869\times 10^{-16}~\text{m}^{2}$
] the membrane permeability, and
 $\unicode[STIX]{x1D6FF}\hat{P}$
the local pressure head drop across the membrane,
 $$\begin{eqnarray}\unicode[STIX]{x1D6FF}\hat{P}=\hat{P}(X,Y,Z=H^{-})-P_{amb},\end{eqnarray}$$
where
 $P_{amb}=0$
is the ambient pressure. Although various methods have been proposed to model the flux reduction
 $W_{f}$
due to fouling, two approaches are generally used: the flux reduction is represented either (i) as a function of the CP (or concentration in close proximity of the membrane surface) (Lee, Baker & Lonsdale Reference Lee, Baker and Lonsdale1981; Lyster & Cohen Reference Lyster and Cohen2007; Sagiv et al.
Reference Sagiv, Zhu, Christofides, Cohen and Semiat2014), or (ii) by postulating a functional relationship between the foulant and membrane resistance (Griffiths et al.
Reference Griffiths, Howell and Shipley2013; Sanaei et al.
Reference Sanaei, Richardson, Witelski and Cummings2016; Sanaei & Cummings Reference Sanaei and Cummings2017). The first approach is based on the assumption that the fouling and CP have the same (or similar) impact on the flow field. However, unlike CP, which vanishes when pressure is released, some foulant may irreversibly precipitate on the membrane (Shih et al.
Reference Shih, Rahardianto, Lee and Cohen2005; Xie et al.
Reference Xie, Murdoch and Ladner2014). The second approach is based on modelling the foulant as an additional resistance to the membrane: in such models, the relationship between foulant-induced resistance and flux reduction contains parameters (e.g. permeability of the foulant or the attraction coefficient) that are often difficult to experimentally determine (Sanaei & Cummings Reference Sanaei and Cummings2017; Takatori & Brady Reference Takatori and Brady2017; Sanei & Cummings Reference Sanei and Cummings2018).
In this work, instead we model flux reduction due to foulant accumulation as
 $$\begin{eqnarray}W_{f}=A_{f}(C_{s}-C_{b}),\end{eqnarray}$$
where
 $A_{f}$
is a constant, and
 $C_{s}$
and
 $C_{b}$
are the foulant dimensionless surface and bulk concentrations defined as
 $$\begin{eqnarray}C_{s}=\frac{\hat{C}_{s}}{C_{0}\cdot B},\end{eqnarray}$$
and
 $$\begin{eqnarray}C_{b}=\frac{\hat{C}_{b}}{C_{0}},\end{eqnarray}$$
where
 $\hat{C}_{s}$
[
 $\text{mol}~\text{m}^{-2}$
] and
 $\hat{C}_{b}$
[
 $\text{mol}~\text{m}^{-3}$
] are the corresponding dimensional concentrations, and
 $C_{0}$
is the reference bulk concentration (usually taken as the inlet concentration). Equation (2.7) hypothesizes that the reduced flux is proportional to the amount of locally precipitated (or deposited) foulant, where the local accumulation of the foulant scales with the rate of precipitation. As a result, the proposed relationship relates permeate flux loss with the precipitation rate and directly links/couples the three critical quantities governing the feedback between local hydrodynamics (
 $W_{f}$
, or
 $\boldsymbol{U}$
), bulk solute transport (
 $C_{b}$
) and foulant accumulation (
 $C_{s}$
). The relationship, which will be subject to validation against experimental data in § 3, has the following advantages: (i) it disentangles CP from fouling, (ii) its parameter
 $A_{f}$
can be calibrated using experimental measurements, as outlined in § 3.2, and (iii) it relates quantities that can be independently measured in experiments; as a consequence, the validity of such a postulated relationship can be immediately tested and/or generalized, if necessary. The expression
 $A_{f}(C_{s}-C_{b})^{n}$
is widely used for studying crystallization kinetics (Brusilovsky, Borden & Hasson Reference Brusilovsky, Borden and Hasson1992; Lee & Lee Reference Lee and Lee2000; Cetin, Eroğlu & Özkar Reference Cetin, Eroğlu and Özkar2001; Sheikholeslami & Ong Reference Sheikholeslami and Ong2003; Shih et al.
Reference Shih, Rahardianto, Lee and Cohen2005), similar to those occurring for certain foulants, e.g. gypsum, with an exponent
 $n$
ranging between 1 and 2. If we normalize the constant
 $A_{f}$
by the membrane permeability, and define
 $$\begin{eqnarray}\hat{A}_{0}=\frac{A_{f}}{k_{m}/(\unicode[STIX]{x1D708}B)},\end{eqnarray}$$
then (2.4) can be written as
 $$\begin{eqnarray}W_{H}|_{Z=H}=\frac{k_{m}}{\unicode[STIX]{x1D708}B}[\unicode[STIX]{x1D6FF}\hat{P}-\hat{A}_{0}(C_{s}-C_{b})],\end{eqnarray}$$
which describes how fouling affects the decrease in permeate flux dynamically: as the foulant surface concentration,
 $C_{s}$
, increases, the local permeate velocity
 $W_{H}$
and flux will dynamically decrease. In this context,
 $\hat{A}_{0}(C_{s}-C_{b})$
can be thought of as a loss of effective pressure drop across the membrane due to foulant deposition. We emphasize that the boundary condition (2.11) allows one to (i) distinguish CP from foulant accumulation, (ii) fully couple the flow field, concentration field and the foulant deposition while capturing its effect on permeate flux dynamically and (iii) link flux reduction with foulant accumulation/precipitation on the membrane.
The solute bulk concentration
 $C_{b}$
satisfies a classic advection–diffusion equation
 $$\begin{eqnarray}\frac{\unicode[STIX]{x2202}C_{b}}{\unicode[STIX]{x2202}T}+\boldsymbol{u}\boldsymbol{\cdot }\unicode[STIX]{x1D735}C_{b}-D\unicode[STIX]{x1D6FB}^{2}C_{b}=0,\end{eqnarray}$$
subject to a flux balancing boundary condition on the ROM (Lyster & Cohen Reference Lyster and Cohen2007)
 $$\begin{eqnarray}D\frac{\unicode[STIX]{x2202}C_{b}}{\unicode[STIX]{x2202}Z}=R_{i}W_{H}C_{b}\quad \text{at }Z=H,\end{eqnarray}$$
where
 $D$
is the molecular diffusion coefficient of the bulk solute,
 $W_{H}$
is given by (2.11) and
 $R_{i}$
is the intrinsic membrane rejection rate (Lyster & Cohen Reference Lyster and Cohen2007). In this study, we set
 $R_{i}=100\,\%$
. Furthermore, equation (2.12) is subject to no-flux boundary conditions at the outlet and on the channel solid walls, i.e.
 $\boldsymbol{n}\boldsymbol{\cdot }\unicode[STIX]{x1D735}C_{b}=0$
at
 $Z=0$
,
 $Y=\{0,H\}$
and
 $X=L$
, and a Dirichlet boundary condition at the inlet,
 $C_{b}=1$
at
 $X=0$
. The surface concentration of the foulant
 $C_{s}$
satisfies a transient adsorption–desorption equation (Jones & O’Melia Reference Jones and O’Melia2000).
 $$\begin{eqnarray}\frac{\unicode[STIX]{x2202}C_{s}}{\unicode[STIX]{x2202}T}=K_{1}\cdot (C_{s,max}-C_{s})\cdot C_{b}-K_{2}C_{s},\end{eqnarray}$$
where
 $K_{1}$
,
 $K_{2}$
and
 $C_{s,max}$
are the adsorption and desorption coefficients and the equilibrium foulant concentration, respectively. All equations are coupled through the boundary conditions defined on the membrane.
The set of (2.1)–(2.14) allows us to solve for the dynamical evolution of fouling by coupling the transient equations (2.1), (2.12) and (2.14) through the boundary conditions (2.11) and (2.13). We emphasize that the proposed model of flux reduction, equation (2.7), dynamically captures the two-way coupling between hydrodynamics, bulk transport and fouling. The primary advantages of the model are the following: (i) all physics is resolved dynamically; (ii) by imposing the condition that
 $C_{s,max}>C_{b}$
, the growth function (2.14) guarantees the that
 $A_{f}(C_{s}-C_{b})>0$
, and prevents any unphysical flux increase; (iii) the coupling between bulk and foulant concentration, and between the foulant and flux reduction is explicitly modelled and no additional hypothesis is needed to describe the functional dependence between foulant accumulation and membrane resistance (Griffiths et al.
Reference Griffiths, Howell and Shipley2013; Sanaei et al.
Reference Sanaei, Richardson, Witelski and Cummings2016; Sanaei & Cummings Reference Sanaei and Cummings2017); (iv) different growth kinetics can be accounted for by appropriately modifying
 $K_{1}$
and
 $K_{2}$
, for instance, soluble foulant (e.g. sodium chloride) has
 $K_{1}>0$
and
 $K_{2}>0$
, while more resilient foulant (e.g. calcium carbonate) has
 $K_{1}>0$
and
 $K_{2}\approx 0$
. It is worth emphasizing that the model parameters are either intrinsic properties of the membrane (e.g.
 $R_{i}$
and
 $k_{m}$
) or can be measured from experiments when the solution–membrane pair is given. For instance,
 $K_{1}$
and
 $K_{2}$
can be determined experimentally as discussed by Jones & O’Melia (Reference Jones and O’Melia2000). To summarize, the novelty of the proposed model lies primarily in the formulation of the flux (2.7), and in its ability to capture the two-way dynamic coupling between
 $\boldsymbol{U}$
,
 $C_{b}$
and
 $C_{s}$
.
Once the foulant surface concentration
 $C_{s}(X,Y,H,T)$
is determined, the non-fouled regions
 $\unicode[STIX]{x1D6E4}_{n}$
on the ROM are identified by locally thresholding
 $C_{s}$
, i.e.
 $$\begin{eqnarray}\unicode[STIX]{x1D6E4}_{n}(T):=\{(X(T),Y(T),H)|C_{s}\leqslant \unicode[STIX]{x1D6FC}C_{s,max}\},\quad \text{where }\unicode[STIX]{x1D6FC}\in [0,1],\,T\in (0,T_{max}),\end{eqnarray}$$
which represents the area formed by a set of membrane points
 $(X,Y,H)$
that satisfy the condition
 $C_{s}\leqslant \unicode[STIX]{x1D6FC}C_{s,max}$
. In this study we set
 $\unicode[STIX]{x1D6FC}=1$
. The unit permeate flux
 $Q_{m}$
[
 $LT^{-1}$
] is
 $$\begin{eqnarray}Q_{m}(T)={\displaystyle \frac{1}{A_{m}}}\int _{\unicode[STIX]{x1D6E4}_{n}(T)}W_{H}(X,Y,T)\,\text{d}{\mathcal{A}},\end{eqnarray}$$
where
 $A_{m}$
is the total surface of the membrane.
2.2 Dimensionless formulation
We start by defining the Sherwood number, i.e. the ratio between the convective and diffusive mass transport toward the membrane or the dimensionless permeate flux,
 $$\begin{eqnarray}Sh={\displaystyle \frac{Q_{m,\infty }B}{D}},\end{eqnarray}$$
where
 $Q_{m,\infty }$
is the steady-state permeate flux, and the Bejan number, i.e. the dimensionless pressure head drop along the channel,
 $$\begin{eqnarray}Be={\displaystyle \frac{B^{2}}{\unicode[STIX]{x1D708}^{2}}}\unicode[STIX]{x0394}\hat{P},\end{eqnarray}$$
where
 $\unicode[STIX]{x0394}\hat{P}=\hat{P}_{in}-\hat{P}_{out}$
is the modified pressure drop along the membrane between the inlet (
 $X=0$
) and the outlet (
 $X=L$
). Furthermore, we define the following dimensionless quantities,
 $$\begin{eqnarray}\boldsymbol{u}=\frac{\boldsymbol{U}}{U_{in}},\quad \boldsymbol{x}=\frac{\boldsymbol{X}}{B},\quad t=\frac{T}{B/U_{in}},\quad P=\frac{\hat{P}}{\unicode[STIX]{x1D708}^{2}/B^{2}},\quad A_{0}=\frac{\hat{A}_{0}}{\unicode[STIX]{x1D708}^{2}/B^{2}},\quad w_{h}=\frac{W_{H}}{U_{in}},\quad h=\frac{H}{B},\end{eqnarray}$$
where
 $\boldsymbol{u}=(u,v,w)$
and
 $\boldsymbol{x}=(x,y,z)$
are the dimensionless velocity field and coordinate axes. We also introduce the dimensionless numbers
 $$\begin{eqnarray}Re=\frac{U_{in}B}{\unicode[STIX]{x1D708}},\quad Pe=\frac{U_{in}B}{D},\quad Dc=\frac{k_{m}}{B^{2}},\quad Da_{I}=K_{1}\frac{B}{U_{in}},\quad Da_{II}=K_{2}\frac{B}{U_{in}},\end{eqnarray}$$
where
 $Re$
,
 $Pe$
,
 $Dc$
,
 $Da_{I}$
and
 $Da_{II}$
are the Reynolds, Péclet, Darcy and Damköhler numbers related to the adsorption and desorption reactions, respectively. Then, the transport equations (2.12) and (2.14) for the bulk and surface concentration,
 $C_{b}$
and
 $C_{s}$
, can be cast in dimensionless form
 $$\begin{eqnarray}Pe\left(\frac{\unicode[STIX]{x2202}C_{b}}{\unicode[STIX]{x2202}t}+\boldsymbol{u}\boldsymbol{\cdot }\unicode[STIX]{x1D735}C_{b}\right)-\unicode[STIX]{x1D6FB}^{2}C_{b}=0,\end{eqnarray}$$
and
 $$\begin{eqnarray}\frac{\unicode[STIX]{x2202}C_{s}}{\unicode[STIX]{x2202}t}=Da_{I}(C_{s,max}-C_{s})C_{b}-Da_{II}C_{s},\end{eqnarray}$$
subject to
 $$\begin{eqnarray}\displaystyle & \displaystyle \frac{\unicode[STIX]{x2202}C_{b}}{\unicode[STIX]{x2202}z}=Pe\,w_{h}C_{b}, & \displaystyle\end{eqnarray}$$
 $$\begin{eqnarray}\displaystyle & \displaystyle w_{h}=\frac{Dc}{Re}\left[\unicode[STIX]{x1D6FF}P-A_{0}\left(C_{s}-C_{b}\right)\right], & \displaystyle\end{eqnarray}$$
 $z=h$
). For practical applications, it is often important to identify the relationship between pressure drop and the permeate flux when the system reaches equilibrium in the long-time limit, i.e.
 $$\begin{eqnarray}Sh=\unicode[STIX]{x1D6F1}(Be,Re,Pe,Dc,\text{etc}.),\end{eqnarray}$$
using the formulation above. In the following section, we will derive an analytical scaling behaviour between
 $Be$
and
 $Sh$
.
2.3 Long-time scaling limit
At steady state, equation (2.22) reads
 $$\begin{eqnarray}0=Da_{I}(C_{s,max}-C_{s})C_{b}-Da_{II}C_{s},\end{eqnarray}$$
namely,
 $$\begin{eqnarray}C_{s}=\frac{Da_{I}C_{s,max}C_{b}}{Da_{II}+Da_{I}C_{b}}.\end{eqnarray}$$
Combining (2.26) with the membrane permeate flux equation (2.23b ), we obtain
 $$\begin{eqnarray}w_{h}=\frac{Dc}{Re}\left[\unicode[STIX]{x1D6FF}P-A_{0}\left(\frac{Da_{I}C_{s,max}C_{b}}{Da_{II}+Da_{I}C_{b}}-C_{b}\right)\right].\end{eqnarray}$$
Assuming the foulant accumulates much faster than it dissolves, i.e.
 $Da_{I}C_{b}/Da_{II}\ll 1$
, equation (2.27) can be simplified as follows
 $$\begin{eqnarray}w_{h}=\frac{Dc}{Re}[\unicode[STIX]{x1D6FF}P-A_{0}(C_{s,max}-C_{b})].\end{eqnarray}$$
Also, under the assumption that at steady state
 $P(z=h^{-})\sim P_{in}$
, while accounting for (2.18), equation (2.6) can be written as
 $$\begin{eqnarray}\unicode[STIX]{x1D6FF}P=Be+P_{out},\end{eqnarray}$$
where
 $P_{in}$
and
 $P_{out}$
are the dimensionless inlet and outlet pressures. Inserting (2.29) into (2.28), we obtain
 $$\begin{eqnarray}w_{h}=\frac{Dc}{Re}[Be+P_{out}-A_{0}(C_{s,max}-C_{b})].\end{eqnarray}$$
Under the hypothesis that
 $C_{b}\approx C_{b}(Z)$
, i.e. the variation of the bulk concentration
 $C_{b}$
with
 $x$
and
 $y$
is negligible, while accounting for (2.30), the boundary condition (2.23a
) can be written as
 $$\begin{eqnarray}C_{b}^{\prime }=\unicode[STIX]{x1D6F1}_{I}C_{b}^{2}+\unicode[STIX]{x1D6F1}_{II}C_{b},\end{eqnarray}$$
where
 $$\begin{eqnarray}\displaystyle & \displaystyle \unicode[STIX]{x1D6F1}_{I}=Dc\,Sc\,A_{0}, & \displaystyle\end{eqnarray}$$
 $$\begin{eqnarray}\displaystyle & \displaystyle \unicode[STIX]{x1D6F1}_{II}=Dc\,Sc(Be-Be^{\star }), & \displaystyle\end{eqnarray}$$
 $$\begin{eqnarray}Be^{\star }=A_{0}C_{s,max}-P_{out},\end{eqnarray}$$
since
 $Sc=Pe/Re=\unicode[STIX]{x1D708}/D$
. Equation (2.31) is a homogeneous nonlinear ordinary differential equation for
 $C_{b}$
, which can be solved by using the following substitution:
 $$\begin{eqnarray}\unicode[STIX]{x1D6FE}=\frac{1}{C_{b}}.\end{eqnarray}$$
The transformed equation gives us a non-homogeneous equation for
 $\unicode[STIX]{x1D6FE}$
 $$\begin{eqnarray}-\unicode[STIX]{x1D6FE}^{\prime }=\unicode[STIX]{x1D6F1}_{I}+\unicode[STIX]{x1D6F1}_{II}\unicode[STIX]{x1D6FE},\end{eqnarray}$$
whose solution,
 $\unicode[STIX]{x1D6FE}=\unicode[STIX]{x1D6FE}_{h}+\unicode[STIX]{x1D6FE}_{p}$
, is given by the general and particular solutions,
 $\unicode[STIX]{x1D6FE}_{h}$
and
 $\unicode[STIX]{x1D6FE}_{p}$
, which satisfy
 $$\begin{eqnarray}-\unicode[STIX]{x1D6FE}_{h}^{\prime }=\unicode[STIX]{x1D6FE}_{h}\unicode[STIX]{x1D6F1}_{II},\end{eqnarray}$$
and
 $$\begin{eqnarray}-\unicode[STIX]{x1D6FE}_{p}^{\prime }=\unicode[STIX]{x1D6F1}_{I}+\unicode[STIX]{x1D6FE}_{p}\unicode[STIX]{x1D6F1}_{II},\end{eqnarray}$$
respectively. The solution is
 $$\begin{eqnarray}\unicode[STIX]{x1D6FE}=\unicode[STIX]{x1D6FE}_{h}+\unicode[STIX]{x1D6FE}_{p}=C_{1}\exp (-\unicode[STIX]{x1D6F1}_{II}z)-\frac{\unicode[STIX]{x1D6F1}_{I}}{\unicode[STIX]{x1D6F1}_{II}},\end{eqnarray}$$
where
 $C_{1}$
is determined by imposing the boundary condition
 $$\begin{eqnarray}C_{b}=1,\quad \text{when }z=0,\end{eqnarray}$$
i.e. the channel bottom reaches saturation at steady state. The solution reads
 $$\begin{eqnarray}C_{b}=\frac{\unicode[STIX]{x1D6F1}_{II}}{(\unicode[STIX]{x1D6F1}_{I}+\unicode[STIX]{x1D6F1}_{II})+\exp (-\unicode[STIX]{x1D6F1}_{II}h)-\unicode[STIX]{x1D6F1}_{I}}.\end{eqnarray}$$
Additionally, we assume that at steady state
 $w_{h}=Q_{m,\infty }/U_{in}$
, i.e.
 $$\begin{eqnarray}w_{h}=\frac{1}{Pe}Sh.\end{eqnarray}$$
Combining (2.41) with (2.30), we obtain
 $$\begin{eqnarray}Sh=\unicode[STIX]{x1D6F1}_{I}C_{b}+\unicode[STIX]{x1D6F1}_{II}.\end{eqnarray}$$
Evaluating
 $C_{b}$
at the membrane surface,
 $z=h$
, while accounting (2.40), leads to
 $$\begin{eqnarray}Sh=\unicode[STIX]{x1D6F1}_{II}-\frac{\unicode[STIX]{x1D6F1}_{II}}{1-\left({\displaystyle \frac{\unicode[STIX]{x1D6F1}_{II}}{\unicode[STIX]{x1D6F1}_{I}}}+1\right)-\exp \left(-\unicode[STIX]{x1D6F1}_{II}h\right)}.\end{eqnarray}$$
Substituting (2.32b ), we obtain
 $$\begin{eqnarray}Sh=Dc\,Sc(Be-Be^{\star })\left\{1-\frac{1}{1-\left[1+{\displaystyle \frac{1}{\unicode[STIX]{x1D6F1}_{I}}}(Be-Be^{\star })\right]\exp \left[-hDc\,Sc(Be-Be^{\star })\right]}\right\},\end{eqnarray}$$
which provides the relationship between the dimensionless permeate flux,
 $Sh$
, and the dimensionless pressure drop,
 $Be$
. It is worth emphasizing that, at steady state,
 $Sh$
can be written as a function of only Bejan number
 $Be$
, Darcy number,
 $Dc$
, i.e. the dimensionless permeability of the membrane, and Schmidt number
 $Sc$
(as well as the geometric parameter
 $h$
), while it is independent of
 $Re$
,
 $Pe$
and
 $Da$
. However, since
 $Be$
is certainly function of
 $Re$
(as
 $Sh$
is), (2.44) implies that both
 $Sh$
and
 $Be$
exhibit the same scaling behaviour in terms of Reynolds number.
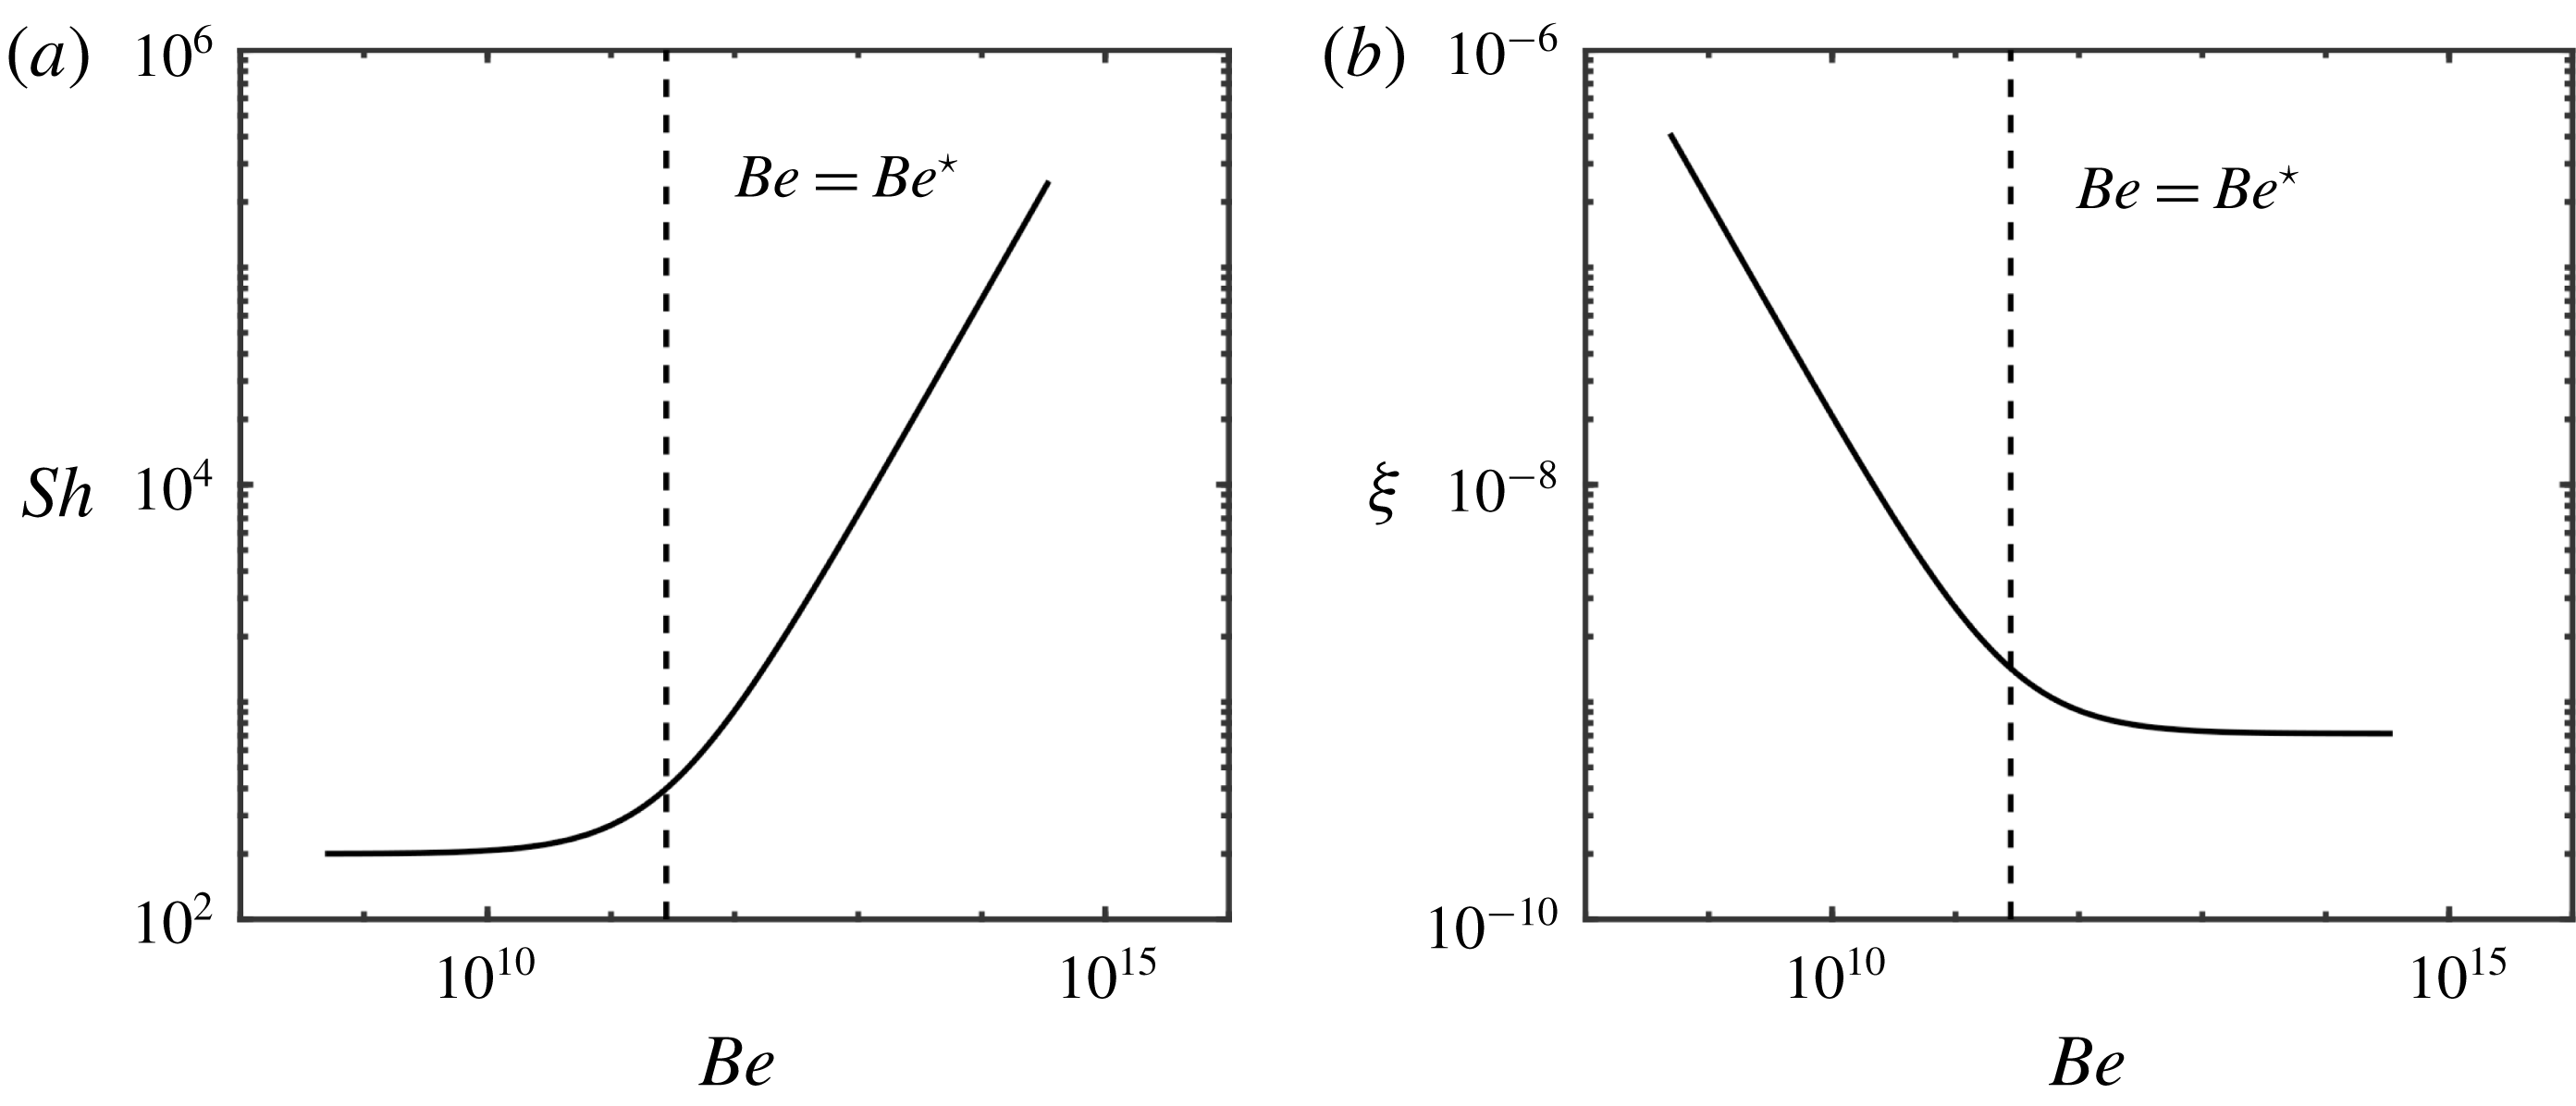
(a) Analytical solution of Sherwood number
 $Sh$
as a function of Bejan number
 $Be$
for parameter values listed in table 1; (b) analytical solution of the efficiency
 $\unicode[STIX]{x1D709}$
as a function of Bejan number.

We now look at the asymptotic behaviour of (2.44) for
 $Be\rightarrow 0$
and
 $Be\rightarrow \infty$
, while keeping all the other dimensionless parameters constant, and obtain
 $$\begin{eqnarray}\displaystyle & \displaystyle \lim _{Be\rightarrow 0}Sh\sim \text{const}, & \displaystyle\end{eqnarray}$$
 $$\begin{eqnarray}\displaystyle & \displaystyle \lim _{Be\rightarrow \infty }Sh\sim Be, & \displaystyle\end{eqnarray}$$
 $$\begin{eqnarray}Be\sim Be^{\star }.\end{eqnarray}$$
Since
 $Be$
can be associated with the energy input for filtration operations and
 $Sh$
is the quantity to maximize, we define the overall filtration performance index,
 $\unicode[STIX]{x1D709}$
, as:
 $$\begin{eqnarray}\unicode[STIX]{x1D709}={\displaystyle \frac{Sh}{Be}},\end{eqnarray}$$
where the higher the value of
 $\unicode[STIX]{x1D709}$
, the higher the membrane efficiency both in terms of permeate flux and energy input. Combining (2.47) with (2.45a
) and (2.45b
), one obtains
 $$\begin{eqnarray}\unicode[STIX]{x1D709}\sim {\displaystyle \frac{1}{Be}},\quad Be\rightarrow 0,\end{eqnarray}$$
and
 $$\begin{eqnarray}\unicode[STIX]{x1D709}\sim \text{const }Be\rightarrow \infty ,\end{eqnarray}$$
respectively. Figure 2(a,b) shows the relationship between the Sherwood and the Bejan numbers as defined by (2.44) for the set of parameters listed in table 1, and the membrane performance index
 $\unicode[STIX]{x1D709}$
, respectively. The dashed line is the transition
 $Be=Be^{\star }$
between the two scaling behaviours. The scalings (2.45)–(2.49) suggest that an increase in the inlet velocity (or, equivalently, pressure drop) leads to an increase in the permeate flux after a certain threshold (
 $Be^{\star }$
) is overcome. However, the overall system performance drops as a result and reaches a plateau when
 $Be\rightarrow \infty$
: at high flow rates, the increased energy requirement to sustain a given pressure drop outweighs any benefits due to reduced fouling. This suggests (and will be confirmed in the following) that under these conditions, surface topology modifications may better impact membrane performance than morphological changes (e.g. the adoption of spacers). Instead, when
 $Be\rightarrow 0$
,
 $Sh$
does not depend strongly on the pressure drop.
While the scaling behaviour (2.48) and (2.49) is obtained for the benchmark case of a rectangular membrane, in the following we move forward by, first, validating the proposed model equations against experimental results on fouled rectangular membranes (§ 3), and then generalize the approach to membranes with complex morphological and topological features (i.e. additional length scales) (§ 4).
3 Numerical model validation
In the following, we proceed by validating (i) the model (2.1)–(2.14) against experimental data and (ii) the scaling relationships between the quantities of interest.
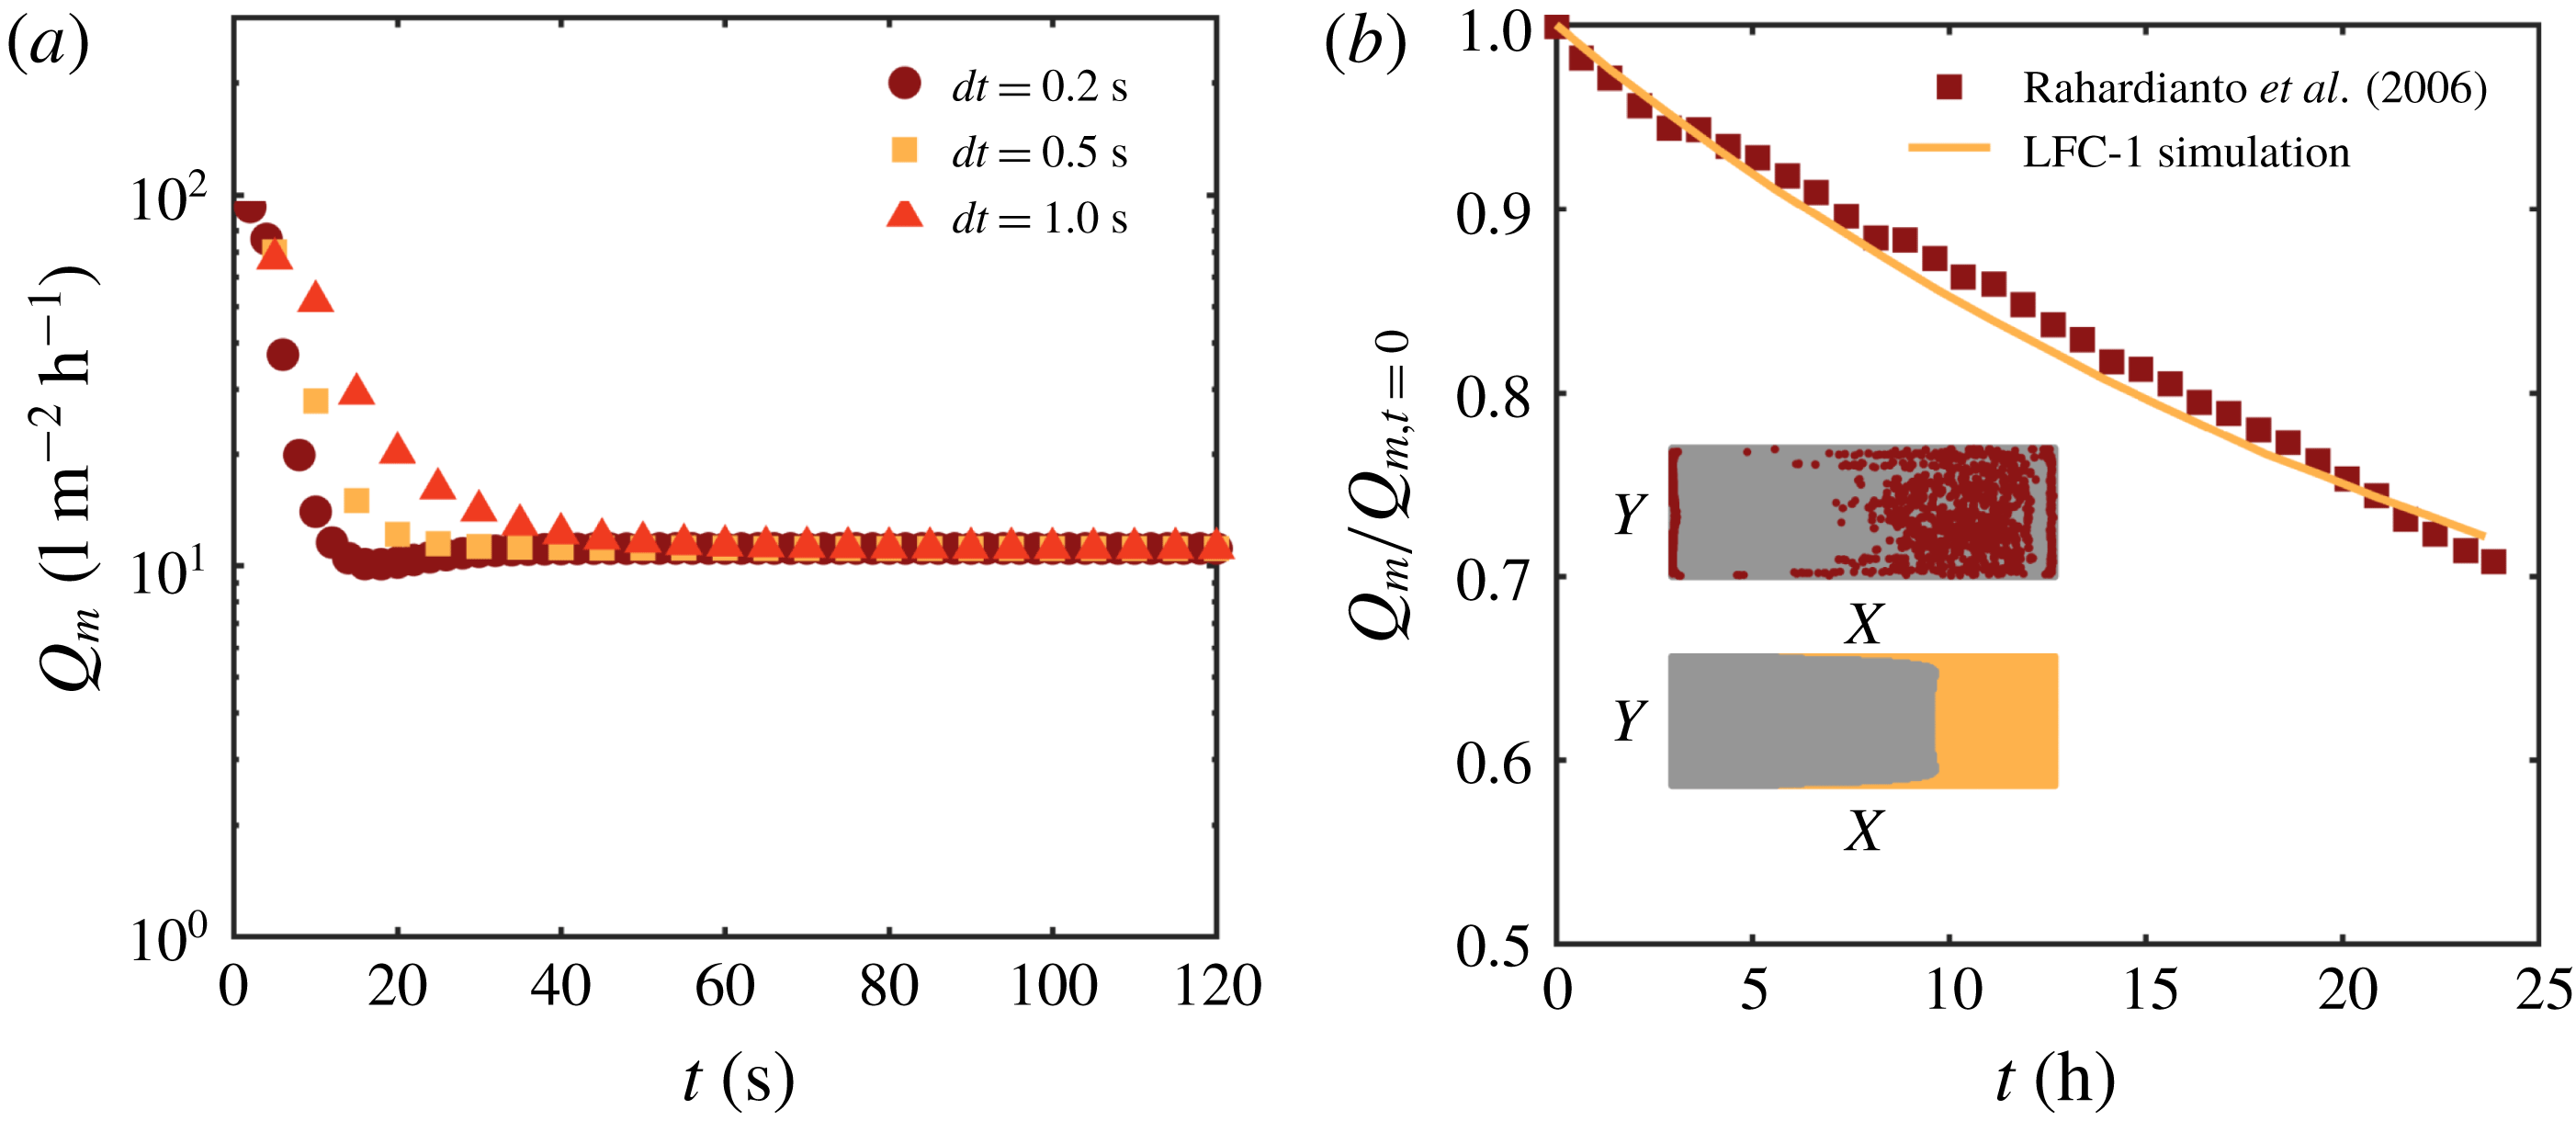
(a) Simulated permeate flux for different time steps. Results show that the steady-state solution is reached around
 $T\approx 60$
s; (b) Comparison between dynamic measurements of permeate flux collected by Rahardianto et al. (Reference Rahardianto, Shih, Lee and Cohen2006) (symbols) and simulated permeate flux decrease (solid line). The inset shows a comparison between the digitalized experimental steady-state fouling pattern (top) and the simulated one (bottom).

3.1 Implementation and convergence study
We implement (2.1)–(2.14) in the finite-volume OpenFOAM® framework, by developing the customized solver SUMs (Stanford University Membrane solver). The solver is explicit in time and second order in space. A convergence study is performed using a straight channel of dimensions
 $H\times L\times B=2\times 70\times 5~\text{mm}^{3}$
. The permeate flux across the membrane
 $Q_{m}(T)$
(
 $\text{l}~\text{m}^{-2}~\text{h}^{-1}$
) is calculated using three different time steps
 $dT=\{0.2,0.5,1.0\}$
s, and simulated for
 $T_{max}=120~\text{s}$
. Figure 3 shows the calculated
 $Q_{m}(T)$
for the three different scenarios. The three transient simulations converge to the same steady state, independently of the time step. The steady-state solution is achieved at
 $T\approx 60~\text{s}$
. For simulations involving non-rectangular geometries, we run the simulations for 400 s to ensure steady state is reached. In the next section, we proceed with validating the code against fouling experiments.
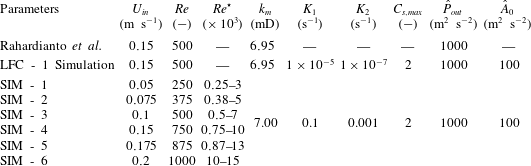
Parameters of all numerical simulations. First row: parameters from the experimental study on low fouling composite (LFC) membranes by Rahardianto et al. (Reference Rahardianto, Shih, Lee and Cohen2006); second row: parameters of the numerically simulated experiment by Rahardianto et al. (Reference Rahardianto, Shih, Lee and Cohen2006). Other rows: parameters of the synthetic examples (SIM - 1 to SIM - 6) of § 4 with Darcy number
 $Dc=1.967\times 10^{-10}$
and Schmidt number
 $Sc=500$
.

3.2 Experimental validation
To validate the model proposed in § 2 and the developed solver, we compare numerical simulations of permeate flux decrease over time and fouling development with membrane fouling experiments conducted by Rahardianto et al. (Reference Rahardianto, Shih, Lee and Cohen2006). In Rahardianto et al.’s (Reference Rahardianto, Shih, Lee and Cohen2006) study, fouling experiments are performed using a low fouling composite (LFC) membrane with crystallized gypsum as the foulant. Both steady-state and transient measurements of permeate flux, as well as final fouling patterns, are provided. In the following, we use the time-varying permeate flux measurements and the final fouled membrane image reported by Rahardianto et al. (Reference Rahardianto, Shih, Lee and Cohen2006) as the benchmark.
The simulation parameters are set to match the experimental set-up and operating conditions. Table 1 lists all the experimental parameters used in the simulation. Since measurements of the membrane permeability are not provided,
 $k_{m}$
is estimated from the pressure and flux measured during a clean water experiment through (2.11), where
 $C_{b}$
and
 $C_{s}$
are set to zero. The coefficient
 $A_{0}$
is fitted to match the steady-state flux at
 $T\rightarrow \infty$
,
 $Q_{m}(T=\infty )$
.
The coefficients
 $K_{1}$
,
 $K_{2}$
and
 $C_{s,max}$
in (2.14), not provided by Rahardianto et al. (Reference Rahardianto, Shih, Lee and Cohen2006), are estimated as follows: following the experimental observations by Xie et al. (Reference Xie, Murdoch and Ladner2014) where foulant accumulated on the membrane is approximately
 $C_{s,max}=1.44C_{0}$
(i.e.
 $2{-}4$
times the bulk concentration) for
 $C_{0}=0.4{-}0.6~\text{M}$
, we set the equilibrium foulant concentration to
 $C_{s,max}=2C_{0}$
. The membrane adsorption/desorption rate
 $\unicode[STIX]{x1D703}$
, i.e. the ratio between
 $K_{2}$
and
 $K_{1}$
,
 $\unicode[STIX]{x1D703}:=K_{2}/K_{1}$
varies from
 $0.1$
to
 $0.001$
(Jones & O’Melia Reference Jones and O’Melia2000). In our study, we set
 $\unicode[STIX]{x1D703}=0.01$
, with
 $K_{1}=1\times 10^{-5}$
and
 $K_{2}=1\times 10^{-7}$
.
Figure 3(b) shows the comparison between the numerical predictions and the experimental measurements of the permeate flux decline as a function of time. The measured and predicted foulant spatial patterns are shown in the inset of figure 3(b). The comparison demonstrates that the system (2.1)–(2.14) can correctly capture both unsteady effects as well as the spatio-temporal evolution of foulant accumulation.
In the following, we perform a series of unsteady fully 3-D numerical studies to assess and elucidate the impact that different modifications of the filtration system have on fouling. We classify them into two broad classes: (i) morphological changes entail modifications of the design of the flow channel (i.e. the spacer morphology) and have characteristic length scales of the order of mm; instead, (ii) topological alterations introduce micro-scale patterns/features on the membrane surface and have characteristic length scales (
 $\unicode[STIX]{x03BC}\text{m}$
or sub-
 $\unicode[STIX]{x03BC}\text{m}$
) that are much smaller than the channel dimensions.
4 Impact of membrane morphology and topology on fouling control
In this section, we use the validated simulator to perform a number of numerical experiments. Our goals are to (i) examine the validity of the analytical expression (2.44) derived in § 2.3, (ii) elucidate the correlation between local hydrodynamics, CP and fouling, (iii) study the transient behaviour of foulant accumulation and (iv) develop a scaling analysis/framework at the system level able to capture both morphological and topological modifications of the membrane for performance optimization.
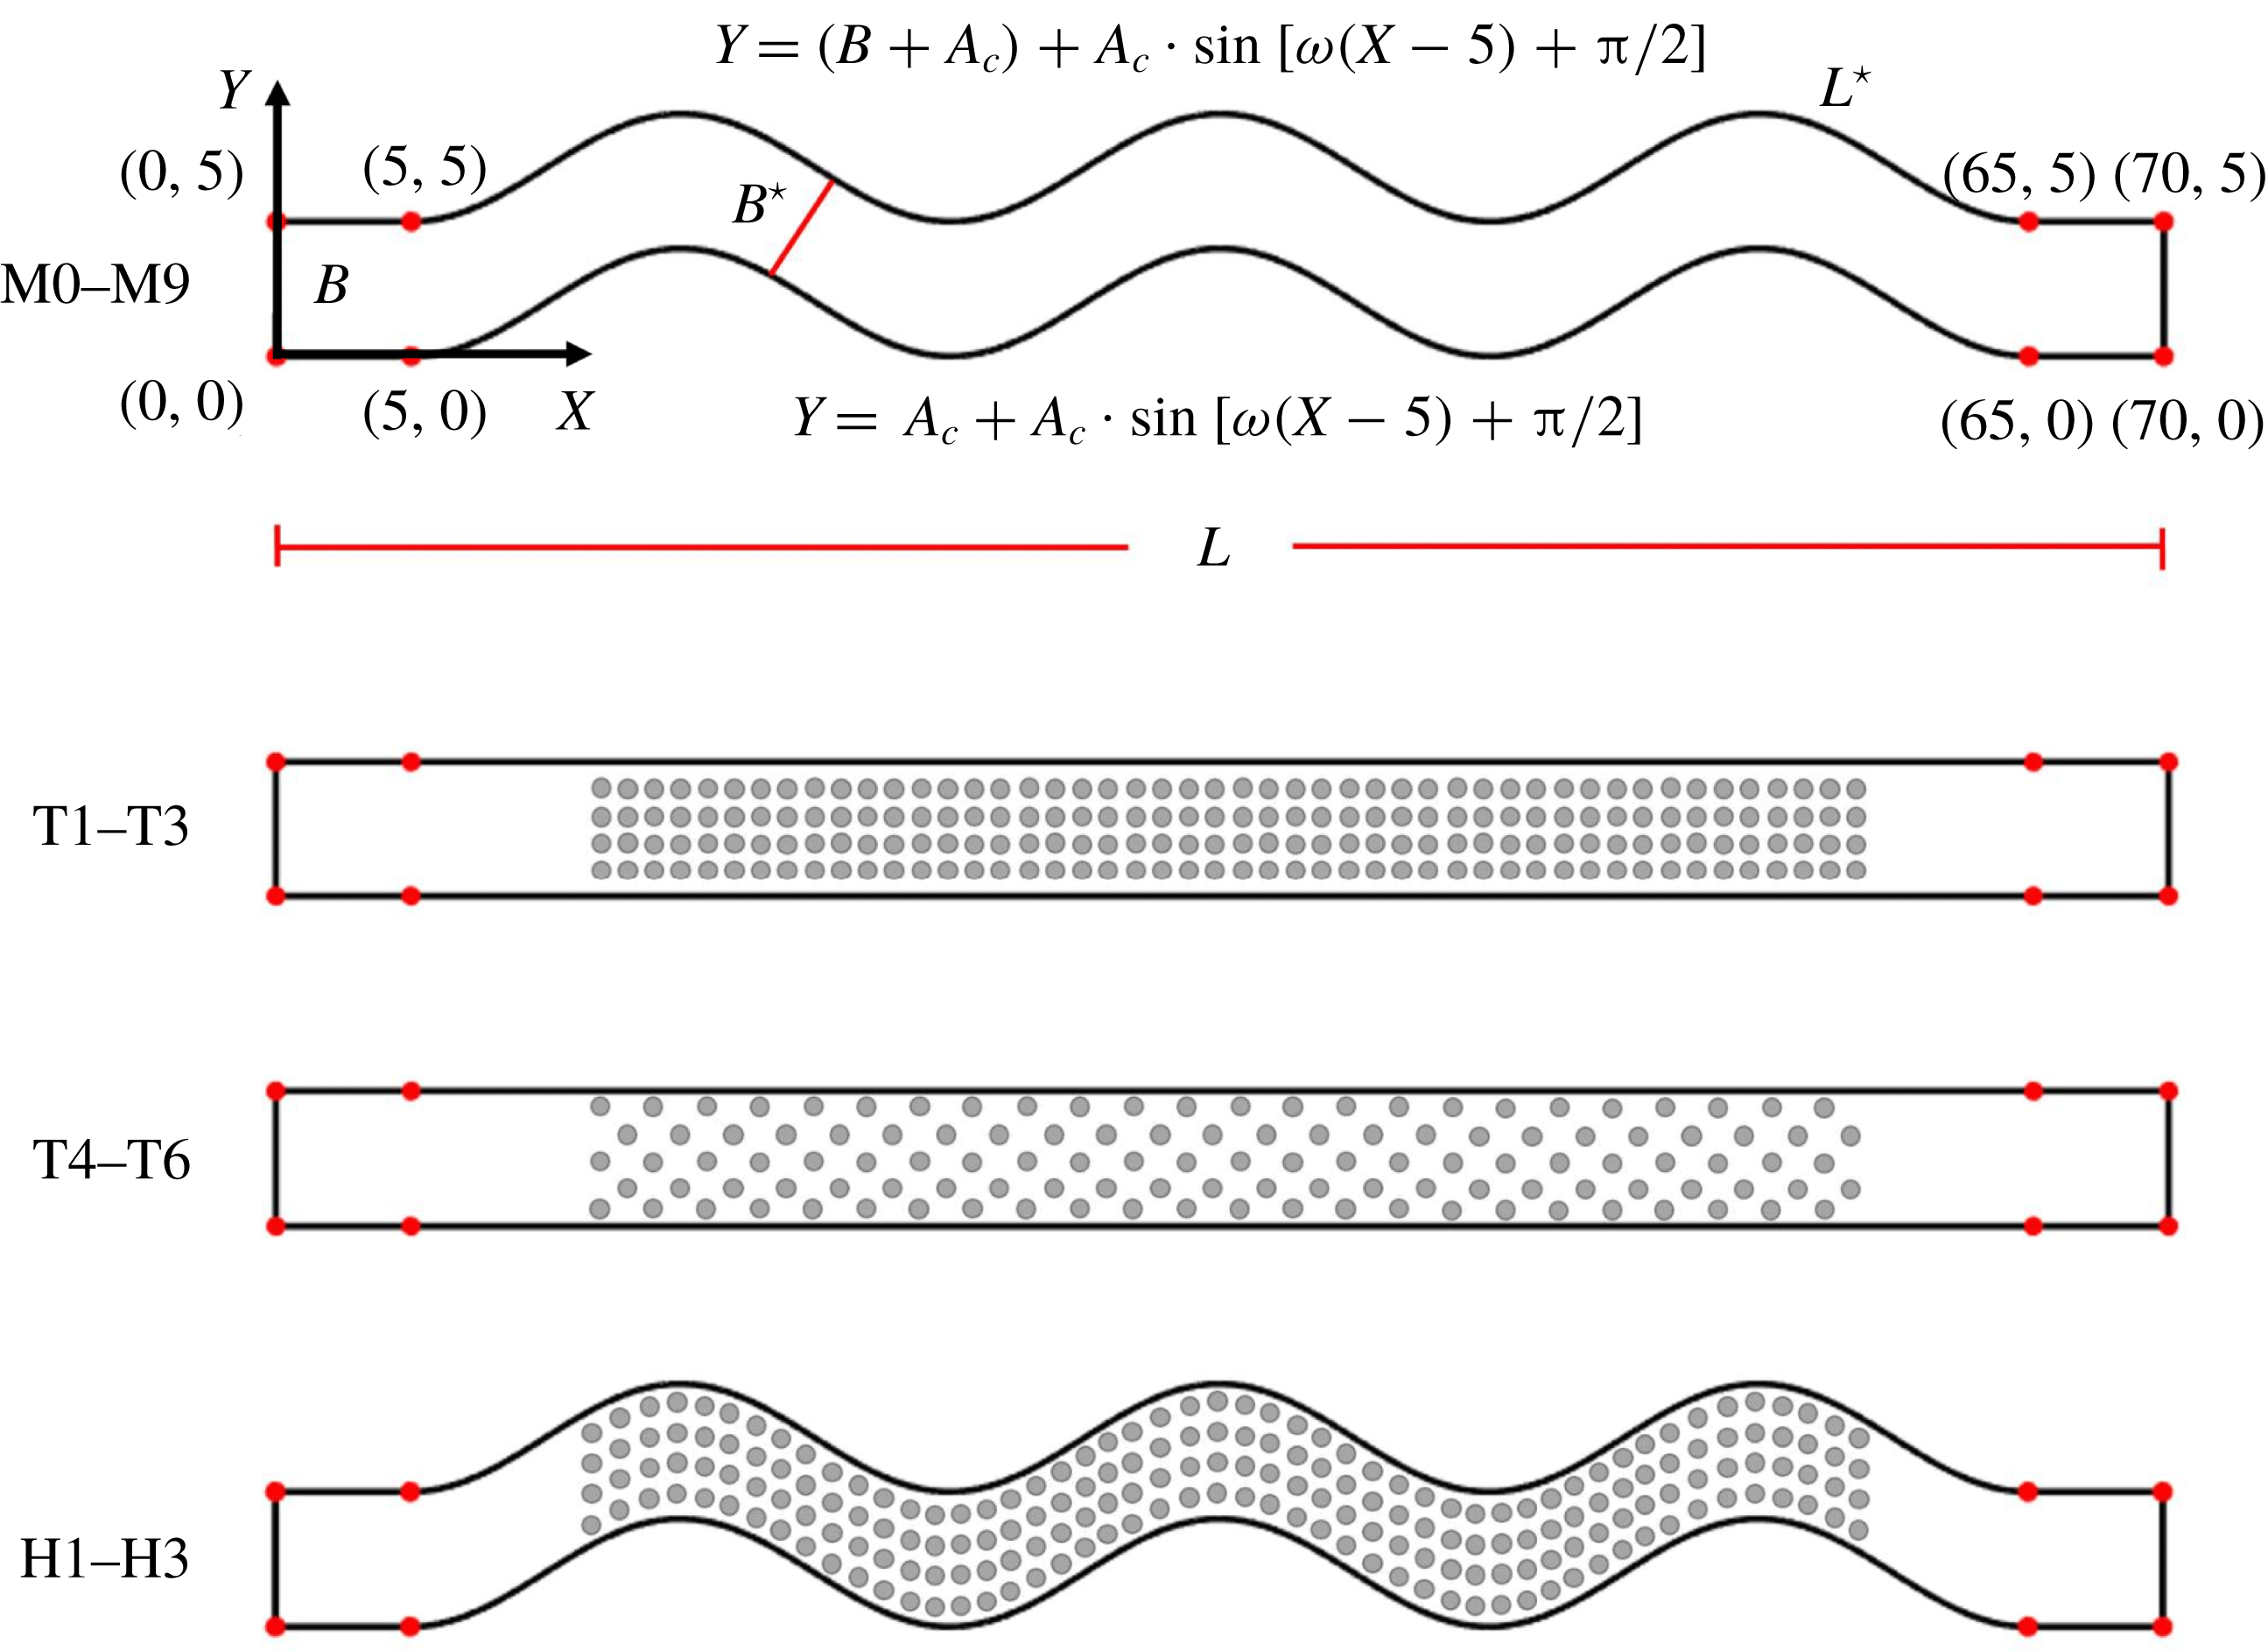
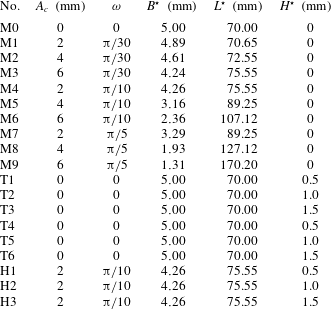
Schematic of the channel geometries investigated. Designs M0–M9 involve morphological changes (i.e. various sinusoidal shapes); designs T1–T6 involve topological changes where the membrane is patterned with pillars of different heights and arrangements; H1–H3 are hybrid designs which combine both morphological and topological alteration of the membrane.

Geometry of channel spacers.

4.1 Numerical simulations
We study 18 membrane designs: 9 purely morphological (M1 to M9), 6 purely topological (T1 to T6) and 3 hybrid designs (H7 to H9) which include both topological and morphological modifications (see figure 4). The fully three-dimensional domains contain 500 000–1 000 000 finite-volume cells, depending on the domain geometry, with a density of 10 cells per unit length. A smooth straight channel design (M0) is modelled as the reference case. The morphology of choice in this study is sinusoidal channels of different periods and amplitudes (Xie et al.
Reference Xie, Murdoch and Ladner2014). For the designs M1–M9, the membrane shape is defined by the following bottom and top boundaries in the (
 $X,Y$
)-plane,
 $$\begin{eqnarray}\displaystyle & Y=(A_{c}+B)+A_{c}\sin [\unicode[STIX]{x1D714}(X-B)+\unicode[STIX]{x03C0}/2], & \displaystyle\end{eqnarray}$$
 $$\begin{eqnarray}\displaystyle & Y=A_{c}+A_{c}\sin [\unicode[STIX]{x1D714}(X-B)+\unicode[STIX]{x03C0}/2], & \displaystyle\end{eqnarray}$$
 $A_{c}$
and
 $\unicode[STIX]{x1D714}$
are the amplitude and period of the sinusoidal wave, respectively, and
 $B$
is the membrane width. The designs T1–T6 are characterized by micropatterns composed of cylindrical posts of different heights and arrangements: T1, T2 and T3 have square (aligned) patterns with micropillars of different heights, while T4, T5 and T6 designs are characterized by staggered (hexagonal) patterns with three different pillar heights. The hybrid designs H7, H8 and H9 are a combination of morphological and topological changes with three different pattern heights. Details of all the geometries are given in figure 4 and table 2. For each geometry, we investigate the membrane response to fouling for six different inlet velocities (
 $U_{in}$
) with Reynolds number,
 $$\begin{eqnarray}Re={\displaystyle \frac{U_{in}B}{\unicode[STIX]{x1D708}}},\end{eqnarray}$$
ranging from 250 to 1000, as listed in table 1, for a total of 114 simulations.
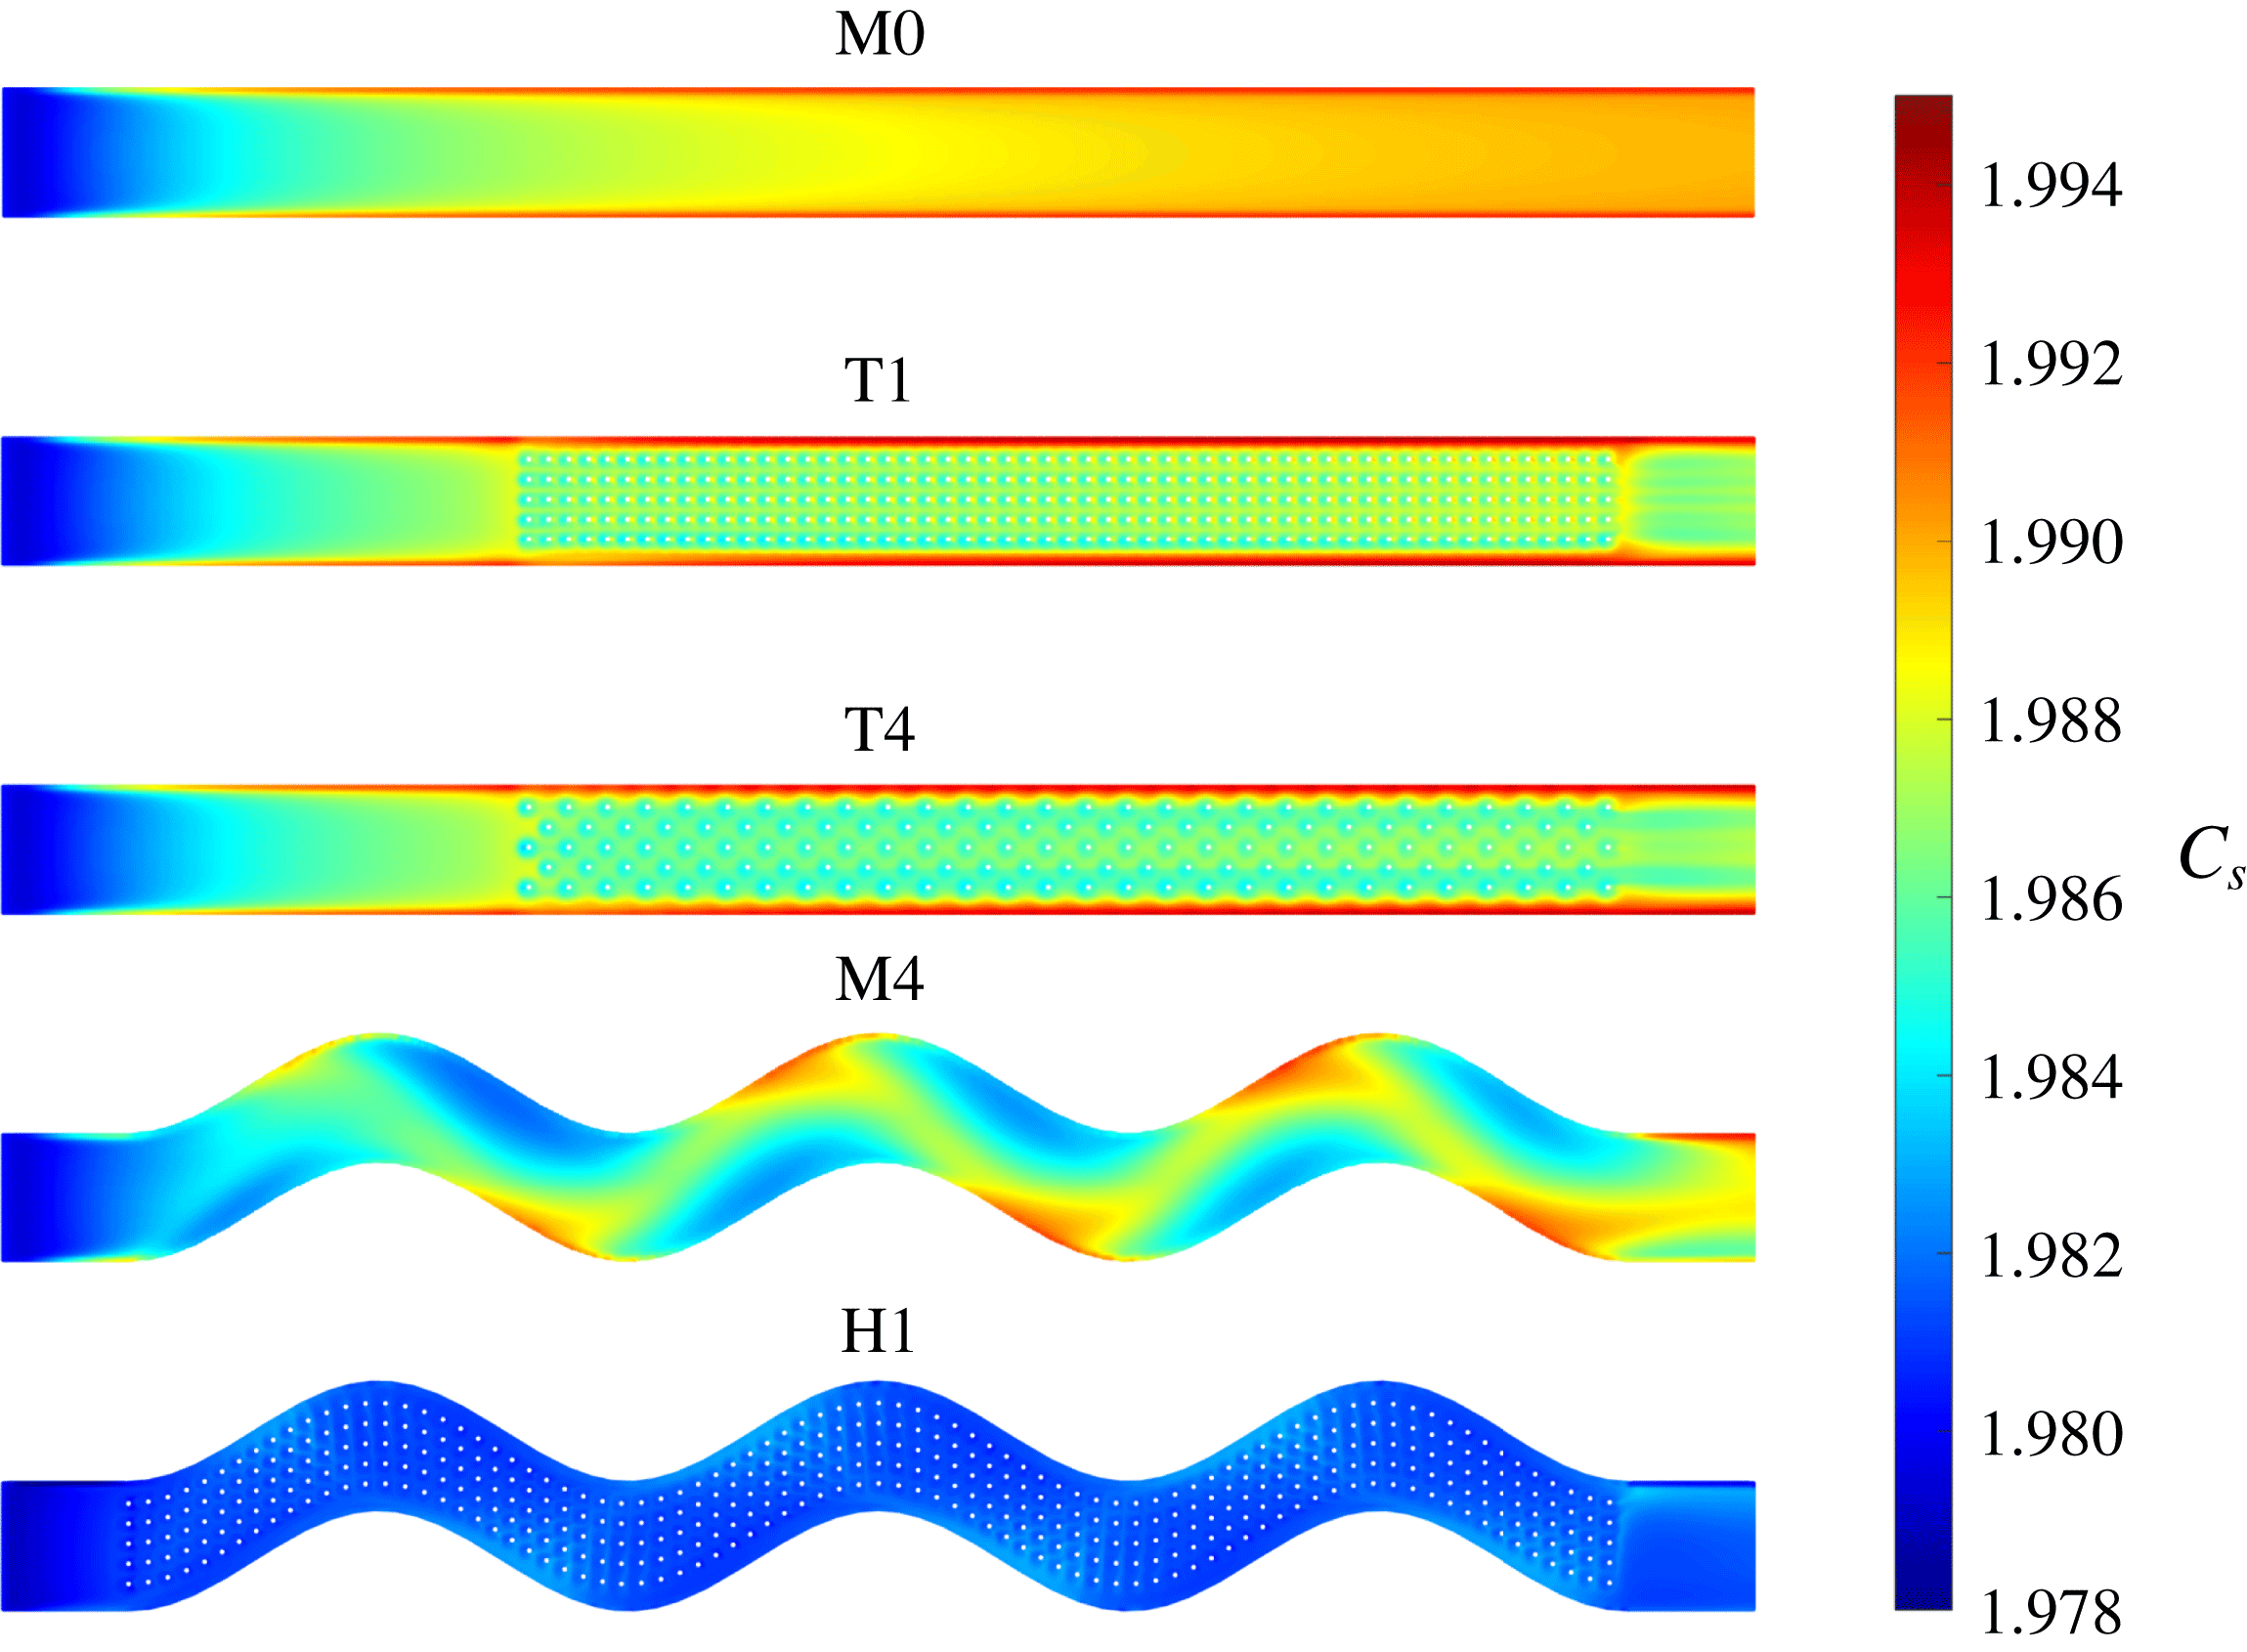
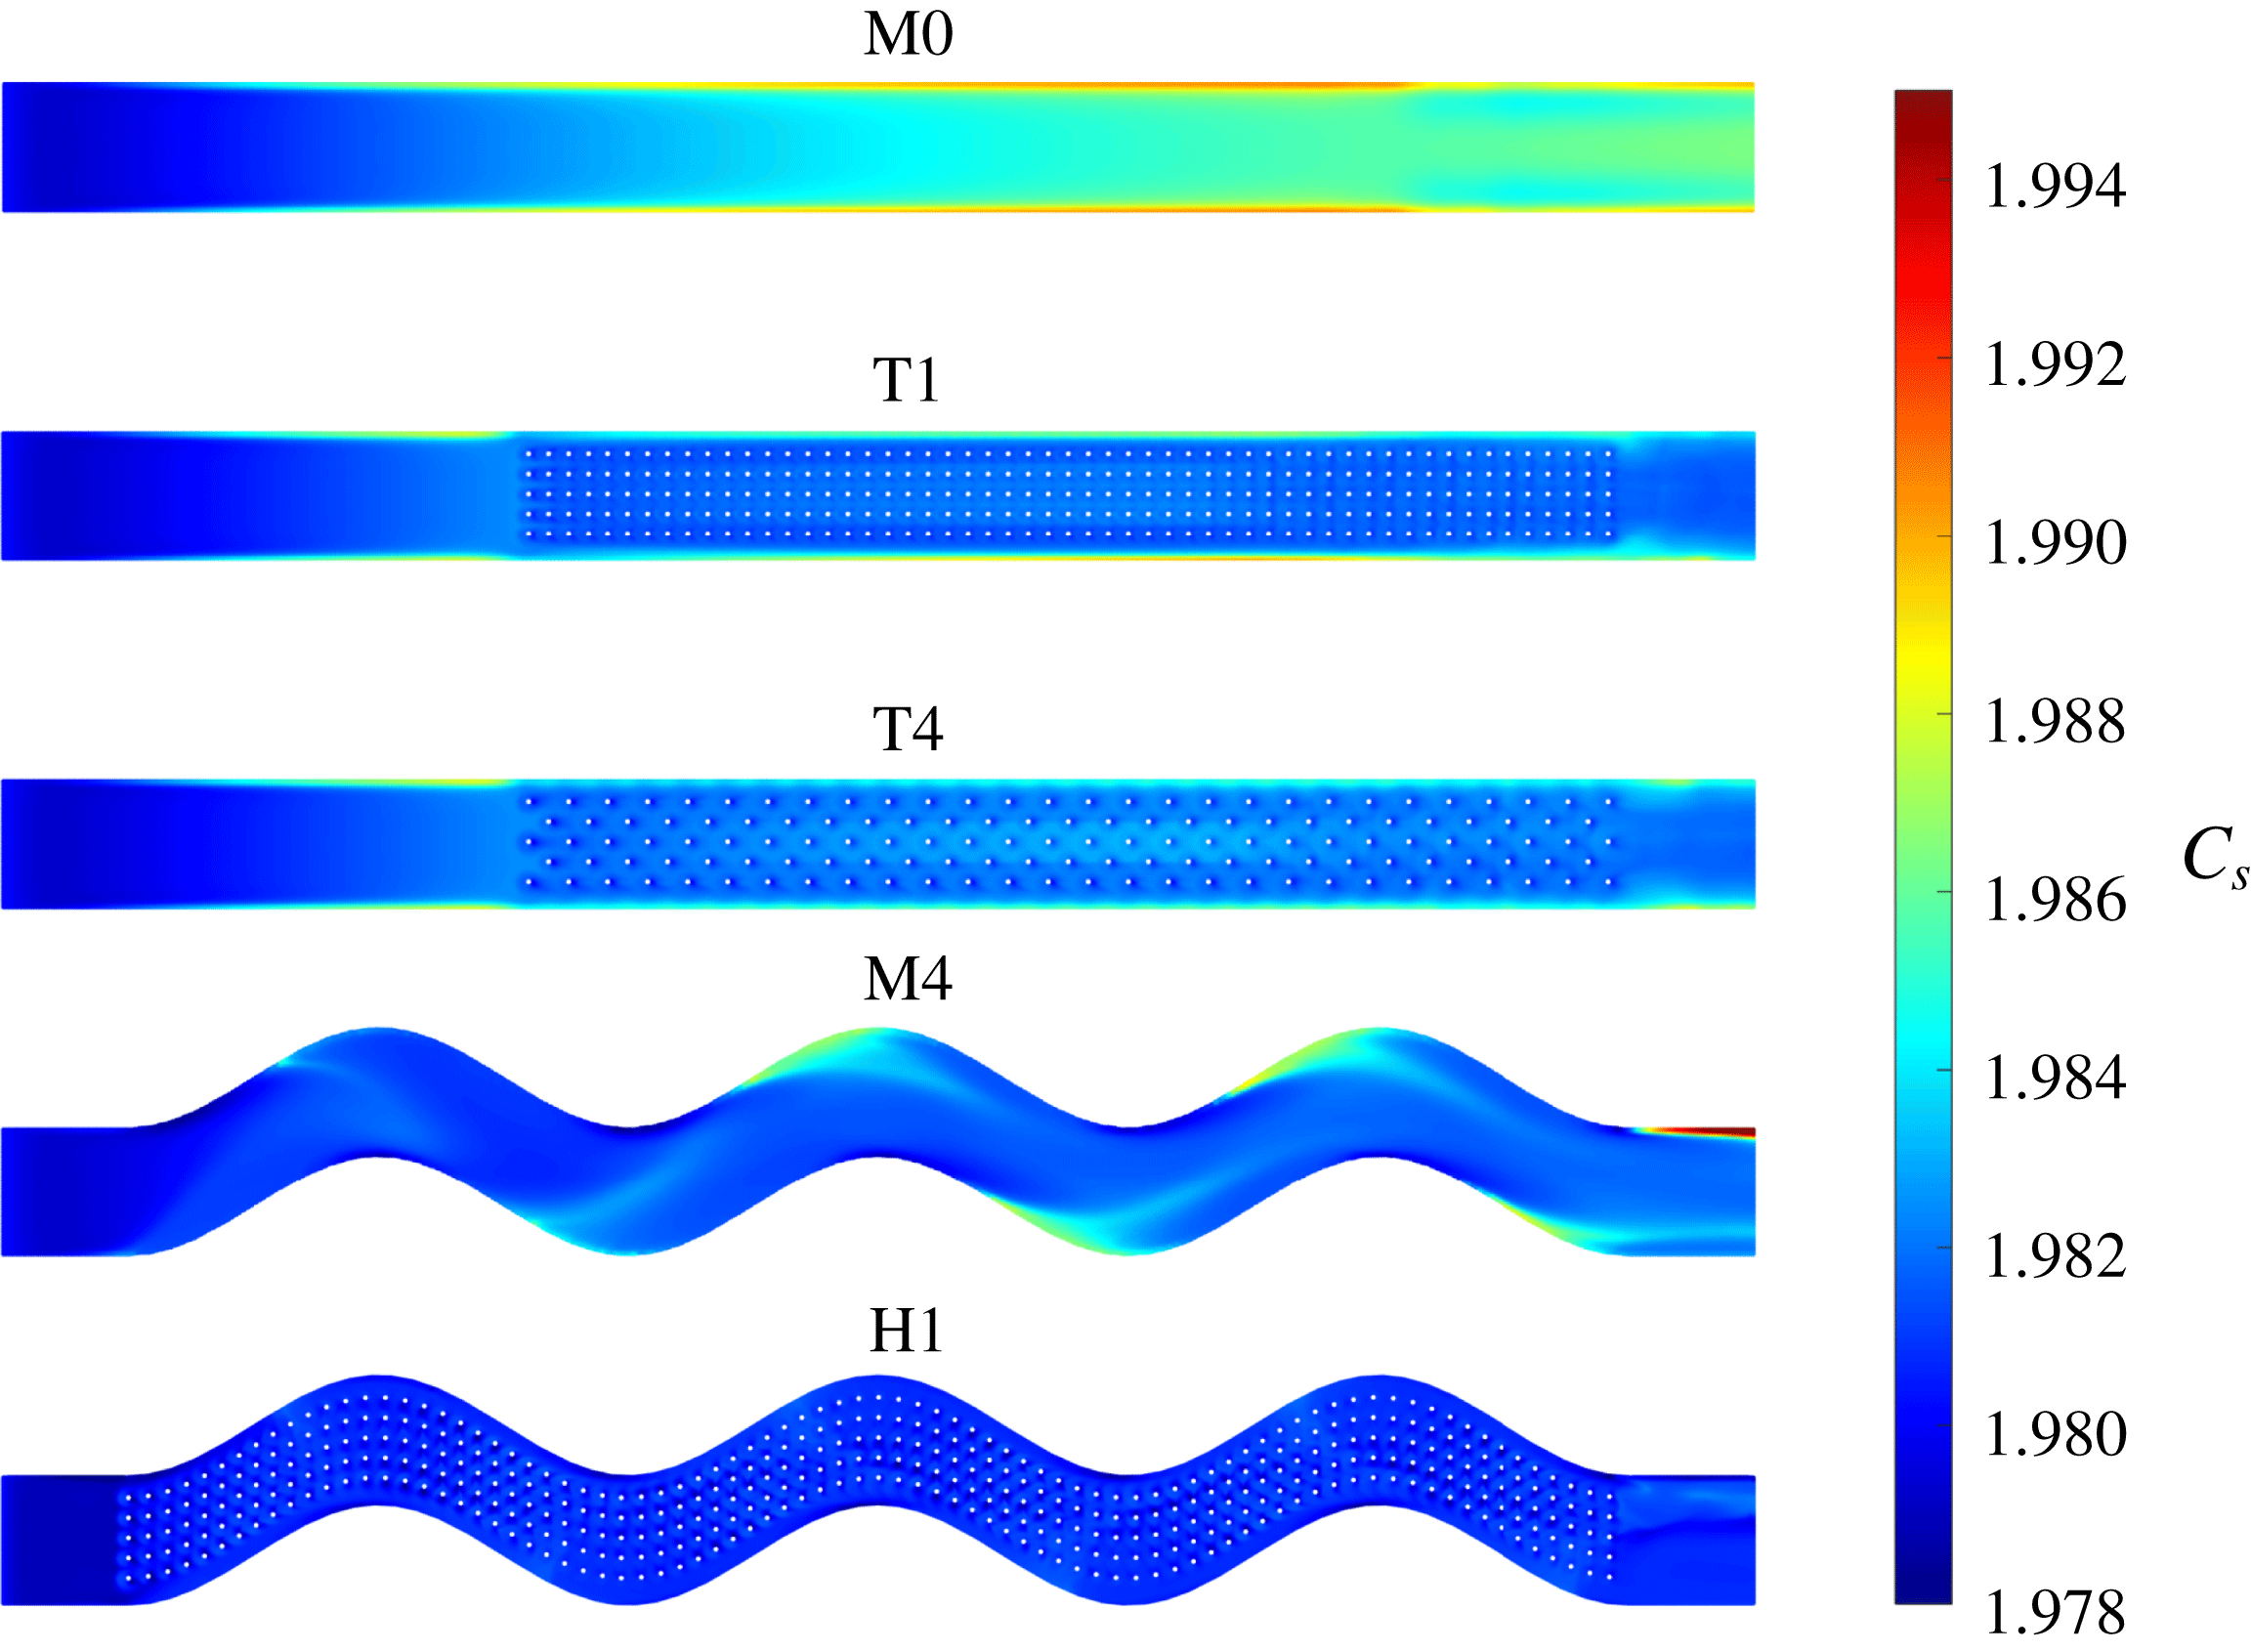
Example results are shown in figures 5 and 6 which provide the spatial distribution of the foulant for membrane types M0, T1, T4, M4 and H7 and two different inlet velocities. Figure 5 demonstrates how morphological or topological changes of the membrane can significantly impact foulant distribution. Additionally, a comparison between figures 5 and 6 suggests that higher inlet velocities significantly decrease foulant accumulation. This is expected since higher inlet (and local) velocities are associated with increased shear stress on the membrane, and reduced foulant accumulation. In figure 7, we plot the magnitude
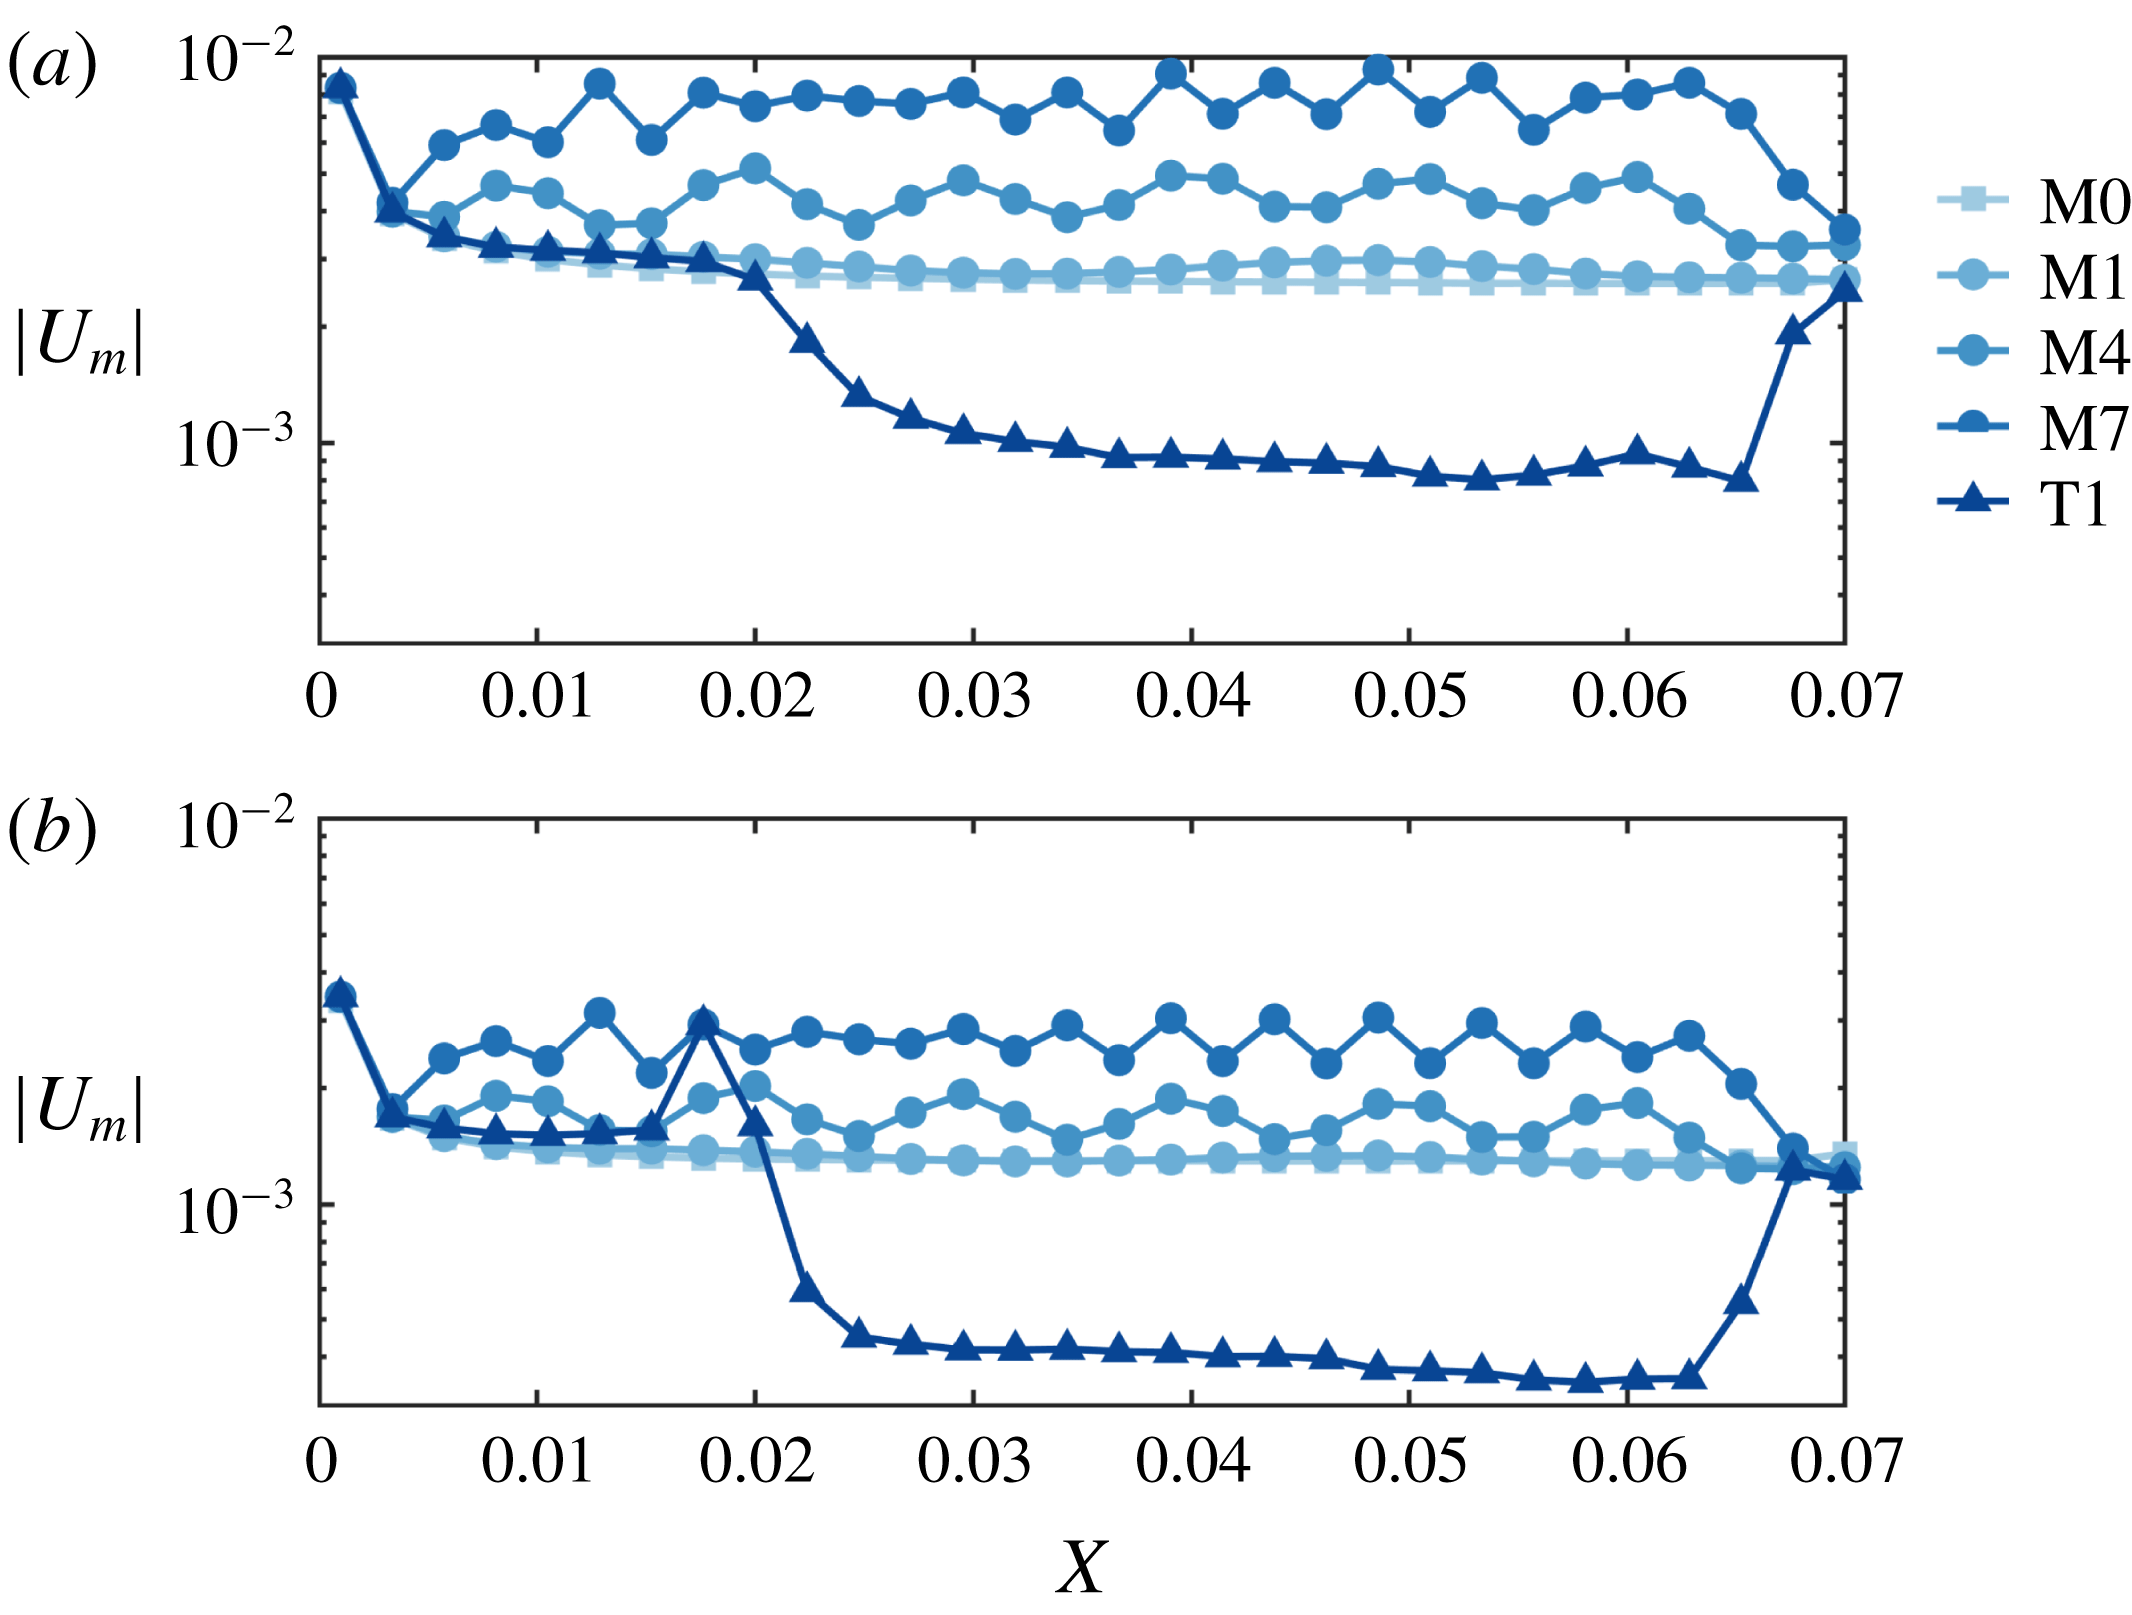
 $|U_{m}|$
of the velocity at the membrane surface, averaged over the channel width, for two fixed inlet velocities and five different geometries M0, M1, M4, M7 and T1,
 $$\begin{eqnarray}|U_{m}|(X)=\int _{0}^{B}\sqrt{U(X,Y,Z=H^{-})^{2}+V(X,Y,Z=H^{-})^{2}}\,\text{d}Y.\end{eqnarray}$$
Figure 7 shows that (i) the mean velocity
 $|U_{m}|(X)$
for designs M1, M4 and M7 is always higher than the straight channel design, and (ii) when the inlet velocity increases, the velocity at the membrane surface for all designs increases.
Steady-state foulant concentration field
 $C_{s}$
for M0, T1, T4, M4 and H1 designs and inlet velocity
 $U_{in}=0.075~\text{m}~\text{s}^{-1}$
.

Steady-state foulant concentration field
 $C_{s}$
for M0, T1, T4, M4 and H1 and inlet velocity
 $U_{in}=0.2~\text{m}~\text{s}^{-1}$
.

Velocity magnitude
 $|U_{m}|(X)$
at the membrane surface. The value is averaged along the
 $Y$
-direction as defined in (4.3). (a,b) Plot
 $|U_{m}|(X)$
for two different inlet velocities
 $U_{in}=0.075$
and
 $U_{in}=0.15$
, respectively.

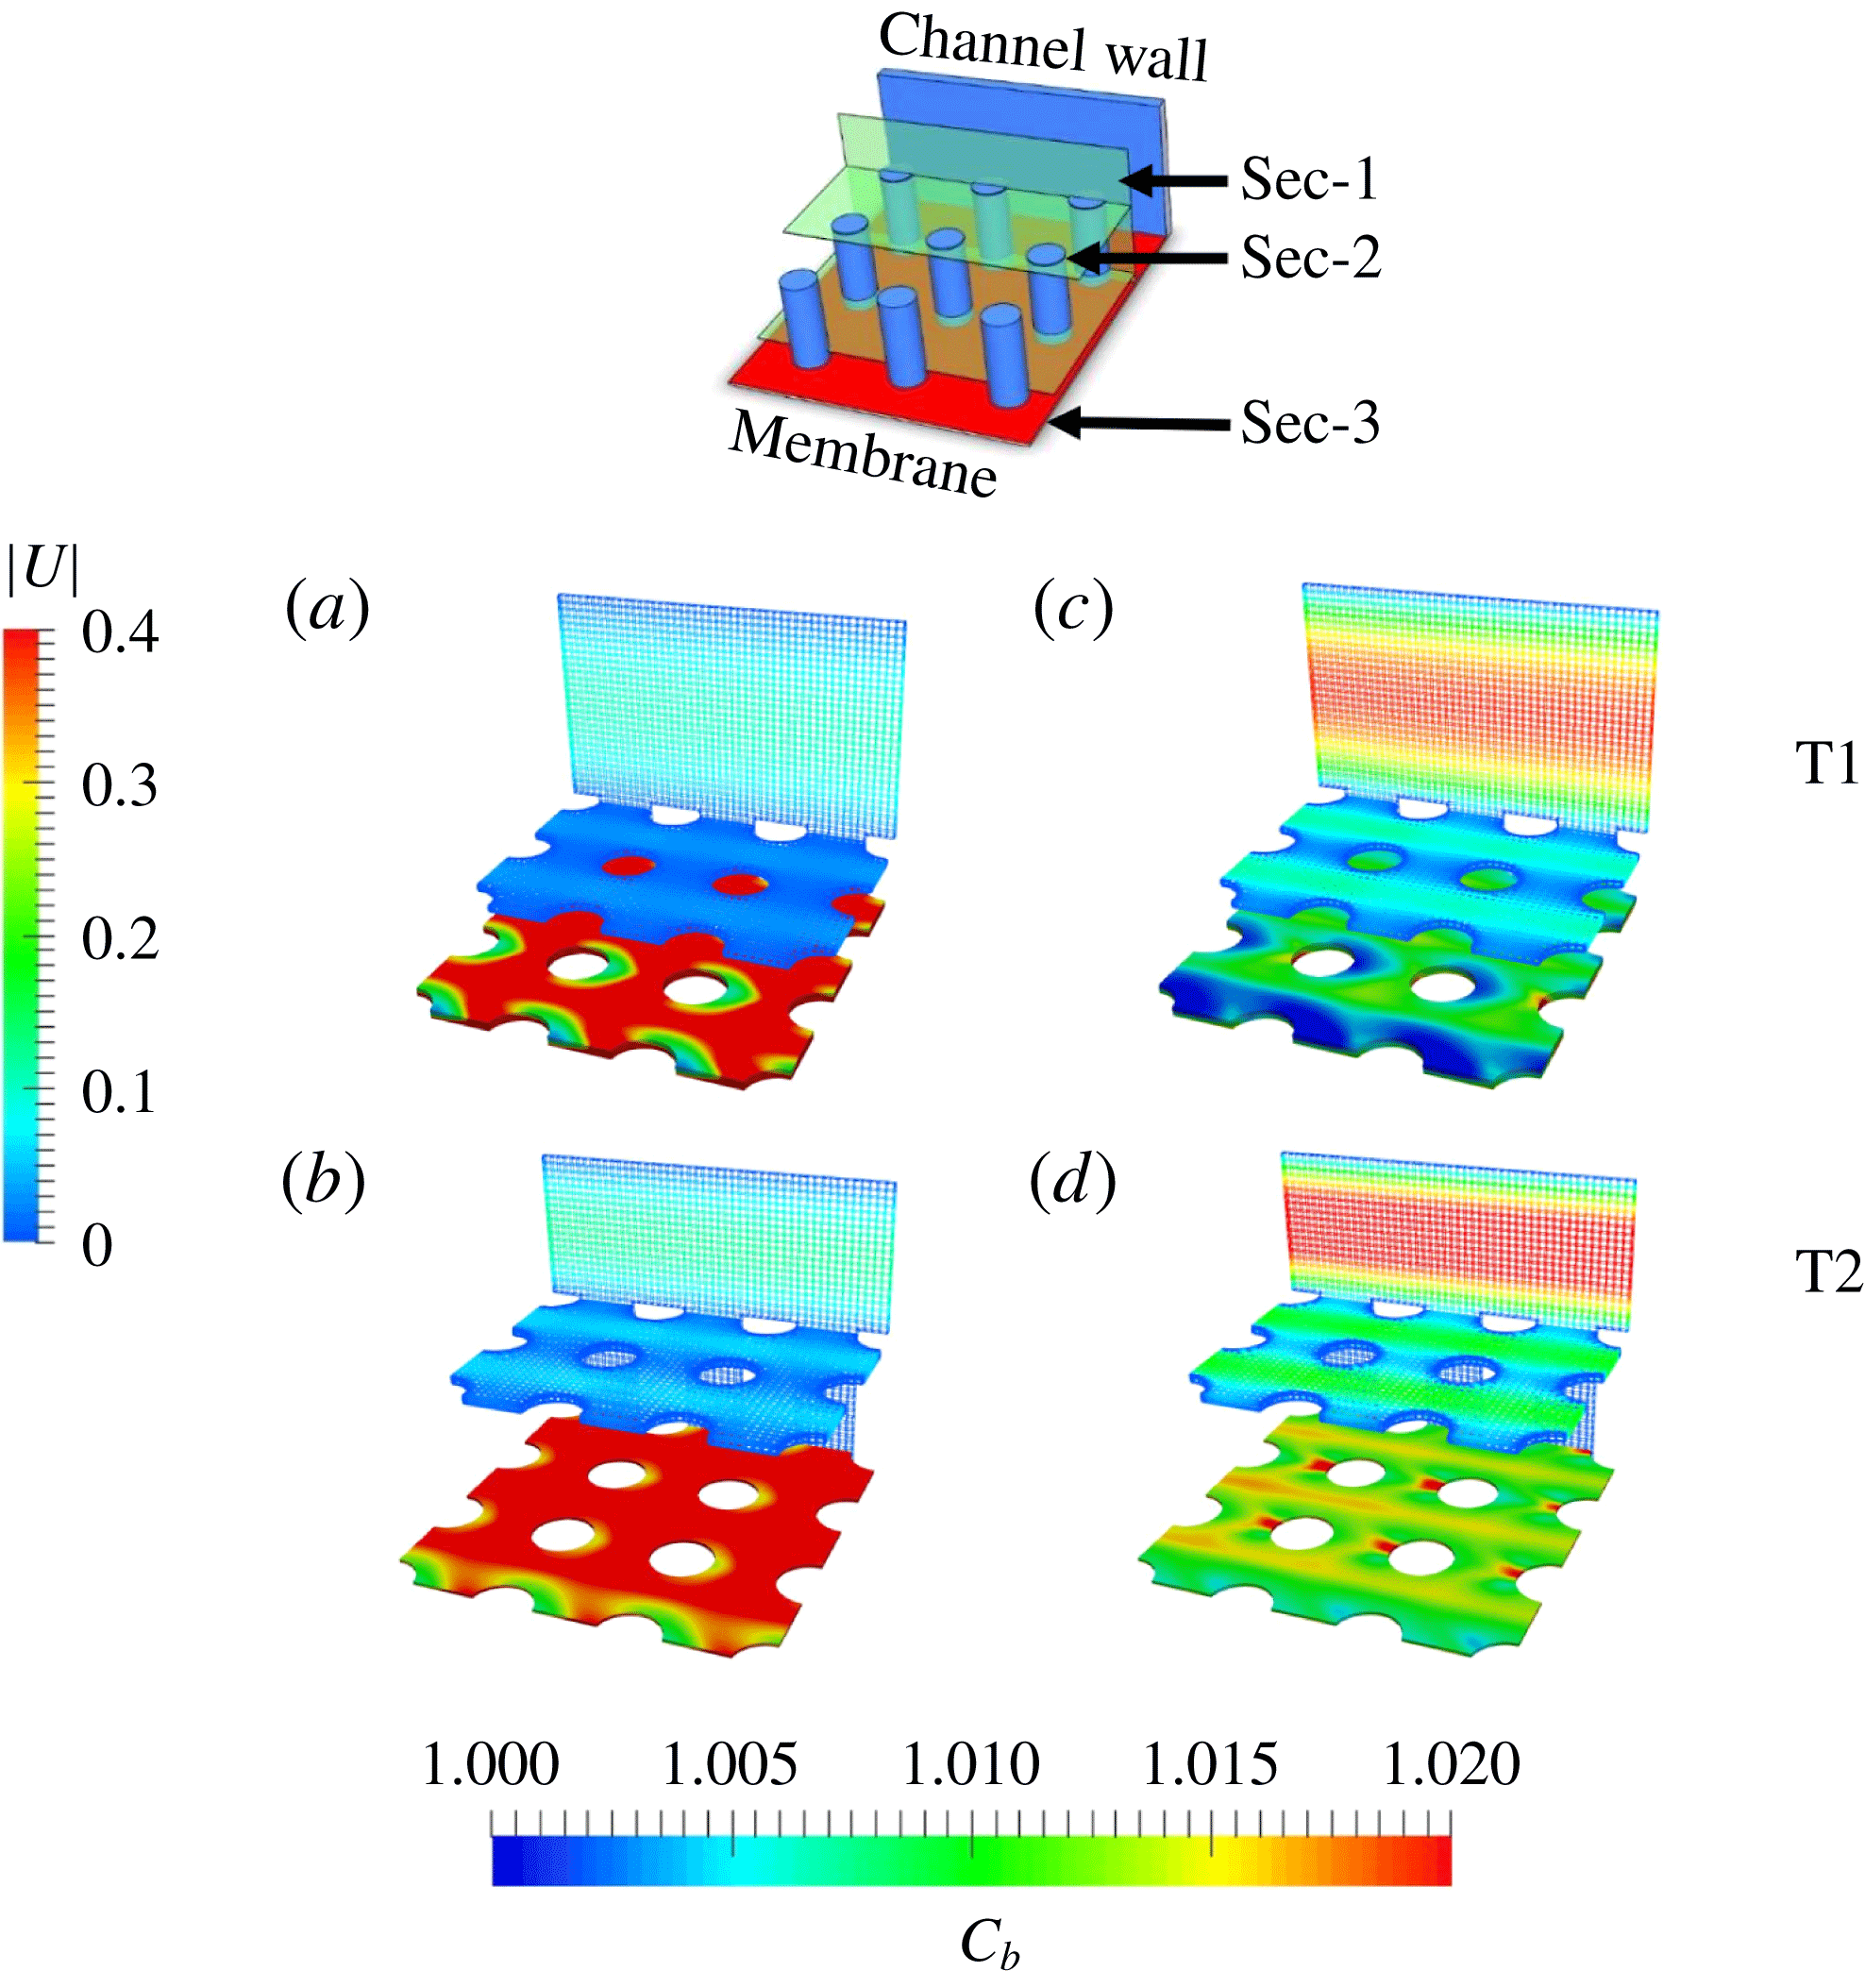
Velocity (sections 1 and 2) and concentration (section 3) distribution in three sections of channels T1 and T2, for two different inlet velocities (
 $U_{in}=0.075~\text{m}~\text{s}^{-1}$
in (a,b), and
 $U_{in}=0.2~\text{m}~\text{s}^{-1}$
in (c,d)). The sections are extracted as follows: section 1 and section 2 are a vertical section (parallel to the
 $X{-}Z$
plane) and a horizontal section (parallel to the
 $X{-}Y$
plane and in proximity of the pattern’s top) and show the velocity distribution; section 3, horizontal and in proximity of the membrane, shows
 $C_{b}$
.

Figure 8 shows the velocity (sections 1 and 2) and concentration (section 3) distribution in three sections of channels T1 and T2, for two different inlet velocities (
 $U_{in}=0.075~\text{m}~\text{s}^{-1}$
in (a,b), and
 $U_{in}=0.2~\text{m}~\text{s}^{-1}$
in (c,d)). The sections are extracted as follows: sections 1 and 2 are a vertical section (parallel to the
 $X{-}Z$
plane) and a horizontal section (parallel to the
 $X{-}Y$
plane and in proximity of the pattern’s top) and show the velocity distribution; section 3, horizontal and in proximity of the membrane, shows
 $C_{b}$
. For lower velocities (figure 8
a,b), T1 and T2 both exhibit strong CP near the membrane surface with small velocity at the interface: with lower flow rates through the pattern, shear stress on the membrane decreases and foulant accumulation is promoted. Instead, for higher inlet velocities (figure 8
c,d), the bulk concentration is smaller near the membrane surface for both cases. However, it is worth noticing that taller pillars, as in the T2 membrane, locally decelerate the flow and reduce antifouling efficiency, compared to their shorter counterparts (T1) where advective mixing near the membrane significantly reduces CP while providing lower flow resistance (and, consequently, pressure drop). Corresponding fouling patterns (
 $C_{s}$
distribution) are shown in figures 5 and 6.
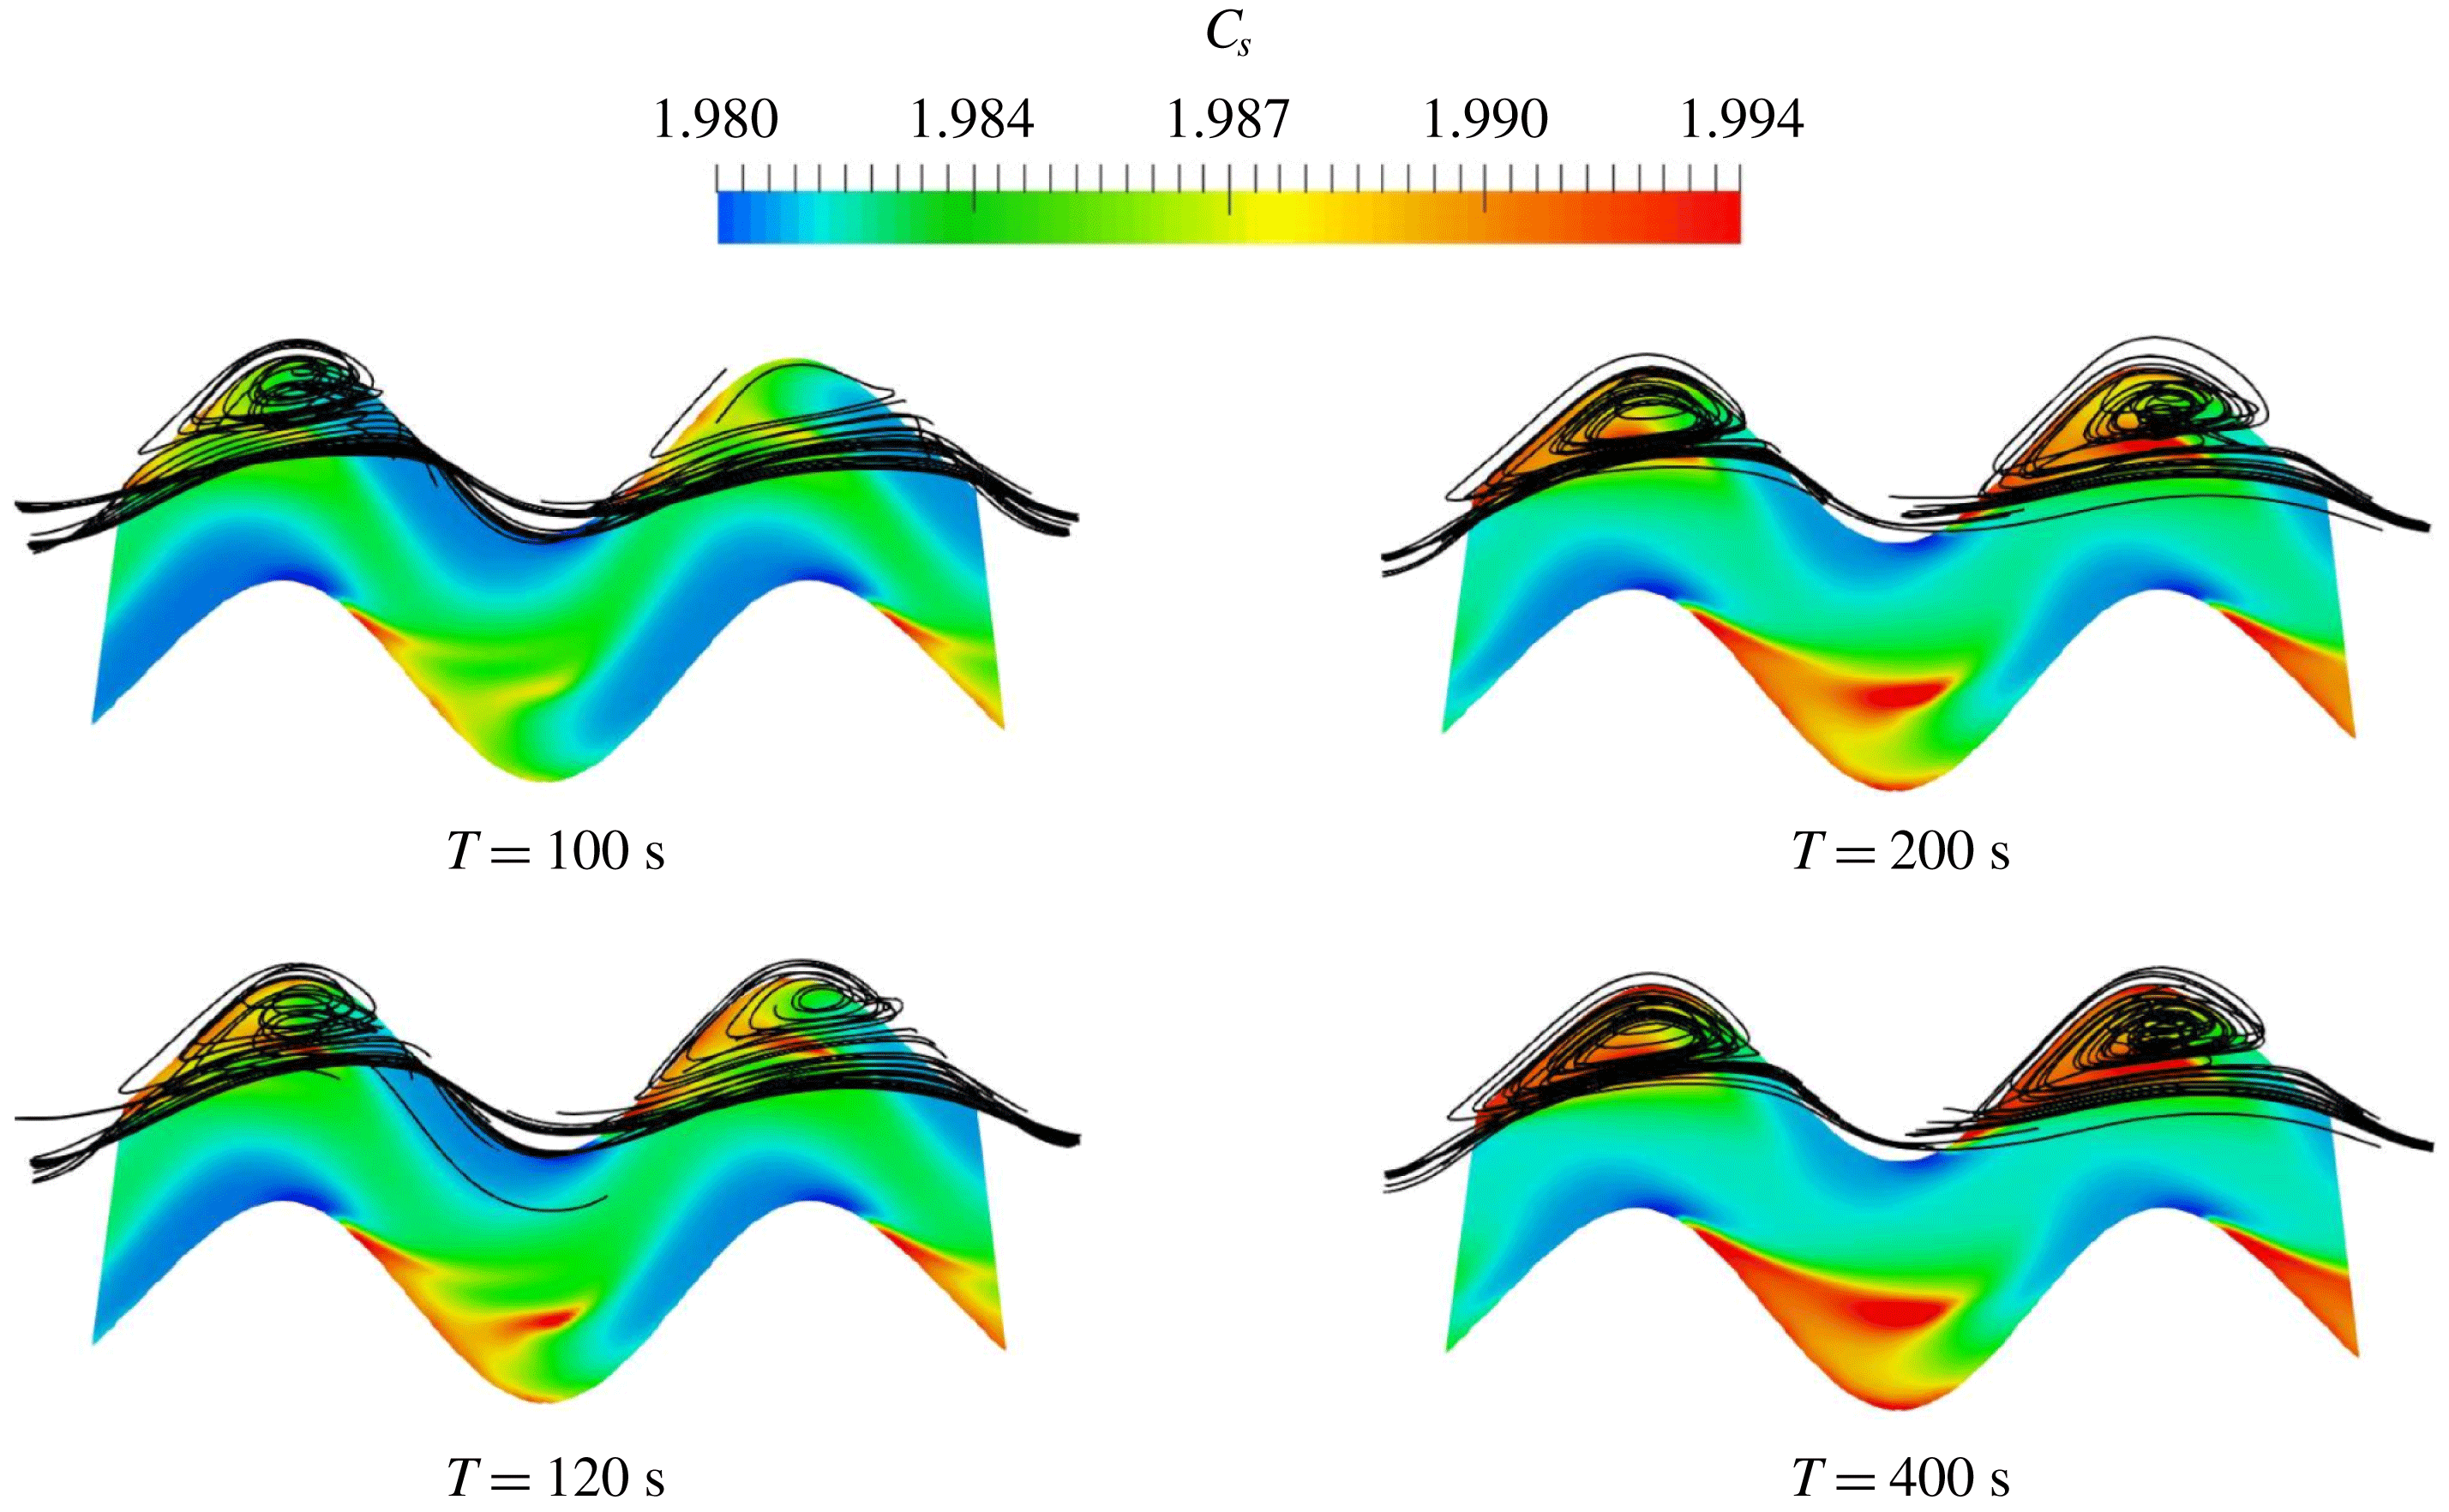
Additionally, unsteady simulations allow one to explore where the fouling initiates and how the foulant grows. We extract one section of the flow channel M7 for the simulation SIM-2, and plot the foulant concentration on the membrane surface
 $C_{s}$
together with the streamlines in the channel at different instances in time, see figure 9. Figure 9 shows that when the flow field is developing, vortices form in the crests and troughs of the sinusoidal channel. At
 $t\approx 120\text{ s}$
, foulant starts to accumulate in the channel, by first nucleating at the centre of the vortex. As time evolves, the foulant accumulation grows following a spatial pattern similar to that of the vortex. The newly developed transient solver is capable of capturing temporal variation of the synergistic effect of hydrodynamics, solute transport and surface fouling process.
Foulant distribution
 $C_{s}$
(colour field) overlaid with streamlines (solid lines) in a portion of channel M7, at four different instances in time (
 $t=100,120,200,400$
s) and for an inlet velocity
 $U_{in}=0.075~\text{m}~\text{s}^{-1}$
.

4.2 Scaling variables for rough and wiggly membranes
The analysis of § 2.2 provides a useful, although incomplete, framework to study membrane performance: in the presence of topological or morphological alterations of the membrane, additional length scales are introduced into the problem, which were not taken into account in the previous analysis. Furthermore, since the input velocity and the length scales associated with the membrane alteration are the primary decision/design variables, an explicit dependence of the filtration performance index
 $\unicode[STIX]{x1D709}$
on Reynolds number is desirable.
In order to quantitatively compare the impact that morphological and topological changes have on fouling, we define the following dimensionless length scales,
 $$\begin{eqnarray}\unicode[STIX]{x1D702}=B^{\star }/B,\quad \text{and}\quad \unicode[STIX]{x1D701}=(H-H^{\star })/H,\end{eqnarray}$$
where
 $0<\unicode[STIX]{x1D702}\leqslant 1$
and
 $0\leqslant \unicode[STIX]{x1D709}\leqslant 1$
, where
 $B^{\star }$
is the closest distance between the channel side walls and
 $H^{\star }$
is the height of the pattern in the
 $Z$
-direction. For a straight channel
 $\unicode[STIX]{x1D702}=1$
, and for a topologically unaltered membrane
 $\unicode[STIX]{x1D701}=1$
, i.e.
 $\unicode[STIX]{x1D702}$
and
 $\unicode[STIX]{x1D701}$
provide measurements of the ‘waviness’ of the channel and of the ‘roughness’ of the membrane surface, respectively. Specifically,
 $\unicode[STIX]{x1D702}$
and
 $\unicode[STIX]{x1D701}$
represent the thinnest channel neck versus the largest width that the fluid can experience in
 $(XY)$
- and
 $(YZ)$
-planes, respectively. Furthermore, we introduce a modified Reynolds number
 $Re^{\star }$
, which accounts for topological and morphological features,
 $$\begin{eqnarray}Re^{\star }=\left(\frac{1}{\unicode[STIX]{x1D702}^{2}\unicode[STIX]{x1D701}}\right)Re.\end{eqnarray}$$
In the following, we will show that the modified Reynolds number
 $Re^{\star }$
allows one to quantitatively compare the performance of membranes with different morphological and topological features under a unified framework. In fact, while the
 $Be$
and
 $Sh$
numbers represent direct estimators of membranes performance,
 $Re^{\star }$
is the primary decision variable as it concurrently prescribes inlet velocity/volumetric flux and membrane geometry.
4.3 Scaling laws
Since (2.44) suggests that both
 $Be$
and
 $Sh$
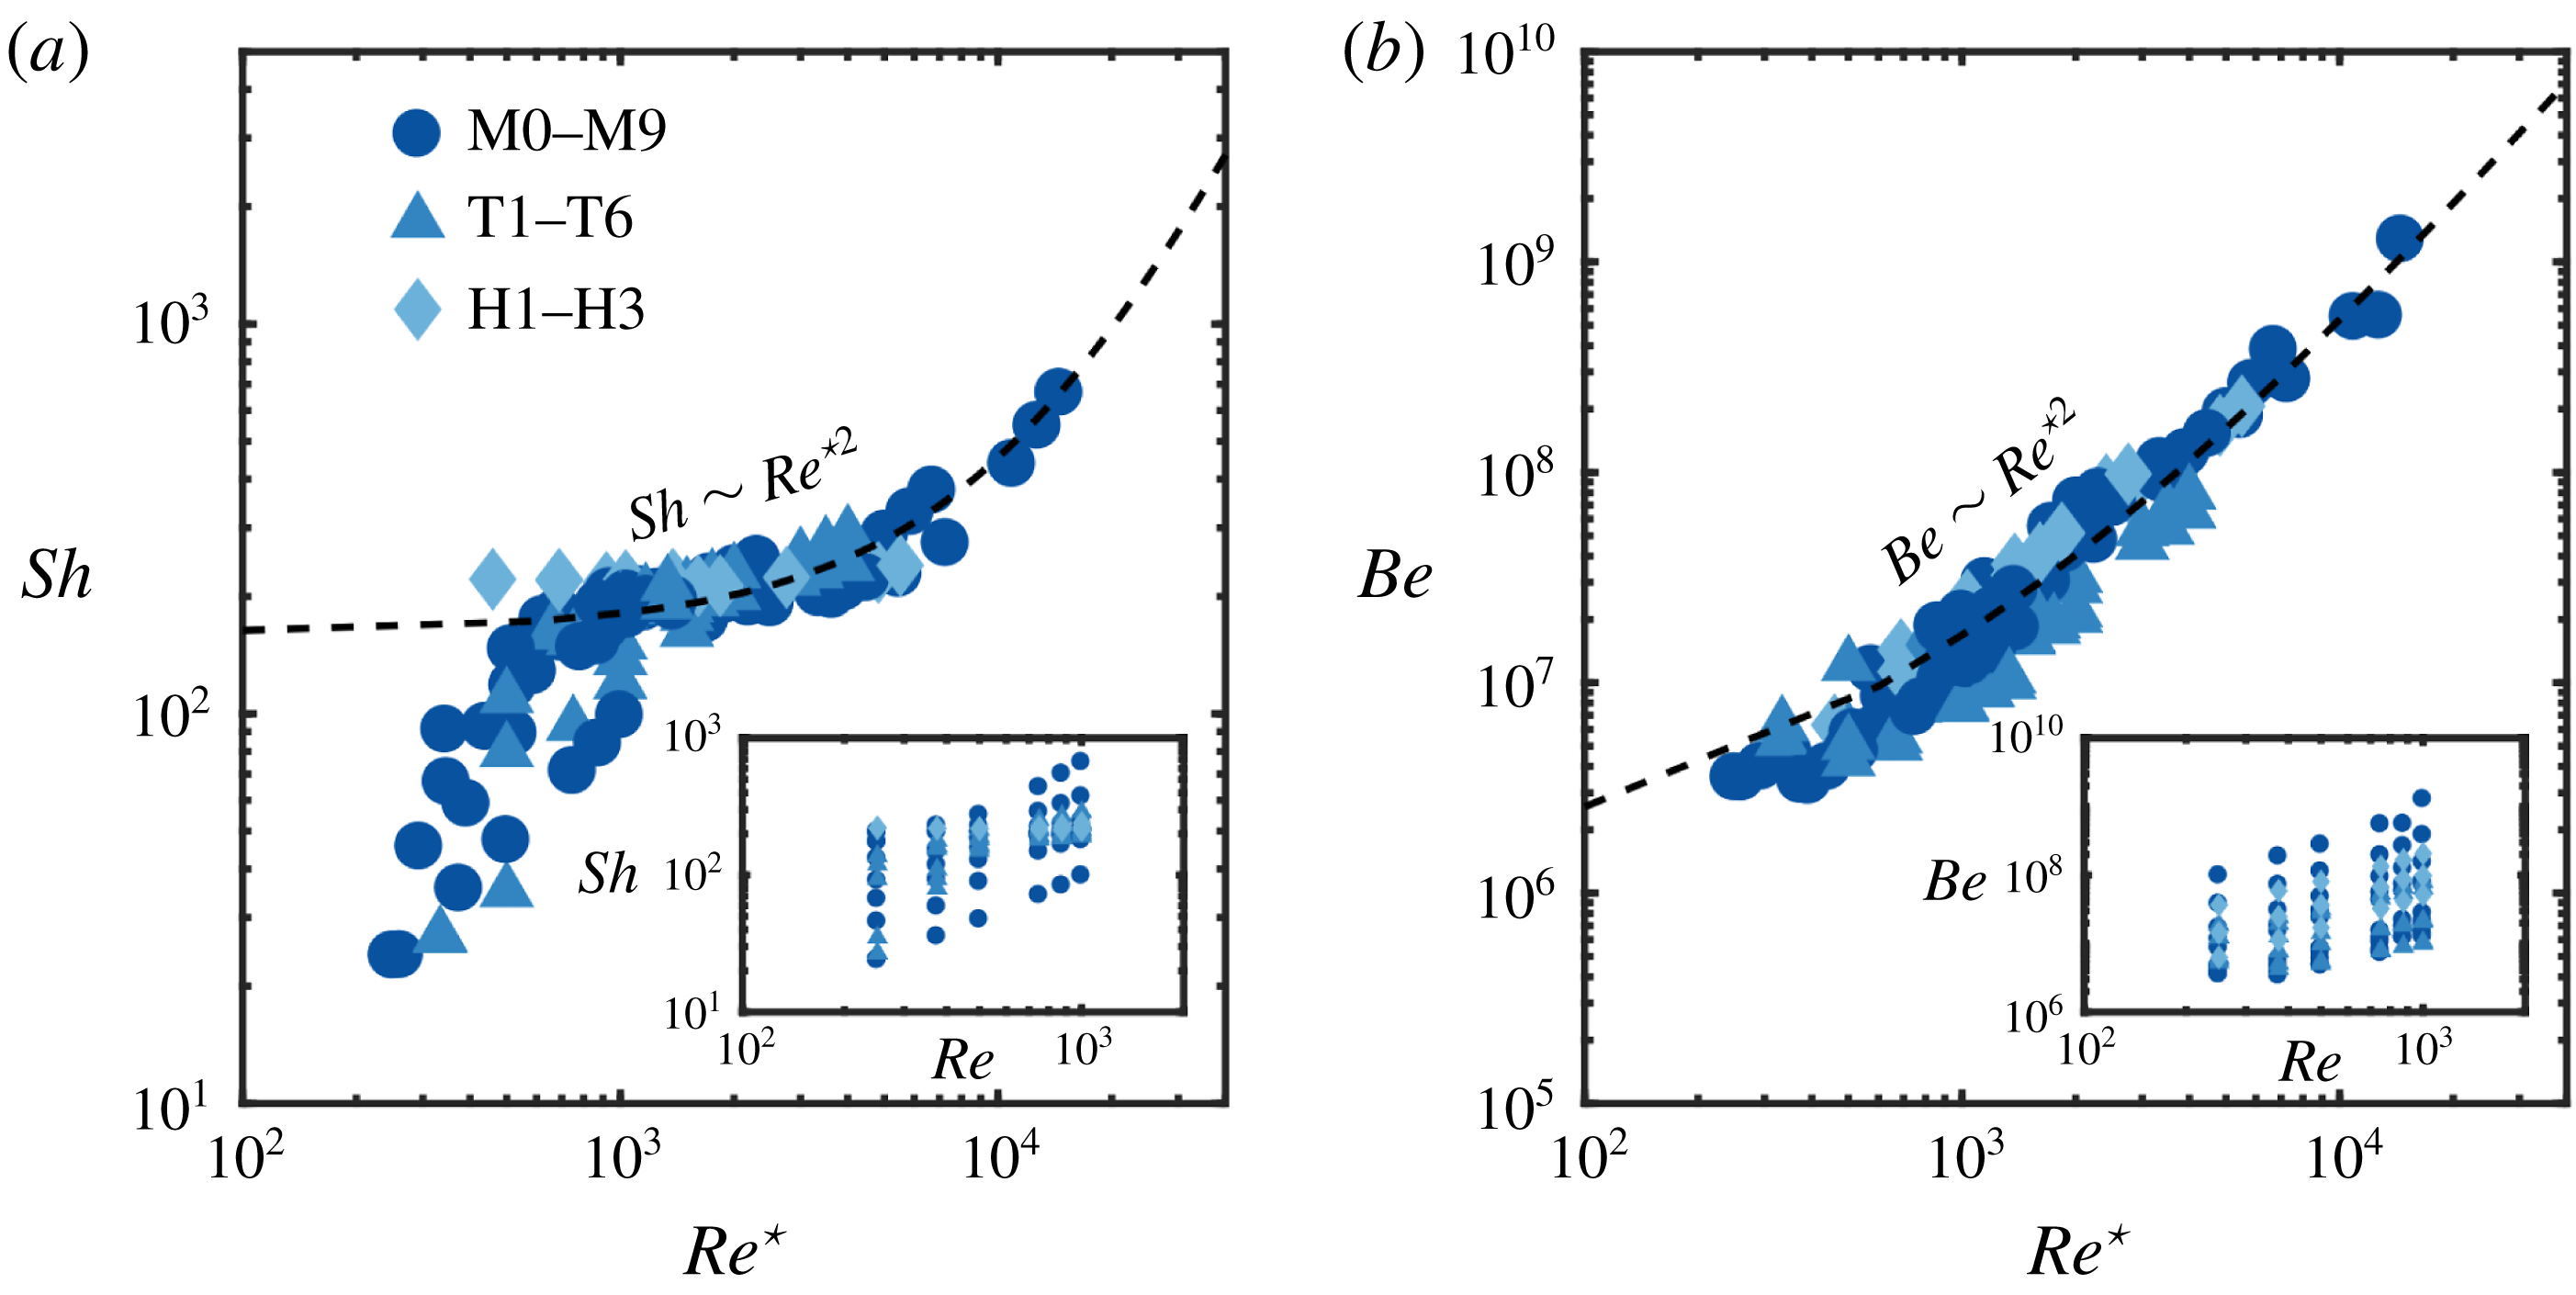
have the same scaling in terms of Reynolds number, in figure 11 we plot
 $Sh$
and
 $Be$
as a function of
 $Re^{\star }$
for all 114 simulations. In the insets of figure 11, we provide a plot of
 $Sh$
and
 $Be$
in terms of
 $Re$
for comparison. Figure 11, where all the data points collapse onto one scaling curve, suggests that
 $Re^{\star }$
is an appropriate scaling variable, able to provide a unifying framework for the analysis of topologically and morphologically altered membranes.
Specifically, in figure 11(a), we plot
 $Sh$
as a function of
 $Re^{\star }$
, and show that appropriately rescaled data collapse reasonably well (particularly for
 $Re^{\star }>10^{3}$
) with
 $Sh$
increasing with
 $Re^{\star }$
and an inflection point for
 $1000<Re^{\star }<5000$
. Two scaling regimes can be identified with a transition occurring at
 $Re^{\star }\approx 1000$
: in both regimes,
 $Sh$
(i.e.
 $Q_{m,\infty }$
) increases with
 $Re^{\star }$
although at different rates (with
 $Sh$
increasing faster for
 $Re^{\star }<1000$
). The data suggest a parabolic scaling between
 $Sh$
and
 $Re^{\star }$
for
 $Re^{\star }>1000$
, i.e.
 $$\begin{eqnarray}Sh\sim Re^{\star 2}\quad \text{for }Re^{\star }>10^{3},\end{eqnarray}$$
where larger inlet velocities result in larger steady-state permeate fluxes. Similarly, figure 11(b) shows the relationship between
 $Be$
and
 $Re^{\star }$
with the scaling (4.6) overlaid. As hypothesized by analogy with the benchmark case, also
 $$\begin{eqnarray}Be\sim Re^{\star 2}\quad \text{for }Re^{\star }>10^{3},\end{eqnarray}$$
i.e. larger inlet velocities result in larger overall pressure drops between the inlet and the outlet. The proposed scaling (4.7) matches the data very well.
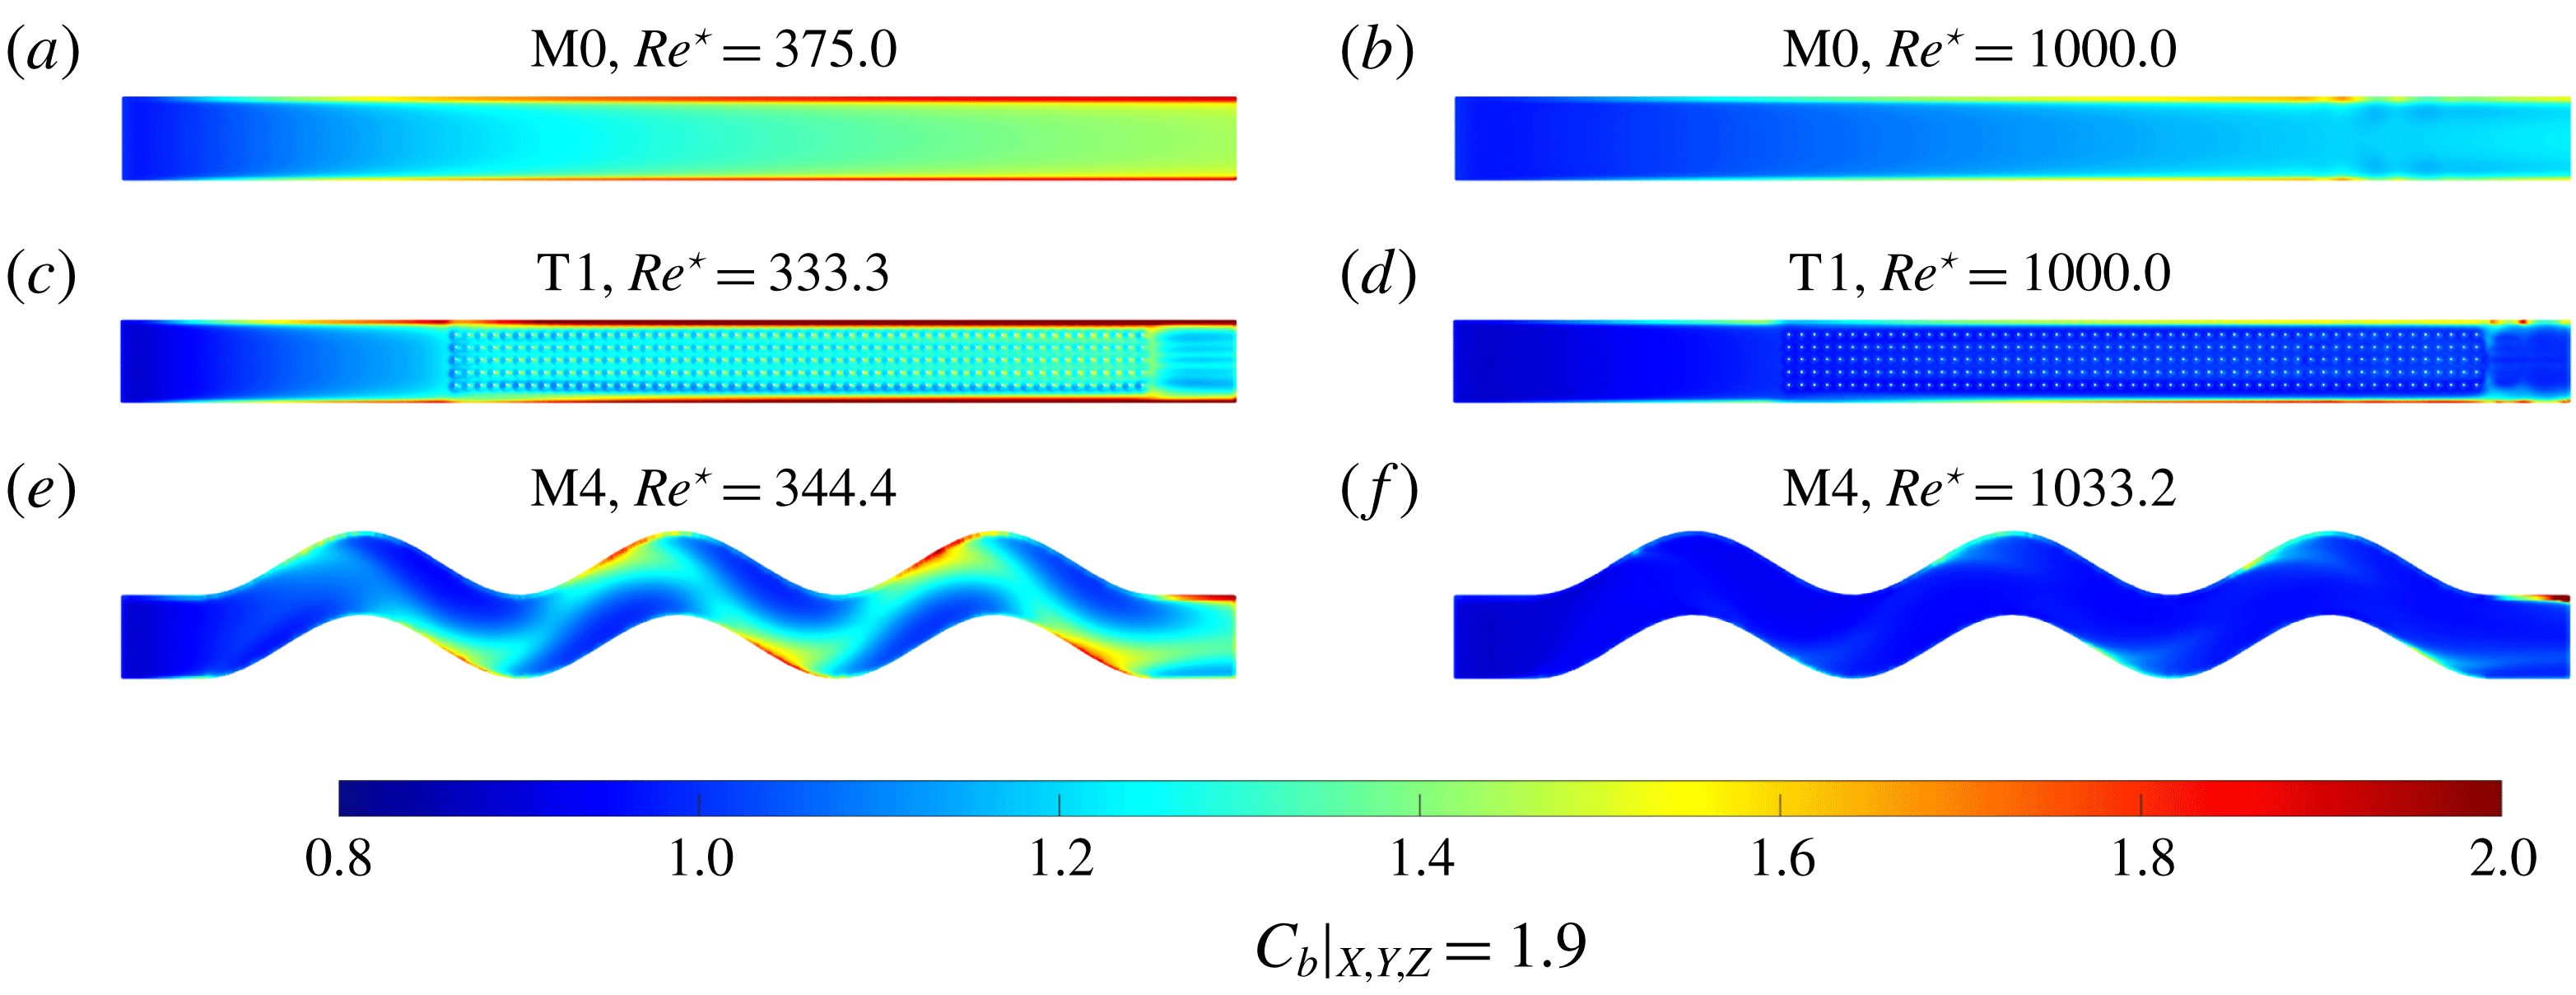
Bulk concentration distribution (
 $C_{b}$
) near the membrane surface (
 $Z=1.9~\text{mm}$
) for two different
 $Re^{\star }$
,
 $Re^{\star }\approx 300$
(a,c,e) and
 $Re^{\star }\approx 1000$
(b,d,f), and three designs, M0 (a,b), T1 (c,d) and M4 (e,f).

(a) Sherwood number (
 $Sh$
) plotted as a function of the dimensionless group (
 $Re^{\star }$
); (b) Bejan number (
 $Be$
) plotted as a function of the dimensionless group (
 $Re^{\star }$
). In both plots, the dashed line is
 $Be\sim Re^{\star 2}$
.


We now proceed by numerically validating the long-time analytical scaling relationship (2.44) between
 $Be$
and
 $Sh$
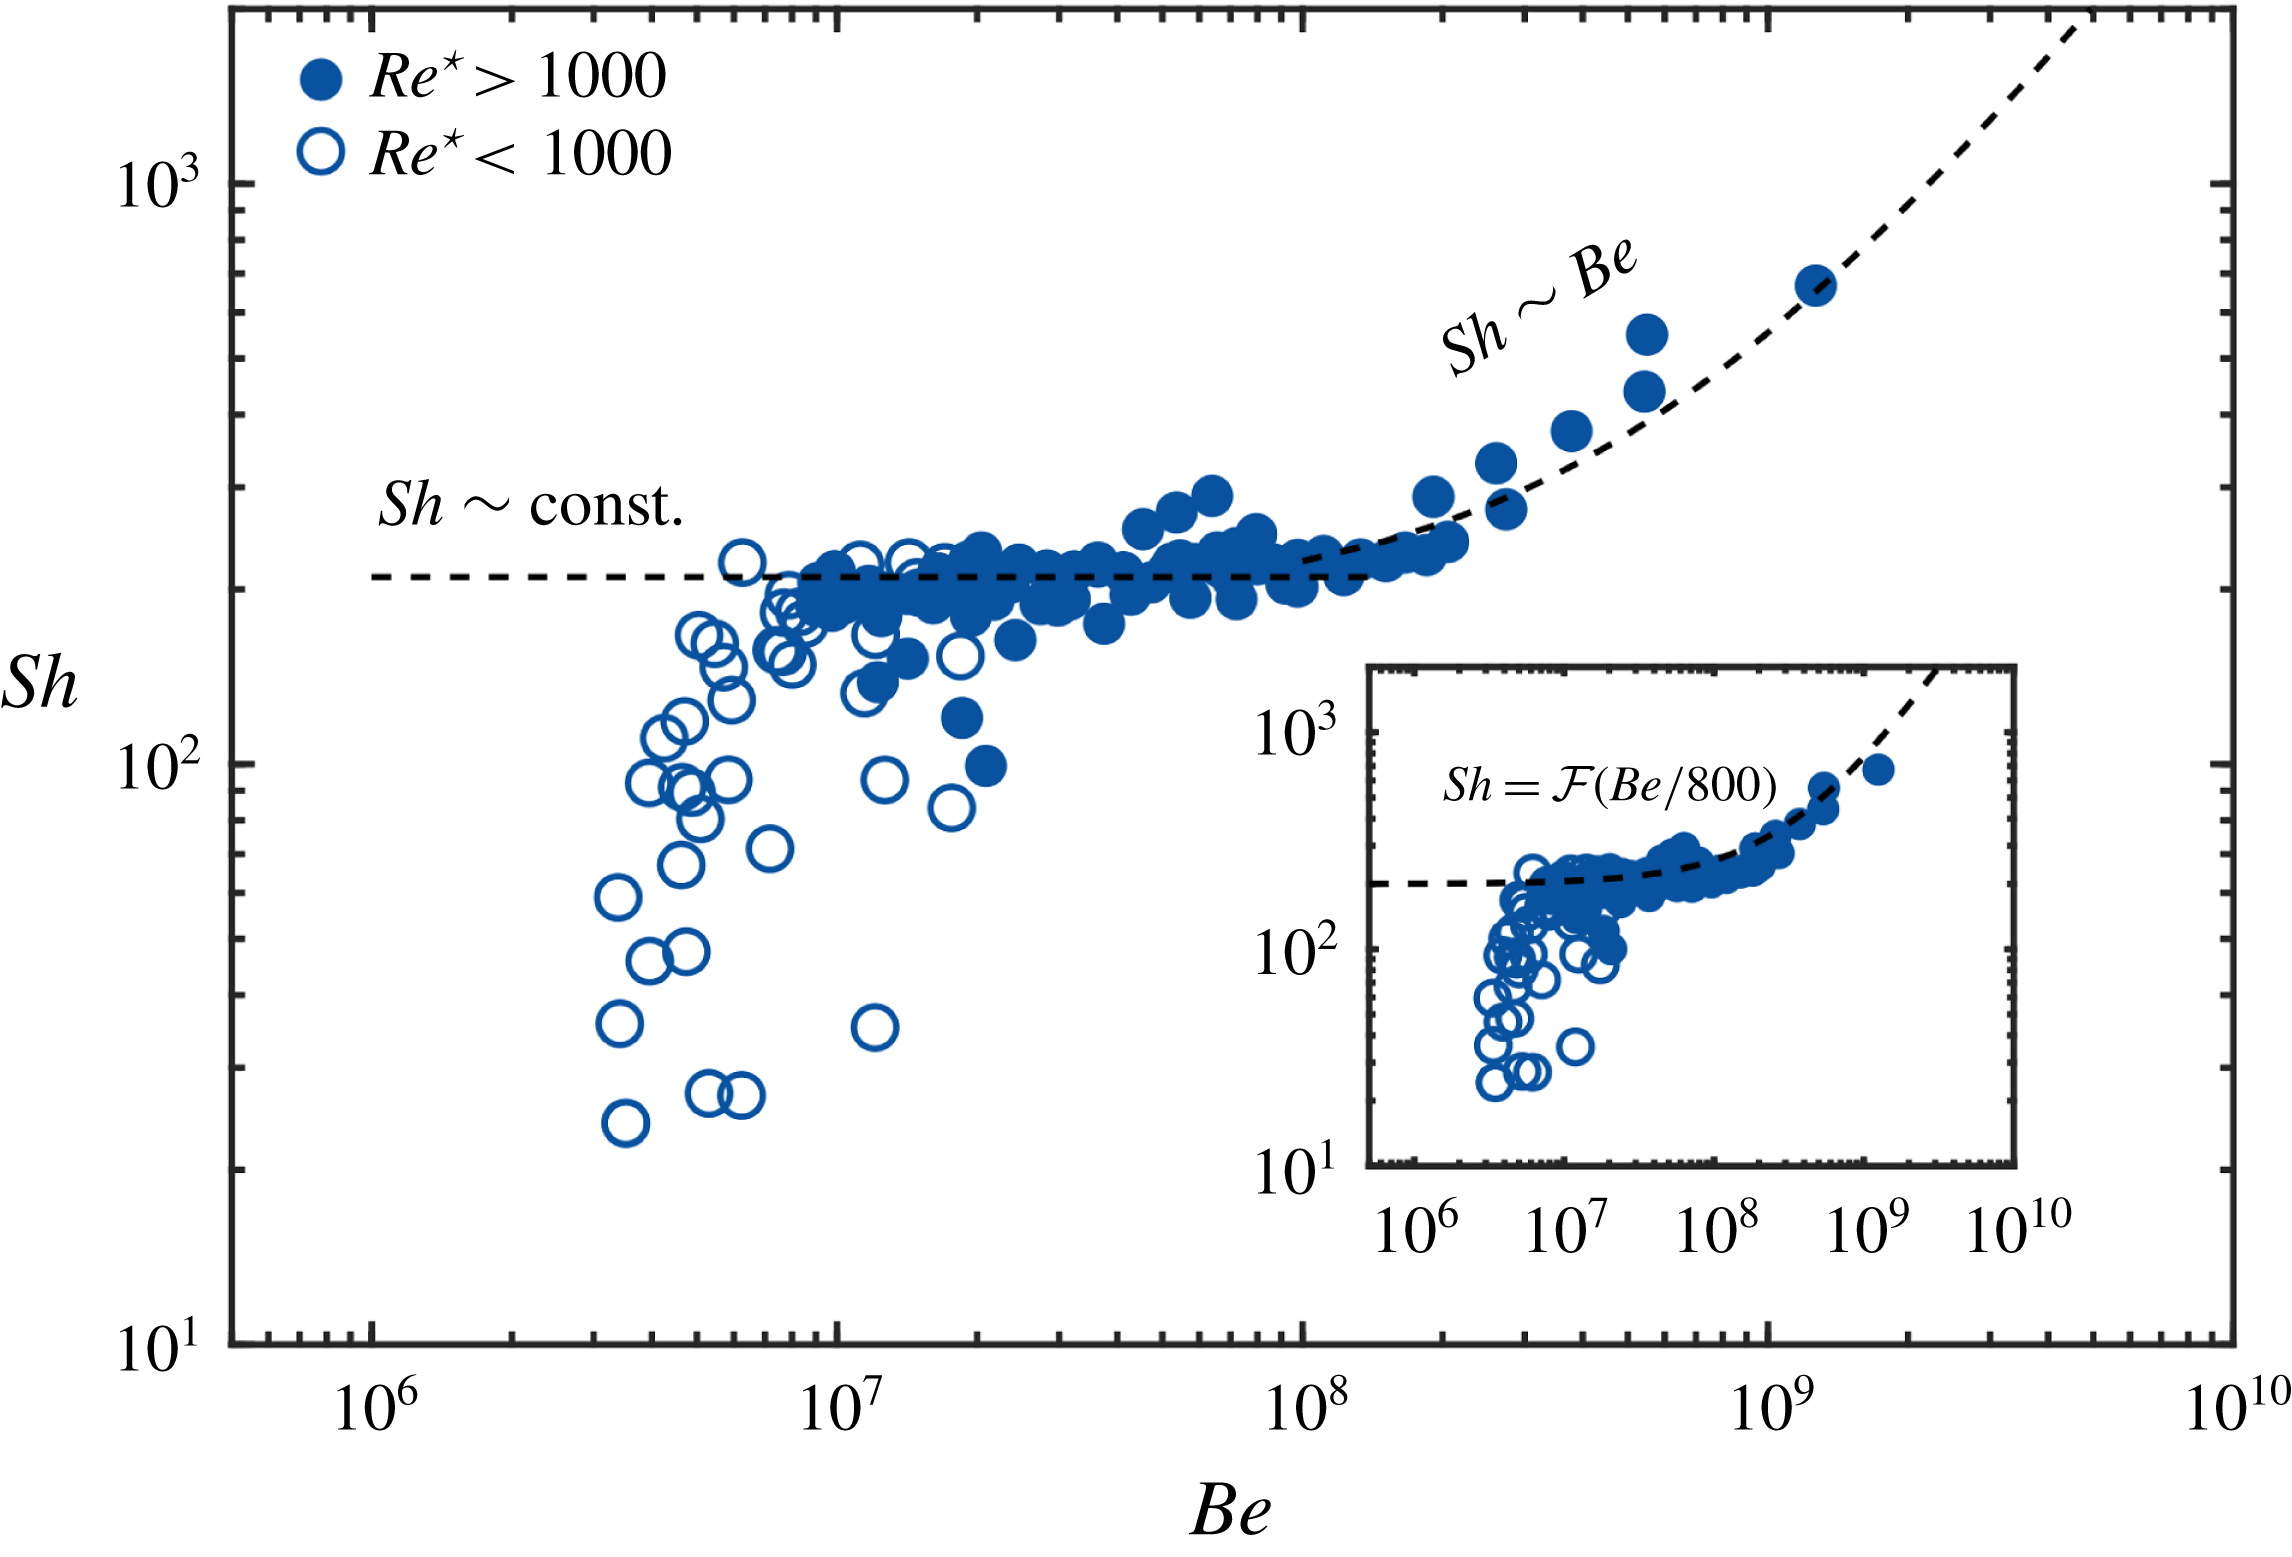
. Bejan and Sherwood numbers are numerically determined from the pressure distribution at the inlet and the permeate flux once steady state is reached. In figure 12, we plot
 $Sh$
as a function of
 $Be$
for the 114 simulations (symbols).
Figure 12 confirms the scaling relationships (2.45) derived for a rectangular membrane: the analytical solution (dashed line in figure 12) matches the data points through the rescaling
 ${\mathcal{F}}(Be/800)$
for
 $Re^{\star }>10^{3}$
. For
 $Re^{\star }<10^{3}$
, as figure 10 demonstrates, the variation of the bulk concentration
 $C_{b}$
with
 $X$
and
 $Y$
is not negligible, and the assumption that
 $C_{b}\approx C_{b}(Z)$
is not valid any longer.
4.4 Performance index optimization
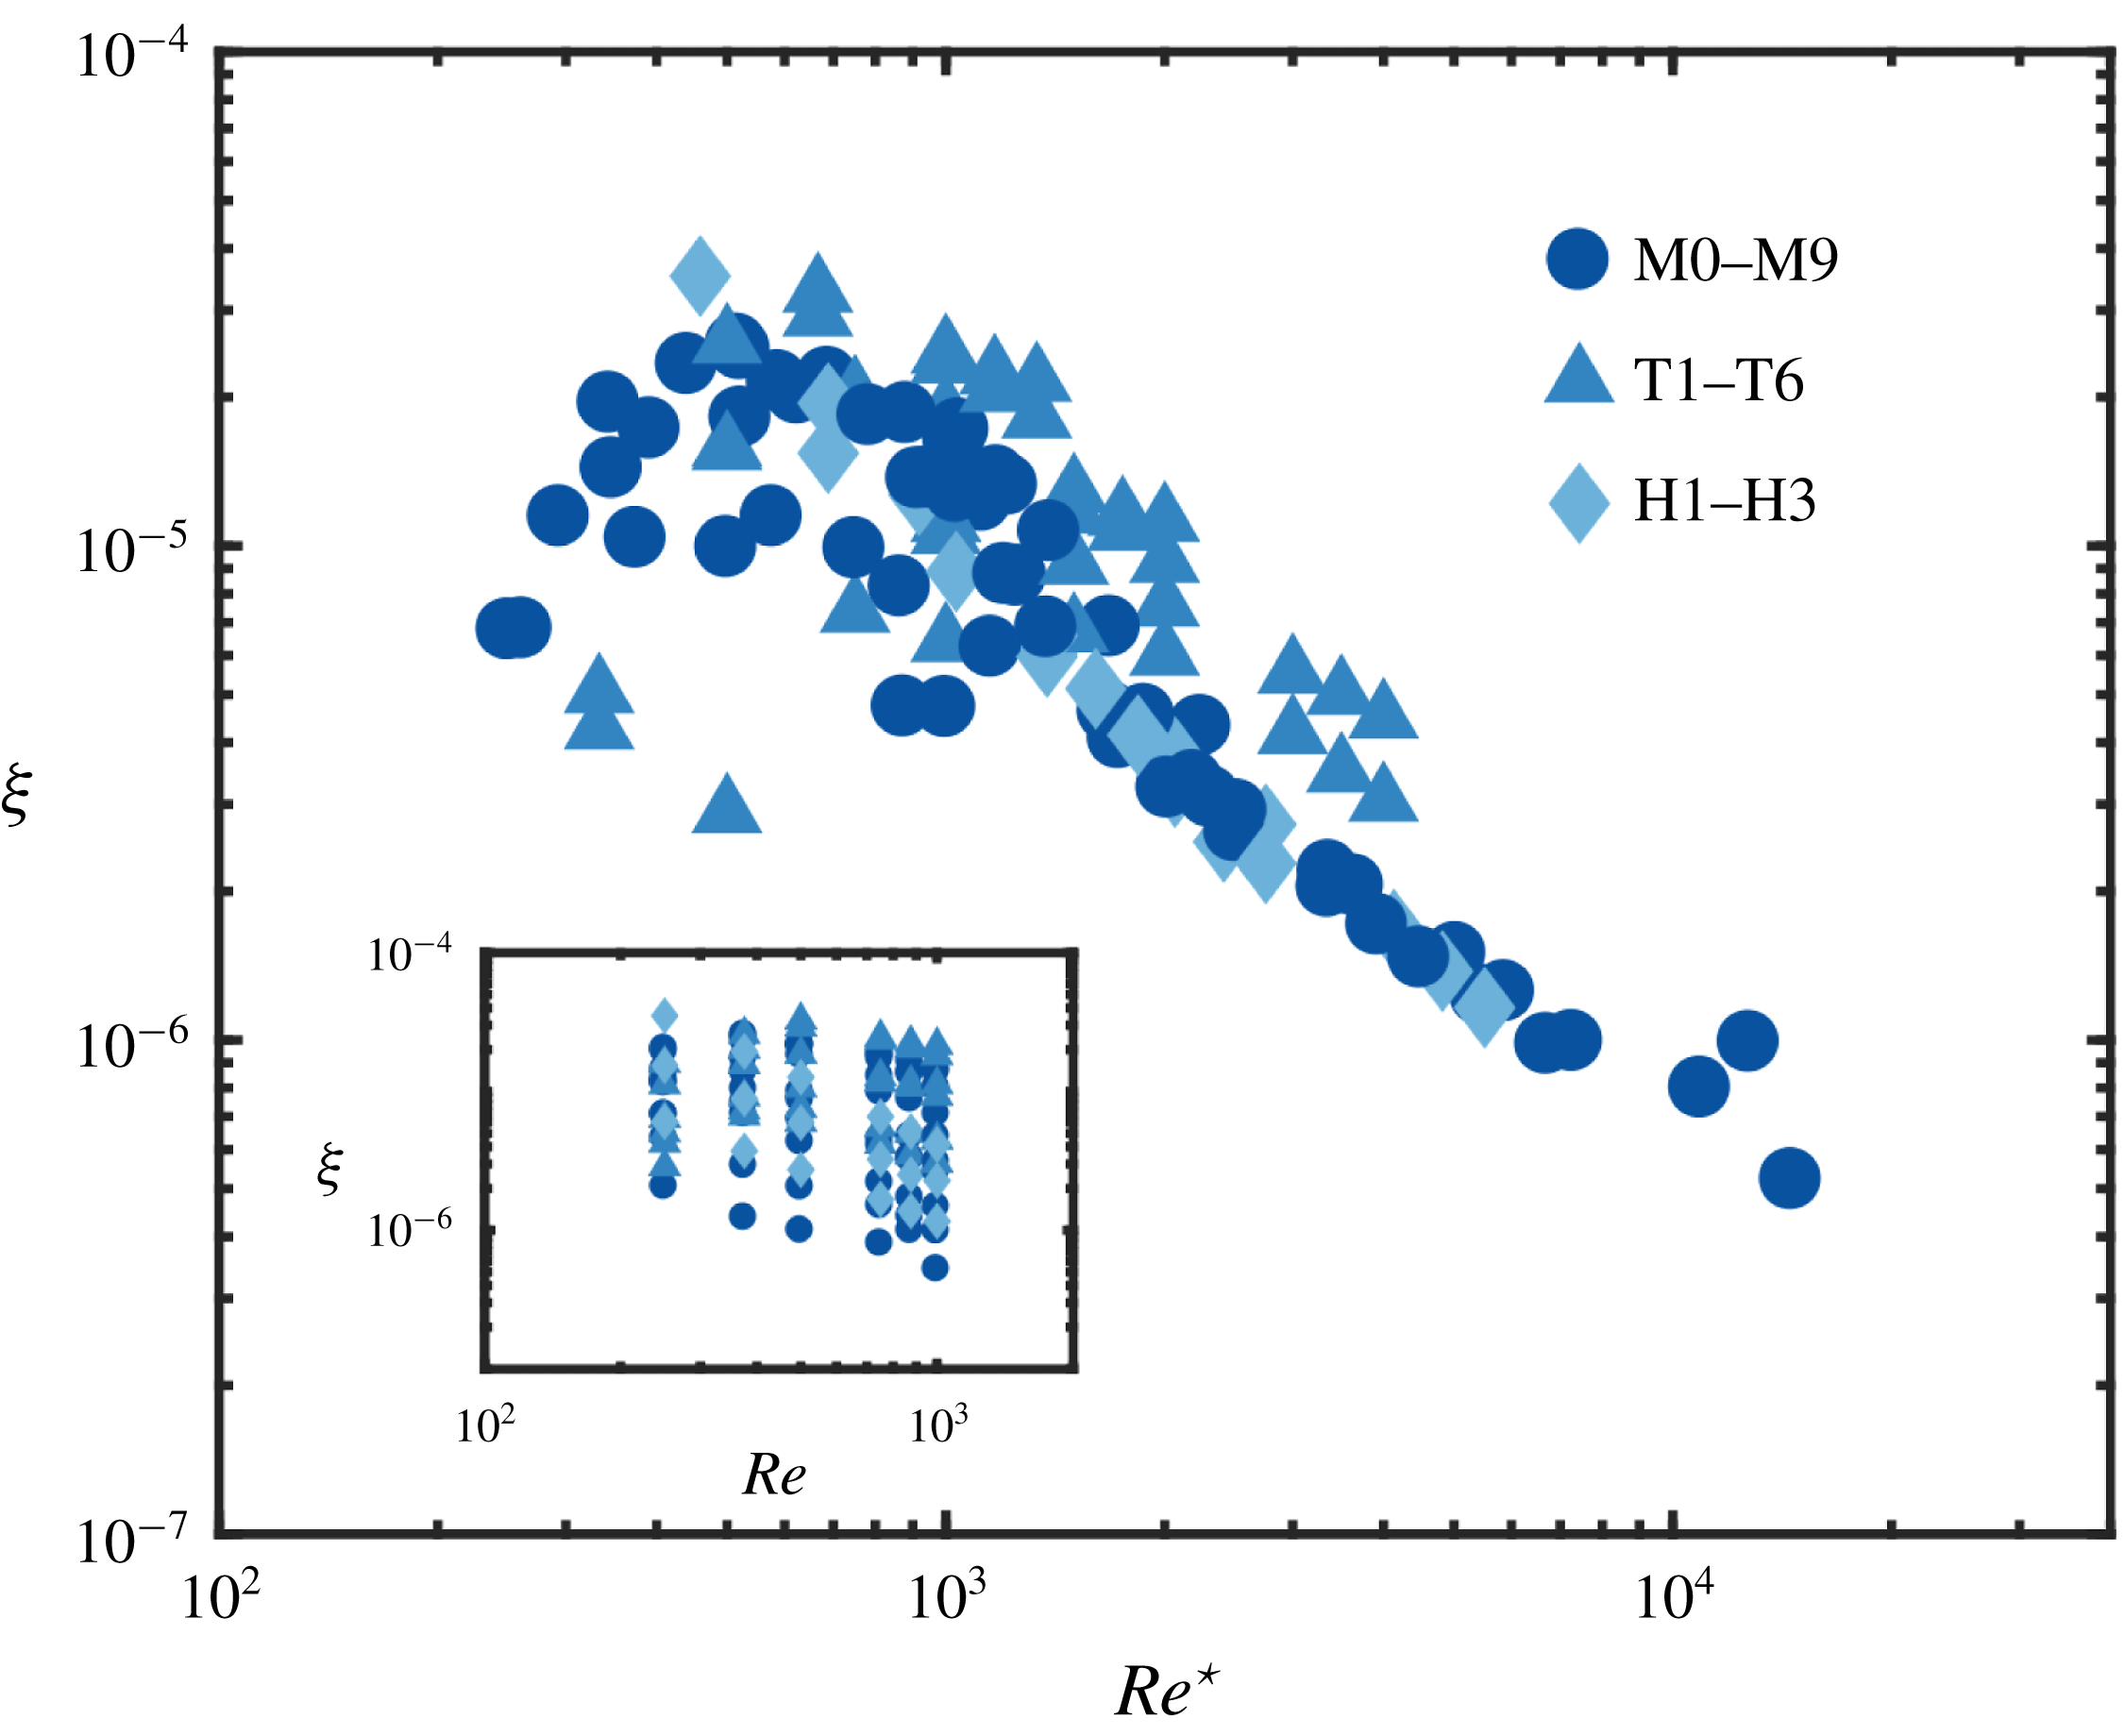
In figure 13 we plot the membrane performance index for all 114 simulations:
 $\unicode[STIX]{x1D709}$
follows a universal non-monotonic behaviour for all types of channels (types M, T and H); first, it increases with
 $Re^{\star }$
for
 $Re^{\star }<10^{3}$
, and then decreases for
 $Re^{\star }>10^{3}$
. This can be explained as follows: for
 $Re^{\star }>10^{3}$
, an increase in
 $Re^{\star }$
at a fixed
 $Re$
corresponds to an increase of the channel waviness
 $\unicode[STIX]{x1D702}$
, the ‘roughness’ height
 $\unicode[STIX]{x1D701}$
or both; although these membrane alterations cause a steady increase of the permeate flux (see figure 11
a), this effect is outweighed by the increase in pressure drop necessary to sustain the imposed volumetric rate (see figure 13). As a result,
 $\unicode[STIX]{x1D709}$
decreases with a further increase in
 $Re^{\star }$
, when
 $Re^{\star }>10^{3}$
. Instead, for
 $Re^{\star }<10^{3}$
, the increase in permeate flux is faster than the increase in the required pressure drop, leading to a net increase of membrane performance. Importantly, figure 13 shows that
 $\unicode[STIX]{x1D709}$
has a maximum for the values of
 $Re^{\star }$
investigated, i.e. the dependence between
 $\unicode[STIX]{x1D709}$
and
 $Re^{\star }$
can be used for membrane performance optimization, both in terms of design and operating conditions.
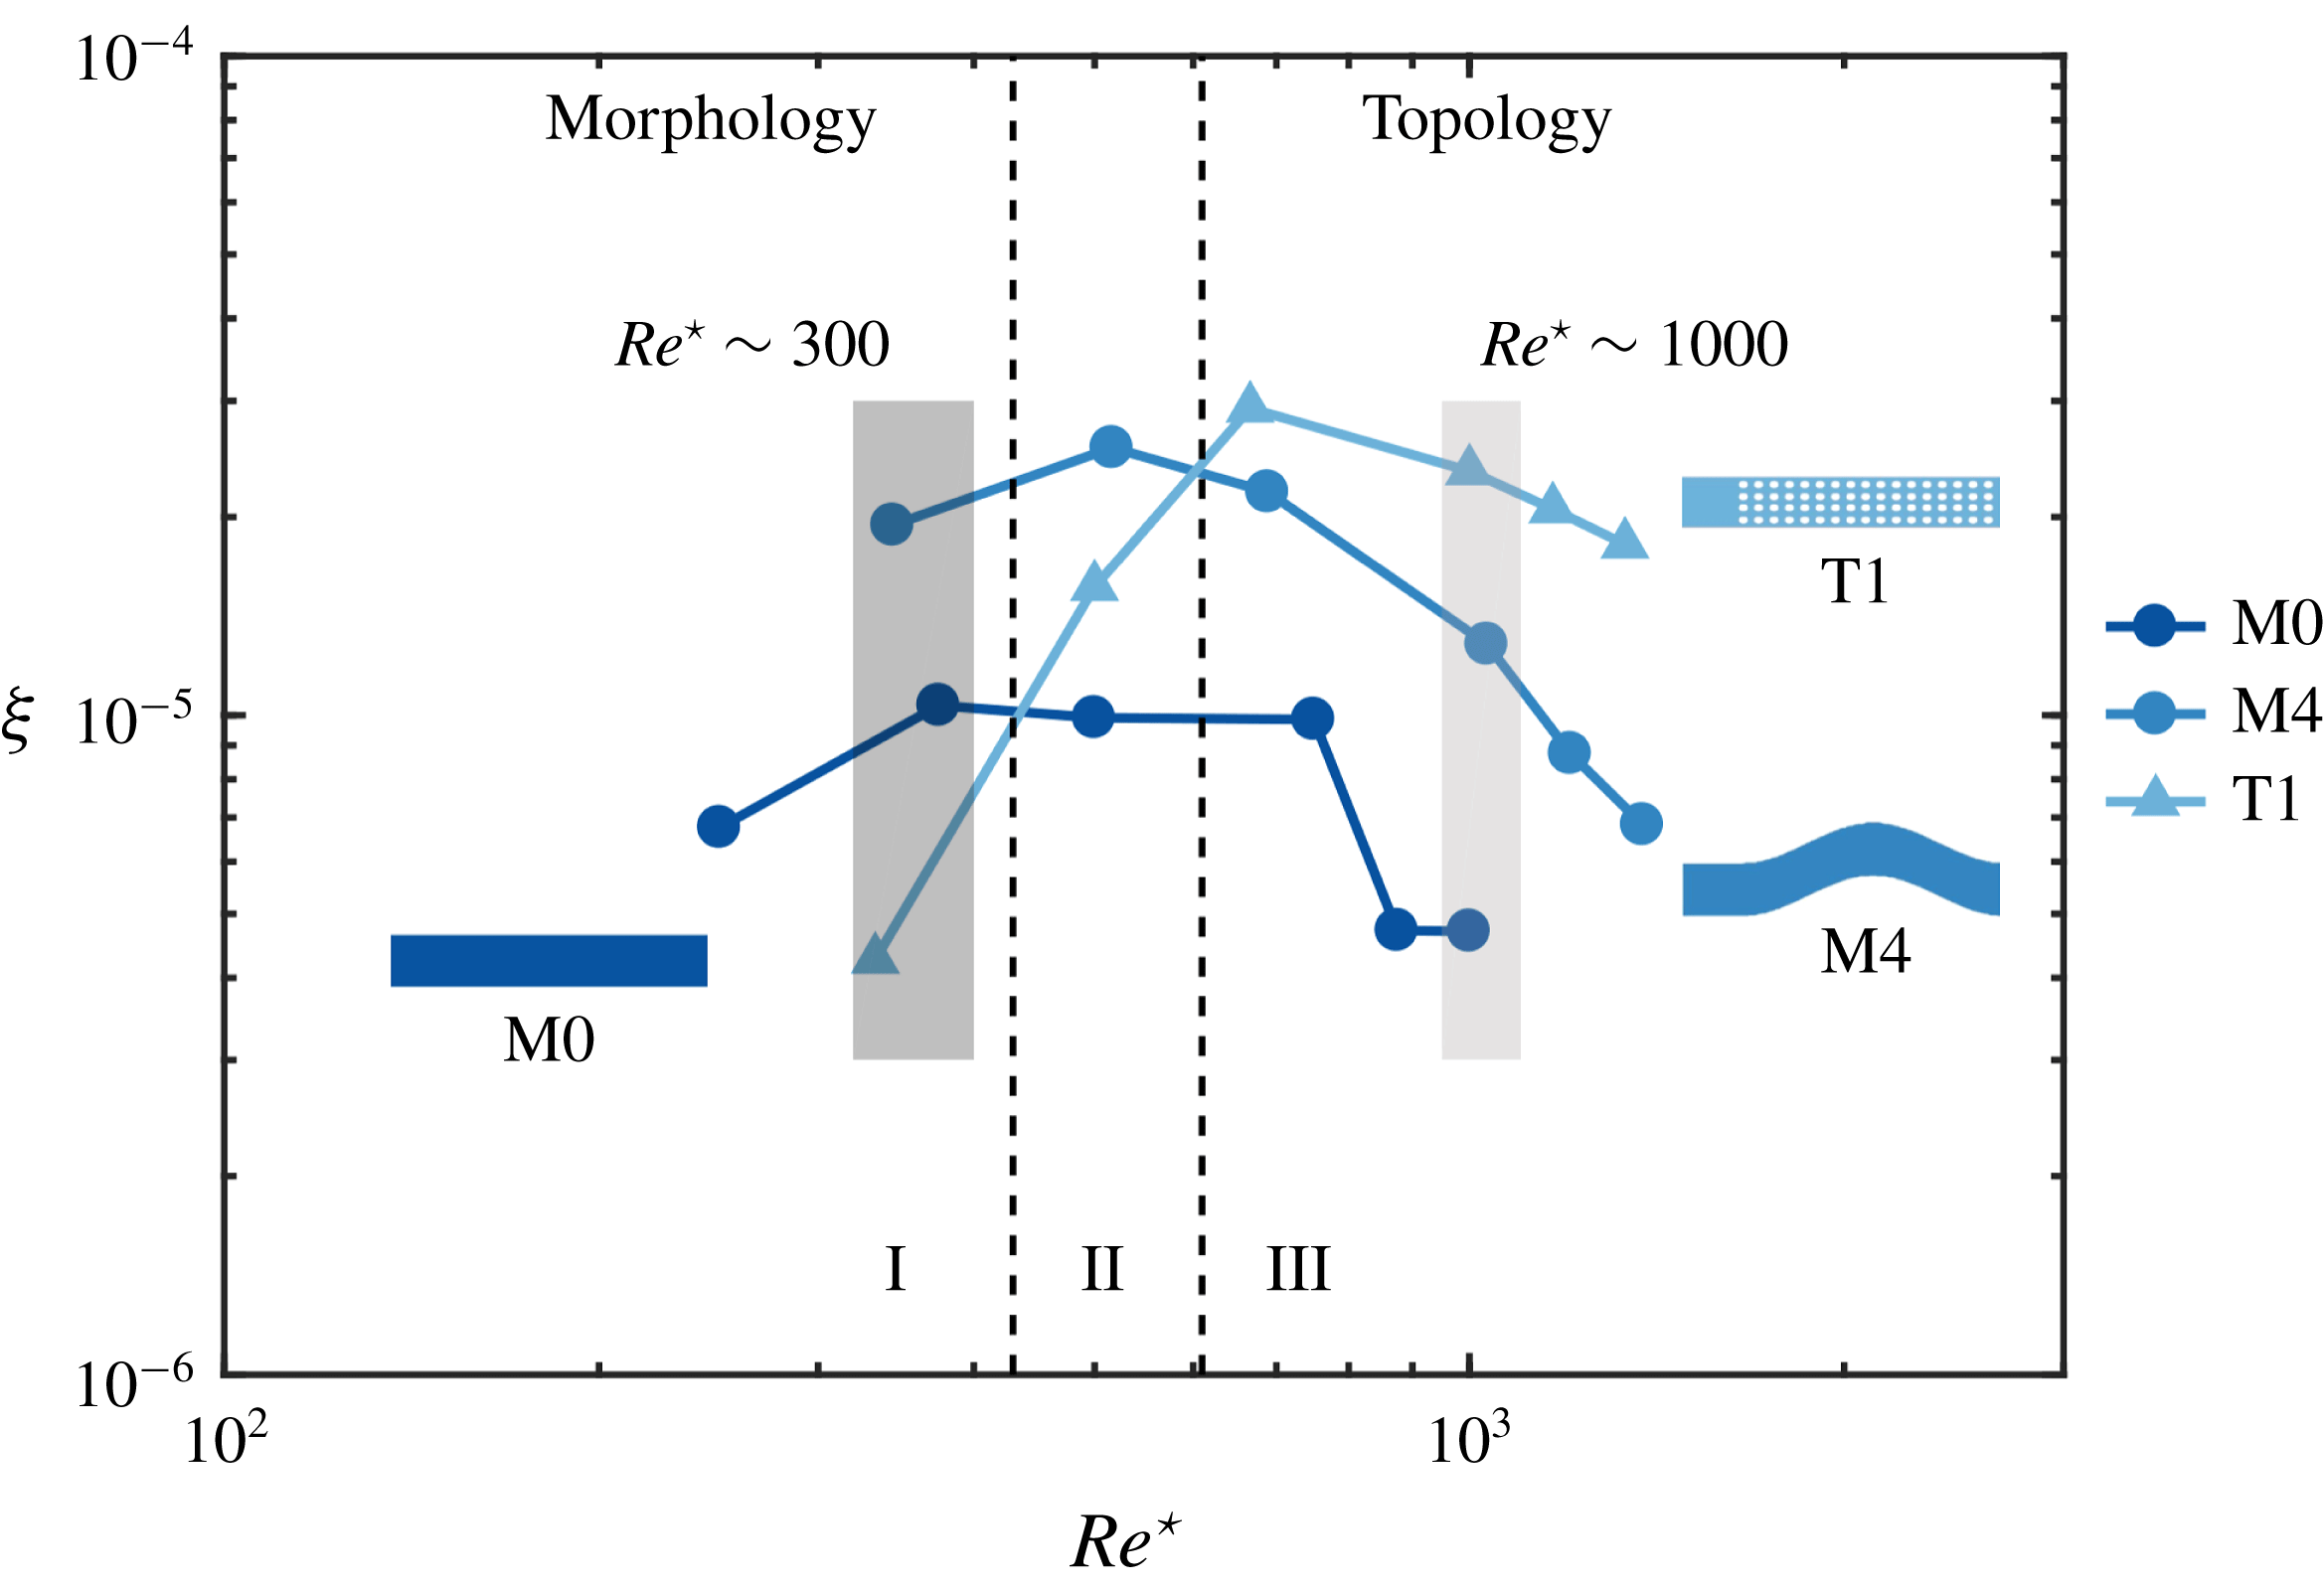
Within each membrane type (i.e. M or T), we select the design that maximizes
 $\unicode[STIX]{x1D709}(Re^{\star })$
across the full range of
 $Re^{\star }$
investigated. Designs M4 and T1 are the best performing among the M and T designs, respectively. The overall best performing design across all categories (M, T and H) is H1, a combination of M4 and T1, although its performance is superior to all other designs for a very limited range of
 $Re^{\star }$
. This demonstrates that
 $\unicode[STIX]{x1D709}-Re^{\star }$
curves can be used both to identify best performing designs within each class type (M or T) as well as to combine basic designs into hybrid ones to achieve improved performance.
Performance index (
 $\unicode[STIX]{x1D709}$
) plotted as a function of the dimensionless group (
 $Re^{\star }$
) for all 114 simulations.

Membrane performance index
 $\unicode[STIX]{x1D709}$
in terms of
 $Re^{\star }$
for the two best performing designs within their own class, M4 and T1, and the reference design M0. In region I, morphological modifications improve
 $\unicode[STIX]{x1D709}$
compared to topological ones, which, instead, underperform compared to the ‘do nothing’ option M0. In region III, topological modifications outperform both the benchmark design as well as the best performing M-design.

Figure 14 shows
 $\unicode[STIX]{x1D709}$
in terms of
 $Re^{\star }$
for M4, T1 and the reference rectangular membrane M0. Three regions can be identified based on the magnitude of
 $Re^{\star }$
. In region I (i.e. at lower
 $Re^{\star }$
) morphological alterations of the membrane improve the performance compared to the reference case M0; instead, topological modifications lead to underperformance compared to M0 (i.e. the ‘doing nothing’ option) since the surface pattern introduces additional roughness and promotes foulant accumulation. In region II, both M4 and T1 improve the system performance compared to M0, while M4 still outperforms T1. In region III (i.e. at higher
 $Re^{\star }$
), the trend is inverted: topological modifications maximize the membrane performance compared to both M0 and M4 since at higher
 $Re^{\star }$
(or velocity), surface modifications promote high permeate flux (due to an increase of local shear stress on the membrane and a concurrent decrease in foulant accumulation) while operating at a lower pressure drop compared to the morphologically altered channels. To explore the reason that causes the differences in efficiency for different patterns, in figure 15 we plot the
 $Y$
-averaged concentration on the
 $Z=1.9$
mm plane as a function of
 $X$
, i.e. the ratio between the bulk concentration evaluated in proximity of the membrane mid-plane and the inlet concentration,
 $$\begin{eqnarray}C^{\star }(X)=\int _{0}^{B}C_{b}(X,Y,Z=H^{-})\,\text{d}Y,\end{eqnarray}$$
also known as the CP modulus. In figure 15, we plot
 $C^{\star }(X)$
for three different geometries (M0, M4 and T1) and two different values of
 $Re^{\star }$
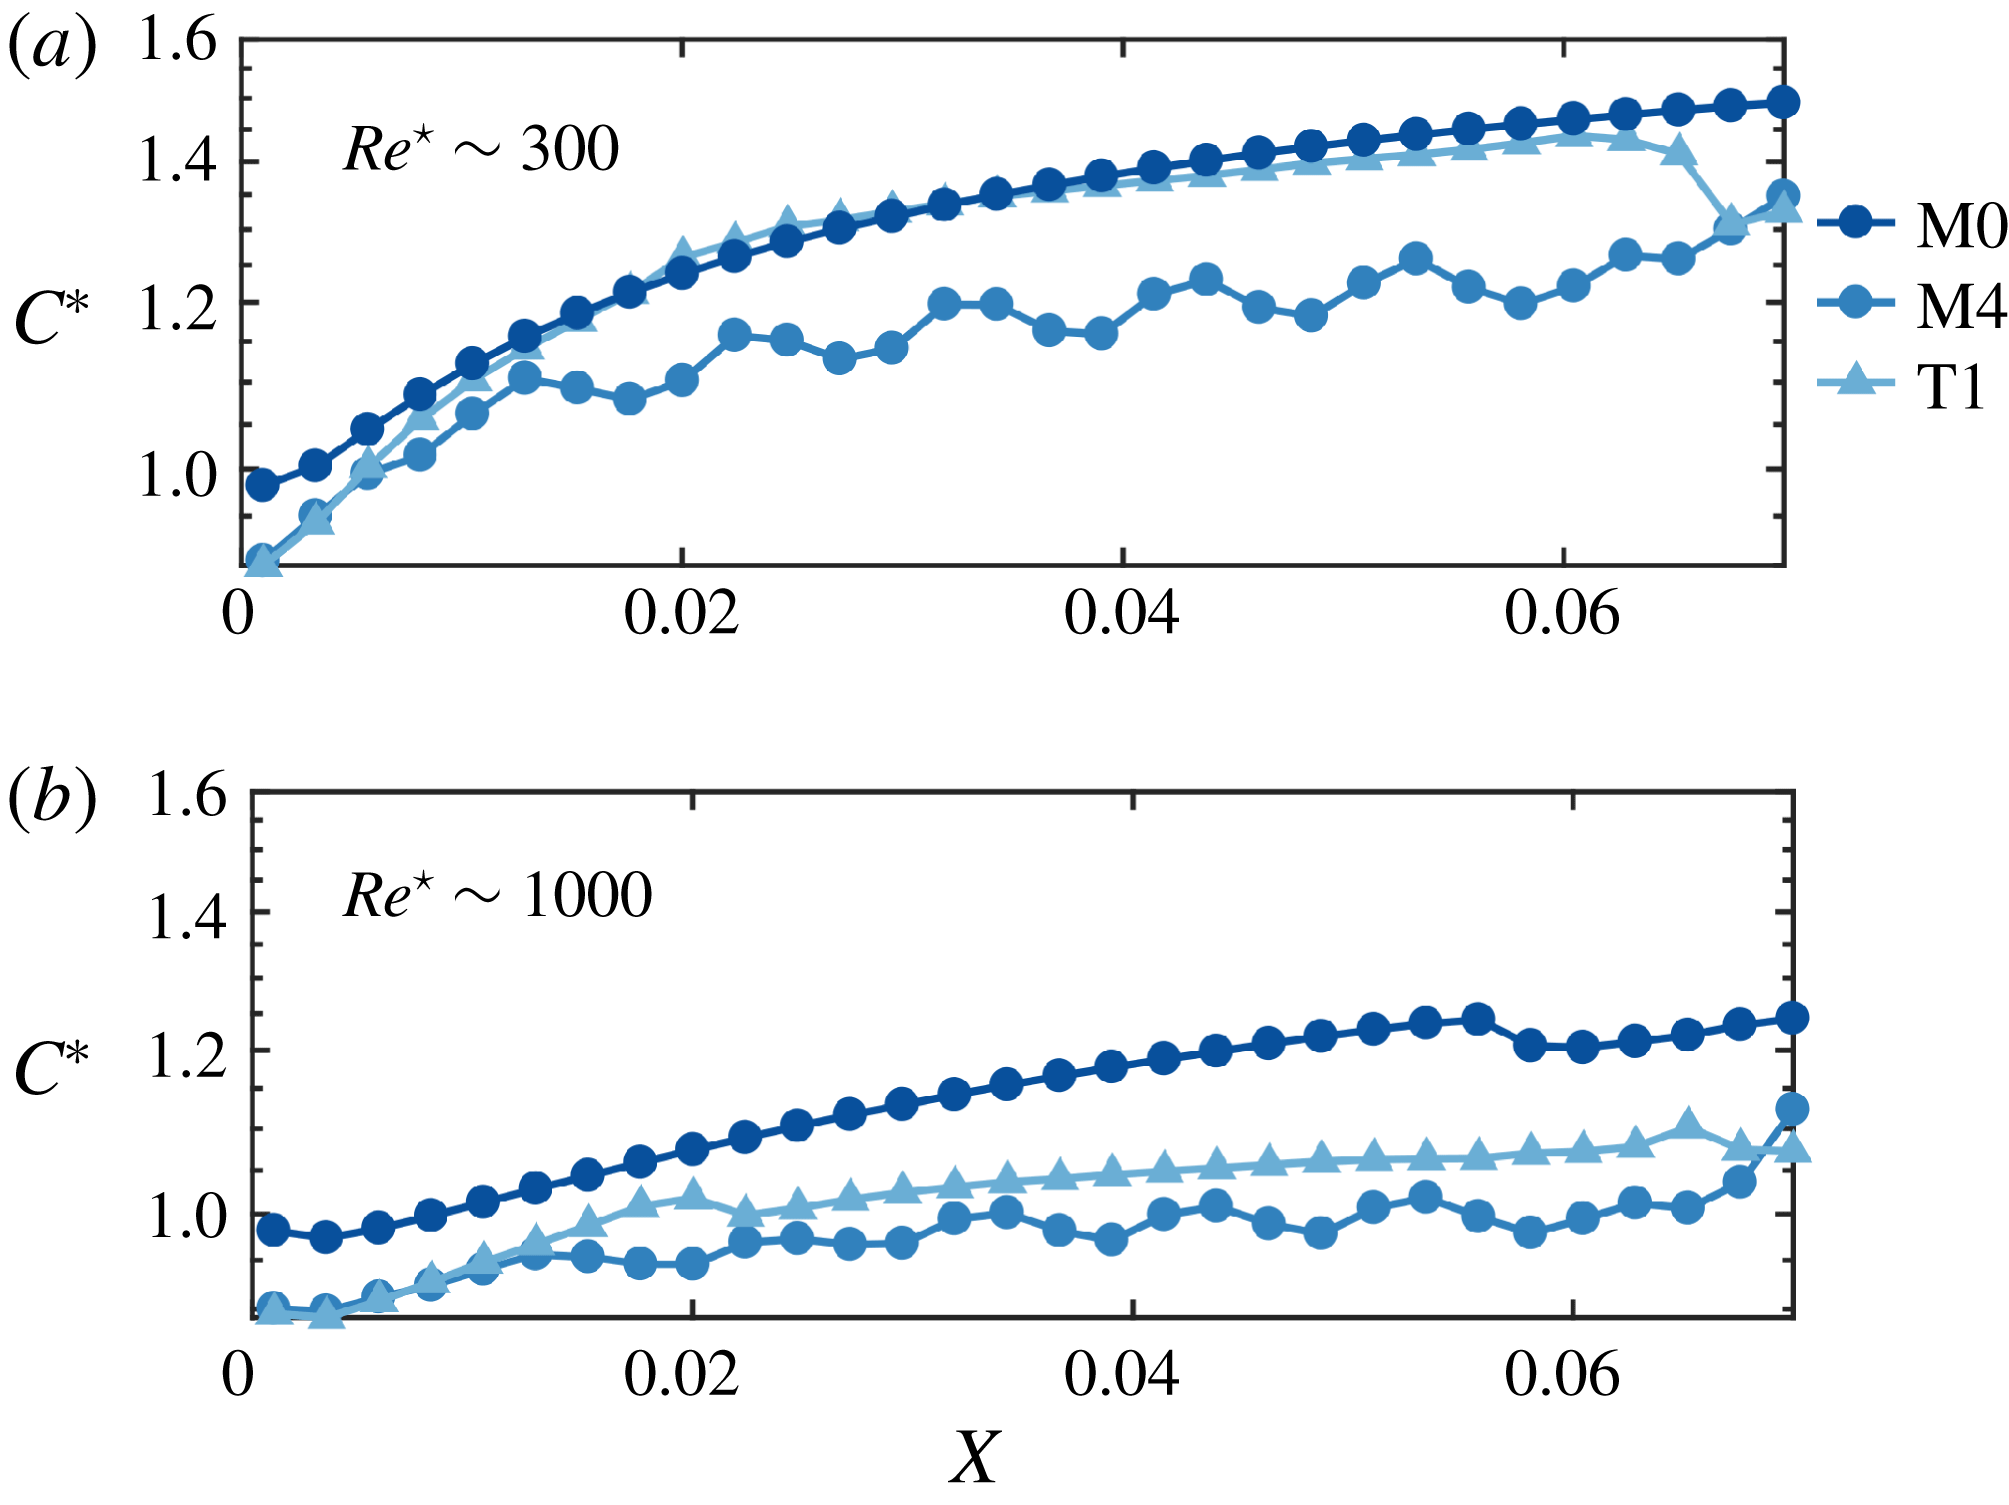
. When the
 $Re^{\star }<1000$
, both M0 and T1 show a high CP modulus relative to M4: as a result, M4 performs better among all the cases. Additionally, since the T1 design introduces additional shear stress near the membrane surface due to its patterned surface, it also requires a higher pressure input than that needed for the M0 case. This explains why T1’s performance index is lower than that of M0. When the
 $Re^{\star }\sim 1000$
, although the CP moduli of T1 and M4 are approximately the same, M4’s morphology has a much larger flow resistance (i.e. higher pressure drop requirements) which results in a lower overall performance index.
CP modulus
 $C^{\star }$
, defined in (4.3), for M0, M4 and T1 and two values of
 $Re^{\star }$
(
 $Re^{\star }\approx 300$
top,
 $Re^{\star }\approx 1000$
bottom).

5 Conclusions
Reverse osmosis membranes are employed in a variety of engineering applications, ranging from waste-water purification to desalination systems. Fouling control is crucial for both efficiency enhancement and energy saving of the filtration process. Morphological (wiggliness) and topological (roughness) modifications of the membrane have been successfully employed to reduce fouling, however optimization of either spacer morphology, surface topology or both is still carried out by trial and error. This is due to the lack of quantitative understanding of (i) the dynamic feedbacks between solute concentration in the feed solution, foulant build up on the membrane and permeate flux and (ii) the impact of morphological and/or topological modifications on membrane fouling at prescribed operating conditions.
Here, we develop a model, and its corresponding customized 3-D solver in OpenFOAM, that couples flow, bulk and foulant surface concentration dynamically. The model and numerical solver are validated against experimental data of the permeate flux conducted by Rahardianto et al. (Reference Rahardianto, Shih, Lee and Cohen2006), who studied temporal permeate flux variation and steady-state fouling pattern formation on the membrane. The code is also able to correctly predict the experimental spatial distribution of the fouling pattern. After validation, we identify relevant dimensionless numbers involved in the problem, including the Bejan
 $Be$
and the Sherwood
 $Sh$
numbers which represent the dimensionless pressure drop along the channel and the dimensionless flux at steady state, the two primary variables to be optimized as they control directly membrane efficiency both in terms of energy consumption and generated clean water flux. We analytically derive the relationship between
 $Sh$
and
 $Be$
for a rectangular membrane and demonstrate that they exhibit the same scaling behaviour in terms of Reynolds number, i.e.
 $Sh$
can be written as an explicit function of Bejan (
 $Be$
), Schmidt (
 $Sc$
) and Darcy (
 $Dc$
) numbers, only. Two scaling behaviours are analytically identified for
 $Be\rightarrow 0$
and
 $Be\rightarrow \infty$
with the transition occurring at
 $Be^{\star }$
. We further introduce the concept of filtration performance through the performance index
 $\unicode[STIX]{x1D709}$
defined as the ratio between
 $Sh$
and
 $Be$
, which provides a framework to analyse the overall membrane performance both in terms of generated clean water flux and required pressure drop. The analysis derived for the benchmark rectangular membrane was then generalized to membranes with morphological and topological modifications.
Simulations conducted on 18 different designs and 6 inlet velocities included 9 designs of membranes with sinusoidal shape (M1–M9), 6 designs of membranes patterned by cylindrical posts of different heights and arrangements (T1–T6) and 3 hybrid designs combining both morphological and topological modifications (H1–H3), in addition to the benchmark case of a classical rectangular membrane (M0), for a total of 114 simulations. The simulations reveal that fouling in topological or morphological altered membranes is greatly impacted by the inlet velocity, i.e. Reynolds number, with T-type membranes better performing at high inlet velocities and M-type membranes outperforming both the benchmark M0 and T-configurations at low inlet velocities. Since the classical Reynolds number (based on the channel width length scale
 $B$
) does not allow one to account for the additional length scales introduced by the membrane patterns or sinusoidal shape, in (4.5) we introduce a modified Reynolds number,
 $Re^{\star }=\unicode[STIX]{x1D702}^{-2}\unicode[STIX]{x1D701}^{-1}Re$
, where
 $\unicode[STIX]{x1D702}$
(
 $0<\unicode[STIX]{x1D702}\leqslant 1$
) and
 $\unicode[STIX]{x1D701}$
(
 $0\leqslant \unicode[STIX]{x1D701}\leqslant 1$
) provide measurements of the ‘waviness’ of the channel and of the ‘roughness’ of the membrane surface, with
 $\unicode[STIX]{x1D702}=1$
and
 $\unicode[STIX]{x1D701}=1$
for a straight channel and a topologically unaltered membrane, respectively. The modified Reynolds number allows one to quantitatively compare the performance of membranes with different morphological and topological features under a unified framework, with
 $Re^{\star }$
the primary decision variable as it concurrently prescribes inlet velocity/volumetric flux and membrane geometry. Numerical simulations show that
 $Re^{\star }$
represents an appropriate scaling variable since the calculated
 $Be$
,
 $Sh$
and
 $\unicode[STIX]{x1D709}$
for all 114 scenarios collapse onto universal curves, especially for
 $Re^{\star }>1000$
, while for
 $Re^{\star }<1000$
the universal scaling deteriorates particularly for
 $Sh=f(Re^{\star })$
.
Within this framework, we test the validity of the analytical scalings for
 $Be$
,
 $Sh$
and
 $\unicode[STIX]{x1D709}$
derived for the straight rectangular membrane benchmark (M0), and demonstrate that
 $\unicode[STIX]{x1D709}{-}Re^{\star }$
curves can be successfully used to both identify best performing designs within each modification type (M or T), and also be employed to combine basic designs into hybrid ones to achieve improved performance. More importantly, our study provides applicability ranges in terms of the magnitude of
 $Re^{\star }$
within which morphological and topological modifications improve membrane efficiency (as measured by the performance index
 $\unicode[STIX]{x1D709}$
). We identify three separate regions. At lower
 $Re^{\star }$
, morphological changes improve the overall membrane efficiency (by reducing fouling and increasing the clean permeate flux) over the benchmark M0 and topologically altered membranes (T-designs), while the latter underperform even with respect to M0: at lower local velocities, surface roughness decreases the local velocity in proximity of the membranes and creates ideal conditions for foulant accumulation; instead, channel waviness promotes foulant segregation in the crests and troughs of the channel, while the pressure drop required to operate the system is still in check. For intermediate values of
 $Re^{\star }$
, both T and M designs improve upon the benchmark, although morphological modifications still outperform (at least by a factor of 2) topological ones. For higher
 $Re^{\star }$
, T designs are superior to all M designs, i.e. surface roughness significantly reduces fouling while only moderately increasing pressure drop; instead, in M-type membranes the gain in performance due to increased permeate flux is outweighed by the increase in pressure drop needed to maintain steady state.
To conclude, we proposed a new model to quantitatively analyse the impact that morphological and topological membrane modifications have both on fouling and energy input, while accounting for dynamic feedback between foulant bulk and surface concentration, permeate flux and pressure drop. To the best of our knowledge, this is the first work to propose a framework (i) that clearly relates (micro- and meso-scale) topological and morphological structure to system- (macro-) scale function/performance and (ii) within which the performance of different membrane designs can be assessed and optimized, while providing guidance on the most promising alteration types (morphological or topological) in terms of operating conditions. The ability to capture dynamic feedbacks allows one to both (i) quantify the temporal correlation between foulant deposition and local hydrodynamics (e.g. flow, stress, etc.) and (ii) employ this knowledge in the context of dynamic optimization of membrane performance. Ongoing work includes the development of ‘active’ methods (i.e. based on unsteady effects) as an orthogonal design axis to the more classical ‘passive’ tools (e.g. chemical, morphological and topological alterations of the membrane) to improve RO system performance.
Acknowledgement
I.B. gratefully acknowledges support by the National Science Foundation (NSF) through the award number 1533874, ‘DMREF: An integrated multiscale modelling and experimental approach to design fouling resistant membranes’.