INTRODUCTION
Agriculture is under pressure to produce more to feed rising global demands, yet pollute less especially with regard to greenhouse gas (GHG) emissions (Smith & Olesen Reference Smith and Olesen2010; Crute & Muir Reference Crute and Muir2011). Despite the significant uncertainties involved in measuring, understanding and attributing GHG emissions (Harrison & Webb Reference Harrison and Webb2001; Kindred et al. Reference Kindred, Mortimer, Sylvester-Bradley, Brown and Woods2008a,Reference Kindred, Berry, Burch and Sylvester-Bradleyb), all current GHG accounting systems show nitrogen (N) fertilizers to contribute a majority of the emissions from intensively produced arable crops (Williams et al. Reference Williams, Audsley and Sandars2006; Woods et al. Reference Woods, Williams, Hughes, Black and Murphy2010; Hillier et al. Reference Hillier, Hawes, Squire, Hilton, Wale and Smith2009, Reference Hillier, Brentrup, Wattenbach, Walter, Garcia-Suarez, Mila-i-Canals and Smith2012; Linquist et al. Reference Linquist, van Groenigen, Adviento-Borbe, Pittelkow and van Kessel2012). In addition to undertakings made at the national level to mitigate GHG emissions (UNFCCC 1998), estimated GHG intensities of crop products are acquiring increasing commercial significance (Carbon Trust 2006). Feedstocks for biofuel production are in the vanguard of this development since the prime purpose of biofuels is to cause a net reduction in GHG emissions from fuel use (DfT 2011). Hence, there are already significant and increasing pressures to reduce GHG intensities of certain crop products, and fertilizer choice and management are key candidates for achieving GHG mitigation (Snyder et al. Reference Snyder, Bruulsema, Jensen and Fixen2009; Bouwman et al. Reference Bouwman, Stehfest, van Kessel and Smith2010).
Choice between N fertilizer compounds is likely to be important due to differences in manufacturing emissions (Brentrup & Pallière Reference Brentrup and Pallière2008; Hoxha et al. Reference Hoxha, Jenssen, Pallière and Cryans2011) and different direct or indirect emissions in the field (Harrison & Webb Reference Harrison and Webb2001). These considerations must now affect fertilizer choice along with different effects on crop performance (Maddux et al. Reference Maddux, Kissel and Barnes1984; Chaney & Paulson Reference Chaney and Paulson1988; Lloyd et al. Reference Lloyd, Webb, Archer and Sylvester-Bradley1997) and differences in price. Of ‘straight’ fertilizer N consumed globally about two-thirds is urea, whereas in western and central Europe, only one-quarter of ‘straight’ N is urea, the majority being either ammonium nitrate (AN) or calcium ammonium nitrate (data for 2009 provided by personal communication with the International Fertilizer Industries Association, 2012). The urease inhibitor N-(n-butyl) thiophosphoric triamide (nBTPT; trade name AGROTAIN®) developed in the 1980s (Chien et al. Reference Chien, Prochnow and Cantarella2009) has become more widely available for use with urea. Effects of nBTPT on direct emissions of nitrous oxide (N2O) are uncertain, based on current evidence (Smith et al. Reference Smith, Dobbie, Thorman and Yamulki2006; Zaman et al. Reference Zaman, Nguyen, Blennerhassett and Quin2008; Sanz-Cobena et al. Reference Sanz-Cobena, Sánchez-Martín, García-Torres and Vallejo2012), but the reduced ammonia emissions caused by nBTPT (Watson et al. Reference Watson, Miller, Poland, Kilpatrick, Allen, Garrett and Christianson1994; Nastri et al. Reference Nastri, Toderi, Bernati and Govi2000; Chadwick et al. Reference Chadwick, Misselbrook, Gilhespy, Williams, Bhogal, Sagoo, Nicholson, Webb, Anthony and Chambers2005; Slaton et al. Reference Slaton, Norman and Kelley2011) can be presumed to confer a reduction in indirect GHG emissions, as well as the more widely reported improvement in crop response over urea alone (Watson et al. Reference Watson, Stevens and Laughlin1990; Zaman et al. Reference Zaman, Nguyen, Blennerhassett and Quin2008; Chambers & Dampney Reference Chambers and Dampney2009; Dawar et al. Reference Dawar, Zaman, Rowarth, Blennerhassett and Turnbull2010a). Prices of N as urea in Europe are generally c. 0·85 of N as AN, whereas prices for N as nBTPT treated urea (TU) are intermediate. Recent increases in prices of N fertilizers relative to grain prices have increased the economic importance of the choice between fertilizer forms.
Hoxha et al. (Reference Hoxha, Jenssen, Pallière and Cryans2011) describe the processes leading to GHG emissions during N fertilizer manufacture and their abatement; in brief, emissions are of carbon dioxide (CO2) from ammonia production and ranged from 1·2 to 2·5 kg CO2/kg NH3–N in 56 EU plants; then emissions from conversion of ammonia to nitric acid for AN manufacture are of N2O and averaged (from 104 EU plants in 2007–8) 1·12 g N2O/kg HNO3–N, but ranged from almost 0 to >2 g N2O/kg HNO3–N depending on adoption of the best available abatement technology (BAT; EFMA 2000). GHG emissions (as carbon dioxide equivalents (CO2e) using a global warming potential of 296 for N2O) associated with the manufacture of different fertilizer products have been estimated by Brentrup & Pallière (Reference Brentrup and Pallière2008) based on data provided by Jenssen & Kongshaug (Reference Jenssen and Kongshaug2003). Those associated with urea production using average European technology (AET) were 0·73 kg CO2e/kg product or, with BAT, were 0·52 kg CO2e/kg product before transport; for AN, these were compared respectively with estimates of 2·17 or 0·96 kg CO2e/kg product.
Current procedures for drawing up national GHG inventories (IPCC Reference Eggleston, Buendia, Miwa, Ngara and Tanabe2006) do not discriminate between forms of N fertilizers in either direct soil emissions or subsequent indirect emissions, and comparative studies on differences in direct emissions are minimal (Harrison & Webb Reference Harrison and Webb2001). Smith et al. (Reference Smith, Dobbie, Thorman, Watson, Chadwick, Yamulki and Ball2012) report that only 2 out of 12 experiments on grass or cereals in the UK showed N2O emissions to be reduced significantly by applying N as urea rather than AN, and these were wet grassland sites where emissions were large. Smith et al. (Reference Smith, Dobbie, Thorman, Watson, Chadwick, Yamulki and Ball2012) estimated that subsequent indirect effects on N2O evolution from ammonia emitted after urea use (Corstanje et al. Reference Corstanje, Kirk and Lark2008) would have cancelled out any difference. Thus, direct N2O emissions from drier arable sites may not differ much between urea and AN, and ammonia emissions after urea applications may be significant in affecting GHG intensities of their recipient crops.
Options to mitigate direct ammonia emissions, other than by use of AN or urease inhibitors, include avoiding urea use on high pH or calcareous soils (Fenn & Kissel Reference Fenn and Kissel1975), soil incorporation (Chien et al. Reference Chien, Prochnow and Cantarella2009), irrigation (Dawar et al. Reference Dawar, Zaman, Rowarth, Blennerhassett and Turnbull2010b; Sanz-Cobena et al. Reference Sanz-Cobena, Misselbrook, Camp and Vallejo2011) or synchronization of urea applications with rainfall events (Harrison & Webb Reference Harrison and Webb2001; Chadwick et al. Reference Chadwick, Misselbrook, Gilhespy, Williams, Bhogal, Sagoo, Nicholson, Webb, Anthony and Chambers2005). However, in temperate climates, opportunities for soil incorporation are limited since little or none is applied at sowing (e.g. 0·97 of fertilizer-N within the UK is applied after sowing; Watson et al. Reference Watson, Akhonzada, Hamilton and Matthews2008). Also, few crops are irrigated, so dry conditions cannot be moderated, and high crop yields are generally associated with large N applications that are split, often between several applications (Defra 2011a) to allow all fields on a farm to be dressed in a reasonable time. Modelling work by Misselbrook et al. (Reference Misselbrook, Sutton and Scholefield2004) showed ammonia emissions following application of urea might be reduced to 0·96 of a ‘norm’ by targeting applications according to rainfall. However, 10–20 mm of rainfall was needed to reduce emissions effectively, and rainfall through the period of N application was insufficiently reliable for this to be advocated as a management strategy. Therefore, the use of alternative N fertilizers or urease inhibitors was recommended as an approach for reducing ammonia emissions (Misselbrook et al. Reference Misselbrook, Sutton and Scholefield2004).
Both laboratory experiments (Watson & Akhonzada Reference Watson and Akhonzada2005) and field trials (Chambers & Dampney Reference Chambers and Dampney2009; Watson et al. Reference Watson, Laughlin and McGeough2009) show that nBTPT slows the hydrolysis of urea for a period after TU application, hence reduces ammonia volatilization from soils after urea applications, because rainfall and dew in that period should be sufficient to enable urea diffusion into the soil (Dampney et al. Reference Dampney, Chadwick, Smith and Bhogal2004). Chadwick et al. (Reference Chadwick, Misselbrook, Gilhespy, Williams, Bhogal, Sagoo, Nicholson, Webb, Anthony and Chambers2005) concluded that ammonia N emitted after urea application averaged 0·22 (range: 0·02–0·43) of the N applied; nBTPT (at a concentration in the applied urea of 500 ppm) reduced this to 0·08 (range: 0·02–0·17) on cultivated land, whereas emissions after AN applications were 0·03 (range: −0·03 to 0·10) of the total N applied (Chadwick et al. Reference Chadwick, Misselbrook, Gilhespy, Williams, Bhogal, Sagoo, Nicholson, Webb, Anthony and Chambers2005); nBTPT at 1000 ppm did not reduce emissions further (Chambers & Dampney Reference Chambers and Dampney2009).
Turning to effects of N forms on cereal performance in the UK, Chaney & Paulson (Reference Chaney and Paulson1988) reported 33 experiments on winter wheat conducted from 1959 to 1985 with single N amounts. Then Lloyd et al. (Reference Lloyd, Webb, Archer and Sylvester-Bradley1997) reported a series of 26 experiments with a range of N amounts (coded SB15; conducted from 1983 to 1985). A more recent research programme (coded ‘NT26’; Defra 2006; Chambers & Dampney Reference Chambers and Dampney2009), of which relevant findings are reviewed above, reassessed effects on performance of many crops, including cereals. The NT26 conclusion from ten N response experiments on winter cereals in 2004/05 (Dampney et al. Reference Dampney, Dyer, Goodless and Chambers2006) was that inefficiencies of urea relative to AN were significantly larger than those estimated by Chaney & Paulson (Reference Chaney and Paulson1988) and Lloyd et al. (Reference Lloyd, Webb, Archer and Sylvester-Bradley1997), even though the latter specifically targeted high risk soils. Both SB15 and NT26 studies compared N forms through their effects on grain N offtake and economic optimum N amounts from multi-level N experiments. The experiments reported by Lloyd et al. (Reference Lloyd, Webb, Archer and Sylvester-Bradley1997) showed similar yields and N optima with urea as with AN, but slightly lower grain protein concentrations with urea, whereas the NT26 experiments showed average N optima with urea and TU to be 1·19 and 1·09, respectively, of that with AN, and these results were corroborated by poorer N recovery with urea and TU, and by the corresponding ammonia emissions measured with these products in the co-located experiments reported by Chadwick et al. (Reference Chadwick, Misselbrook, Gilhespy, Williams, Bhogal, Sagoo, Nicholson, Webb, Anthony and Chambers2005). However, the discrepancy between the two studies remains unexplained. Possible causes include different agronomy (cultivars, crop yields and weather), different data analysis (curve fitting approaches differed slightly) or different interpretation of results; Lloyd et al. (Reference Lloyd, Webb, Archer and Sylvester-Bradley1997) tested the significance of treatment effects across sites, whereas Dampney et al. (Reference Dampney, Dyer, Goodless and Chambers2006) did not. Thus, the purpose of the present paper is to jointly reassess the effects of AN, urea and TU on agronomic performance of winter cereals using data from both SB15 (Lloyd et al. Reference Lloyd, Webb, Archer and Sylvester-Bradley1997) and NT26 (Dampney et al. Reference Dampney, Chadwick, Smith and Bhogal2004, Reference Dampney, Dyer, Goodless and Chambers2006) in order to estimate the implications of N fertilizer choice for GHG intensities of wheat using current GHG accounting methodologies.
MATERIALS AND METHODS
Data sources, sites, treatments and measurements
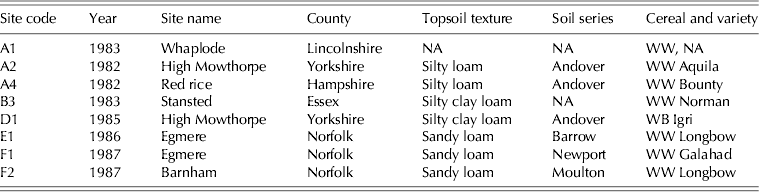
Data for grain yield (t/ha at 0·85 dry matter (DM)) and grain N concentration (g/g DM) were accessed from the ADAS ‘NITRIC’ database for all experiments in the series (coded SB15) reported by Lloyd et al. (Reference Lloyd, Webb, Archer and Sylvester-Bradley1997) and the series (coded NT2603 and NT2605) reported by Dampney et al. (Reference Dampney, Chadwick, Smith and Bhogal2004, Reference Dampney, Dyer, Goodless and Chambers2006). Sites for the SB15 series were chosen to favour chalk soils, to emphasize any yield disadvantage from urea compared with AN, but they also included sandy loams and clay loams (Table 1). Soils for the NT26 series ranged from sandy to heavy clay. Most sites were in the south and east of England; one was in Scotland. One site (code B4; Lloyd et al. Reference Lloyd, Webb, Archer and Sylvester-Bradley1997) of the 26 experiments in the SB15 series was excluded because the data were variable and curves could not be fitted with the approach described below, and an additional eight experiments in the SB15 series were included (Table 1) which were excluded by Lloyd et al. (Reference Lloyd, Webb, Archer and Sylvester-Bradley1997) because of differences in experiment design (e.g. maximum N rates or timing treatments). Thus, data from 33 experiments in the SB15 series were included in the analysis here. These compared AN and urea (but not TU) at 6 or 7 N rates, including none, from 1982 to 1987. Maximum N rates ranged from 230 to 640 kg/ha, and always exceeded the fitted N optima. Data analysed here were means of split N timing treatments: either 40 kg/ha applied early (in late February or March) and the remainder at the start of stem extension (GS30; Tottman Reference Tottman1987), or 40 kg/ha early, half the remainder applied at GS30 and the other half 2 weeks later.
Details of sites included in the analysis of the SB15 series of experiments, additional to those reported by Lloyd et al. (Reference Lloyd, Webb, Archer and Sylvester-Bradley1997)

NA, not available.
Four experiments were included from the NT2603 series harvested in 2003 (sites 8, 9, 11 and 13 as reported by Dampney et al. Reference Dampney, Chadwick, Smith and Bhogal2004). These compared AN, urea and TU at 4 or 5 N rates, including none. Maximum N rates ranged from 170 to 270 kg/ha, and always exceeded the fitted N optima; however, three sites from the NT2603 series (sites 10, 12 and 14) were excluded because response curves could not be fitted. Ten experiments were included from the NT2605 series (sites 3–7 harvested in 2004 and sites 11–15 harvested in 2005, as reported by Dampney et al. Reference Dampney, Dyer, Goodless and Chambers2006). These also compared AN, urea and TU but with 7 N rates from 0 to a maximum of 340 kg/ha, which always exceeded the fitted N optima. Experiments in the NT2605 series included measurements of straw dry weight and N content (kg/ha), as well as grain yield and grain N concentration, so these allowed comparisons of effects on harvest indices and total above-ground N recovery, as well as grain yield and grain N offtake. It should be noted that N response experiments in the NT2605 series were always co-located with the NT26 experiments reported by Chadwick et al. (Reference Chadwick, Misselbrook, Gilhespy, Williams, Bhogal, Sagoo, Nicholson, Webb, Anthony and Chambers2005) in which ammonia emissions were measured through 21 days after applications of a single rate of N (100 kg/ha) as AN, urea, TU along with reference measurements made with no N applied; these adjacent experiments are relevant to the interpretation of responses reported in the present paper.
Statistical analyses
As with Lloyd et al. (Reference Lloyd, Webb, Archer and Sylvester-Bradley1997) and Dampney et al. (Reference Dampney, Dyer, Goodless and Chambers2006), the responses of grain yield to increasing rates of applied N were fitted with a linear plus exponential function (LpE; George Reference George1984) of the form:
 $$y = a + b \times r^N + c \times N$$
where y is the yield in t/ha at 0·85 g/g DM, N is the total fertilizer N applied (kg/ha), and a, b, c and r are parameters determined by statistical fitting. However, Lloyd et al. (Reference Lloyd, Webb, Archer and Sylvester-Bradley1997) modified this to:
 $$y = a + b \times (1-r^N ) + c \times N$$
to ensure that y=a (rather than a–b) at N = 0 so as to constrain curves for different forms of N within an experiment to have a single intercept (LpEa). As advocated by George (Reference George1984) they also constrained r at 0·99, so that all treatments and site effects were described by fitted values of a, b and c. On the other hand, Dampney et al. (Reference Dampney, Dyer, Goodless and Chambers2006) adopted a non-linear fitting approach that allowed parameter r, as well as a, b and c, to vary between all sites and forms of N, irrespective of whether differences in r accounted for more variation than with r fixed (say within one experiment or within a group of experiments). However, note that, in cases where the value of the fitted r was outside the range 0·8299–0·9999, they refitted the function with r fixed at 0·99.
The initial intention in the present reanalysis was to use a common curve fitting approach for all data based on the LpEa function of Lloyd et al. (Reference Lloyd, Webb, Archer and Sylvester-Bradley1997) but which tested the validity (through improvement of variance accounted for) of allowing parameters b, c and r to differ between N forms, hence to use the fitted parameters to summarize effects of N form on the asymptote (a+b) separately from N ‘efficiency’ (c and r). However, the data proved insufficiently precise to distinguish responses to N forms within any single experiment (with one exception). The approach adopted here was therefore similar to that of Dampney et al. (Reference Dampney, Dyer, Goodless and Chambers2006) but with the LpE function being fitted in two ways: (i) with all parameters including r allowed to vary between experiments and N forms; or (ii) with parameters a, b and c varying but with the r parameter jointly optimized for both or all three N forms within a site. In both approaches, fits were accepted with r > 1 (the range of r was 0·9629–1·0255). With approach (i) there were eight experiments where a curve could not be resolved or fitted poorly, so this curve was replaced with the curve using approach (ii). Replacement rather than omission of curves enabled comparisons between N forms with approach (i) using the same experiments as with approach (ii). Effects of N forms were then made through cross-site analysis of derivatives of the individual curves, particularly the economic optimum (Nopt) and the grain yield at Nopt. Thus
 $${\rm N}_{{\rm opt}} = [{\rm Ln}\{ (P/{\rm 1}000-c)/(b \times {\rm Ln}\;r)\} ]/{\rm Ln}\;r$$
where P is the price ratio of N (£/kg) to grain (£/kg), taken here as six.
Estimates of ‘recovery’ of applied N were made after fitting grain N offtake (Noff, kg/ha) data with a split line function, the second line being constrained to have a zero slope, as follows:
 $${\rm N}_{{\rm off}} = [{\rm N} \lt t \times \{ a-b \times (t-{\rm N})\} + {\rm N} \gt t \times a]$$
where t, a and b are fitted parameters describing the saturating amount of applied N, the asymptote and net N recovery at N<t, respectively. Where N harvest index data were available (NT2605 experiments) they were divided into Noff to give crop N uptake (Nup, kg/ha) and these were fitted with the same split line function. These fitted parameters were then used to interpolate Noff and Nup at Nopt and at 0 N applied, hence to calculate net recovery of applied N at Nopt for each N form in each experiment. Rather than fitting grain N concentration separately, effects on this were directly calculated from fitted grain yield and Noff.
GHG estimation
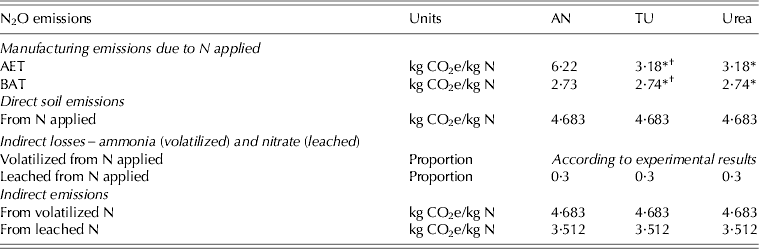
GHG emissions in CO2e, adjusting for the greater global warming potentials of methane (25) and N2O (298Footnote 1), associated with the production of a tonne of wheat were calculated using a PAS2050 compatible approach (BSi 2011) as described by Berry et al. (Reference Berry, Kindred and Paveley2008, Reference Berry, Kindred, Olesen, Jorgensen and Paveley2010). An advantage of PAS2050 over other GHG accounting methods is that it can distinguish between fertilizer types and can allow different indirect emissions, rather than using a single IPCC default value.
Total GHG emissions of 823 kg/ha CO2e were assumed for production, application and use of all non-N inputs (seed, non-N fertilizers, lime and fuel for cultivations) and nil was assumed for grain drying (Berry et al. Reference Berry, Kindred and Paveley2008, Reference Berry, Kindred, Olesen, Jorgensen and Paveley2010). Lime use was set at 475 kg/ha (instead of 300 kg/ha assumed by Berry et al. Reference Berry, Kindred and Paveley2008) to fully neutralize the soil acidity associated with the use of 190 kg/ha fertilizer N (Archer Reference Archer1985). GHG emissions associated with fertilizer manufacture were taken from Brentrup & Pallière (Reference Brentrup and Pallière2008), using both their ‘average European 2006’ (AET) and ‘best available technology’ (BAT) scenarios (Table 2). However, although Brentrup & Pallière (Reference Brentrup and Pallière2008) assumed that direct N2O emissions from fertilizer N related to the nitrate content of the fertilizer, direct N2O emissions were assumed in the present work to be 0·01 of applied N for all N forms (IPCC Reference Eggleston, Buendia, Miwa, Ngara and Tanabe2006) because comparisons of different N forms in UK arable conditions show no consistent difference in N2O emissions (Smith et al. Reference Smith, McTaggart, Dobbie and Conen1998, Reference Smith, Dobbie, Thorman and Yamulki2006, Reference Smith, Dobbie, Thorman, Watson, Chadwick, Yamulki and Ball2012).
Factors used to model GHG emissions attributed to wheat grown with AN, urea and TU manufactured with average AET in 2006 and BAT, as defined by Brentrup & Pallière (Reference Brentrup and Pallière2008)
* Includes CO2 subsequently emitted due to hydrolysis after application to soil.
† Manufacturing emissions of nBTPT were taken as being similar to pesticides (5·3 kg CO2e/kg active ingredient; Berry et al. Reference Berry, Kindred and Paveley2008), so at 500 or 1000 ppm in urea these contributed negligibly (up to 0·0022 kg CO2e/kg N) to manufacturing emissions of TU-N.
Proportions of applied N assumed to be volatilized depended on the N form used, according to interpretation of the experiments analysed here, and taking into account ammonia emissions measured in experiments adjacent to the NT26 response experiments (Chadwick et al. Reference Chadwick, Misselbrook, Gilhespy, Williams, Bhogal, Sagoo, Nicholson, Webb, Anthony and Chambers2005), but the proportion leached was assumed to be 0·3 in all cases (IPCC Reference Eggleston, Buendia, Miwa, Ngara and Tanabe2006). Proportions of volatilized and leached N emitted as N2O–N were 0·01 and 0·0075, respectively (IPCC Reference Eggleston, Buendia, Miwa, Ngara and Tanabe2006). Crop residue N ranged from 78 to 91 kg/ha, being the sum of 4·7 kg/t grain yield as roots (IPCC Reference Eggleston, Buendia, Miwa, Ngara and Tanabe2006) plus 0·28 of crop N uptake as straw (leaves and stems) and chaff (in keeping with the mean N harvest index of 0·72 measured in NT26 experiments), assuming soil N uptake of 50 kg/ha and fertilizer N uptake in keeping with N recovery of the fertilizer; 0·01 of this was assumed to be emitted as N2O–N (IPCC Reference Eggleston, Buendia, Miwa, Ngara and Tanabe2006). In estimating and allocating emission intensities it was assumed that the only crop product was grain; thus all straw was assumed to be incorporated into the soil after harvest, not sold. The emission intensity was thus simply the emissions per hectare divided by the grain yield.
RESULTS
Description of crop responses to fertilizer N
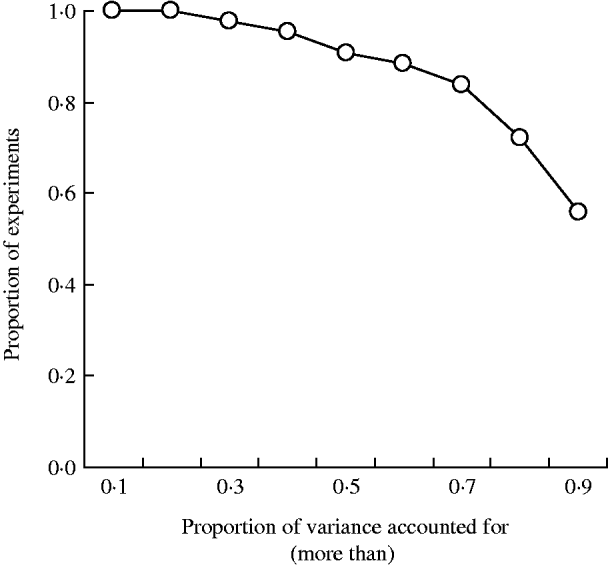
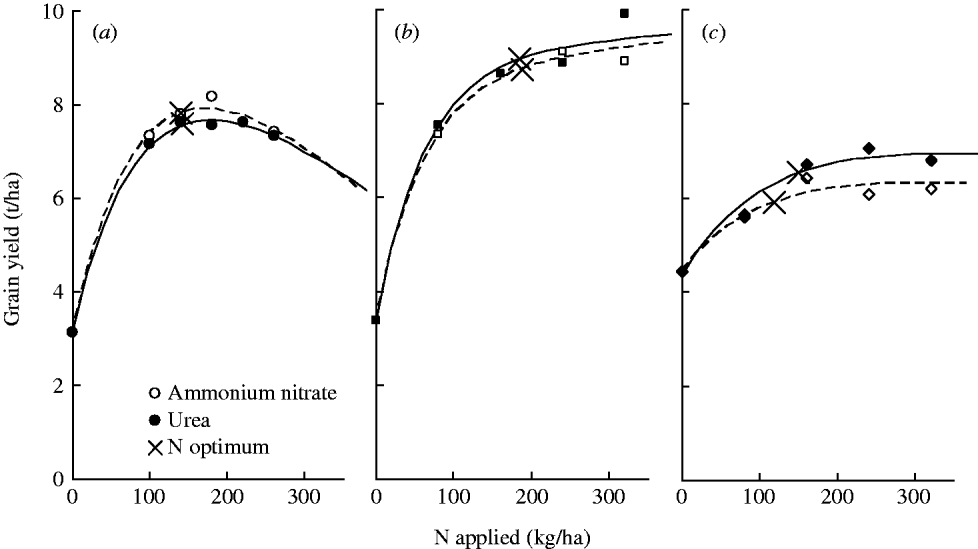
The LpE function generally fitted the yield responses to different N forms well (Fig. 1); the few experiments that poorly fitted had high residual variation rather than lack of fit. There was no obvious difference between SB15 and NT26 experiments in variance accounted for by the LpE function. The effect of fitting LpE rather than LpEa was generally small; the means over all experiments of the fitted intercepts for AN and urea were both 3·92 t/ha, and in the NT26 experiments they were 4·54 t/ha for both AN and urea and 4·51 t/ha for TU. In only one of all 47 experiments was significantly more variation accounted for by allowing a, b and c to vary between N forms, rather than all parameters being constant or just a varying, hence only in that one experiment (Barnham, Norfolk, 1987; Fig. 2(c)) there was statistical justification for inferring an effect of N form on Nopt. The apparent cause of the different Nopt in this experiment was atypical, it being associated with a larger asymptotic yield for urea than AN. In most other experiments (43) a single curve accounted for as much variation as allowing curves to differ between N forms. In the other three experiments there was an effect of N form, but only on a, hence Nopt was unaffected. In each of these cases, a for urea was smaller than a for AN. In one of these cases, TU was also tested and a was larger for TU than for AN or urea.
Variance accounted for by fitting the LpE function to responses of grain yield to applied N (in two or three different forms) in 47 experiments. There was no difference between fitting LpE with the r parameter common within an experiment for different N forms or allowing r to vary.
Example responses and fitted LpE curves (with parameters a, b and c varying) of grain yield to applied nitrogen as AN (open symbols; dashed lines) or urea (closed symbols; full lines) at (a) Egmere, Norfolk 1985 (circles; R 2 = 0·944; curves differ in parameter a only), (b) 1986 (circles; R 2 = 0·942; curves not significantly different) and (c) Barnham, Norfolk 1987 (diamonds; R 2 = 0·902; curves differ in parameters a, b and c). Crosses mark economic optima at a N : grain price ratio of 6.
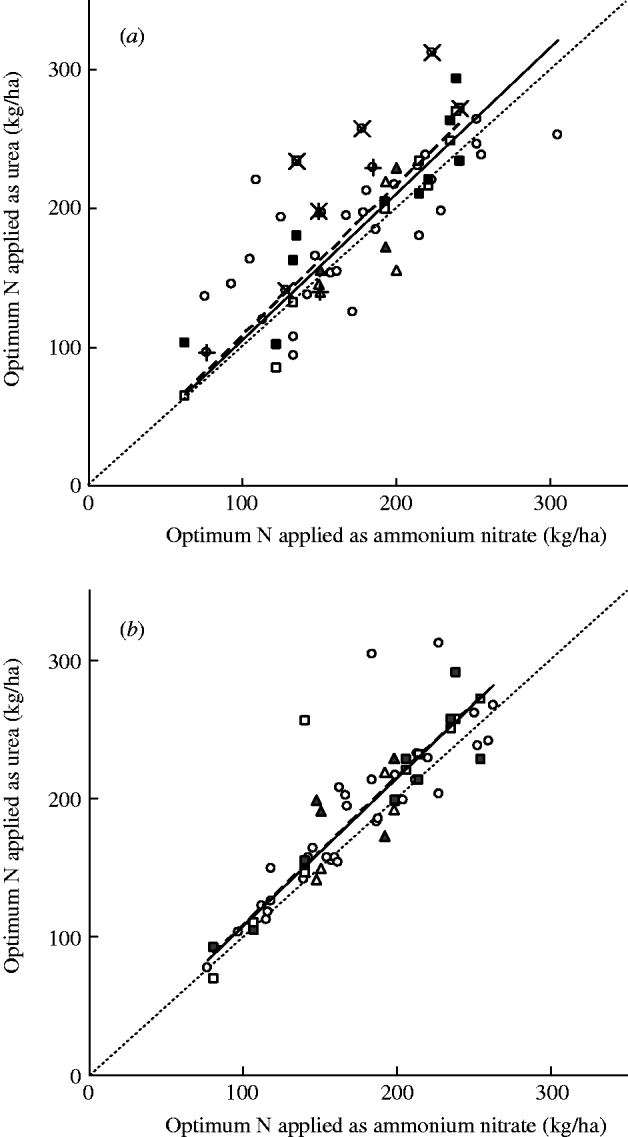
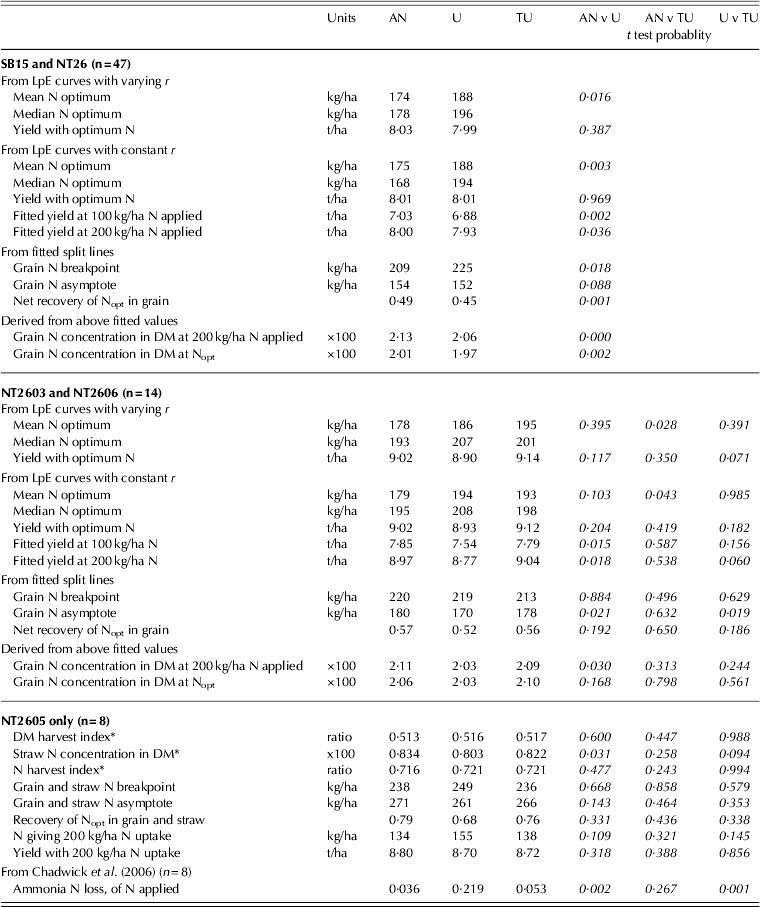
Despite the inability to distinguish responses to the different forms of N within single experiments, when responses to the different N forms were independently fitted with the LpE function (whether with r varying or common within an experiment), cross-site analysis of Nopt, yield at Nopt and other derivatives from the fitted responses showed some highly significant differences between N forms (Table 3). As would be expected, the correlation between N optima for AN and urea increased when r was held common within an experiment (Fig. 3); this made little difference to the slopes of the relationships, which were always >1, but the slope was only significantly >1 when r was held common within an experiment. As would be expected for experiments conducted 20 years apart, with distinctly different varieties, fertilized grain yields were larger in the NT26 series (mean 9·3 t/ha) than in the SB15 series (mean 7·6 t/ha). However, mean Nopt was only 5–7 kg/ha greater in the more recent experiments; this compares with a difference of 28 kg/ha found in direct comparisons of varieties from these two periods (Sylvester-Bradley & Kindred Reference Sylvester-Bradley and Kindred2009). It may be that favouring chalky soils in the earlier SB15 series (Lloyd et al. Reference Lloyd, Webb, Archer and Sylvester-Bradley1997) caused N optima to be relatively large in these experiments (Grylls et al. Reference Grylls, Webb and Dyer1997).
Summary of experimental series SB15 (circles), NT2603 (triangles) and NT2605 (squares) showing optimum N amounts determined for N applied as AN and urea (open symbols) or TU (solid symbols) from LpE curves fitted to grain yields with the r parameter (a) allowed to vary between each curve and (b) common within each experiment. Crossed points in (a) use values for AN (+), urea (×) or TU ( ) from curves fitted with common r. Regression lines with zero intercept for urea (full) and TU (dashed) have respectively slopes of 1·055 and 1·080 (a) and 1·069 and 1·072 (b). Coefficients of determination were respectively 0·52 and 0·76 (a) and 0·75 and 0·80 (b). Dotted lines show direct equivalence.
Summary results from analysis of experiment series SB15 1982–1987) and NN26 2003–2005) showing means and medians over sites with probabilities of differences) determined from fitting individual LpE curves to each N form at each site. Grain yields were fitted both with r held constant within each site, and with r allowed to vary within each site; N recoveries are expressed at the Nopt determined with constant r, interpolated after fitting N offtake and N uptake kg/ha) with two split lines. Grain N concentration in DM was calculated from the fitted grain yields and N offtakes
* Mean of all N treatments.
Over all 47 experiments the mean Nopt for urea of 188 kg/ha was c. 14 kg/ha greater than for AN (AN × 1·08) depending on the LpE fitting approach (Table 3). This effect was statistically significant with both fitting approaches; it was slightly larger (AN × 1·11–1·16) if medians rather than means were compared. The effect was similar if only NT26 experiments were included but, with fewer experiments, it was not statistically significant. Overall, it seems clear that the extent of the urea difference from AN derived in various ways as described in the present work was substantially less than the factor of 1·20 deduced from NT26 experiments by Dampney et al. (Reference Dampney, Dyer, Goodless and Chambers2006). This discrepancy in interpretation of the same 14 experiments (NT2605) arose largely because Dampney et al. (Reference Dampney, Dyer, Goodless and Chambers2006) fixed r at 0·99 in two cases (Site 7 Boxworth 2004; Site 11 Rothamsted 2005), which happened to decrease Nopt for AN and TU or increase the Nopt for urea disproportionately. The discrepancy was not due to the use of a different N : grain price ratio, since the ratio used by Dampney et al. (Reference Dampney, Dyer, Goodless and Chambers2006) was six, as here; in any case, changing the price ratio to three on the 38 experiments for which fitted curves gave N optima at both price ratios within the range of applied N tested, served to decrease rather than increase the AN–urea difference. Surprisingly, the mean Nopt for TU of ∼194 kg/ha in NT26 experiments was greater than for urea and significantly greater than for AN.
Although, over all experiments, fitted yields at fixed N levels were significantly less with urea than with AN (−0·15 t/ha at 100 kg/ha N and −0·07 t/ha at 200 kg/ha N), the mean yield at Nopt did not differ between AN and urea (Table 3). However, there were some apparent yield effects in the NT26 series: although not statistically significant, TU appeared to give slightly larger yields than AN or urea (+0·12 and +0·24 t/ha); this may partly explain the greater Nopt for TU. Maximum grain N content (kg/ha), shown by the asymptote of the two split lines fitted, was very similar for both N forms in the full dataset, but in the NT26 series the grain N asymptote was significantly less with urea than with AN or TU by c. 9 kg/ha. Grain N concentration was less with urea than AN both at 200 kg/ha N applied and at Nopt, and straw N concentration was also less with urea than with AN or TU, but for total crop N there was not enough precision in the NT2605 experiments to show the 10 kg/ha smaller asymptote with urea than AN to be statistically significant.
Net recoveries in grain of Nopt amounts were significantly less with urea (0·45) than AN (0·49). Both grain and total crop N recoveries in the NT26 series were also less with urea, grain N recovery being 0·52 compared with 0·57 (AN) and 0·56 (TU), but these differences were not significant. It appears that a combination of the poorer recovery and the smaller asymptote caused the amount of N needed to achieve the asymptote (the ‘breakpoint’) to be similar for all N forms. However, these amounts were on average 25 kg/ha larger than Nopt. Thus, N recovery was generally positive at super-optimal N levels, and it can be concluded that the significantly larger Nopt with urea compared with AN was largely due to poorer N recovery, not to a change in asymptote. Although there were a few instances where maximum yields (as indicated by parameter a) were significantly less with urea, these cases were too few to conclude that urea was generally less able to support the yields achievable with AN.
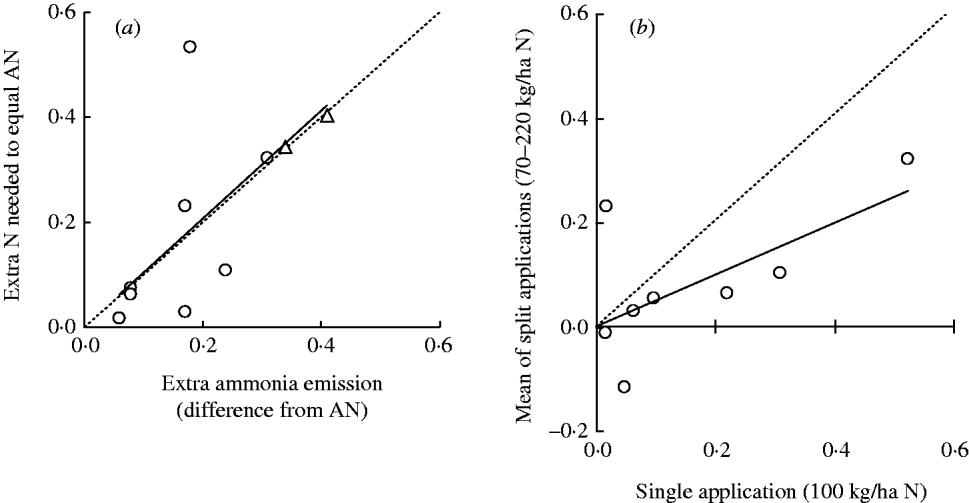
Chadwick et al. (Reference Chadwick, Misselbrook, Gilhespy, Williams, Bhogal, Sagoo, Nicholson, Webb, Anthony and Chambers2005) reported that ammonia emissions from urea, for the 10 NT2605 sites included in the present paper, averaged 0·22 of N applied, compared with only 0·036 for AN. This difference is more in keeping with the conclusion of Dampney et al. (Reference Dampney, Dyer, Goodless and Chambers2006) that 0·20 more urea–N was needed to achieve the same crop performance as AN–N, than the conclusion in the present paper that only 0·08 more urea–N was needed. Although these two studies used the same sites and seasons, and their experiments were often adjacent, the experiments tested different treatments. Ammonia emissions were measured after single applications of 100 kg/ha N had been made between late March and early May, whereas crop responses were measured with total N amounts (other than nil) ranging from 40 to 340 kg/ha, split between two or (with larger amounts) three applications made from late February to early May. The single N applications in the emissions experiment were not always made on the same day as one of the split applications in the response experiment. It is, however, important to note that although there is a reasonably good relationship among the ten ammonia emissions experiments between the extra urea–N needed to match crop N uptake with AN and the extra ammonia emissions from urea compared with AN (Fig. 4(a)), as was reported by Chadwick et al. (Reference Chadwick, Misselbrook, Gilhespy, Williams, Bhogal, Sagoo, Nicholson, Webb, Anthony and Chambers2005), the extra urea–N needed to match crop N uptake with AN in the emissions experiments is approximately double that calculated for N rates from 70 to 220 kg/ha in the eight response experiments (Fig. 4(b)). On average, the relative inefficiency of urea in the response experiments is only half that in the emissions experiments. Thus, the different conclusions on fertilizer performance appear to have arisen from the difference between single and split applications. Possibly the split applications served to ensure that each individual application was small, so avoiding the disproportionate ammonia emissions associated with large urea applications (Black et al. Reference Black, Sherlock, Smith, Cameron and Goh1985; Misselbrook et al. Reference Misselbrook, Sutton and Scholefield2004); alternatively, early applications may have coincided with more conducive conditions for efficient uptake or the first split may have enhanced crop response to subsequent applications. In any case, it appears that the discrepancy between the effects of urea on net N recovery and on ammonia emissions (Table 3) resulted from a treatment difference between the two series of adjacent NT26 experiments. It does not appear to have arisen from measurement inaccuracies; for example possible exaggeration of ammonia emissions (McInnes et al. Reference McInnes, Ferguson, Kissel and Kanemasu1986; Ferguson et al. Reference Ferguson, McInnes, Kissel and Kanemasu1988; Sherlock et al. Reference Sherlock, Freney, Smith and Cameron1989; Génermont & Cellier Reference Génermont and Cellier1997) was not corroborated by crop N uptake (Fig. 4(a)). Also, levels of N recovery in the NT26 response experiments were similar to those measured 20 years previously in the SB15 experiments (Lloyd et al. Reference Lloyd, Webb, Archer and Sylvester-Bradley1997), and both indicate a relative efficiency of about 0·92 for urea compared with AN (Table 3).
The extra urea–N needed to achieve the same crop N uptake as with a single application of 100 kg/ha N as AN, (a) as it related to ammonia N emissions measured though 21 days after the N was applied at 10 tillage sites (y = 1·03x; R 2 = 0·43) (Chadwick et al. Reference Chadwick, Misselbrook, Gilhespy, Williams, Bhogal, Sagoo, Nicholson, Webb, Anthony and Chambers2005), and (b) as it related to the mean extra urea–N needed, estimated in the same way, but from adjacent experiments at eight of the same sites which used split N applications (Dampney et al. Reference Dampney, Dyer, Goodless and Chambers2006) (y = 0·50x; R 2 = 0·40). Sites indicated by triangles in (a) are missing from (b). Dotted lines show direct equivalence.
The efficiency of TU must be deduced from its performance in the NT26 series alone, but moderated by the conclusion from all experiments that relative efficiency of urea was c. 0·92 of AN, not 0·80. Despite the greater Nopt with TU than with AN, other aspects of performance with TU were similar to AN and better than urea. It must thus be presumed that the slightly larger (not significant) ammonia emissions with TU than with AN corroborate the slightly smaller net recoveries with TU (not significant) and that these combined with the slightly greater yield with TU (not significant) to give the significantly larger Nopt with TU (Table 3).
Summary yield responses for different N forms and scenarios for GHG estimation
In order to estimate GHG intensities of cereal grain grown with different N forms it was necessary to derive a representative yield response curve for each N form. It was not possible to distinguish directly the effects of N forms on parameters of the LpE function. However, N form could not affect the intercept of the N response and it rarely affected the asymptote. Thus, only parameters c and r of the LpE response function were used to describe effects of N form; these were derived indirectly to represent the differences apparent from the multi-site analysis above. ‘Standard’ values were taken for parameters a (9·66) and b (−6·05) which, with standard values (for AN) of −0·004 for c and 0·9900 for r, gave a Nopt of 190 kg/ha and a yield at Nopt of 8·00 t/ha, both being similar to the current average on-farm performance of wheat in the UK (Defra 2011a). The standard values for c and r were set to provide a similar response shape to that found for responses of modern UK wheat varieties to N as AN (Sylvester-Bradley et al. Reference Sylvester-Bradley, Kindred, Blake, Dyer and Sinclair2008).
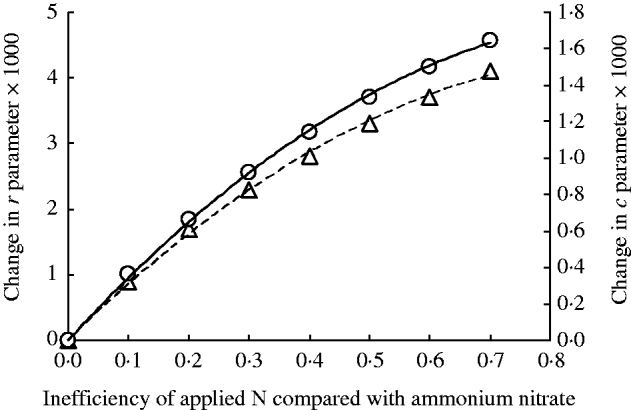
To determine how urea N inefficiency affected parameters c and r, amounts of applied N were then calculated for successively increasing levels of inefficiency relative to AN from 0 to 0·7 in steps of 0·1. Thus, at an inefficiency of 0·5, it was assumed that the same yield would be achieved with 300 kg N/ha applied as urea as with 200 kg N/ha as AN. The yields as predicted by the LpE parameters for AN were then refitted for each level of inefficiency to show that, as inefficiency increased, a and b remained constant while c and r increased (Fig. 5). The effects of relative inefficiency of N form on c and r were then fitted with polynomial functions (Fig. 5) so that the effects of any level of inefficiency of an N form on yield response could be interpolated.
Effect on c (circles) and r (triangles) parameters of the LpE function when fitted to the standard response of grain yield to increasing applied N (where a = 9·66, b = − 6·05, c = − 0·004, r = 0·99) due to decreasing efficiency of that applied N relative to the standard N form. For changes in c × 1000, y = − 1·834.x 2 + 3·6149x. For changes in r × 1000, y = − 4·5798.x 2 + 8·979.x.
Values for a, b, c and r for four response scenarios were then derived: (i) for AN or TU with equal relative inefficiency (AN; TU0), (ii) for TU with 0·05 relative inefficiency plus 0·2 t/ha yield advantage at Nopt (TU5), (iii) for urea with 0·1 relative inefficiency (U10) and (iv) for urea with 0·2 relative inefficiency (U20). The yield advantage at Nopt for TU5 was achieved by adding 0·2 t/ha to a and subtracting 0·2 t/ha from b (not changing c or r) such that the yield with 0 N was unaffected. The total effect of TU5 on Nopt was 10–12 kg/ha, about half that found in the NT26 experiments (Table 3). It must thus be surmised that TU changed the yield response to applied N in a way that was additional to its effects on N recovery or yield; this is not easy to explain given the lack of significant or substantial difference between AN and TU in N harvest index or straw N concentration in the NT26 experiments (Table 3), so it may be that the significantly larger Nopt for TU than for AN was merely a chance effect.
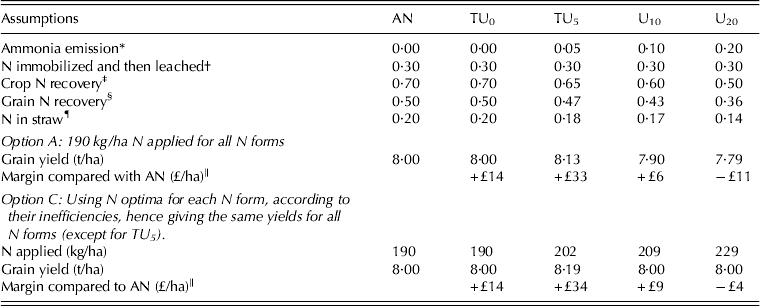
Further estimates of agronomic performance (ammonia emission, N leached, crop N and grain N uptakes, hence straw N returned to the soil after harvest) were then made for each of the four N response scenarios (Table 4) to enable GHG estimation (BSi 2011). For each scenario, leaching was taken as 0·3 of N applied (IPCC Reference Eggleston, Buendia, Miwa, Ngara and Tanabe2006) while ammonia emissions and straw N were set to reflect experimental results in Table 3.
Assumed agronomic and economic performance of AN, urea (U) and TU for two options by which these fertilizers may be used. TU is considered with both equivalent agronomic performance to AN (TU0) and with increased yield and ammonia emissions (TU5). Urea is considered with ammonia emissions of both 0·10 (U10) and 0·20 (U20), hence consequent effects on crop N recovery
* Set to fully account for differences in crop N recovery from AN, and used to estimate indirect emissions.
† Set to account fully for N not recovered by the crop or volatilized as ammonia, and used to estimate indirect emissions associated with leached N.
‡ Calculated from grain recovery using the mean of N harvest index in NT2605 experiments of 0·72.
§ Derived from results of the SB15 and NT26 studies.
¶ Calculated from grain recovery using the N harvest index of 0·72, and used to estimate GHG emissions from crop residue N.
∥ Assumes a grain price of £150/t and a N:grain price ratio of 5.
Options for fertilizer use and their economic repercussions were then considered for each response scenario. Economic margins (Table 4) were calculated using a typical recent grain price of £150/t and a N : grain price ratio of 5 for AN, in keeping with current fertilizer recommendations (Anon. 2010). Urea–N was then assumed to cost 0·85 of AN–N, and TU–N was assumed to cost 0·90 of AN–N (based on recent UK prices). Four options were then considered: Option A: fertilizer N might be used without adjustment; Option B: its use might be adjusted due to the relative inefficiency of the chosen N form; Option C: its use might be adjusted further for the effect of inefficiency on the effective price of the fertilizer N, hence achieving the same yield as with AN; Option D: it might be adjusted as in Option C but also for the difference in normal price of each N fertilizer.
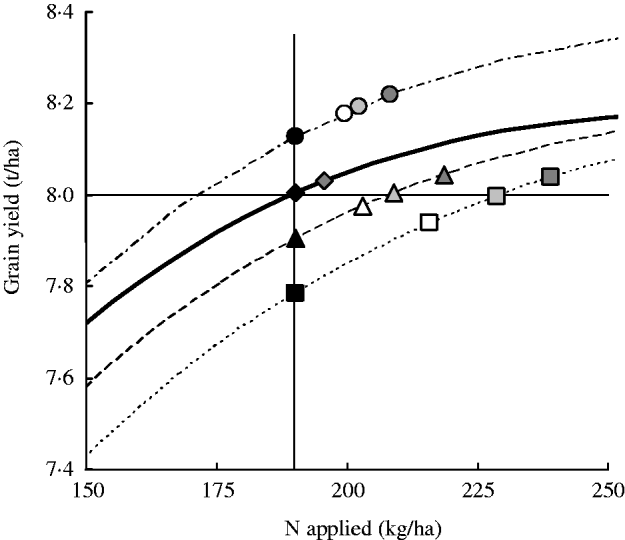
The effects of these different decision options on Nopt for each response scenario are shown in Fig. 6. The largest effect of the decision options was with U20, the Nopt for Option D being 49 kg/ha N greater than for Option A, and the yield at Nopt for Option D being increased by 0·26 t/ha. With U20, the penalty from ignoring the effects of the 0·80 relative efficiency of urea on margin over fertilizer cost was £6–7/ha, but with other scenarios there was very little effect of the different fertilizer use options on margin over fertilizer cost, so only two options (A and C) are considered further. With either Option A or C the effect of using urea on margin over fertilizer cost compared with AN was +£14/ha with TU0 or +£34/ha with TU5 but +£9/ha or less with U10, or −£4 or less with U20 (Table 4). Thus, there was some economic advantage in choosing to use TU rather than urea. However, it now remains to be seen (below) whether these financial differences between N forms are associated with worthwhile differences in GHG intensities.
Assumed responses of grain yield to AN or TU (diamonds) with 0 ammonia emissions, urea with 0·10 ammonia N emissions (triangles), urea with 0·20 ammonia N emissions (squares), and TU giving additional yield and 0·05 ammonia N emissions (circles), with optimum N amounts for Options A (closed symbols), B (open symbols), C (grey symbols) and D (dark grey symbols), as described in the text and Table 4. The horizontal and vertical lines indicate the ‘base scenario’, yielding 8 t/ha grain with 190 kg/ha AN–N.
Estimated effects of N forms on GHG intensities
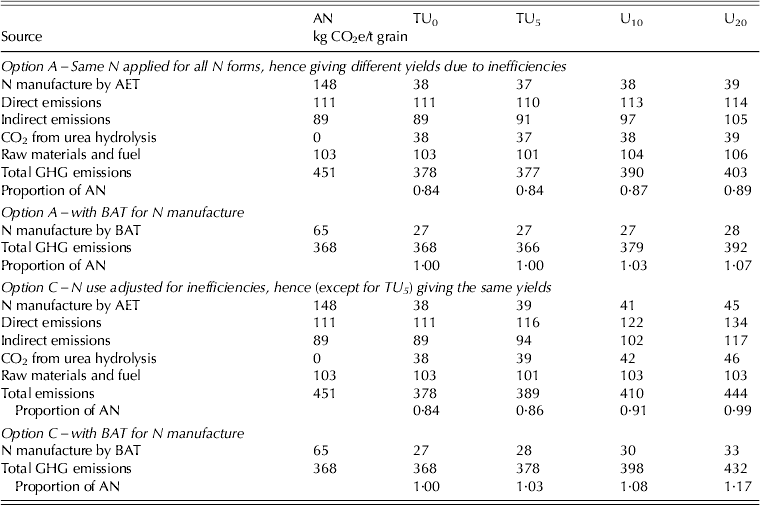
Given that grain yields were almost the same for all scenarios, only GHG intensities are reported in the present paper. Estimates were separated into contributions from manufacturing, direct field emissions of N2O and CO2 from urea hydrolysis, indirect emissions including those attributed to soil-incorporation of crop residues, and other raw materials such as seed, non-N fertilizers and fuel (Table 5). Using AN made by AET, the largest contribution to GHG intensity was from fertilizer manufacture at 148 kg CO2e/t grain; manufacturing emissions were much smaller at 37–39 kg CO2e/t grain with urea fertilizers and, even if direct CO2 emissions from urea hydrolysis are included, manufacturing emissions for urea made by AET (at 74–91 kg CO2e/t grain) were less than for AN made by AET. Manufacturing emissions for urea made by BAT plus CO2 from urea hydrolysis were very similar to AN made by BAT. However, direct soil emissions were always large at 110–134 kg CO2e/t grain so comprised the largest contribution to GHG intensities for urea fertilizers.
Contributions to estimated GHG intensities of wheat grown with AN, urea or TU according to manufacture with 2006 AET 2006 or BAT (Brentrup & Pallière Reference Brentrup and Pallière2008), and according to the scenarios for N forms and the two N use options defined in Table 4. TU is considered with both equivalent agronomic performance to AN (TU0) and with increased yield and ammonia emissions (TU5). Urea is considered with ammonia emissions of both 0·10 (U10) and 0·20 (U20) of N applied. Indirect emissions include those associated with ammonia volatilization, nitrate leaching and incorporation of N in crop residues including straw
If urea or AN were made by BAT, approximately half of the GHG intensity of grain was directly attributable to N fertilizer use, and nearly 0·6 of GHG intensity was due to N fertilizer use if AN was made by AET. The remaining portion of these GHG intensities was due to other raw materials and indirect emissions.
The total GHG intensity of wheat (producing 8 t/ha) was 451 kg CO2e/t grain using AN made by AET, while the intensities using urea made by AET and TU made by AET were 0·87–0·99 and 0·84–0·86 of that value, respectively. The smallest total GHG intensity of 368 kg CO2e/t grain was achieved by using AN or TU made by BAT; depending on the level of inefficiency attributed to urea N and the extent to which this was compensated for by extra N use, GHG intensity with straight urea made by BAT was 1·03–1·17 of that with AN or TU. Overall, it appears that the modest financial advantages of using TU rather than AN or straight urea are accompanied by little disadvantage in GHG intensity of cereal grain if fertilizers are made with BAT or significant advantages if they are made with AET.
DISCUSSION
The commitment of European agriculture to fertilizing with N predominantly as AN or calcium ammonium nitrate contrasts with other regions of the world, and has historic causes (Beaton Reference Beaton2011) that are not obviously pertinent to current requirements for efficient enhancement of agricultural production with minimal emissions of nitrate, ammonia and N2O (Tilman et al. Reference Tilman, Fargione, Wolff, D'Antonio, Dobson, Howarth, Schindler, Schlesinger, Simberloff and Swackhamer2001; Mosier et al. Reference Mosier, Syers and Freney2004; Beddington et al. Reference Beddington, Asaduzzaman, Fernandez, Clark, Guillou, Jahn, Erda, Mamo, Van Bo, Nobre, Scholes, Sharma and Wakhungu2011; Godfray et al. Reference Godfray, Pretty, Thomas, Warham and Beddington2011). Recent investments by European fertilizer manufacturers are dramatically reducing N2O emissions during AN production (Brentrup & Pallière Reference Brentrup and Pallière2008; Hoxha et al. Reference Hoxha, Jenssen, Pallière and Cryans2011). However, fertilizer demand is such that N fertilizers are imported into Europe from regions where production may well be less closely regulated. After their use, all N fertilizers are responsible for significant unwanted emissions (Sutton et al. Reference Sutton, Oenema, Erisman, Leip, van Grinsven and Winiwarter2011), so careful and objective analysis of fertilizer choice is vital among the measures necessary to plan for sustainable crop productivity.
Distinguishing between the performance of N forms
It is unfortunate that such an important aspect of crop productivity, the optimal supply of nutrients, is so difficult to assess with precision. The present analysis shows that, while valuable differences between efficiencies of N forms were clearly evident through re-analysis of multi-site experiments, only one of 47 experiments was sufficiently precise and responsive to show, on its own, statistically significant differences in Nopt. Yet, the precision of the experiments reviewed in the present paper was quite typical of field experiments used to develop cereal agronomy; coefficients of variation for grain yield were almost always less than 0·10, and commonly less than 0·05. It must thus be accepted that useful differences in relative efficiencies of crop nutritional practices, even as large as the c. 0·10 shown here between AN and urea, may only be recognizable through amassing extensive datasets. In the NT26 research programme, it was not possible to conclude that N fertilizer efficiencies differed for crops such as potatoes, vegetables or even grass (Dampney et al. Reference Dampney, Dyer, Goodless and Chambers2006), because fewer experiments were conducted and measurements of crop performance were less precise.
In addition, it is of concern that the most important derivative of the relationship between crop yield and nutrient supply, the economic optimum (Nopt), is so dependent on fine differences in the chosen curve fitting approach. For example the effects shown in the present paper of fitting with common or differing r values for each N form could even reverse the overall conclusion. The lesson would appear to be that any study of economic optima should be made with appropriate caution, checking that choice of function or a few aberrant points or sub-sets of data are not compromising the overall conclusion. Since George (Reference George1984) reviewed previous research into the description of nutrient responses, the approach used most commonly in the UK, for example in deriving national fertilizer N recommendations (Anon. 2010), has been to fit the LpE function (except for sugar beet; Jaggard et al. Reference Jaggard, Qi and Armstrong2009). However, there has been some evolution in the approach to LpE fitting, in that George (Reference George1984) advocated fixing parameter r at 0·99, whereas, as computing power and data availability increased, subsequent studies allowed r to vary (e.g. Webb et al. Reference Webb, Seeney and Sylvester-Bradley1998; Sylvester-Bradley et al. Reference Sylvester-Bradley, Kindred, Blake, Dyer and Sinclair2008), sometimes with constraints. For instance curves having r > 1 have been replaced by curves with r fixed at 0·99. Although curves with r > 1 do not represent the form of response to N supply commonly observed, their acceptance in the present paper (without extrapolation) reduced the lack of fit without compromising the determination of Nopt. The comparison here between fitting with either common or varying r for the different N forms (Fig. 3) did not affect the overall comparison of N forms but showed that varying r substantially increased the variability in Nopt and decreased confidence in the conclusions (Fig. 3).
With this uncertainty in determination of Nopt, it proved helpful to consider further derivatives of N responses such as optimum yield, fitted yield at fixed N levels, net N recovery in grain (or grain plus straw) and the N uptake asymptote (Table 3). All these supported the overall conclusion that urea efficiency was 0·9 of AN, not 0·8 as concluded previously (Chambers & Dampney Reference Chambers and Dampney2009), and encouraged a conclusion more in line with previous work (Chaney & Paulson Reference Chaney and Paulson1988; Lloyd et al. Reference Lloyd, Webb, Archer and Sylvester-Bradley1997) and the general global assumption of ammonia emissions being 0·1 of applied urea–N (Bouwman et al. Reference Bouwman, Lee, Asman, Dentener, van der Hoek and Olivier1997; FAO 2001; IPCC Reference Eggleston, Buendia, Miwa, Ngara and Tanabe2006). However, direct measurements of ammonia emissions and N recoveries from single N applications were not in keeping with the inferred differences from the response experiments using split N applications (Table 3), and it seems most likely that this discrepancy arose more through exaggerated losses from large applications of urea (Black et al. Reference Black, Sherlock, Smith, Cameron and Goh1985; Misselbrook et al. Reference Misselbrook, Sutton and Scholefield2004) than through any positive measurement bias by wind tunnels (McInnes et al. Reference McInnes, Ferguson, Kissel and Kanemasu1986; Ferguson et al. Reference Ferguson, McInnes, Kissel and Kanemasu1988; Sherlock et al. Reference Sherlock, Freney, Smith and Cameron1989; Génermont & Cellier Reference Génermont and Cellier1997) since there was general agreement between N recovery and measured ammonia–N emissions within the same experiments (Fig. 4(a)). Perhaps some constraints on large single applications of urea should be more widely advocated to mitigate large ammonia emissions.
Despite the significant commercial and environmental repercussions of choosing different fertilizer N forms, extensive datasets such as that assembled in the present paper for cereals are rarely afforded. Given that potential innovations in fertilizer efficiency commonly arise from individual practitioners or small companies without resources to support extensive testing, overall improvement of fertilizer efficiency might well be enhanced through some collective system, enabling multi-site, multi-level testing of novel techniques without undue risk to individual businesses. Such collective arrangements for extensive annual experimentation are habitually employed to distinguish (for example) small increments in performance of newly bred varieties (Piepho et al. Reference Piepho, Denis and van Eeuwijk1998) or small advantages in efficacy of particular fungicides (Paveley et al. Reference Paveley, Lockley, Vaughan, Thomas and Schmidt2000). Given frequent claims for new ways of improving crop nutritional efficiency (Snyder et al. Reference Snyder, Bruulsema, Jensen and Fixen2009), there would seem to be an equivalent advantage in collective testing here.
Repercussions of choosing between N forms
Differences between AN, urea and TU in the dynamics of soil N transformations are well documented (Fenn et al. Reference Fenn, Taylor and Matocha1981; Bremner Reference Bremner1990; Harrison & Webb Reference Harrison and Webb2001; Chien et al. Reference Chien, Prochnow and Cantarella2009; Juan et al. Reference Juan, Chen, Wu and Wang2009; Watson et al. Reference Watson, Laughlin and McGeough2009; Beaton Reference Beaton2011; San Francisco et al. Reference San Francisco, Urrutia, Martin, Peristeropoulosa and Garcia-Mina2011; Sanz-Cobena et al. Reference Sanz-Cobena, Misselbrook, Camp and Vallejo2011). However, effects of N form on subsequent N leaching are less well tested. MacDonald et al. (Reference MacDonald, Goulding, Bhogal, Nicholson, Chambers, Sagoo, Dixon and Hatch2006) concluded that effects of fertilizer form on N leaching soon after application were inconsistent, but such leaching is rare in UK arable conditions. Most fertilizer effects on leaching arise after harvest; the N is applied in spring to drying soils, and N not taken up is immobilized in soil biomass during crop growth (King et al. Reference King, Sylvester-Bradley and Rochford2001), then re-mineralized and leached after soils have rewetted in the subsequent autumn or winter. Ammonia emissions generally occur within c. 20 days of urea application (Chadwick et al. Reference Chadwick, Misselbrook, Gilhespy, Williams, Bhogal, Sagoo, Nicholson, Webb, Anthony and Chambers2005), hence they generally precede the crop uptake and soil immobilization of applied N which predominantly occur during May (King et al. Reference King, Sylvester-Bradley and Rochford2001). It therefore seems likely that ammonia emissions will reduce N immobilization to a similar extent to their effect on N recovery by the crop.
The difference in straw N concentration between AN and urea (Table 3) indicated an increase in C : N ratio of reincorporated residues from 48 with AN to 50 with urea; this would probably be insufficient to affect measurably the dynamics of N mineralization, hence subsequent direct emissions of N2O (Nicolardot et al. Reference Nicolardot, Recous and Mary2001), or indirect emissions of N2O due to effects on leaching.
Overall, in considering repercussions on N leaching of choice between fertilizer N forms, it seems likely that ammonia emissions may replace at least a small part of the leaching losses which predominantly occur after mineralization of the immobilized N in autumn (Engström Reference Engström2010), and that the assumption of the same leaching losses for all fertilizer forms (Table 4) is too simplistic. In further comparisons of N forms it may be worth measuring levels of soil mineral N in the autumn after harvest, and as soil drainage restarts.
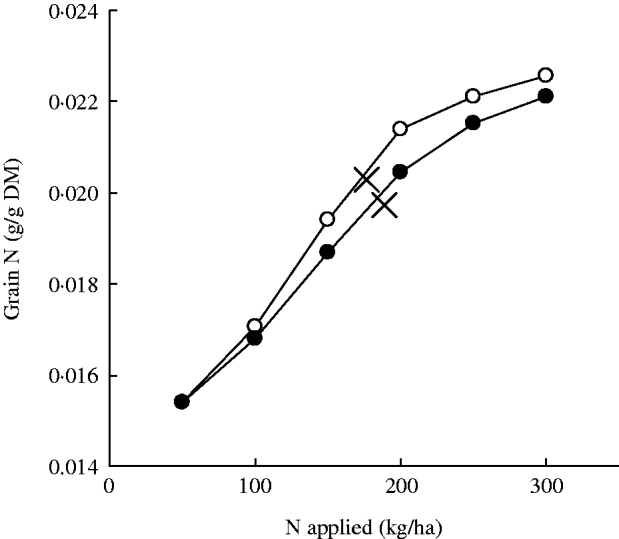
The difference in grain N concentration due to AN or urea use (Lloyd et al. Reference Lloyd, Webb, Archer and Sylvester-Bradley1997; Fig. 7) remains somewhat puzzling because this difference appears to apply at Nopt, possibly associated with lower asymptotes for grain N offtake and crop N uptake (Table 3). Such differences would not be expected merely due to losses of ammonia early in the growing season, yet from 13 NT26 experiments it appears that use of TU largely overcame the urea–AN difference in grain N (Table 3). Possible explanations may involve disproportionate ammonia losses with large urea applications (Black et al. Reference Black, Sherlock, Smith, Cameron and Goh1985: Misselbrook et al. Reference Misselbrook, Sutton and Scholefield2004), different assimilation of N due perhaps to foliar absorption of urea-derived ammonia (Ping et al. Reference Ping, Bremer and Janzen2000), delayed availability of nitrate or more complex physiological effects. Bremner (Reference Bremner1990) pointed out that urea can be directly absorbed by plants, at least after foliar application, and Bauer et al. (Reference Bauer, Bangerth and von Wiren2009) recently reported that urea absorption can inhibit cytokinin transport in some winter wheat cultivars, with consequent effects on tillering or senescence. Given this last observation, it would seem important to investigate whether there may be more subtle differences between TU and urea in the crop responses they cause, as well as investigating differences from AN. The dynamics of N uptake may differ sufficiently to explain the effect on grain protein.
Average response in 46 experiments of grain N concentration to N applied as either AN (open circles) or urea (closed circles), calculated from fitted responses in grain yield and grain Noff. Crosses indicate values at Nopt.
The GHG accounting procedure adopted in the present paper addressed most processes likely to be affected by fertilizer choice, except perhaps differences in (i) fertilizer transport to the farm and (ii) the need for lime (applied or inherent) to neutralize consequent soil acidification (hence emissions of CO2). Taking GHG emissions associated with road freight as 0·089 kg CO2e/t/km (Defra 2011b) and a mean distance to farm of 200 km, fertilizer transport costs would contribute 1·2 and 0·9 kg CO2e/t to GHG intensities of grain grown using AN and urea, respectively, so this difference is sufficiently small to be ignored. However, lime use was set at 475 kg/ha in the present paper irrespective of N fertilizer form, and was estimated to be responsible for 26 kg CO2e/t grain, 0·07 of wheat's overall GHG intensity. Ammonium-containing fertilizers generally have a greater acidifying effect than nitrate-containing fertilizers; however, field-determined lime requirements due to AN and urea application are commonly judged to be similar at 2–3 kg/kg N applied, compared with say ammonium sulphate at twice that amount (Archer Reference Archer1985: Bates & Johnston Reference Bates and Johnston1985). If, say, 1 kg more lime/kg N were required with one N form compared with another, the present calculations show that the net effect on GHG intensity of wheat would be +12 kg CO2e/t grain, mainly due to in-field emissions of CO2. Strangely, while IPCC protocols (IPCC Reference Eggleston, Buendia, Miwa, Ngara and Tanabe2006) assume that all carbon applied as lime is emitted as CO2, they do not appear to address in-field CO2 emissions through reaction with inherent lime; many calcareous soils are never limed, yet must emit CO2 due to neutralization of acidity generated by applications of N fertilizers.
The major remaining uncertainty in the GHG emission estimates made in the present paper is in the direct emissions of N2O after AN or urea applications. The four arable experiments of the 12 experiments reported by Smith et al. (Reference Smith, Dobbie, Thorman, Watson, Chadwick, Yamulki and Ball2012) proved insufficient to discriminate clearly between emissions due to N forms, with N2O emissions being small and variable under these conditions. However, TU appeared to result in smaller N2O emissions than other forms on wet grassland sites, especially where emissions were large. Certainly, from the common association under UK conditions between N2O emissions and reduced air-filled pore space (Smith et al. Reference Smith, McTaggart, Dobbie and Conen1998, Reference Smith, Dobbie, Thorman and Yamulki2006, Reference Smith, Dobbie, Thorman, Watson, Chadwick, Yamulki and Ball2012) it seems unsafe at present to suppose that emissions are associated more with nitrification than denitrification (Bouwman et al. Reference Bouwman, Boumans and Batjes2002a,Reference Bouwman, Boumans and Batjesb; Brentrup & Pallière Reference Brentrup and Pallière2008); either or both processes may be involved. For the future, it is to be hoped that further work comparing N2O emissions with different forms of N fertilizer will enable these comparisons to be made with better precision.
Implications for fertilizer choice and development
Setting aside differences in transport and spreadability due to their different physical characters, and security considerations associated with storing AN (HSE 1996; NaCTSO 2006), the main factors affecting fertilizer choice are price, efficiency and GHG emissions. Given the assumptions on efficiency developed in the present paper (Table 4, and assuming that applied N is adjusted for inefficiencies: Option C) it can be calculated that fertilizer N prices (as proportions of AN–N price) above which AN should be preferred to urea are 0·83 for U20, 0·91 for U10, 1·00 for TU0 and 1·12 for TU5. Similarly, TU–N prices (as proportions of urea–N price) above which urea (assuming U10) should be preferred to TU are 1·10 for TU0 and 1·25 for TU5. Given that N as TU is normally discounted compared with N as AN, TU will commonly be the most profitable fertilizer choice, with AN or urea being the second choice depending on the prices available and the perceived relative inefficiency and reliability of urea. With recent prices as presumed in Table 4, the differences in margin over N cost between AN and TU are rather small for TU0 but larger for TU5. Clearly, the possible yield advantage represented by scenario TU5 is more important economically than the possible relative inefficiency compared with AN, but it remains for further research to determine whether this yield advantage should be credited.
The reduction in GHG intensity associated with choosing TU rather than AN (Table 5) is significant if AET is assumed for fertilizer manufacture, but is small or slightly negative if BAT is assumed. Introduction of BAT is converting a disadvantage of AN over untreated urea (U10) into an advantage. Thus, it appears important for GHG mitigation that users of N fertilizers are informed of their manufacturing process so that they can make appropriate choices.
In conclusion, it will be important in the quest to minimize GHG intensities of crop products, to maximize crop recovery of fertilizer N, partly through suitable choice of fertilizer form but also through other innovations, perhaps in fertilizer application or in crop and variety choice. Overall, GHG intensities of winter cereals must be minimized by maximizing grain yield while minimizing the use of fertilizer N. The feasibility of realizing this aim is supported by the case of spring barley in the UK where genetic improvements in grain yield over recent decades have not been associated with increased Nopt (Sylvester-Bradley & Kindred Reference Sylvester-Bradley and Kindred2009).
We are grateful to C. J. Dyer for statistical analyses and advice and to P. M. R. Dampney for helpful comments on the manuscript. Preparation of this paper was partly sponsored by the UK Department for Environment, Food and Rural Affairs, Scottish Government, HGCA and other industry partners through Sustainable Arable LINK Project LK09128.