

DISCUSSION POINTS
• More approaches are expected to further enhance the electrical output performance of TENGs, for instance, eliminating or alleviating the air breakdown effect.
• More innovative smart actuators employing electrically responsive materials should be developed to be driven by TENGs, considering the fact that TENGs have ultralow current and extremely high output voltage.
• Innovative conjunction principle between TENGs and smart actuators can be anticipated, for example, wireless power transmission.
Introduction
Triboelectric nanogenerators (TENGs), invented by Prof. Z.L. Wang in 2012,Reference Fan, Tian and Wang1 are now becoming an emerging technology, which can scavenge ambient environmental mechanical energy stemming from winds,Reference Wang, Mu, Wang, Gu, Wang and Yang7,Reference Chen, Yang and Wang159 vibrations,Reference Chen, Zhu, Yang, Jing, Bai, Yang, Hou and Wang156,Reference Yang, Chen, Zhu, Wen, Bai, Su, Lin and Wang158 water flows,Reference Yang, Xu, Lin, Zhong, Bai, Luo, Chen and Wang8,Reference Xu, Zhao, Wang, Zhang, Li, Pan and Wang9 body motions, and so on,Reference Wang, Lin and Wang2–Reference Yang, Chen, Jing, Yang, Wen, Su, Zhu, Bai and Wang6 to provide electricity to smart electronic devices. Through the combination of triboelectrification and electrostatic induction effects, the electricity can be produced by TENGs.Reference Wang10–Reference Zhu, Peng, Chen, Jing and Wang12 TENGs are not only an excellent energy harvester but also a self-powered active sensor since the detailed mechanical motion profiled can be revealed by the output electrical signals.Reference Wang, Lin and Wang2 Employing TENGs, wind speed,Reference Su, Xie, Xie, Zhang, Ye, Jing, Tai, Du and Jiang16 heart rate,Reference Lin, Chen, Li, Zhou, Meng, Wei, Yang and Wang14 sound,Reference Fan, Chen, Yang, Bai, Li and Wang28,Reference Yang, Chen, Liu, Yang, Su and Wang160 displacement,Reference Yu, He, Ding, Hu, Yang, Lu, Wu, Zou, Liu, Lu and Wang15 and tactile touchingReference Zhu, Yang, Zhang, Jing, Chen, Zhou, Bai and Wang13 can be effectively and accurately sensed, where sleeping monitoring Reference Lin, Yang, Li, Wu, Wei, Liu, Chen and Yang162 and human–machine interfacingReference Yi, Lin, Niu, Yang, Wang, Chen, Zhou, Zi, Wang, Liao, Zhang and Wang161,Reference Chen, Zhu, Yang, Jing, Bai, Yang, Qi, Su and Wang163 greatly benefit. TENGs are born to have ability to provide high voltages. Compared with other energy harvesters such as solar cells and pyroelectric and piezoelectric devices, TENGs can achieve much higher output voltages owing to their ultralow capacitance.Reference Zi and Wang17,Reference Wang, Lin, Chen, Niu and Zi18 Several kilovolts open circuit voltage can be obtained using TENGs. Compared with traditional high-voltage sources, which are usually very bulky and difficult to be integrated in smart systems, TENGs can be fabricated extremely thin, attachable, and flexible to be combined with other electronic or mechanical components. Besides, the traditional high-voltage sources can be dangerous during the operations because of the unexpected current leakage issues. In contrast, TENGs can be very safe since their output currents are usually in microampere level, which is not harmful to human beings.
As a high-voltage source, TENGs can be used to drive electrically responsible materials and devices, making them self-powered and well-integrated.Reference Nie, Chen and Wang19,Reference Li, Fan, Chen, Nie, Liang, Tao, Zhang, Chen, Fu and Wang164 Electrically, TENGs can be treated as a serial connection of a capacitor and an ideal voltage source. The output of TENG is usually in the form of alternating current (AC).Reference Niu and Wang11 If direct current (DC) output is desired, a bridge rectifier is usually required. Over the past years, great efforts have been paid to manage the electrical power generated by TENGs in circuit level. For instance, the output voltage can be lowered by connecting an external capacitor, which shares transferred charges, and can be greatly enhanced via voltage multiplier circuits.Reference Ghaffarinejad, Hasani, Hinchet, Lu, Zhang, Karami, Galayko, Kim and Basset20,Reference Zhang, Lu, Ghaffarinejad and Basset21 In the TENG device, the output voltage can be greatly enhanced with improved triboelectric charges or alleviated breakdown effects.Reference Wang, Xie, Niu, Lin, Liu, Zhou and Wang22–Reference Wang, Wu, Dai, Zhao, Wang, Zhang and Wang24 To improve the triboelectric charges, the surface of triboelectric layers can be patterned to enhance the contact areas Reference Fan, Lin, Zhu, Wu, Zhang and Wang25 and the breakdown effect can be alleviated or eliminated by the use of high-pressure gases or vacuum atmospheres.Reference Wang, Wu, Dai, Zhao, Wang, Zhang and Wang24 Until now, a vast variation of output voltages can be attained by TENGs, ranging from a few volts to several kilovolts, which meets the driving requirements of the majority of electrically responsible materials and devices.
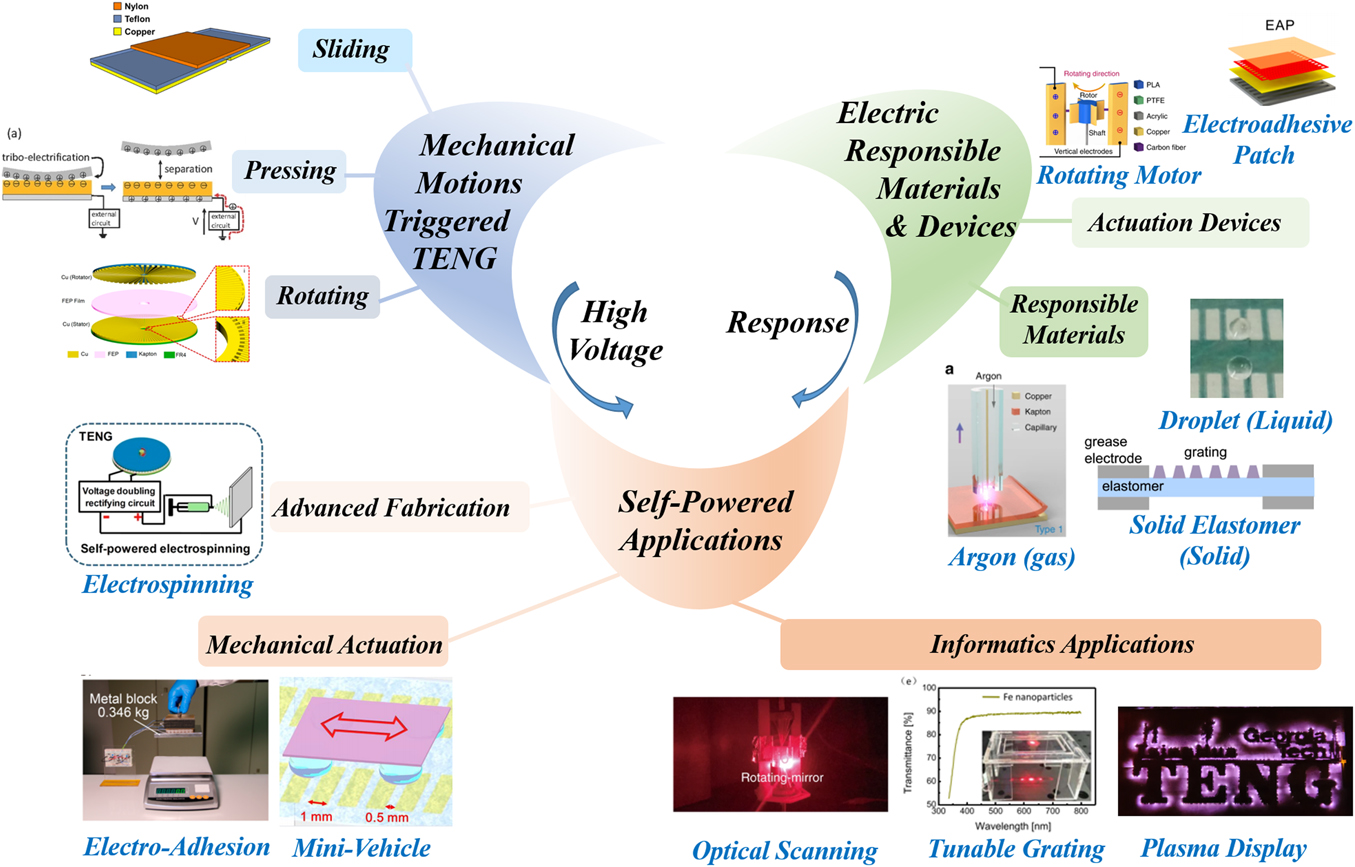
The electrically responsible materials which can be driven by TENGs include solids such as dielectric elastomers and piezoelectric films, liquids including liquid metals (LMs) and water droplets, and gases, for instance, rare gases etc. Driven by the electric field generated by the TENGs, smart devices can also be actuated, including micro-motorsReference Nie, Jiang, Shao, Ren, Bai, Iwamoto, Chen and Wang68,Reference Nie, Ren, Shao, Deng, Xu, Chen, Li and Wang73,Reference Nie, Ren, Xu, Lin, Zhan, Chen and Wang165 and electroadhesive patches (EAPs).Reference Xu, Wu, Yao, Chen, Yang, Chen, Huang, Zhong, Chen, Yin and Wang116 By combining the high-voltage TENGs and responsible materials or devices, a great number of self-powered smart systems can be achieved. In this review, the latest developments of high-voltage applications of TENGs have been revealed, which provides in-depth understanding of TENG-driven smart systems. Figure 1 illustrates the theme of this review paper with several important examples featured, highlighting the conjunction principles. To the best of our knowledge, the self-powered smart systems with a conjunction of high-voltage TENGs and corresponding actuating materials and devices will be reviewed in detail, including the characterization of high-voltage sources and actuators, driving requirements of materials and devices and the potential application fields. Finally, the perspective future research directions have been expected to conclude this review.
Overview of high voltage applications of TENGs. Press-based TENG: Reproduced with permission.Reference Chen, Pu, Jiang, Yu, Xu and Wang50 Copyright 2017, John Wiley and Sons. Rotating-based TENG, Electrospinning: Reproduced with permission.Reference Li, Yin, Wang, Zhou, Wang, Luo, Tang, Cao, Yuan, Li, Du, Wang, Zhao, Liu and Wang139 Copyright 2017, American Chemical Society. Rotating motor, optical scanning: Reproduced with permission.Reference Yang, Pang, Bu, Liu, Luo, Jiang, Zhang and Wang107 Copyright 2019, Springer Nature. Electroadhesive patch, electro-adhesion: Reproduced with permission.Reference Xu, Wu, Yao, Chen, Yang, Chen, Huang, Zhong, Chen, Yin and Wang116 Copyright 2018, American Chemical Society. Argon, plasma display: Reproduced with permission.Reference Cheng, Ding, Zi, Lu, Ji, Liu, Wu and Wang104 Copyright 2018, Springer Nature. Solid elastomer, tunable grating: Reproduced with permission.Reference Chen, Wu, Yu, Xu, Zheng, Liu, Li and Wang49 Copyright 2017, Elsevier. Droplet, mini-vehicle: Reproduced with permission.Reference Nie, Ren, Shao, Deng, Xu, Chen, Li and Wang73 Copyright 2018, American Chemical Society.
TENG as a high-voltage source
TENGs are able to harvest various kinds of mechanical energies in ambient environments, where the operation mechanisms of TENGs are different. Over the past years, great efforts have been paid to improve the output voltage of TENGs, which greatly extends the applications of TENG-driven self-powered systems.
Mechanical motions to trigger TENGs
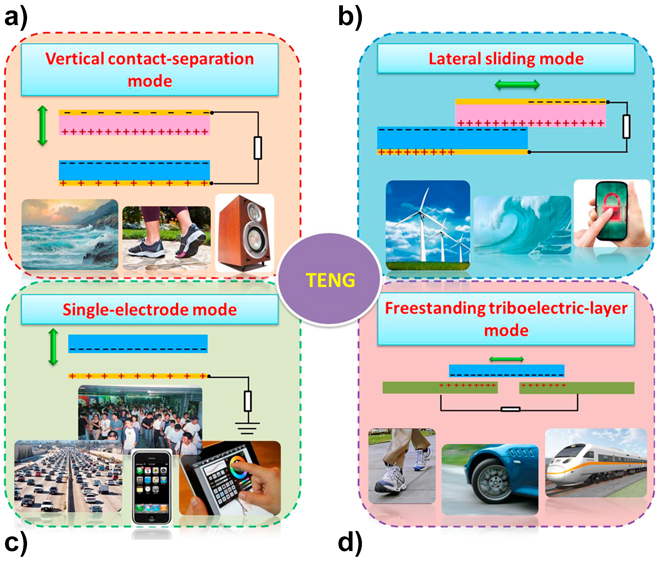
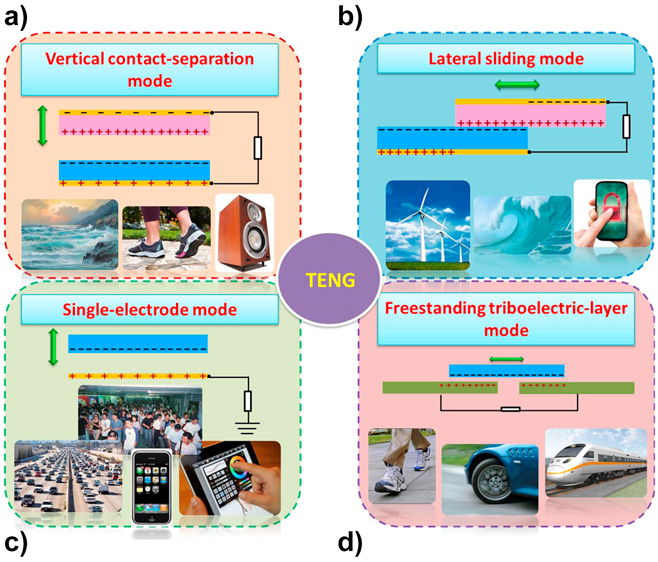
There are generally four basic operation modes of TENGs, involving vertical contact-separation (CS), lateral-sliding (LS), single-electrode (SE), and freestanding triboelectric-layer (FT) modes, as indicated in Fig. 2.Reference Wang, Lin and Wang2 For all these four operation modes, at least a pair of two different materials should be contacted for the triboelectrification and separated for the electrostatic induction. The CS mode TENG is mainly used to harvest mechanical energies stemming from pressing and releasing, for instance, compression and touching.Reference Yang, Lin, Pradel, Lin, Li, Wen, He and Wang26,Reference Lee, Yoon, Jiang, Wen, Seung, Kim and Wang27 Besides, acoustic energy can also be scavenged by the CS mode TENGs, where the contact and separation of membranes can be triggered by sound.Reference Fan, Chen, Yang, Bai, Li and Wang28,Reference Cui, Gu, Liu, Bai, Qiu, Fu, Kou, Liu, Qin and Wang29 Different from the CS mode TENG, the LS mode TENG generates electricity by sliding, where two triboelectric layers will keep contacting, even though the contact area varies during the sliding process. One advantage of the LS mode TENG over the CS mode TENG is that the current output performance can be greatly improved when the striped triboelectric surfaces are used. Reference Xie, Wang, Niu, Lin, Jing, Yang, Wu and Wang30,Reference Niu, Wang, Liu, Zhou, Lin, Hu, Pradel and Wang31
Four basic operation modes for TENG. (a) CS mode, (b) LS mode, (c) SE mode, and (d) FT mode. Reproduced with permission.Reference Wang, Lin and Wang2 Copyright 2015, Elsevier.
The disadvantages of both the CS and LS mode TENGs come from the wire connection of the moving triboelectric, which greatly hinders the flexibility of the mechanical motions. The SE and FT mode TENGs provide effective solutions to the wire connection issues, where one triboelectric layer can move freely without connected wires in these two TENGs.Reference Xie, Wang, Niu, Lin, Jing, Yang, Wu and Wang30,Reference Wang, Zhang, Tang, Zhang, Ning, Tian, Li, Zhang, Mao and Liang32–Reference Wang, Xie, Niu, Lin and Wang34 Besides, in the FT mode TENGs, the mechanical structure can be much more robust and the output voltage is usually much higher than that of the CS and SL mode TENGs. The SE mode TENGs have been mainly used to harvest the mechanical energy of vertical free-moving motions, such as stepping and raindrop collisions. Oppositely, the FT mode TENG can be used to scavenge energies of free-sliding mechanical motions. Owing to their high output voltage, the FT-TENGs have been widely applied for the self-powered systems with high-voltage requirements.
Approaches for triboelectrification performance enhancement
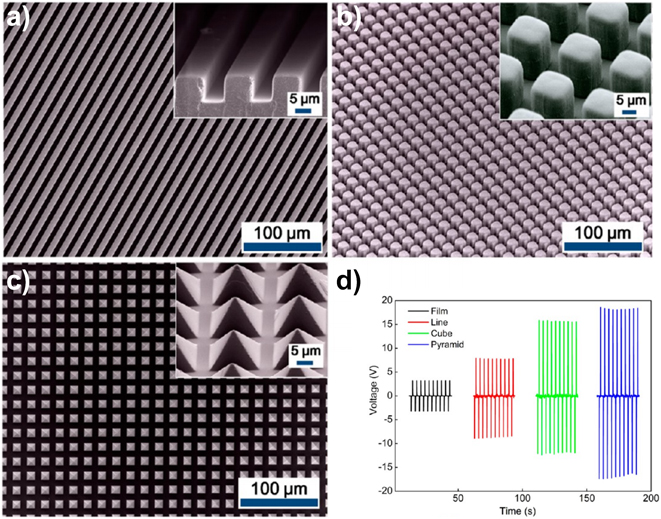
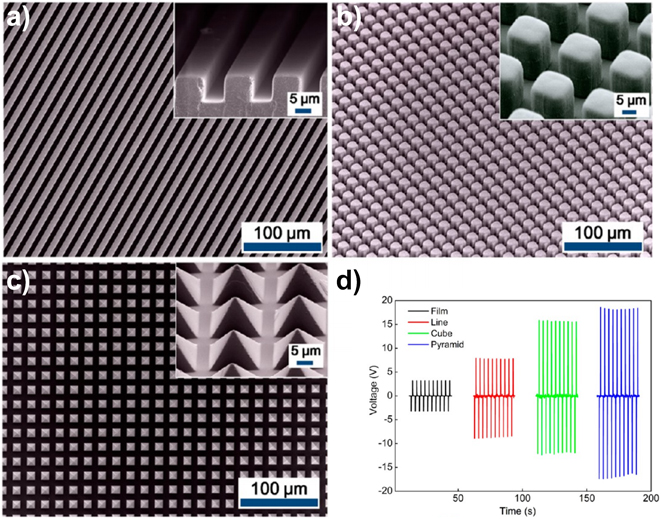
Beside the structural design to harvest various kinds of mechanical energies, great efforts were made to enhance the triboelectrification performance. The selection of two triboelectric materials with larger affinity difference can also result in improved electrification performance. The material choosing priority should be given to two materials with larger distance in the series of triboelectrification.Reference Zou, Zhang, Guo, Wang, He, Dai, Zheng, Chen, Wang, Xu and Wang35,Reference Clint and Dunstan36 For given two materials for triboelectrification, the electrification performance is affected by the contact surface area.Reference Fan, Lin, Zhu, Wu, Zhang and Wang25,Reference Tang, Jiang, Fan, Yu, Zhang, Cao and Wang37,Reference Park, Seol, Jeon, Kim, Lee and Choi38 Patterning on the two triboelectric surfaces can improve the contact area for electrification, thus the output voltage can be greatly improved. Figures 3(a)–3(c) illustrate the structural characterization of the patterned polydimethylsiloxane (PDMS) thin film using the scanning electron microscope (SEM), the morphologies of which includes lines, cubes, and pyramids.Reference Fan, Lin, Zhu, Wu, Zhang and Wang25 Figure 3(d) indicates a comparison of output voltages of the CS mode TENGs using a polyethylene terephthalate (PET) film and PDMS films with various surface patterns. It can observed that the patterned surface can achieve at least 2-fold of the output voltage compared with the surface without patterning, and the TENG with the pyramid microstructure presents the highest output voltage.
Structural and electrical characterizations of thin film–based PDMS with various patterns. (a) SEM image of the patterned PDMS thin film with line features. The inset is a 75° tilted high-magnification image showing the size and cross section structure of the features. (b) SEM image of the patterned PDMS thin film with cubic features. The inset is a 45° tilted high-magnification image showing the height of the cubes. (c) SEM image of the patterned PDMS thin film with pyramids features. The inset is a 45° tilted high-magnification image showing the pyramid structure of the features. (d) Output current of the TENG using PDMS thin film with flat surface and various patterned features. Reproduced with permission.Reference Fan, Lin, Zhu, Wu, Zhang and Wang25 Copyright 2012, American Chemical Society.
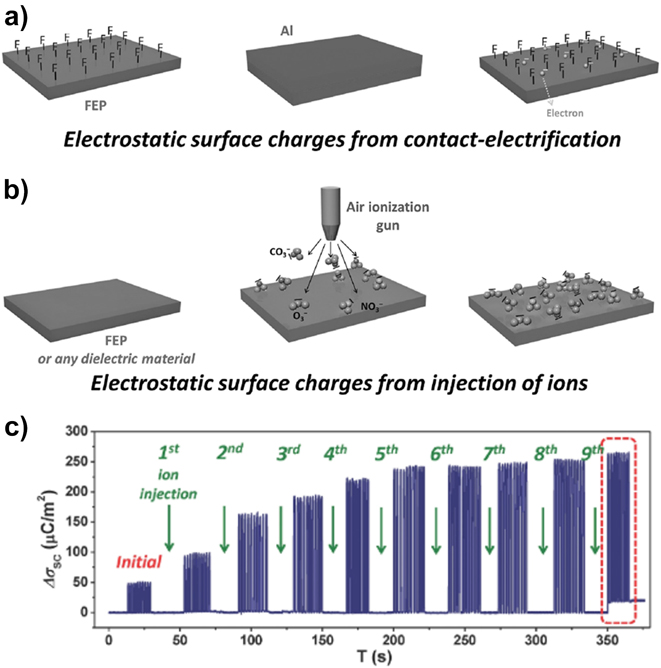
In addition to the contact area enhancement, ionized air injection can also contribute to the high output performance of TENGs.Reference Wang, Xie, Niu, Lin, Liu, Zhou and Wang22 Figures 4(a) and 4(b) illustrate the schematic diagram of the ionized air injection for the achievement of high-performance TENGs, and Fig. 4(c) shows a comparison of the transferred charge number before and after the ionized air injection. It can be observed that the ionized air injection approach can greatly facilitate the electrification and following charge transferring process. However, it should be noted that the boosted electrification will be limited by the air breakdown effect, which is governed by Paschen’s law.Reference Zi, Wu, Ding and Wang23,Reference Wang, Wu, Dai, Zhao, Wang, Zhang and Wang24
(a) Obtaining surface charges through the triboelectrification process. (b) Gaining static charges through the employment of ionized air. (c) Measured short-circuit charge density (ΔσSC) produced by the TENG with ions injected in different times. Reproduced with permission.Reference Wang, Xie, Niu, Lin, Liu, Zhou and Wang22 Copyright 2014, John Wiley and Sons.
Dielectric elastomers driven by TENGs
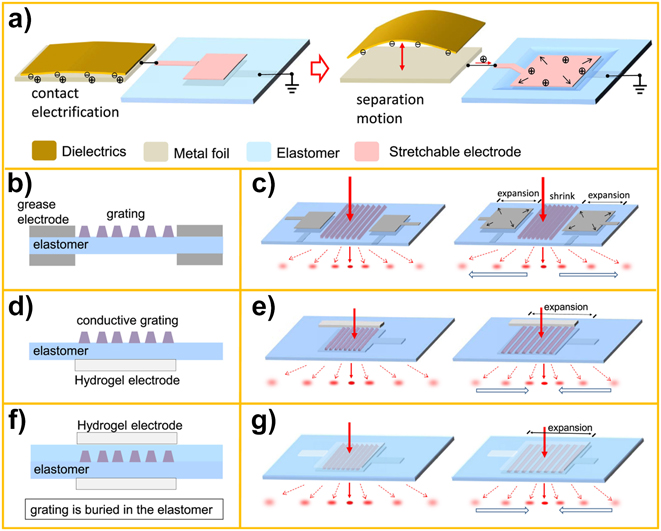
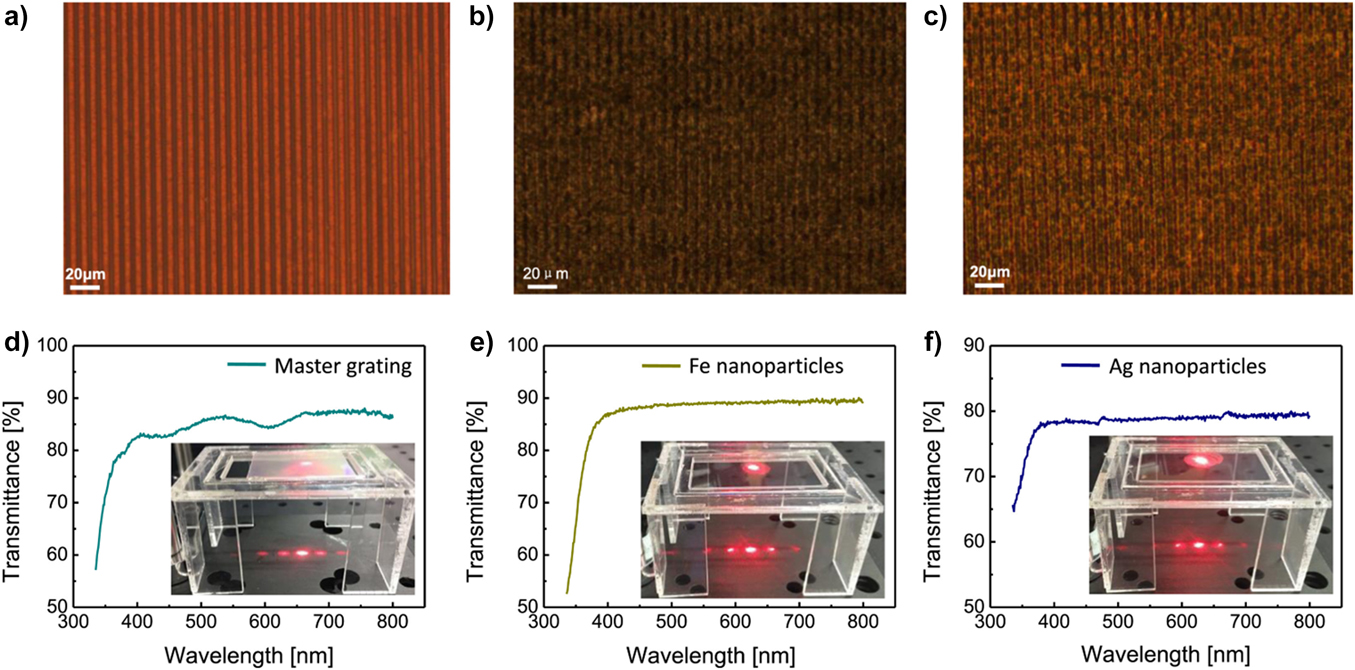
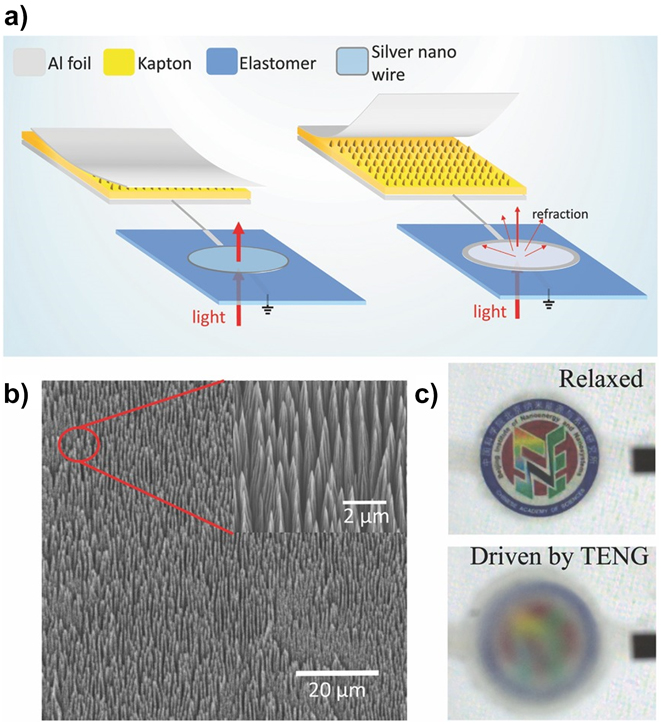
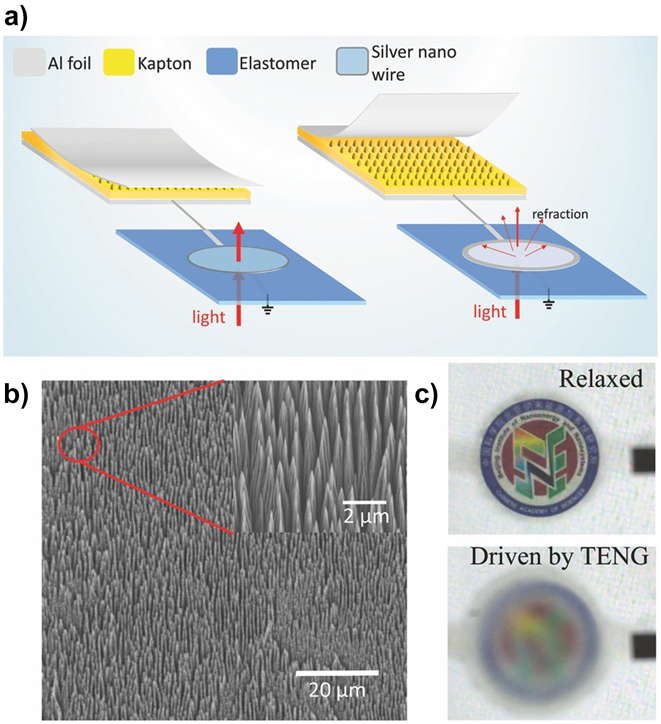
Dielectric elastomers can be actuated by the high voltage generated by the TENGs, from which self-powered optical modulation can benefit. Among various optical modulators, tunable optical gratings (TOGs) is the core element of various optical splitting and light-connecting devices.Reference Truxal, Kurabayashi and Tung39–Reference Kollosche, Döring, Stumpe and Kofod42 The development of nanofabrication techniques has led to the creation of many new materials, such as various stretchable electrode materials, which have facilitated the improvement of dielectric elastomer actuator (DEA) devices. Besides, it also brings more possibilities to modify the TOGs systems on the basis of DEA.Reference Aschwanden and Stemmer43–Reference Maffli, Rosset, Ghilardi, Carpi and Shea46 The DEA’s driving requirements for high voltage just match the TENG electrical output performance, and the breakdown effect in a TOG system can be eliminated or greatly alleviated because of the limited amount of transferred charge.Reference Anderson, Hale, Gisby, Inamura, McKay, O’Brien, Walbran and Calius47,Reference Keplinger, Sun, Foo, Rothemund, Whitesides and Suo48 Chen et al.Reference Chen, Wu, Yu, Xu, Zheng, Liu, Li and Wang49 proposed several different TOG systems that can adapt to the high voltage output of TENG [Fig. 5(a)]. The driving element for this kind of TENG–DEA conjunction system is an SE TENG using contact–separation motion to generate high-voltage control signal, which means that an efficient and reliable operation of DEA device can be achieved. In the triboelectric course of two electrode materials, aluminum (Al) tends to be positively charged and Kapton is the opposite. Three specific TOG models for this structure are proposed, which can greatly improve the self-powered effect. The compression mode TOG [Figs. 5(b) and 5(c)] is consisted of two DEA elements and a grating array, which is made by aggregated metallic nanoparticles. The elastomer film is constrained by the boundary frames, so that the induced strain concentrated in the middle part can help DEA to smoothly deform. In a self-driven system, the two elastomers dilate due to the base of TENG, while also have an opposite deformation in the non-driven TENG location. Figures 5(d) and 5(e) (expansion mode 1) show that the conductive Ag nanoparticle is used for fabricating the grating array, as one electrode and the other electrode is a transparent hydrogel film. The expansion of grating arrays leads to the increase of the grating period and the expansion strain of the device may not be high enough to realize an effective operation of the device. In this case, Chen et al. further demonstrate the design of expansion mode 2 in Figs. 5(f) and 5(g). Both hydrogel electrodes are glued to the top and bottom sides of the grating array sealed in a PDMS membrane, and this new design of TOG can fully utilize the transparency and stretch ability of hydrogel electrodes. To ensure an effective modulation of TOG, the grating array is directly printed on the surface of elastomer film due to the sticky characteristics of the elastomer itself. Figures 6(a)–6(f) show the details for percentage of light transmission by the special samples. This grating structure of Ag nanoparticles, which are used as conductive grating arrays specifically for extended mode 1, is the best candidates to work with TENG, and this Ag nanoparticles-based printing method greatly simplifies the manufacturing process of the TOG system. After the self-powered system is upgraded, the cycle of the grating can be reduced and the operation efficiency of the whole device can be greatly improved, thereby having broad prospects in tracking system and internet of things (IoTs). In addition to the optical grating, TENG–DEA system, which uses the silver nanowires as the electrode materials, can also work as a smart optical modulator (SOM)Reference Chen, Pu, Jiang, Yu, Xu and Wang50 to modify the transparency, as shown in Fig. 7(a). Under the SE mode of the TENG, the movement of the Kapton film can control the mechanical strain of the elastomer film when the Kapton film is separated from the aluminum foil, which can not only provide energy supply but also show the signal for the elastomer to deform. To further improve the output performance of the TENG, an inductively coupled plasma (ICP) reaction [Fig. 7(b)] is applied to modify the contact charged material to increase its surface charge density. Under the activation of the TENG, the nanowire electrode can squeeze the elastomer in the micrometer scale and a great number of tiny wrinkles appear on the surface of elastomer, which block the observations. Therefore, this can be called a privacy protection device that controls the image through the film by TENG controlling the light transmittance through the elastomer [Fig. 7(c)]. The SOM system and the specialized operation method proposed here are the typical study of TENG technique for the field of micro-electro-mechanical system (MEMS) and human–robots interaction,Reference Xu, Qin, Xu, Wei, Yang and Wang52–Reference Ding, Wu, Zi, Zou, Wang, Cheng, Wang and Wang55 which can finally enrich the applications of TENG in optical communication, light capture, and other optical application.Reference Yang, Chen, Zhou, Chen and Suo56–Reference Shian, Bertoldi and Clarke58,Reference Wang, Lo, Lee, Tao, Zou and Yun166
(a) The basic structure and the operation principle of TENG-DEA conjunction system, where a single-electrode TENG using contact-separation motion mode was employed as the driving element for the conjunction system. (b) The structure design of the compression mode TOGs, (c) the working principle of the compression mode TOGs, (d) the structure design of the TOGs with expansion mode 1, (e) the working principle of the TOGs with expansion mode 1, (f) the structure design of the TOGs with expansion mode 2, (g) the working principle of the TOGs with expansion mode 2. Reproduced with permission.Reference Chen, Wu, Yu, Xu, Zheng, Liu, Li and Wang49 Copyright 2017, Elsevier.

The SEM image of the (a) master grating, (b) Fe nanoparticles, and (c) Ag nanoparticles. (d) Percentage of light transmission by different samples compared with the initial state: the transparency and the photo (inset) for (d) the master grating; (e) Fe nanoparticles, as shown higher brightness than (d); (f) Ag nanoparticles, as shown the highest brightness. Reproduced with permission.Reference Chen, Wu, Yu, Xu, Zheng, Liu, Li and Wang49 Copyright 2017, Elsevier.

(a) On the basis of SOM for the self-powered system. (b) The microscale structure of the etched Kapton film (SEM image). (c) During the movement of TENG, the logo placed 3 cm behind the SOM film changed from transparent to opaque. Reproduced with permission.Reference Chen, Pu, Jiang, Yu, Xu and Wang50 Copyright 2017, John Wiley and Sons.
Self-powered microfluidic based mini-vehicles
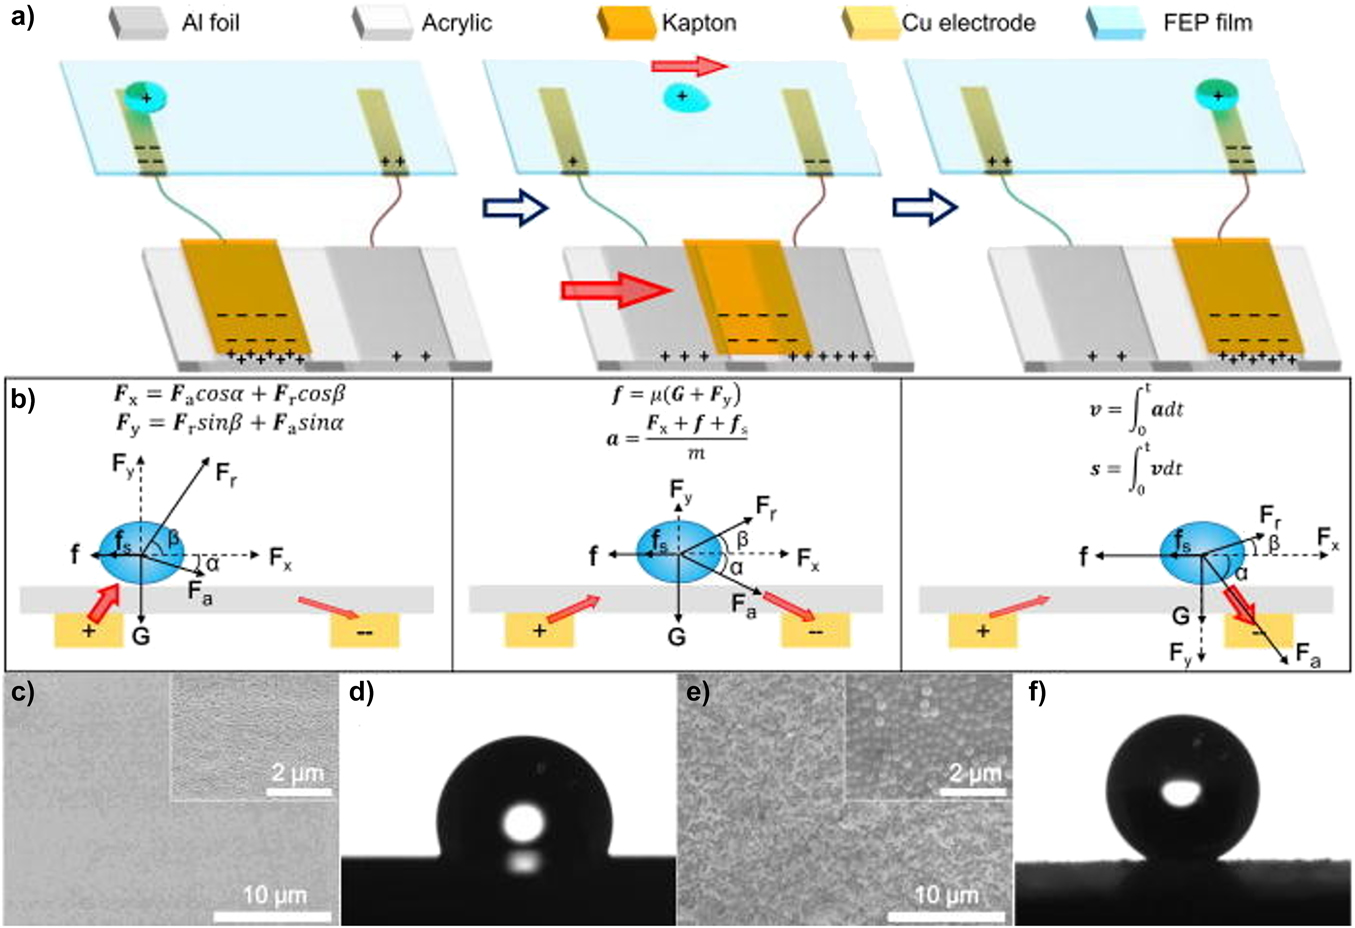
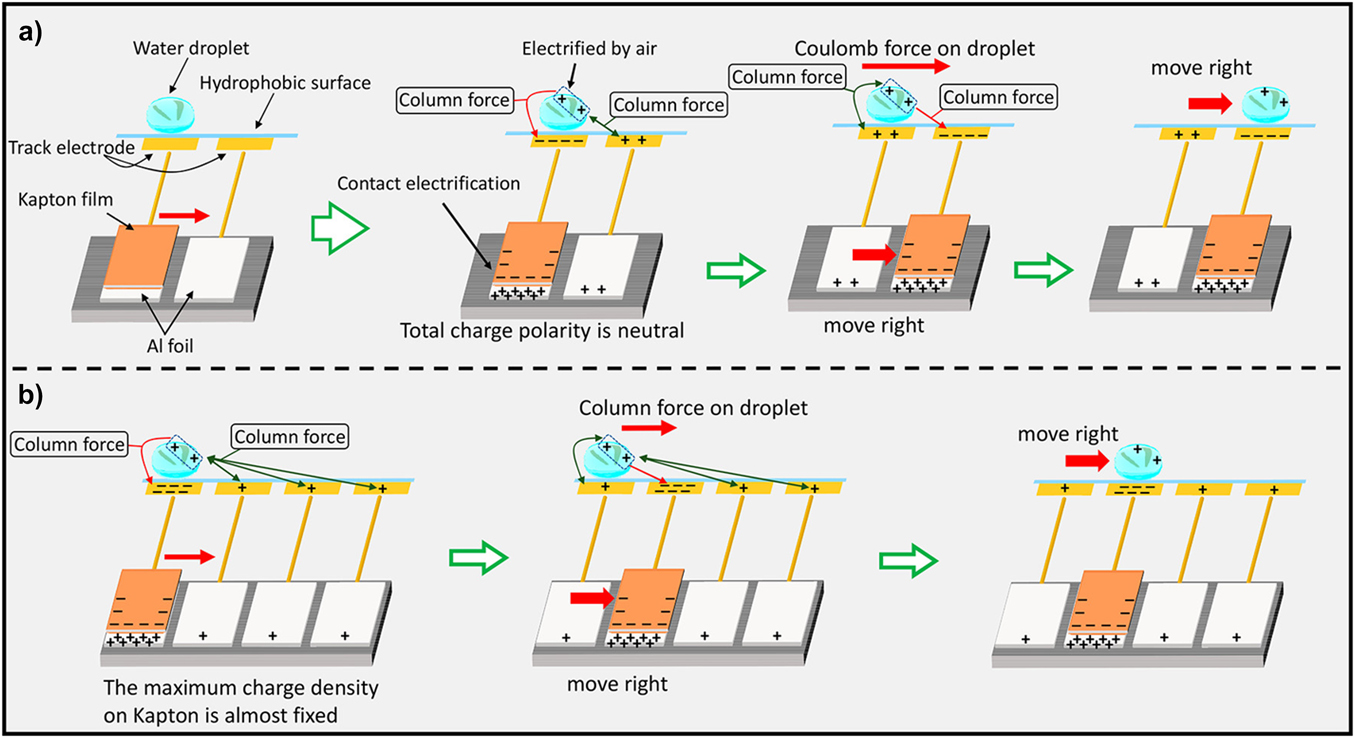
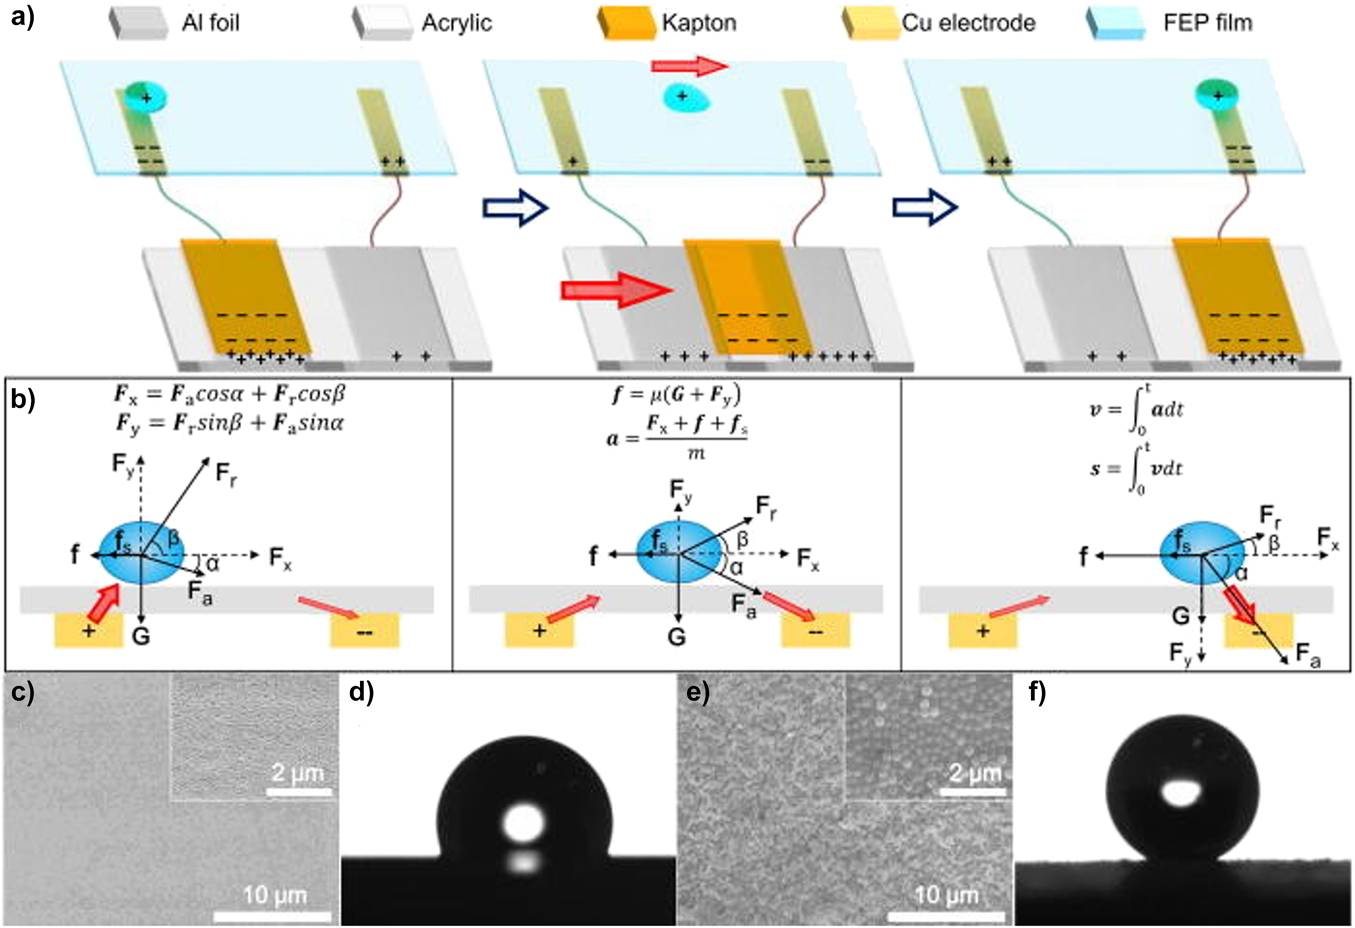
Not only solid-state dielectric material can be actuated by TENGs but also liquid droplets can be driven by the triboelectrification induced electric field. Microfluidics targets at the precise control and manipulation of fluids with small volumes,Reference Conrad, Schenk, Kaiser, Langa, Gaudet, Schimmanz, Stolz and Lenz59–Reference Moon, Cho, Garrell and Kim62 while the high-voltage source and the control circuits increase the complexity of the microfluidic system.Reference Eow and Ghadiri63–Reference Jeong, Kim, Park, Oh, Paik, Hwang, No, Nam and Lee67 To achieve the effective control of position and velocity of fluids in the microchannels, Nie et al.Reference Nie, Jiang, Shao, Ren, Bai, Iwamoto, Chen and Wang68 developed a fully self-powered microfluidic system that eliminates the need for the power source and the control circuits. By integrating a TENG and a simple circuit board, the motion of water droplets can be controlled by the output of the TENG.Reference Hayes and Johan Feenstra69 The method based on the electrostatic induction theory constructs a physical model, which can precisely simulate the detailed motion behavior of the droplet under driving of TENG, and it can also reveal the influences of surface hydrophobicity on the motion of the droplet. The model structure in Fig. 8 can provide us key parameters of the microfluidic system. The sliding motion of Kapton on the grating electrode can precisely control the stepping movement of the droplet. To reach the electrostatic balance, the amount of negative charges on the Kapton film is the total amount of the positive charges on two Al foils. Because of the large amount of negative charges on the Kapton film, the potential on the two electrodes will drop strongly. Hence, a strong Coulomb force can be established between the water droplet and the negatively charged electrode. When the Kapton film slides from the left foil to the right foil, the droplet is moved from the left-hand electrode to the right-hand electrode due to the Coulomb force. The force analysis of the droplet in this microfluidic system is systematically studied, as shown in Fig. 8(b). To simplify the experimental model, the droplet is considered as a rigid body and the tribo-induced positive charge distributes homogeneously on the surface of the droplet. As shown in Figs. 8(c) and 8(d), the fluorinated ethylene propylene (FEP) film is subjected to some treatments to achieve a superhydrophobic state. The superhydrophobic surface can be achieved [Figs. 8(e) and 8(f)], which can help to further clarify the effect of surface properties on the droplet movement. The superhydrophobic surface can reduce the resistance on the movement of the drop and facilitate the acceleration of the droplet in the electric field. This kind of theoretical analysis provides an in-depth understanding of both the advantages and the limitations of this integrated system, which can guide further optimization of this self-powered microfluidic system.Reference Chen, Wu, Shao, Jiang, Yu, Xu and Wang70–Reference Zheng, Wu, Chen, Yu, Xu, Liu, Li and Wang72 A self-powered microfluidic transport system, which can carry some tiny objects to realize a micro transport system in the millimeter scale size, was designed by Nie et al.Reference Nie, Ren, Shao, Deng, Xu, Chen, Li and Wang73 The mini-vehicle was driven by the Coulomb force generated by the free-standing TENG. These “wheels” can be moved freely in the horizontal direction or moved up the steps under the driving of TENG.Reference Zhong, Zhong, Fan, Zhang, Wang, Hu, Wang and Zhou74–Reference Han, Lu, Lu, Huang, Li, Hsu, Lin, Chiu, Suenaga, Chu, Kuo, Chang, Li and Shi77 The motion of the independent mode TENG not only powers the motion of the micro-vehicle but also controls the signal of this micro-transmission system [Figs. 9(a) and 9(b)]. Based on a single droplet that can be driven by TENG, it is also possible to drive multiple droplet movements, which in turn act as a power source or a control signal to direct the droplets. This freestanding mode TENG with multiple grating electrodes, which can increase the tribo-induced charges, effectively regulates the motion of the droplet in the microfluidic system with high efficiency and fast response speed. Meanwhile, it can realize manual control without any detector or control circuit. Bu et al.Reference Bu78 proposed that the TENG is used as a medium to first drive and accurately control LMs Reference Wang, Yang and Liu79,Reference Daeneke, Khoshmanesh, Mahmood, De Castro, Esrafilzadeh, Barrow, Dickey and Kalantar-Zadeh80 by external mechanical force, which enriches the self-powered microfluidic systems. More applications can be anticipated benefiting from the TENG-based self-powered microfluidic systems.
(a) The schematic diagram of mini-vehicles driven by TENG. (b) Theoretical analysis of the force on droplets at different locations of the electric field. (c) SEM image of the FEP film before superhydrophobic treatment; inset: zoomed-in image. (d) Contact angle for the FEP film before superhydrophobic treatment. (e) SEM image of the FEP film after superhydrophobic treatment; inset: zoomed-in SEM image; (f) Contact angle for the FEP film after superhydrophobic treatment. Reproduced with permission.Reference Nie, Jiang, Shao, Ren, Bai, Iwamoto, Chen and Wang68 Copyright 2018, AIP Publishing.
The working principle of the self-powered microfluidic transport system (a) with two electrodes and (b) with four electrodes. Reproduced with permission.Reference Nie, Ren, Shao, Deng, Xu, Chen, Li and Wang73 Copyright 2018, American Chemical Society.

Self-powered wireless sensing based on tribo-induced liquid lens
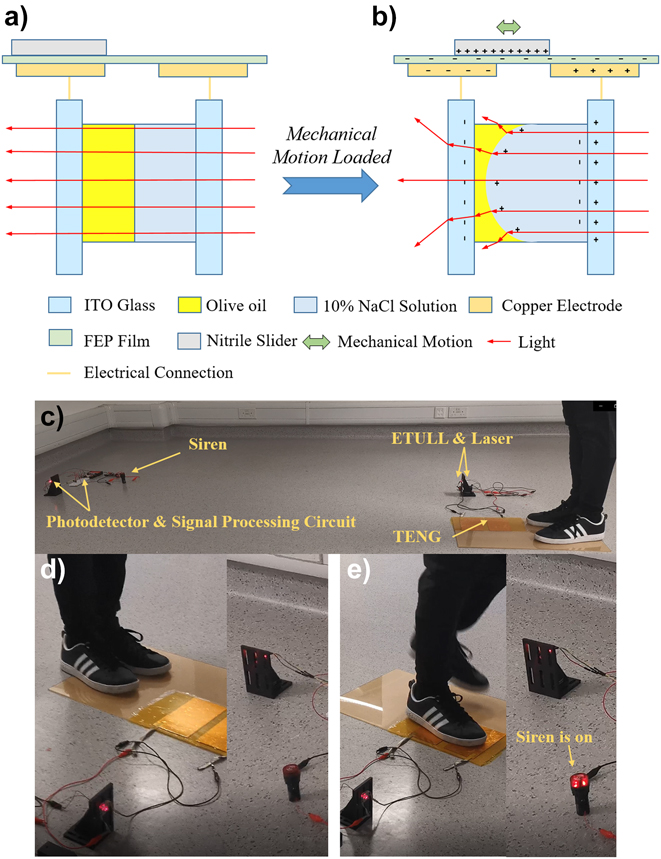
Liquids actuated by TENGs not only can be used to carry objects serving as motion-controlled mini-vehicles but also enable the self-powered wireless sensing.Reference Wang, Wang, Li and Zi87 Basically, TENGs are born self-powered mechanical sensors, where the output voltage signal corresponds to the mechanical motions. Since their invention in 2012, TENGs have been widely applied as a self-powered active sensor, including but not limited to pressure measurements, displacement detections, and vibration characterizations.Reference Bai, Zhu, Jing, Yang, Chen, Su, Ma, Zhang and Wang88–Reference Luo, Fan, Zhou, Tang, Xue and Wang90 Ultrahigh signal-to-noise ratio can be achieved by the TENG-driven sensor because of the high-voltage output of TENGs. In addition, compared with conventional battery-powered sensor nodes, the size of TENG-based sensors can be greatly shrunk down and the manufacturing cost can be very low.Reference Chen, Zhang, Zhan, Lin, Zhang, Zou, Zhang, Zou and Wang91 Such a mechanical-to-electrical sensor needs wires for electrical connections, where the sensed electrical signal should be processed by the preamplifier since TENGs feature high voltages and ultralow currents. However, in some specific applications such as turbulence detections, sensing in severe environments, and infrastructure health monitoring, cables are usually not allowed. Therefore, TENG-based wireless sensing is needed. Light is an excellent candidate for wireless communication, where the sensed information can be loaded by switching on and off.Reference Chan92–Reference Silberberg, Perlmutter and Baran96 If the TENG-generated voltage signal can be converted into the optical signal, self-powered wireless sensing is enabled. As shown in Fig. 10, a self-powered electrowetting optical switch (EOS) triggered by a TENG was proposed by Wang et al. for wireless sensing applications.Reference Wang, Wang, Li and Zi87 The demonstrated EOS consists of an FS-TENG and an electrically tunable liquid lens (ETULL) made of 10% NaCl solution and purified olive oil. In the ETULL, the NaCl solution and olive oil serve as conducting and insulating liquids, respectively. Two liquids are both optically transparent. As shown in Figs. 10(a) and 10(b), when the FS-TENG was triggered by the mechanical motions, the triboelectrification-induced high-voltage electric field will drive the interface between two liquids to be curved according to the electrowetting effect.Reference Mugele and Baret97 The curved interface results in an olive oil–based concave lens, considering the fact that the refractive indices (RIs) of 10% NaCl solution and olive oil are 1.46 and 1.34 at 650 nm wave length, respectively. When light is emitted into the high voltage–driven ETULL, the beam will be diverged by the concave lens and the remotely detected radiant power will be greatly reduced. When the FS-TENG is not triggered, the interface between two liquids is flat, where light propagation will not be affected by the ETULL and the remotely detected radiant power nearly remains the same. The ETULL operations with and without FS-TENG charging are defined as the off and on states, respectively, which can be indicated by the remotely detected radiant powers. Therefore, the mechanical motions on the FS-TENG can be revealed by the remotely detected radiant powers. The electrowetting effect contributes to the detection of the mechanical motion appearance, and the other important issue to be solved is to effectively detect the motion termination. In their studies, it is interesting to notice that a discharging channel was formed upon loading high voltage, which means that if the mechanical motion stopped, the electric field quickly disappeared and the liquid recovered to its original morphology very soon. Wireless sensing applications were performed to verify the effectiveness of their proposed EOS, and a system for remotely sensing the stepping motions was constructed as shown in Fig. 10(c). As illustrated in Figs. 10(d) and 10(e), the siren was activated when the stepping was loaded, demonstrating the sensing capability of the proposed EOS.
Schematic diagram of the switching mechanism of the TENG-driven self-powered EOS and its application demos for the wireless stepping detection. (a) EOS without mechanical motion. (b) EOS with mechanical motion loaded. (c) Photograph of the wireless sensing system for stepping motions. (d) Photograph of the wireless sensing system when no stepping was loaded. (e) Photograph of the wireless sensing system when stepping was loaded. Reproduced with permission.Reference Wang, Wang, Li and Zi87 Copyright 2019, Elsevier.

TENG-stimulated microplasma
In addition to the solid- and liquid-based actuation systems, gas can also be used to be stimulated by the high voltage generated by the TENGs. One typical gas-based application using the high voltage generated by TENGs is the generation of microplasmas. Plasmas have been considered as the forth state of matters, widely applied in various fields such as surface treatments,Reference Roh, Lee, Hwang, Kook, Yang, Lee and Kim98,Reference Zhang, Lin, Zhang, Xie, Ren and Shao99 displays,Reference Kim, Lee, Lee, Bae, Yeom and Kim100,Reference Lee, Kim, Jeon and Choi101 and biomedicines.Reference Haertel, von Woedtke, Weltmann and Lindequist102,Reference Graves103 The plasma can be achieved by the breakdown of gases, which is named as atmospheric pressure plasma. In terms of the discharging mechanism, the atmospheric pressure plasma can be classified into dielectric barrier discharge (DBD), atmospheric pressure non-equilibrium plasma jets (APNP-J), corona discharge, microspark discharge, etc. To initiate breakdown in the gases, the voltage applied should be at least above 1000 V. The born character of TENGs is high voltage become of their ultralow capacitance; thus, TENG is an excellent candidate to provide high voltages for generating plasmas.
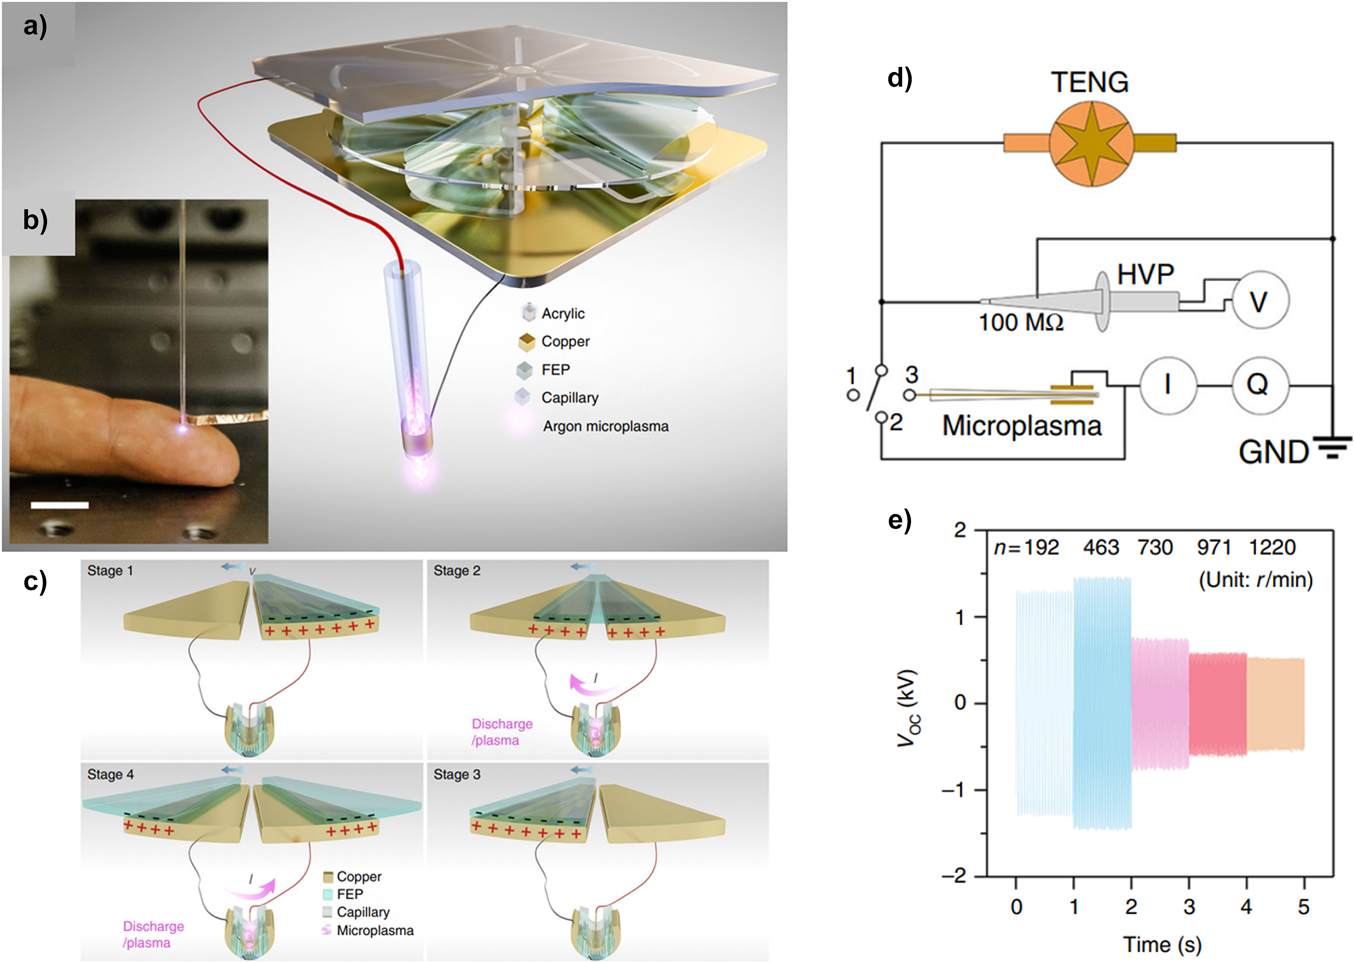
As shown in Fig. 11, Cheng et al. proposed a triboelectric microplasma generation system powered by the mechanical stimuli.Reference Cheng, Ding, Zi, Lu, Ji, Liu, Wu and Wang104 The structure of the TENG used in the study is illustrated in Fig. 11(a). Two triboelectric materials in the TENG are FEP and copper, where the FEP film serves as the rotator and the copper substrate plays a role as the stator. The FEP film was bended to contact the underneath copper layer instead of directly pressing the FEP film to the electrode, where the wear could be minimized to benefit long-term operation. An argon microplasma capillary was connected with the TENG in series. Illumination can be achieved by the capillary upon loading high voltage, as shown in Fig. 11(b). The operation mechanism of the TENG-driven plasma is illustrated in Fig. 11(c), which includes four stages in total. There are two stages where the plasma can be triggered by the TENG where the voltage drop on the plasma capillary is above the breakdown threshold voltage. The voltage measurement setup is shown in Fig. 11(d), where a high-voltage probe was used to measure the high voltage generated by the TENG. The measured output voltages of the TENG are shown in Fig. 11(e), where we can find that the output voltage reaches its maximal value when the rotating speed is around 460 rpm. If the rotating speed is too high, the FEP will be floated driven by the air pressure difference, and thus, the contact area for triboelectrification will be reduced, lowering the output voltage. The achieved triboelectrification-induced plasma can be used for the surface treatment and the display, as shown in Fig. 12. When the plasma is pumped to the surface of the FEP film, the hydrophobicity was affected, which can be indicated by the contact angle, as indicated in Figs. 12(a) and 12(b). Figures 12(c)–12(f) indicate a plasma-based display powered by the TENG, where the breakdown area was patterned.
(a) Schematic illustration of a TENG-driven atmospheric pressure non-equilibrium plasma jets (APNP-J). (b) The employment of the APNP-J for biomedicine usage. (c) Four-stage scheme of the TENG-powered DBD device. (d) Electrical characterization setup for the TENG triggered plasma emitter. (e) Open-circuit voltage characterization of the TENG rotating in various speeds. Reproduced with permission.Reference Cheng, Ding, Zi, Lu, Ji, Liu, Wu and Wang104 Copyright 2018, Springer Nature.

Demonstrated applications of the tribo-induced plasma. (a), (b) Surface treatment via the tribo-induced plasma processing and contact angle variation of the FEP film. (c), (d) Tribo-induced plasma-based display (e) A plasma disk driven by the TENG. (f) Photographs of the triboelectric plasma-based display exposed in different time. Reproduced with permission.Reference Cheng, Ding, Zi, Lu, Ji, Liu, Wu and Wang104 Copyright 2018, Springer Nature.

Microactuators triggered by TENGs
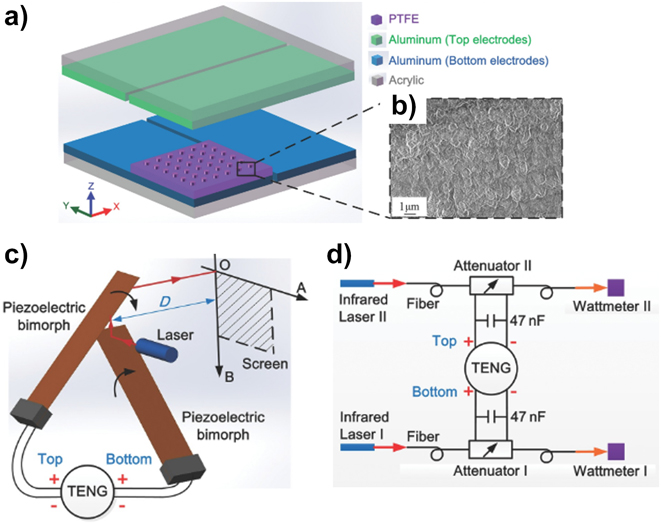
In addition to several electrically responsible materials that can be actuated by the high-voltage TENGs, over past years, great efforts have been made to develop smart devices intentionally to be driven by TENGs. In those studies, high-voltage electric field can be generated by TENGs, which induces electrostatic force and can drive some microactuators. Such devices achieve conversions from mechanical to electrical and then to mechanical energies. The mechanical-to-electrical energy conversion can be achieved by the TENGs, where high electric field can be formed. Situated in the high-voltage electric field and driven by the electrostatic force, the actuators will achieve mechanical responses, such as deformation, rotation, and vibration, serving as an electrical–mechanical energy converter. Various applications such as light scanning and beam steering can benefit from the actuations.Reference Liu, Wang and Wang105 Compared with the traditional battery-powered actuators, beside the advantage of being energy-saving and environmentally friendly, TENG-triggered actuators can be fabricated to be extremely thin, which will not occupy large spaces. Besides, since TENG itself can generate extremely high voltage, voltage-boosting circuit is not needed in the TENG triggered actuators, which simplifies the integration difficulties. Figure 13 illustrates a self-powered beam steering system, which consists of a TENG and a piezoelectric bimorph.Reference Zhang, Tang, Pang, Han and Wang106 Al and polytetrafluoroethylene (PTFE) are two triboelectric materials in the TENG. Two Al electrodes, as two conducting and triboelectrification layers, function as a stator, between which the PTFE-based slider sweeps. There are basically two Al-FEP TENGs located at bottom and top, respectively, as shown in Fig. 13(a). The electrode alignment of the top Al electrode is perpendicular to that of the bottom electrode, which means that either sliding in X or Y direction can generate high voltages through the triboelectrification effect. The PTFE film surface was nano-patterned by the ICP to enhance the triboelectrification effect, and the SEM image of which is shown in Fig. 13(b). When the PTFE film was situated in different locations between two aluminum electrodes, the output voltage varies.
TENG-driven self-powered optical modulator. (a) Schematic diagram of the designed three-layer sliding TENG. (b) SEM photograph of the nanostructured PTFE film. (c) A sketch of the structure of a 2D modulator driven by the three-layer sliding TENG. (d) Schematic diagram of an active optical attenuator with two channels. Reproduced with permission.Reference Zhang, Tang, Pang, Han and Wang106 Copyright 2014, John Wiley and Sons.

As shown in Fig. 13(d), both bottom and top TENGs were connected with piezoelectric bimorphs, serving as actuation systems. For each actuation system, a 47 nF external capacitor was connected with the piezoelectric bimorph in parallel to tune the voltage applied on the bimorph. The voltage drop on the bimorph will be reduced when an external capacitor was connected in parallel. The piezoelectric bimorph will be deformed on loading the voltage. Even though the deformation of the bimorph driven by high voltage is very small, it is capable to tune the optical path through the mirror reflection. As shown in Fig. 13(c), two piezoelectric bimorphs were perpendicularly oriented, which are driven by the two TENGs, respectively. For each piezoelectric bimorph, one terminal was fixed and the other end is free. The piezoelectric bimorph will be bended upon charged by the TENG, where the optical path can be greatly changed after the two continuous reflections by the bimorphs. After the reflection by the top bimorph, the light beam will be projected on the screen for visualization. The light-spot moving distance driven by such a self-powered device can be above 15 mm, which is greatly beneficial to the optical modulation.
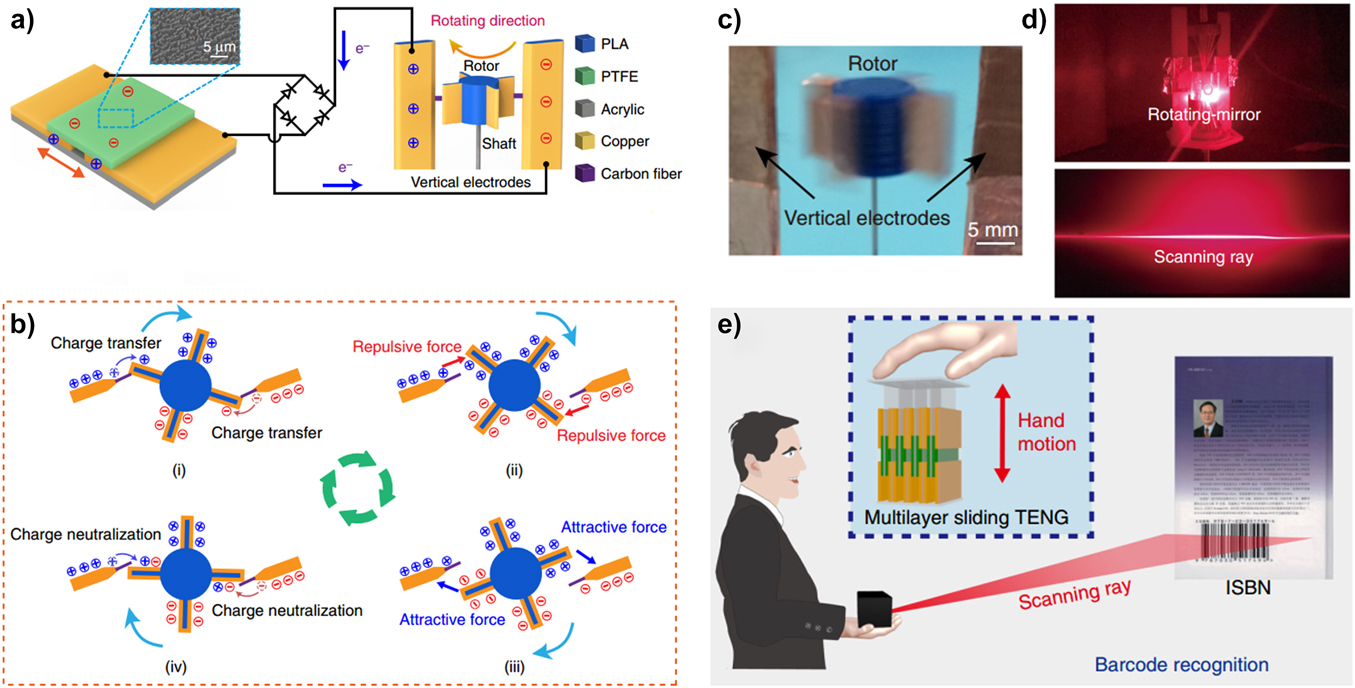
Another smart actuator that can be triggered by the TENG is the self-powered triboelectric motor (TM), which can convert the ultralow frequency sliding mechanical motion into the high-frequency rotations.Reference Yang, Pang, Bu, Liu, Luo, Jiang, Zhang and Wang107 As shown in Fig. 14(a), the whole actuation system consists of an FT-TENG and an electrostatic-force-driven rotating motor. The triboelectrification of the PTFE and the copper layer on the FT-TENG can generate high voltage. The rotating motor consists of a rotor with four uniformly distributed copper fins in the center and two bar-shaped copper electrodes, each of which was attached with a carbon fiber. The carbon fiber performs good electrical conductivity. The FT-TENG was electrically connected with the two bar-shaped copper electrodes of the rotating motor through a bridge rectifier. The two copper electrodes of the rotating motor will be charged by the TENG in DC mode. As shown in Fig. 14(b), owing to the electrostatic induction effect, the rotor moved, where the fin approached to the carbon fiber. Upon the fin was contacted with the carbon fiber, the charge of the fiber was transferred to the copper fin, resulting in a repulsive force. The charged fin was attracted by another copper bar electrode until being neutralized. Such operation mechanism ensures the rotor to keep rotating since both repulsive and attractive forces are kept in the same direction. Using this principle, the ultralow mechanical stimuli can be converted to the high-frequency rotation, as shown in Fig. 14(c). Using their proposed self-powered rotating actuation system, a rotating mirror for scanning rays can be achieved, which can be applied for the bar code recognition, as shown in Figs. 14(d) and 14(e). The proposed paradigm enables the optical MEMS systems to be fully self-powered, where a large potential market size can be expected.Reference Solgaard, Godil, Howe, Lee, Peter and Zappe108,Reference Xie, Jiao, Zhang and Puliafito109
(a) Structural illustration of TM and the PTFE film surface photograph. (b) Operation mechanism of the TM rotation. (c) Snapshot photograph of the rotated motor. (d) Photograph of the scanned light. (e) Schematic diagram of the self-powered scanner for the bar code recognition. Reproduced with permission.Reference Yang, Pang, Bu, Liu, Luo, Jiang, Zhang and Wang107 Copyright 2019, Springer Nature.

Self-powered electroadhesion driven by TENGs
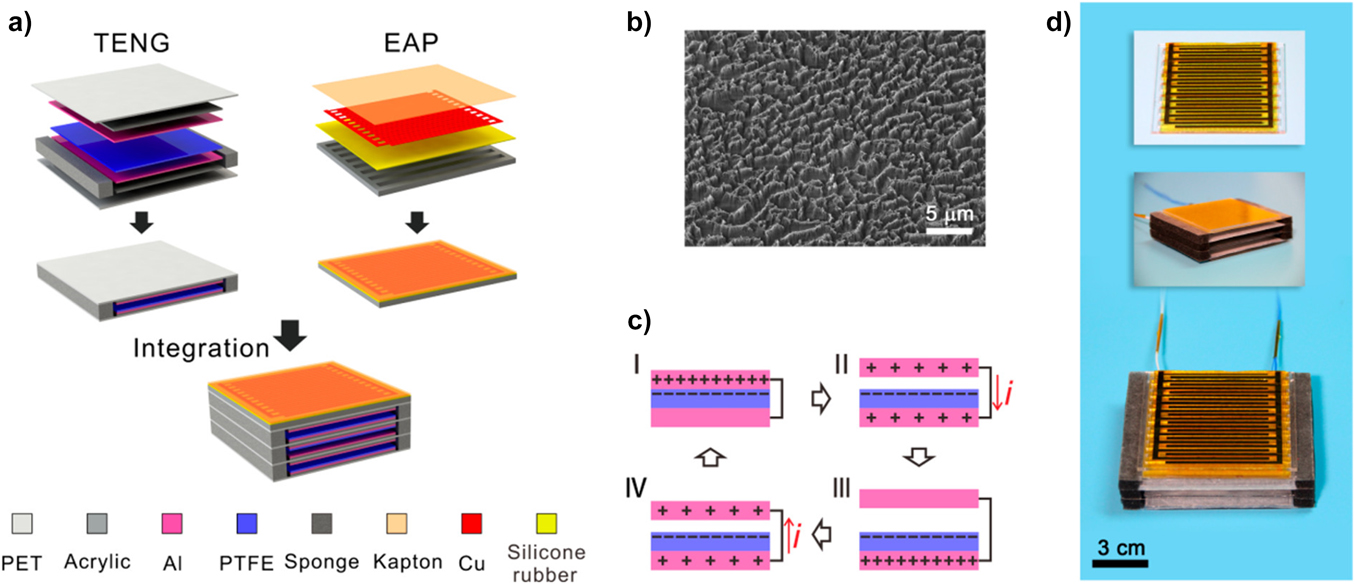
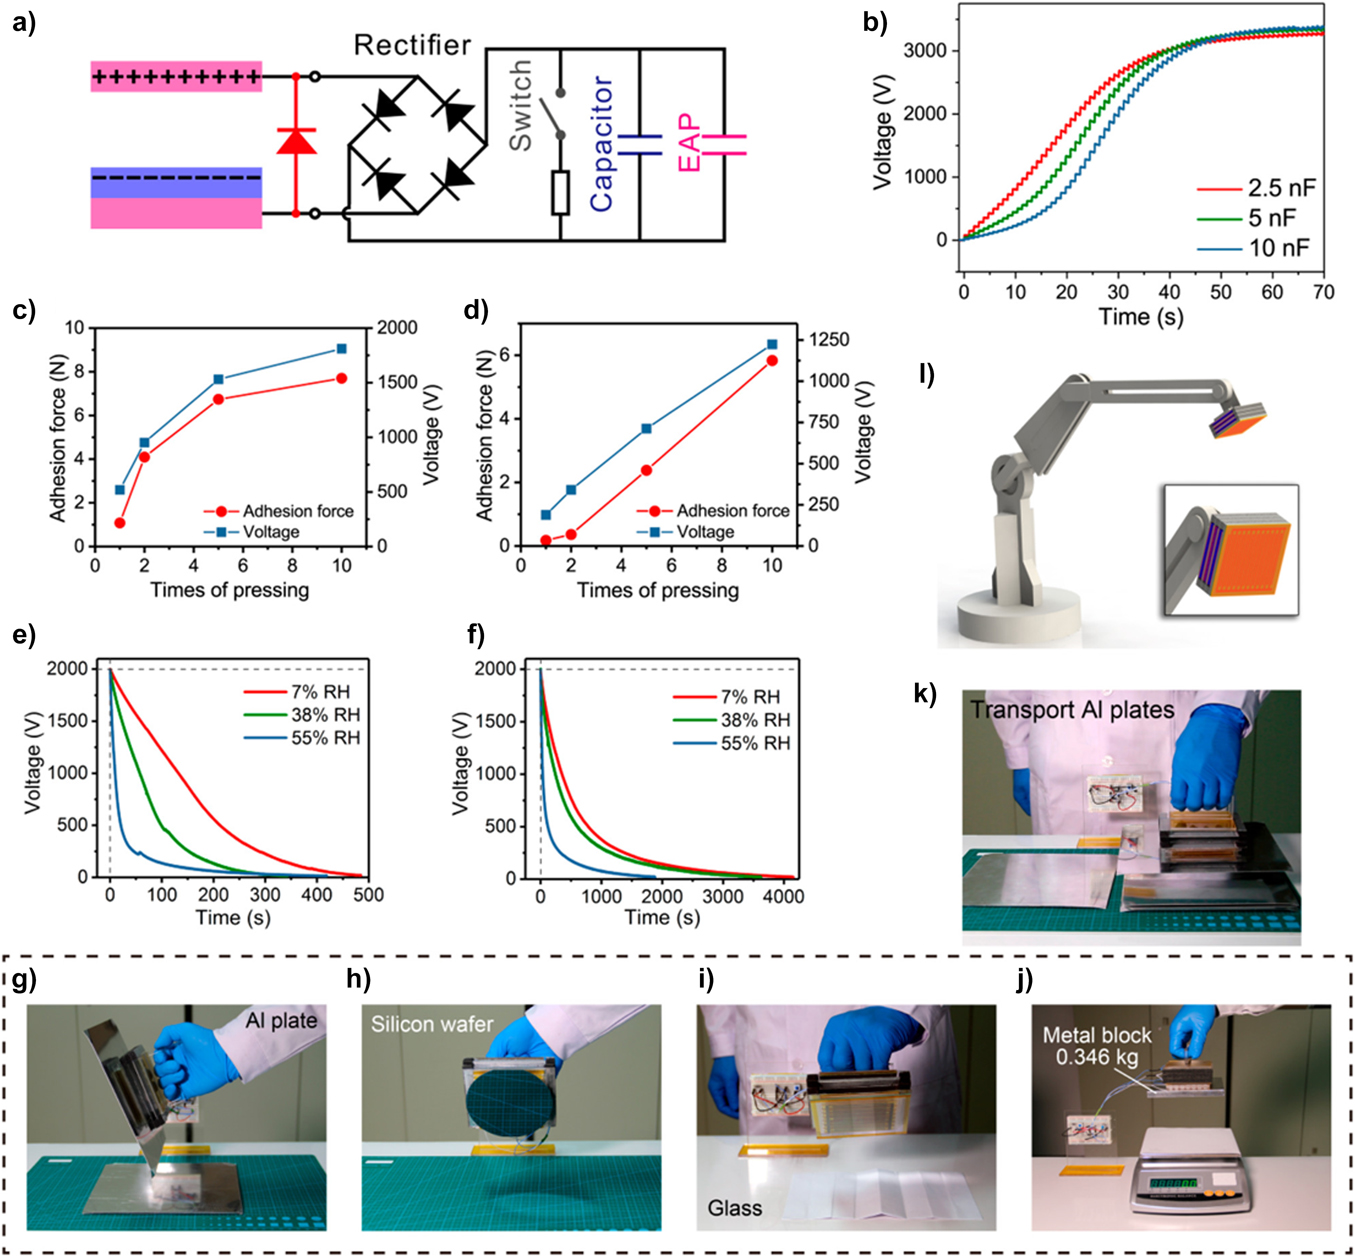
Another featured smart device enabled by high-voltage TENGs is self-powered electrosdhesion systems. Electroadhesion technology driven by an external power source can be applied in the field of robotics and material processing.Reference Monkman110–Reference Asano, Hatakeyama and Yatsuzuka115 Xu et al.Reference Xu, Wu, Yao, Chen, Yang, Chen, Huang, Zhong, Chen, Yin and Wang116 proposed a self-powered electroadhesion system that uses a high-voltage signal of improved modified multilayer TENGs to provide a stable output voltage of 4750 V. In the case of different surface charge densities and device configurations, the highest open circuit voltage can be achieved by optimal charge distribution, which is related to the multilayer TENG structure and charge replenishment channel.Reference Guo, Bamber, Singh, Manby, Bingham, Justham, Petzing, Penders and Jackson117,Reference Rus and Tolley118 The structural illustration of the TENG-triggered electroadhesion system is shown in Fig. 15(a) and the photograph of the system is shown in Fig. 15(d), which includes three contact–separation TENGs and an EAP. This TENG electrification mode is the same as the process of conventional EAP attachment and release, and the contact and separation between the TENG electrodes facilitate control of the entire system. The SEM images of the nanostructures of PTFE are shown in Fig. 15(b), where the surface of the friction layer after etching can enhance the triboelectrification effect. The basic working principle of this multilayer TENG is stated below [Fig. 15(c)]: generally, PTFE presents a higher electron affinity than Al, and as a result, a low potential is generated on one side of the Al electrode. By the periodic contact–separation movement of the tribo-layers, positive charges are transferred from the top Al electrode to the back Al electrode, which causes the alternating electrical signal of the TENG output. Afterward, researchers demonstrated self-powered electrical adhesion systems for various applications, as can be seen in Fig. 16(a). Based on the combination of TENG and the supplementary capacitor, the attenuation of high voltage on the EAP, which consists of a set of electrodes and an insulating layer, can be slowed down and adhesion can be stabilized at a certain value for a long time. Electroadhesive force was enabled by the high-voltage polarization through the electrostatic induction effect. With the enhancement of the charge supplement channel (CSC), the voltage of the TENG unit is capable of working effectively on the EAP with a much lower capacitance [Fig. 16(b)]. When no capacitor is added, as shown in Fig. 16(c), the voltage of the EAP in the circuit can quickly reach a high voltage state and the corresponding adhesion force also shows a tendency to increase rapidly. Integration of a 2.5 nF capacitor in the circuit slows down the rise of voltage and adhesion force, where the output voltage and adhesion are essentially in the previous state [Fig. 16(d)]. The humidity may strongly influence the performance of the adhesion system, and as shown in Fig. 16(e), the increase in the humidity results in the fast decrease in the established voltage. However, with the help of supplementary capacitor, the system can maintain high voltage for a longer period [see Fig. 16(f)], which can provide a much larger flexibility for manipulating target object. Through the demonstrations of the utility of an integrated self-powered electrical adhesion system by picking up, manipulating, and transporting different materials (conductive, semiconductive, and nonconductive materials), it is clear that the implementation of the CSC in TENGs can effectively generate power adhesion force in the EAP for practical applications [Figs. 16(g)–16(k)]. This TENG-based self-powered adhesion system is cost-effective, highly efficient, and convenient to manufacture that can be worked without further processing. Based on the previously mentioned form of charge replenishment, the CSC can achieve the highest voltage output in the corresponding configuration [Fig. 16(l)]. As for TENGs without charge replenishment channels, their charge allocation is not stabilized, which causes the charge to dissipate rapidly, yielding a low-voltage performance. This research proposed a self-powered electric adhesive system based on ascending voltage of TENG, which can provide a simple operation process and high adhesion force. The proposed adhesive system can manipulate conductive, semiconductive, and nonconductive material objects with various configurations, showing great potential in material handling, and the similar TENG device can also meet the need of high-voltage power supply for all kinds of application scenarios.Reference Wang119–Reference Yang, Yang, Ouyang, Kuang, Song, Xu, Poenar, Zhu, Yong and Wang121
(a) The structure of the self-powered electroadhesion system: three TENGs and one EAP. (b) SEM image of PTFE surface through the ICP method. (c) Basic working principle of the TENG. (d) Photograph of the fabricated system. Inlets show the EAP and the stacked TENGs, respectively. The above diagrams are not given to scale. Reproduced with permission.Reference Xu, Wu, Yao, Chen, Yang, Chen, Huang, Zhong, Chen, Yin and Wang116 Copyright 2018, American Chemical Society.

(a) Schematic diagram for the application circuit of self-powered electroadhesion system. (b) High-voltage state of different capacitors. (c) Test the adhesion and voltage of the Al plate at different points in time removing the capacitor. (d) Test two values above when adding capacitor. (e) The V oc of electroadhesion from dry to wet conditions. (f) Test the V oc in the same environment as E in the case of a capacitor. (g)–(k) The implementation of the CSC in TENGs can effectively power adhesion force generation in the EAP for practical applications. (l) The schematic of the EAP-TENG system. Reproduced with permission.Reference Xu, Wu, Yao, Chen, Yang, Chen, Huang, Zhong, Chen, Yin and Wang116 Copyright 2018, American Chemical Society.

Triboelectrification-induced electrospinning and mass spectrometer applications
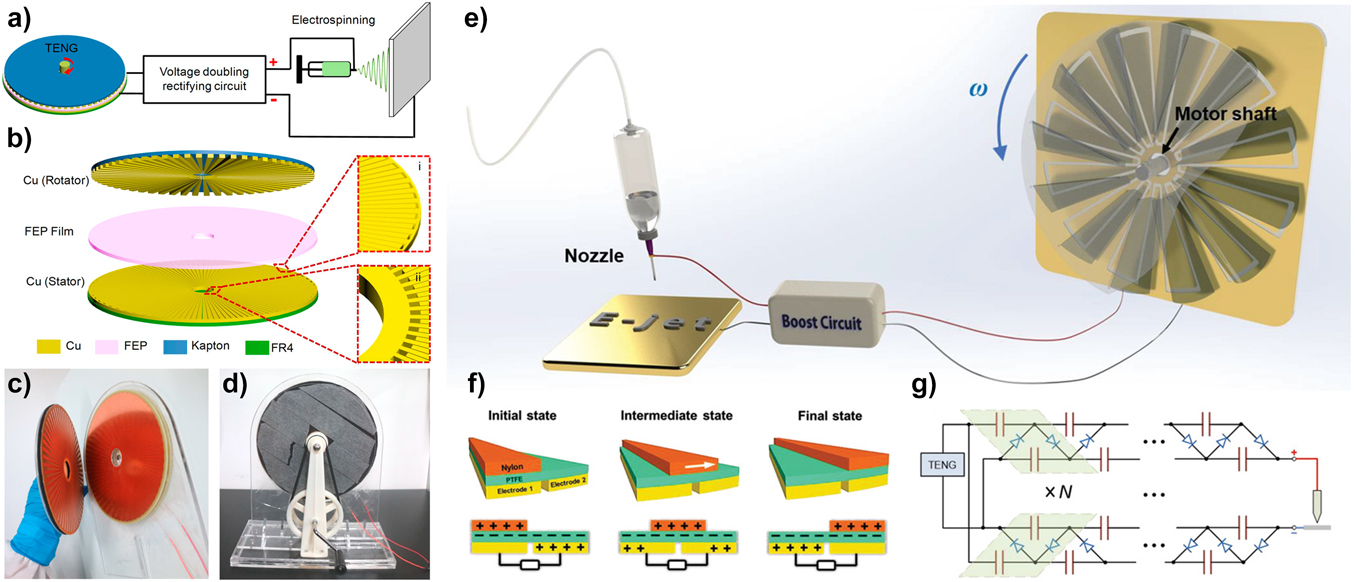
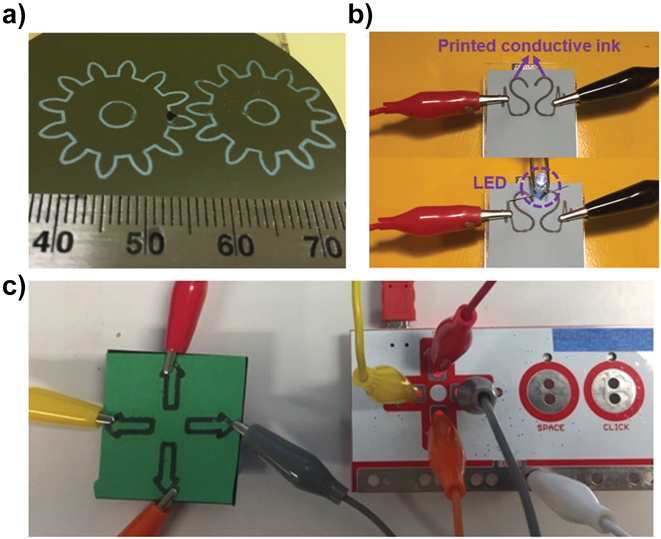
High-voltage TENGs not only contributes to the development of self-powered actuation systems but also greatly facilitate the advanced fabrication and material characterization technologies. In recent years, the development of flexible wearable electronic products has been accompanied by the production of various printing technologies,Reference Bellan and Craighead122–Reference Deitzel, Kleinmeyer, Harris and Tan126 such as screen printing and inkjet printing. Electrospinning, which is the charged fluid produced by high-voltage atomization separation of polymers, has been widely used in medical, sensor, and other fields.Reference Cho, Young and Kang127–Reference Li, Ma, Li, Yang, Mao, Luo, Gengzang, Xu and Yan131 Under the high electric field, polymer filaments with nanoscale diameters can be produced since the droplet at the needle changes from a sphere to a cone (known as a “Taylor cone”),Reference Taylor132 extending from the tip of the cone to form filaments. Another powerful technique is the inkjet printing, which belongs to electrohydrodynamic jet (e-jet), a high-resolution printing electronics technology that uses a high electric field to produce droplets.Reference Secor133–Reference Wu, Tetik, Cheng, Ding, Guo, Tao, Zhou, Zi, Wu, Wu, Lin and Wang136 As a kind of special power source, TENG has the characteristic of high voltage and low current, which leads to a better safety for both equipment and human body compared with conventional high-voltage power supplies.Reference Wang, Jeong, Seo, Joe, Han, Yoon and Lee137,Reference Seol, Han, Park, Jeon and Choi138 In 2017, Li et al.Reference Li, Yin, Wang, Zhou, Wang, Luo, Tang, Cao, Yuan, Li, Du, Wang, Zhao, Liu and Wang139 designed a self-powered electrostatic spinning system based on a rotating FT-TENG, as shown in Fig. 17(a), consisting of a rotating disc TENG, a pressure doubling rectifier circuit (VDRC), and a simple spinneret head. R-TENG [Fig. 17(b)] is composed of two triboelectric materials and one electrode layer, wherein the triboelectric material consists of a copper strip and an FEP film. Photograph of FT-TENG rotor (copper strip as friction material, left) and stator (copper strip as electrode layer, right) is shown in Fig. 17(c), and the assembled hand-cranked R-TENG is shown in Fig. 17(d). Thanks to the R-TENG drive; this self-powered electrospinning system is simpler to operate than commercial electrospinning machines on the market, with lower production costs, more efficient production, and energy savings. This self-driven electrospinning technology will bring major changes in the development of electric spinning machines, making it possible to implement electrospinning machines for on-site or remote areas without power. At the same time, Li et al. systematically studied the VDRC which demonstrated TENG’s capabilities for high-voltage applications to obtain the best configuration that the system can output the maximum constant DC voltage of 8.0 kV at the magnification factor of 22 and the capacitance value of 1 × 10⁴ pF. Subsequently, Wu et al. proposed a printed electronic circuit based on e-jet printing of TENG [Fig. 17(e)].Reference Wu, Tetik, Cheng, Ding, Guo, Tao, Zhou, Zi, Wu, Wu, Lin and Wang136 A RF-TENG, which consists of two parts, one stator and one rotator, is connected to the printing nozzle and the substrate through a voltage boost circuit. The nozzle is slowly moved by the machine, and the ink can be stabilized by air pressure control. The triboelectrifcation between the nylon films and the PTFE films induces positive charges on nylon and negative charges on PTFE shows the basic working principle of TENG [Fig. 17(f)]. Under electrostatic induction, when the nylon in the interdigital electrode sweeps across the PTFE film, electrons move between the two electrodes and ensure continuous AC. A boost circuit was used to amplify the output voltage of FT-TENGs, which enables smooth and accurate printing. Figures 18(a)–18(c) show the different graphics printed by Wu et al.Reference Huo, Liu, Luo, Gu, Liu, Wang, Chen, Ji, Lu, Yao and Cheng140 TENG drives include a pair of printed gears, two printed s-shaped conductive interconnections, and four conductive arrow patterns. Depending on the printing setup, the printed graphics can be used for a variety of different scenarios such as sensor array and electrical components printing. Due to their safety, stability, low cost, and high efficiency, this work provides an alternative to high-resolution e-jet printing and extends the range of applications for TENG.Reference Wang, Paine and Stark141–Reference Kim, Kim, Lee, Ji, Kim, An, Song and Park144
(a) The working process of the rotary FT-TENG. (b) Schematic diagram of the rotary freestanding-TENG. (c) Picture of the device part of the rotary FT-TENG. (d) The actual picture of the rotary FT-TENG. Reproduced with permission.Reference Li, Yin, Wang, Zhou, Wang, Luo, Tang, Cao, Yuan, Li, Du, Wang, Zhao, Liu and Wang139 Copyright 2017, American Chemical Society. (e) E-jet motion process of TENG-based equipment. (f) The working situation of TENG is a sliding mode. (g) Analog circuit diagram of TENG boosting voltage process. Reproduced with permission.Reference Wu, Tetik, Cheng, Ding, Guo, Tao, Zhou, Zi, Wu, Wu, Lin and Wang136 Copyright 2019, John Wiley and Sons.

The process of fluid-driven injection. (a) Two gear shapes photos. (b) The pattern to be printed connect to the LED. (c) Sensor distribution of the entire device. Reproduced with permission.Reference Wu, Tetik, Cheng, Ding, Guo, Tao, Zhou, Zi, Wu, Wu, Lin and Wang136 Copyright 2019, John Wiley and Sons.

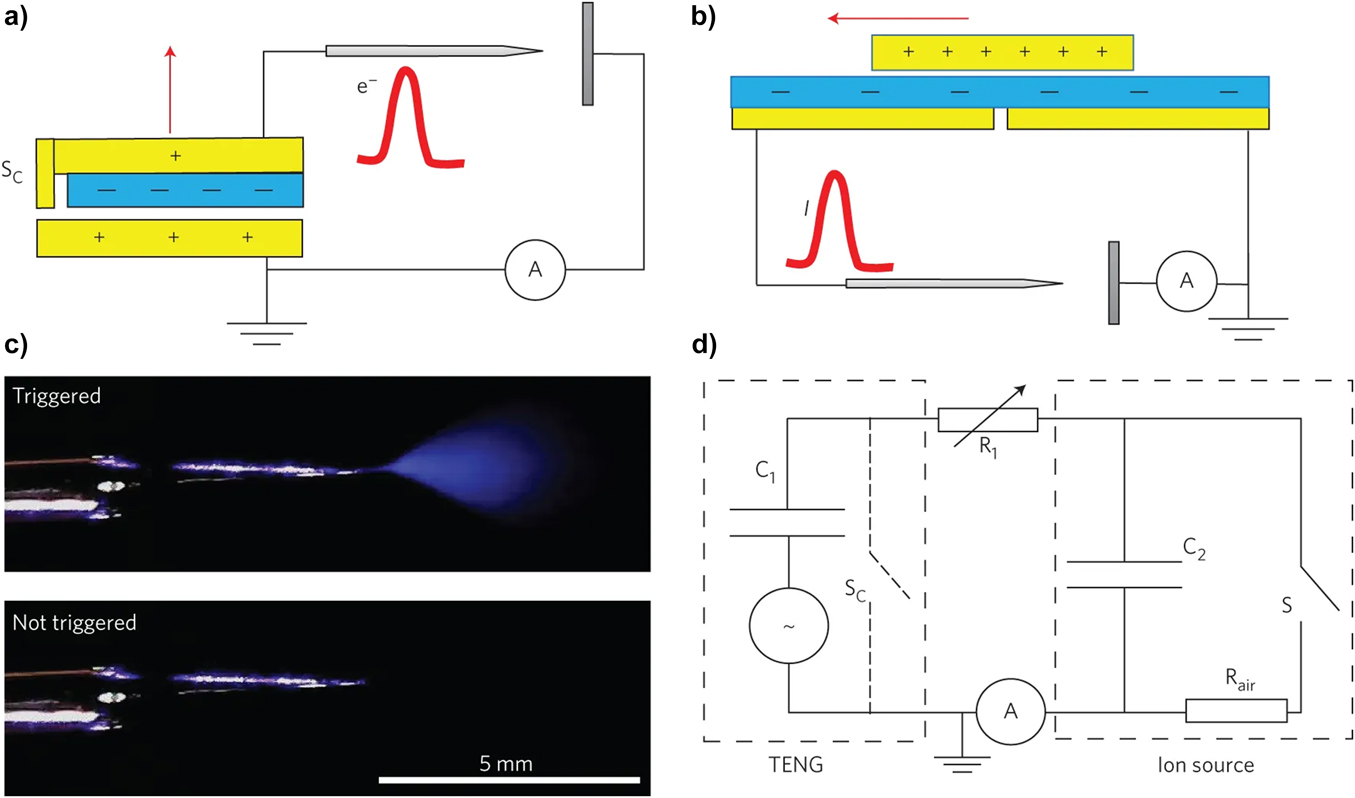
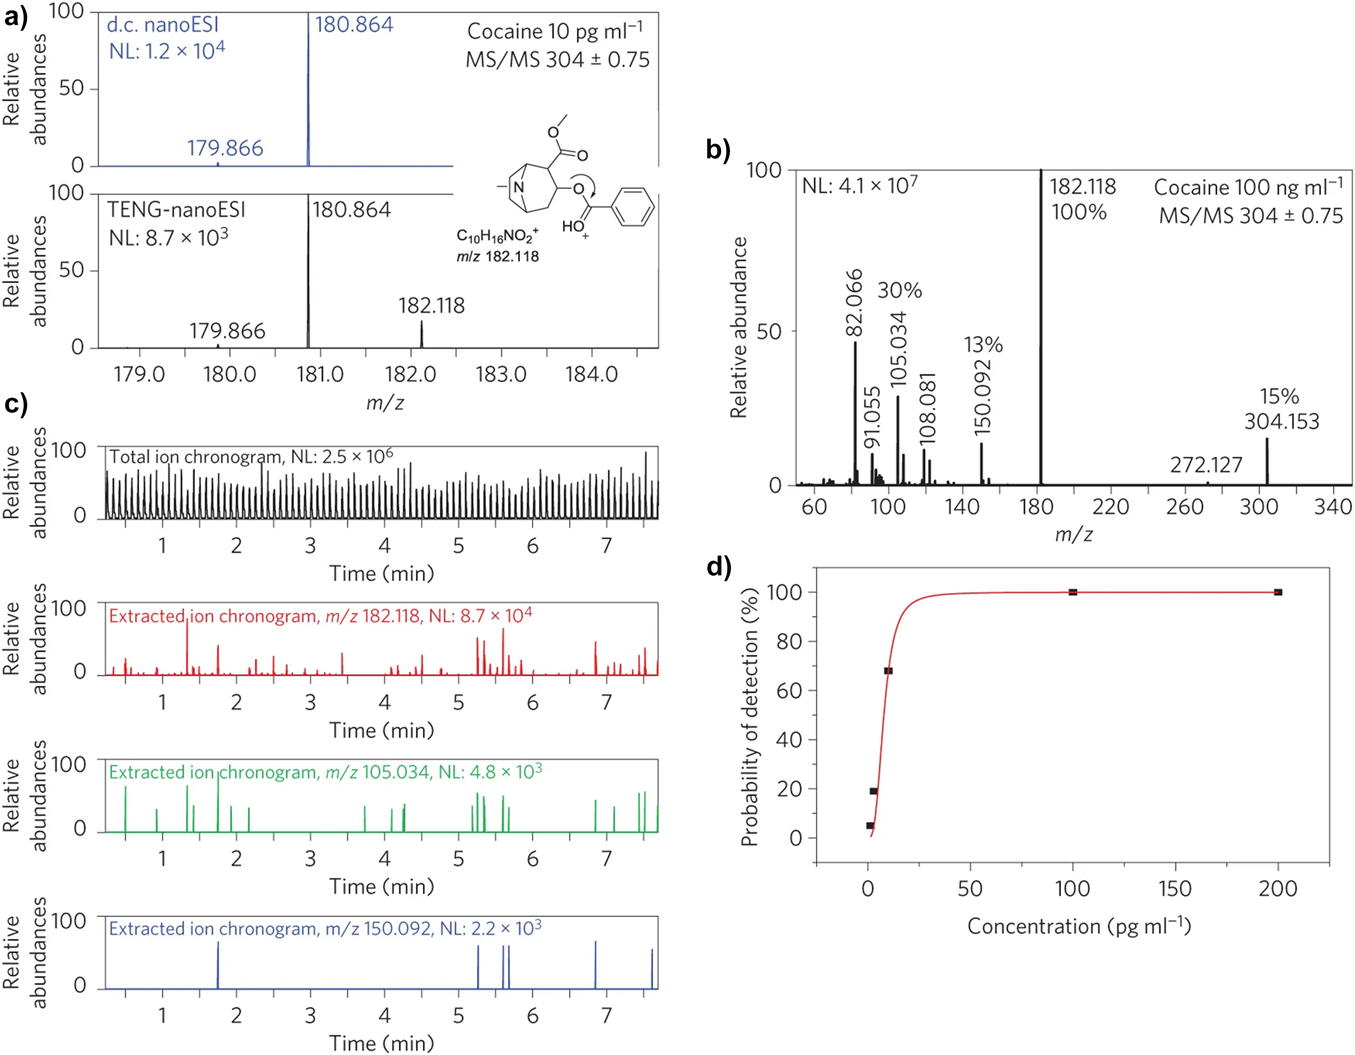
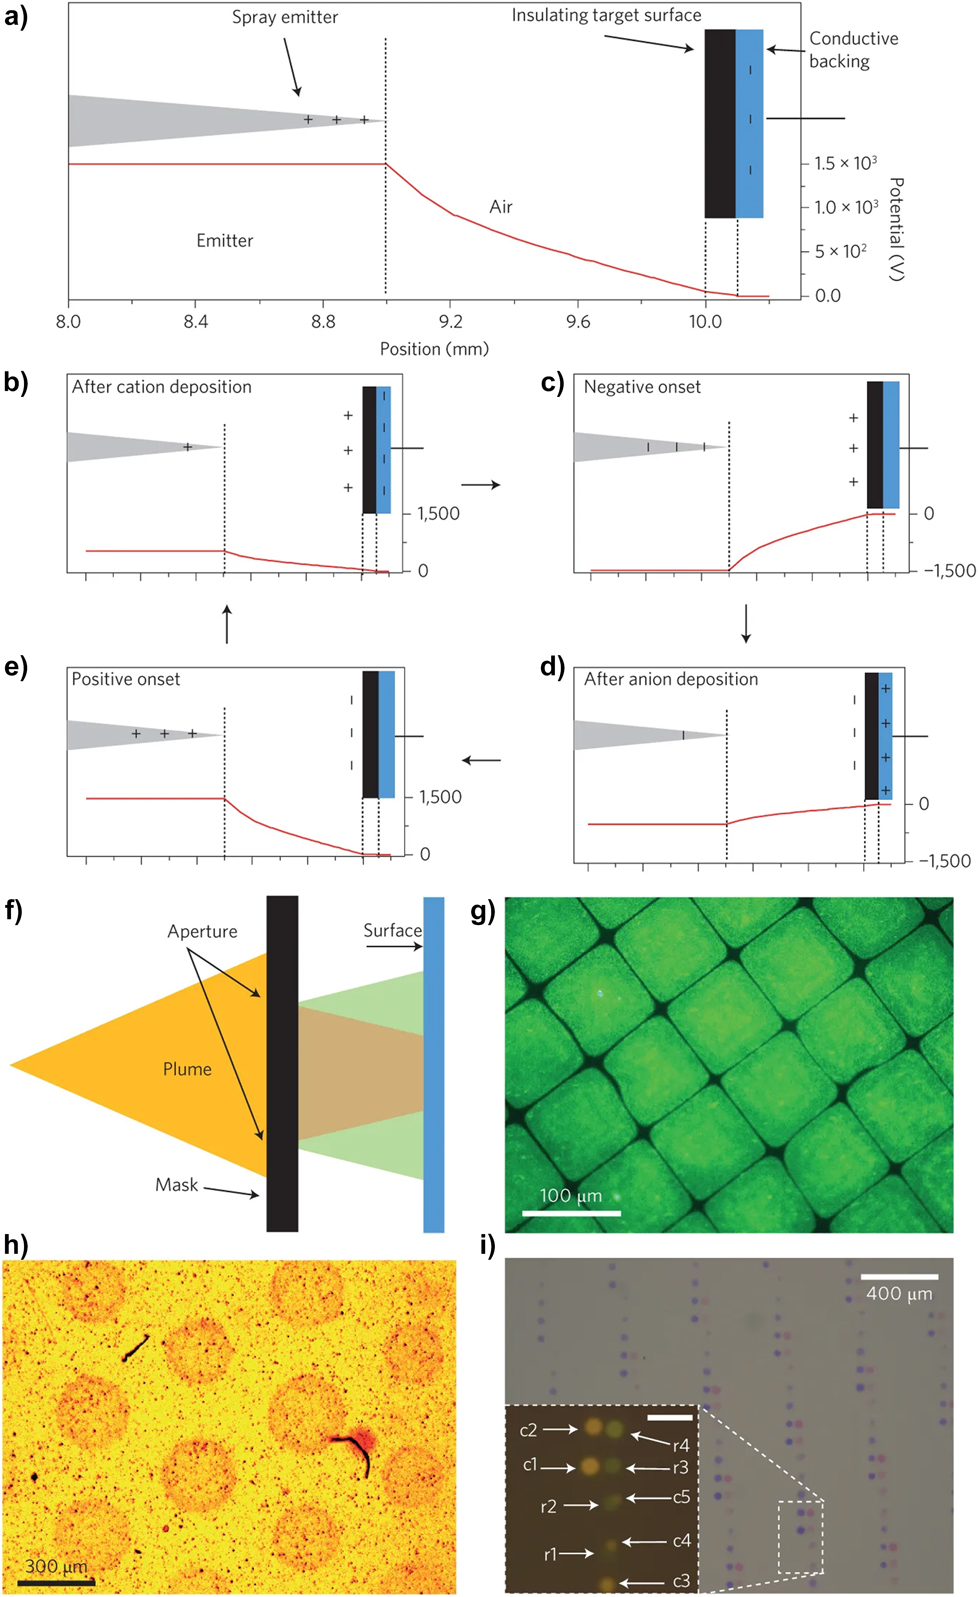
Mass spectrometry (MS) is one of the most powerful tools for the identification of pure substances, which has high sensitivity and important applications in many fields such as drug metabolism, clinical, food chemistry, and national defense.Reference Maher, Jjunju and Taylor145 Dedicated high-voltage switches and transformers can be used to drive finer electrospray ionization (ESI) modes through high-voltage pulses, dielectric barrier polarization, or capacitive induction.Reference Liang, Han, Xia and McLuckey146–Reference Huang, Li and Graham Cooks150 Based on the fine and accurate characteristics of the charge pulse, the ionization process that triggers the more durable ESI device can be repetitive and simple to operate.Reference Shekhar, Wang, Lee, Williams, Kim, Stach, Miller, Deglass and Ribeiro151 Nano-ESI due to the high voltage of TENG can bring higher sensitivity under the charge of lower ion pulse, so as to maximize the utilization of the sample; this is a matter of improving efficiency on both sides. TENG-based MS has now studied small organic molecules and large biomolecules, including various compounds, chemical explosives, and military mimics. The CS and FT TENGs, which are composed of two electrodes and at least one pair of triboelectric layers, are used in the work of Li et al.,Reference Li, Zi, Guo, Wang and Fernández152 and their coupling to a nano-ESI emitter. The mechanical movement of these layers can disturb the electrostatic balance. Therefore, the charge movement is redistributed by the connection with the external circuit, and the balance of the charge is achieved by this process, which is called as electrostatic balance. The CS-TENG shown in Fig. 19(a) is used to generate a unipolar charging pulse, and the FT-TENG [Fig. 19(b)] is used to generate charging pulses of alternating polarity. Both TENG-generated charges – TENGs are used for plasma discharge by providing charges to the nano ESI emitter [Fig. 19(c)] or the needle electrode. As shown in Fig. 19(d), the ion source can be electrically treated as a capacitor, indicating that air leaks through the switch S when the voltage of the ion source is greater than the initial value. Therefore, the air leakage during each cycle, which is called an ionization pulse, can be measured by the two mass spectrometers described above. In the absence of fragment ions, the low-voltage CS-TENG can generate a detection signal similarly to the high-voltage FT-TENG nano-ESI under the similar concentration level; in other words, the result is the increase in sensitivity of FT-TENG (Fig. 20). Figure 20(c) shows that the detection frequency of fragment ions decreases with respect to the abundance. As for m/z 182.118 fragment ions, when the detectable probability is 50%, the cocaine concentration is 8 pg/mL, as shown in Fig. 20(d), which further proves the nano-ESI function. The defocusing effect shown in Fig. 21(f), depositing a square via mask apertures [Figs. 21(g) and 21(h)], is opposite to effect of reversed and is similar to the expansion effect. TENG-driven ionization method is a convenient way to provide ESI and plasma discharge ionization and opens a new direction for efficient ionization with accurate numbers of total charges.Reference Tang, Tian, Zheng, Yan, Wang, Li and Wang153–Reference Chen, Zhu, Yang, Jing, Bai, Yang, Hou and Wang156 These new features have enormous potential applications in medical chemistry, medicinal chemistry, and defense chemistry.
Ionization by TENGs. Two different TENGs work in (a) separation of electrodes by contact; (b) electrode connected by sliding. Yellow, copper electrode layers; blue, FEP layers; red, move directions of the TENG electrodes; and pulse, the corresponding charge flow (e−, I) to the ion source. The vertical rectangle represents a steel plate collecting the ion current. (c) Dark-field images of a nanoelectrospray emitter. (d) An equivalent electronic circuit. The TENG, a capacitor (C1), and the part of the dotted line on the left; NanoESI emitter, C2, and the part of the dotted line on the right; Leak (S), after reaching an onset charge value; A, picoamperemeter; y, generated ions; R air, air gap; switch S C, the CS-TENG electrodes (a) are extended on the side to reset the electrostatic status at the contact position. Reproduced with permission.Reference Li, Zi, Guo, Wang and Fernández152 Copyright 2017, Springer Nature.

Enhanced sensitivity under transient TENG high voltage. Test methods for cocaine solution: (a) in the main mode, specific ions can be detected by FT-TENG; (b) in the sub-mode, higher levels of ions can be detected. (c) The method of quality inspection in the main mode. (d) The detection limit can be calculated by the red line. Reproduced with permission.Reference Li, Zi, Guo, Wang and Fernández152 Copyright 2017, Springer Nature.

Ion deposition on various types of surface using the FT-TENG. (a) Components in the deposition apparatus. (b) A positive charge will be concentrated at the tip of the needle at the transmitting end. (c) Increased surface potential causes spray deposition to stop. (d) An opposite electric gradient which triggering a spray pulse of the opposite polarity. (e) The process of stop and recycle for the emitter. (f) Scheme of the process of the FT-TENG. (g) The microscopic image of Alexa Fluor 488 fluorescent squares k. (h) The deposited patterned crystal violet spots. (i) The shape in the figure can be obtained by a specific solution during the movement of the target object. Inset: The dark-field image of the decreasing spot sizes. Reproduced with permission.Reference Li, Zi, Guo, Wang and Fernández152 Copyright 2017, Springer Nature.

Summary and perspectives
In recent years, with the rapid development of TENG technologies, more and more self-powered high-voltage applications have been proposed by many researchers worldwide. The conjunction of the high-voltage TENGs and electrically responsible materials and devices has been systematically reviewed in this paper. Various types of TENGs that can harvest mechanical energy in different modes from ambient environments were firstly reviewed including CS, SL, SE, and FT mode TENGs, followed by recent efforts to enhance the output performance of TENGs. Afterward, self-powered smart systems have been reviewed at material and device levels, respectively. Gases, liquids, and solids can serve as the electrically responsible materials for the TENG-triggered high-voltage applications. For applications usng gases, rare gases such argon can have breakdowns upon loading high voltages generated by the TENGs, resulting in the emission of microplasmas, which can be widely applied for the surface treatment and plasma-based displays. For liquids, the actuation of liquids situated at the high electric field can be achieved based on the electrowetting mechanism. The electrostatic-driven morphology variation of the liquids can be used for the self-powered wireless sensing, and the droplet which can move upon high-voltage loading can serve as a mini-vehicle, which is greatly beneficial to the chemical reactions. In addition, the electrospinning can also be achieved, where a great number of droplets can be created when the liquid was compressed and split by the strong electric field provided by the TENG, which can be used for the additive manufacturing and mass spectrometers. Solid can also be actuated by the high-voltage TENGs, and a typical application is the self-powered elastomer. Upon loading, the TENG generated high voltage on the elastomer and the deformation of the elastomer can be achieved, where the surface area will be enlarged and the thickness will be decreased, attributed to the electrostatic force. Besides responsible materials, several smart mechanical structures can also be driven by the TENGs. Micro-motors in this review such as piezoelectric bimorph-based mirror system and electrostatic-driven rotating motor can be actuated by the high-voltage TENGs, which can be used for the optical modulations and optical scanning.
Beside the reviewed high-voltage applications, it can be anticipated that more and more new paradigms can be proposed based on the reach of existing technologies. The following research should be considered and more works should be done in future to facilitate the high-voltage applications of TENGs.
(i) More efforts should be made to improve the both electrical output capability and reliability of TENGs.
The voltage generated by the TENGs is limited by the breakdown effect, which is governed by Paschen’s law. If the TENG generated output voltage is too high, the breakdown will occur and the output power will be greatly affected. Gases will be more easily to have a breakdown than the dielectric materials. Thus, structural optimization can be made on the TENGs to ensure that the high voltage is loaded on the dielectric material instead of the gas. Besides, according to Paschen’s law, the breakdown voltage limit under high pressure or vacuum atmosphere is much higher than that under normal pressures. Therefore, high-pressure or vacuum-packaged TENGs are desired to achieve the breakdown-free TENGs. Besides material selection, energy management circuit can also be used to minimize the power loss owing to the breakdown effect. If the breakdown effect in TENGs can be eliminated or alleviated, not only the output voltage can be further improved but also the reliabilities of TENGs can be strengthened, where a more stable power output can be ensured. Another issue to be considered with TENGs is the wear issue. After long time use, the triboelectrification degradation should be considered while designing the TENGs, which is an important factor for the commercialization.
(ii) The energy management circuit for the boost of frequency for high-power TENGs is desired in future. The majority of natural mechanical energy is usually with slow oscillations, which results in ultralow-frequency electrical outputs of TENGs. However, in some applications such as liquid crystal–based smart windows and focal length tunable lens, high-frequency electrical inputs are necessary. If the low-frequency electrical output generated by the TENG can be boosted through an energy management circuit with high-frequency oscillation, the application of high-voltage TENGs can be greatly enriched.
(iii) The majority of the reviewed high-voltage actuations triggered by TENGs are powered by wire-connected TENGs. However, wireless power transmissions are desired in some specific applications, which makes the powering process more flexible. It is possible that the harvested electrical power can be transformed into other energy forms such as ultrasound energy for the wireless transmission. However, minimizing the power loss during the power conversion process is the most important issue to be considered.
(iv) The triboelectrification-induced soft-robotics can be expected in future. The aforementioned electrically responsible materials can be mechanically integrated to achieve targeted continuing mechanical motions upon charging by the TENG in AC mode. And if the aforementioned high-frequency electrical outputs and wireless power transmission can be achieved, many applications achieved by self-powered triboelectrification-induced robotics can be anticipated.
(v) The reviewed self-powered smart systems with a combination of TENGs and actuators illustrate great application potentials. However, to facilitate the commercialization of these TENG-driven smart system, it is necessary to undertake the techno-economic analysis of the conjunction systems. The techno-economic life cycle assessment of TENGs as energy harvesters has been undertaken by Ahmed et al.Reference Ahmed, Hassan, Ibn-Mohammed, Mostafa, Reaney, Koh, Zu and Wang157 In their study, a grating structured and a rotation FT-TENGs were used for evaluation, where the capital expenditure, material processing and fabrication, operation expense, and lifetime were taken into account. Their results show that the predicted levelized cost of the grating structured and rotation FT-TENGs can be as low as US 2.681 cents per kWh and US 9.43 cents per kWh, respectively. However, until now, few people have ever made the techno-economic life cycle assessment of the self-powered system consisting of a TENG and an actuator. Beside the economic assessment of actuators, the lifetime influenced by the conjunction and the integration expense should also be considered.
Acknowledgments
Jiaqi Wang and Shuyao Li contribute equally to this work. This work was funded by HKSAR, the Research Grants Council Early Career Scheme (Grant No. 24206919), HKSAR Innovation and Technology Support Programme Tier 3 (Grant No. ITS/085/18), the Chinese University of Hong Kong Direct Grant (Grant No. 4055086), Shun Hing Institute of Advanced Engineering (Grant No. RNE-p5-18), the National Key R&D Project from Minister of Science and Technology (2016YFA0202704), the National Natural Science Foundation of China (Grant Nos. 51775049, 51432005, 11674215, 5151101243, and 51561145021), Beijing Natural Science Foundation (4192069), the Beijing Municipal Science & Technology Commission (Z171100000317001), and Young Top-Notch Talents Program of Beijing Excellent Talents Funding (2017000021223ZK03).