Introduction
Recent research has highlighted the existence of a social bias in the extent to which children have access to childcare. In general, children living in households of higher socio-economic status are more likely to be cared for in childcare centres. From the point of view of public policy, this is unfortunate. A related strand of recent research has demonstrated that the positive effect of childcare participation on child development is much stronger for children from a disadvantaged background. Most of the children who are currently receiving centre-based childcare are those who are likely to benefit the least from it, while those who can potentially obtain significant gains tend to be excluded.
The social bias in access to centre-based childcare has been widely documented (see, e.g., Van Lancker, Reference Van Lancker2013; OECD, 2011). It is not specific to childcare, as it is found also in other active, social-investment-oriented policies and is often referred to as the ‘Matthew effect’.Footnote 1 It is probably partly responsible for the disappointing results obtained by active policies in bringing more non-working adults into employment (Cantillon, Reference Cantillon2011). However, we currently lack a clear understanding of the causes behind it. A large part of the explanation is obviously down to labour market participation. Childcare users tend to be households with high levels of labour market participation (two earner couple) who also tend to have a higher socio-economic status. But, as we will show in our analysis, a social bias in access remains even if we control for differences in labour market participation. Next, one can think of the fee paid by parents. However, in most countries these fees are income-related in a way that is supposed to advantage low earners. Alternatively, one could hypothesise that it is the overall situation of undersupply of childcare spaces that generates the access bias. With an insufficient number of spaces available, high socio-economic status parents will be more successful in securing a slot because they can count on their social capital and on a better understanding of the way the allocation system works. In sum, it is not easy to work out exactly why children from a disadvantaged background are less likely to be taken care of in childcare centres.
In the light of this situation, this paper aims to test a small number of hypotheses capable of explaining the observed pattern of use of childcare services. It uses data collected in a survey on childcare use for the Swiss canton of Vaud (French speaking). Vaud provides an ideal setting for testing such hypotheses. It is a rather homogeneous area with regard to most relevant institutional features (school system, taxation, etc.) and labour market indicators. Childcare, instead, presents big variations. The service is organised by twenty-nine different groups of municipalities (known as ‘networks’) which enjoy a great degree of autonomy with regard to the amounts they charge to families and to the supply of childcare places. This institutional setup has resulted in a fairly high degree of variation across the canton that can be used to test our hypotheses. For example, for a low-income family the cost paid for exactly the same service can vary by a factor of 1:5, depending on where the family lives.
The paper starts by reviewing the literature on the access bias to childcare services. We then present and discuss the dataset and methodology used, before briefly introducing the institutional set up of childcare in the Swiss canton of Vaud. Finally, we present the results of our analyses and then conclude.
Literature and hypotheses
Recent research on childcare use has highlighted a potential source of inefficiency. Children from a disadvantaged background who attend centre-based care, compared to those who do not, are likely to enjoy higher returns in terms of academic achievement. Yet, these children are considerably less likely to receive centre-based care. The finding that children from disadvantaged backgrounds benefit disproportionally from participation in centre-based childcare is supported by several studies.Footnote 2 Using US longitudinal data, Magnuson et al. (Reference Magnuson, Ruhm and Waldfogel2007) found a statistically significant effect of childcare participation on achievement in reading and mathematics for disadvantaged children, but not for the general population. The effects for disadvantaged children were also found to be more long-lasting. However, they also found that childcare participation increases behavioural problems. A study on the returns from childcare participation in Germany, Felfe and Lalive (Reference Felfe and Lalive2012) found that returns in terms of academic achievement and school readiness are higher for children who are older at childcare entry and who have a lower socio-economic status. Yet, they point out, lower socio-economic status is also associated with a lower likelihood to receive centre-based childcare.
Positive impacts of participation in good-quality centre-based childcare, and more generally in preschool programmes, have also been highlighted in more comprehensive reviews. Esping-Andersen, reviewing several US studies, concludes that ‘The main finding is that high quality intervention on behalf of at-risk pre-school age children has substantial and lasting effects in terms of improved social integration, less delinquency and more schooling’ (Esping-Andersen, Reference Esping-Andersen2009: 133). Other reviews have also pointed out positive impacts of childcare participation on cognitive development, especially for disadvantaged children, though in some cases negative behavioural effects are also reported (Kamerman et al., Reference Kamerman, Michelle, Jane and Jeanne2003; OECD, 2011). In sum, the evidence suggesting that centre-based care is likely to be particularly beneficial for disadvantaged children seems rather strong. Yet, as argued above, these children are the least likely to be cared for in such centres.
A socially determined access bias to childcare services has been highlighted in a number of empirical studies. Using EU SILC (European Union Statistics on Income and Living Conditions) data for EU countries and national sources for the remaining ones, an OECD report found that low-income families (defined as the bottom 30 per cent of households by income) are less likely to use childcare services. The effect is clear in all OECD countries, except in the Nordic countries and Austria (OECD 2011: 144). Using the same data (EU-SILC) but different definitions of low and high-income households, Van Lancker finds very similar results. Inequality in childcare use by income is visible in virtually every country, but it is smaller in the Nordic countries and in Austria. It is particularly strong in some former communist countries and in France (Van Lancker, Reference Van Lancker2013). Using a different dataset, a strong bias is found in the Belgian region of Flanders, where children belonging to the 4th and 5th quintile of the income distribution are three times more likely to be in formal childcare than those of the 1st quintile. The bias, however, is almost non-existent in Sweden (Van Lancker and Ghysels, Reference Van Lancker and Ghysels2012: 135). A similar bias has been highlighted in Germany (Felfe and Lalive, Reference Felfe and Lalive2012).
With regard to Switzerland, a study by Schlanser has shown that children with highly educated mothers have a much higher probability of being in formal centre-based care. Children of low-skilled immigrants, conversely, were among the least likely (Schlanser, Reference Schlanser2011). A previous study using the same data we use in this paper found strong effects of income on the likelihood of being in a childcare centre. These income effects did not disappear after controlling for maternal employment (Bonoli and Vuille, Reference Bonoli and Vuille2013).
The thesis that access to centre-based care is socially biased is strongly supported by the available empirical literature. However, these studies generally fail to answer convincingly the question of what are the causes behind this outcome. One obvious hypothesis makes reference to the extent of labour market participation of the parents (first hypothesis). Two earner households are overrepresented both among the higher income strata and among childcare users. This generates the observed correlation between income and childcare use, which is in fact spurious as both measures are affected by the labour market participation of the parents. This explanation of the access is convincing and supported by the empirical evidence (Van Lancker and Ghysels, Reference Van Lancker and Ghysels2012; Bonoli and Vuille, Reference Van Lancker2013; Coneus et al., Reference Coneus, Goeggel and Muehler2007).
However, after controlling for labour market participation, a social bias remains. For instance, Bonoli and Vuille (Reference Bonoli and Vuille2013) show that, controlling for the number of hours worked by the mother,Footnote 3 higher income groups are still more likely to have their children in centre-based care while immigrants from Southern and Eastern Europe are less likely (Bonoli and Vuille, Reference Bonoli and Vuille2013: 35; Coneus et al. (Reference Coneus, Goeggel and Muehler2007)) show that, after controlling for maternal employment, the likelihood of children being in a childcare centre still increases with the education level of the mother and with both parents being of German nationality, though not with household income. Van Lancker found that a substantial income effect persists in most EU countries when considering only children with employed mothers (Van Lancker, Reference Van Lancker2013).
If labour market participation does not explain the totality of the access bias, then what else might do so? The next candidate is the cost of the service to the parents (second hypothesis). In most countries, fees for subsidised childcare services are progressive, i.e., lower for low-income families. But is the progressivity strong enough to make childcare use equally attractive to different income groups? The comparison between Sweden and Flanders by Van Lancker and Ghysels suggests that fees are unlikely to be the factor that explains the difference between the two territories in relation to the access bias. They point out that, on average, bottom quintile families actually pay less as a proportion of their earnings in Flanders than they do in Sweden. At the same time, Flemish low-income families are less likely to use the service (Van Lancker and Ghysels, Reference Van Lancker and Ghysels2012: 135). On this basis, they conclude that the difference between the two countries must be motivated by availability rather than the progressivity of the fee structure.
Shortage of childcare places is the third hypothesis we can make to explain the access bias to centre-based care. Since supply is insufficient to meet demand, we can expect highly educated parents and nationals to be better equipped to understand how the system of allocation of childcare places works and fare better in the process. This may require skills like ability to persuade and may include making use of connections to jump the queue. Low-skilled parents and immigrants are less likely to be able to rely on these skills and resources, and this is why they tend to be excluded from centre-based care. If this hypothesis is correct, then near universal supply, as it exists in Sweden, is required to avoid the kind of social bias we observe everywhere else.
Finally, our fourth and last hypothesis concerns attitudes towards childcare and how they shape preferences for reliance on formal or informal care. Depending on their cultural background, individuals are likely to develop very different preferences towards formal childcare, independent of their economic status. In particular, immigrant status is often associated with a reduced probability of being in centre-based care. To the extent that many migrants in Europe originate from countries where traditional family values are more pervasive, it may be the case that the lower rate of participation is due to a preference for other forms of care, either by the mother or by members of the extended family or community, in a mostly informal setting.
The discussion above has allowed us to identify four hypotheses that can make sense of the observed access bias to centre-based care. These make reference to: (1) the volume of parental (essentially maternal) employment; (2) the cost of the service for low-income parents; (3) the availability of childcare places; and (4) the predominant family values of some migrant communities. The data in our possession allow us to properly test only hypotheses (1) to (3), since, unfortunately, our dataset does not contain value questions. We will, nonetheless, test whether nationality has an impact on use and consider whether this may be due to values. Before doing that, however, we briefly present the way in which childcare is organised in the Swiss canton of Vaud.
Childcare in the Canton of Vaud
In Switzerland, the provision of childcare services is a competence that belongs at the municipal level. Services are generally provided by non-profit making private organisations that receive subsidies from the municipalities and can, as a result, offer the service at below market prices. In the canton of Vaud, childcare services are organised by a cantonal law adopted in 2007. The law encourages municipalities to join forces and constitute ‘childcare networks’ by providing subsidies to those that participate (providing subsidies corresponding to about 15 per cent of the cost of the service). The law includes some requirements in terms of quality, but allows a great deal of room for manoeuvre with regard to the supply of childcare places and the fees charged to parents. As far as fees are concerned, the law simply states that fees must be a function of parental income, that the service must be ‘financially accessible’ and that the highest fee cannot be higher than the full cost of the service.Footnote 4
The incentives provided by the 2007 law had some effect, as over 95 per cent of the municipalities have joined a network and receive cantonal subsidies. This has generated a notable expansion in childcare services. This institutional setup, however, has resulted in a great degree of variation across networks of municipalities. Variation is particularly large with regard to the fees that must be paid by parents. Since the law prescribes that the fee must be a function of household income, all networks price the service higher for higher income families. The extent and the way they do that, however, is extremely diverse. First the level of the fee can vary quite substantially across networks. Second, the way in which family income is calculated is also different. In addition, in some networks a lower rate is charged for the second and subsequent children from the same family. Sometimes the fee includes meals, while sometimes these are charged in addition. This complex web of rules is what determines how much families have to pay for a given service. The system is so complicated that it is pointless to try and examine the variation across networks by listing the various rules in force. A much more efficient approach to studying this variation is to simulate the cost of the service for model families, i.e., hypothetical families with set characteristics for which the cost is calculated in each network. This is the approach we followed. The results are presented in the next section.
Data and methods
The data used in this study come from two different sources: a survey carried out in 2012 which contains information on childcare use by individual families and a simulation of cost of service for a range of hypothetical model families in the different networks that provide childcare in the canton of Vaud. These two sources were merged into a two-level dataset, where the macro-level refers to childcare networks (groups of municipalities) and the micro-level concerns individual children and their families.
Micro level
We use data collected in a survey carried out in September 2012 covering a broad range of issues pertaining to the needs and characteristics of the population who use childcare. This survey targeted families with children aged nought to twelve years old residing in the canton, constituting a sample of 875 children aged nought to four and located in the different childcare networks. Our analyses are based on twenty-three childcare networks out of a total of twenty-nine. Three were dropped because they were created after the simulation exercise was performed and three because they have less than ten observations in the micro-level dataset.
At the micro-level, our dependent variable is a dichotomous variable taking the value of 1 if children are attending childcare for at least eight hours a week on a regular basis. This lower limit was chosen in order to restrict the target of the analysis to families using childcare on a regular basis and for at least one day a week. Because we are interested in exclusion/inclusion phenomena in the use of childcare, rather than in its intensity, we preferred not to use the full time rate equivalent as our dependent variable. From the perspective of the potential impact of childcare on child development, what matters is the fact of being cared for in a centre-based facility, not so much the number of hours of care received. Sensitivity analyses with a lower limit set at sixteen hours did not alter our findings.
Our main independent variable is household income, divided into three categories: 0–6,000, 6,001–10,000, more than 10,000, all in Swiss francs (CHF). Additional independent variables include the employment status of the mother taking the value of 1 if she works full time or at least 50 per cent of regular hours and 0 otherwise (models with a more fine-grained measure of maternal employment, with categories distinguishing between different degrees of part-time employment, less than 20%, 20–49%, 50–79%, 80–100%, were also tested and produced similar results, while the employment status of the father was tested in all models but was never found to be significant); the nationality of the child (Swiss, North and West European, South and East European, other) to ascertain cultural aspects influencing attitudes towards childcare; the age of the child; and the household type (couple with children or single parent). Other control variables, such as the number of children, were included to test for the robustness of our results but were dropped because of their lack of significance.
Finally, it is important to note that access to childcare is also expected to foster labour market participation. The causal link between the two variables remains ambiguous, which might lead to endogeneity problems in our models (since there are more places available, more women will enter employment). Yet, studies of the development of childcare in industrialised countries have shown that childcare services developed in response to women's entry into the labour market and not the other way round (Naumann, Reference Naumann2006; Leira et al., Reference Leira, Tobio, Trifiletti, Gerhard, Knijn and Weckwert2003; Bonoli, Reference Bonoli2013: chapter 5). Moreover, in the canton of Vaud, there is a chronic shortage of childcare spaces, and informal childcare is widely used as an alternative by women who want to work (Bonoli and Vuille, Reference Bonoli and Vuille2013). Therefore, the likelihood that childcare use determines the volume of maternal employment is rather low. On the contrary, a higher degree of labour market participation is likely to increase the need for women to access formal childcare, while it is rather the availability and costs of these services that will determine to what extent they are able to participate in the market. Sensitivity analyses that were conducted with models excluding the female employment variable did not result in any substantial change in our results.
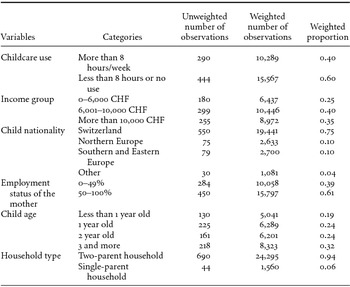
Table 1 summarises our dataset at the micro-level. Because all variables are categorical, only the weighted proportion of observations by category is reported.
Descriptive statistics of the micro-level dataset

Notes: The total and proportion of observations were weighted using the sampling weights provided with the dataset and were obtained after dropping the missing observations of all variables included. The unweighted total number of observations is the same as the one reported in Table 3 under n, i.e., 734. The weighted total is 25,855.
Macro level
In our study, the macro-level consists of twenty-three childcare networks in the canton of Vaud. Our independent variables at the macro-level are based on a simulation of the cost of the service for a range of model families, on administrative data and on network averages of variables contained in the individual datasets presented above.
The cost of service
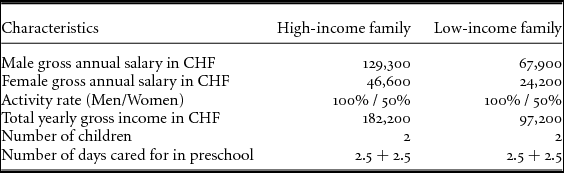
In order to show the extent of variation in what parents have to pay, we simulated the actual cost of a given service for model families with different income levels. Our low-income family has one parent working full time and the other part time (50 per cent), both of them earning a salary equal to the upper limit of the 1st quartile of the distribution of wages of workers with children aged nought to ten. They have two children below school age and use childcare services 2.5 days a week (see Table A1 in the appendix and Bonoli et al., Reference Bonoli, Abrassart and Schlanser2010, for more details on the simulation).Footnote 5 The high-income family has exactly the same features, except for the salaries, which correspond to the upper limit of the 3rd quartile. The costs were simulated for only twenty-six out of twenty-nine networks, since three networks were created after the simulation exercise.
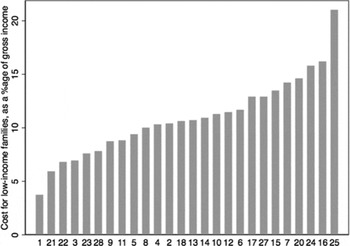
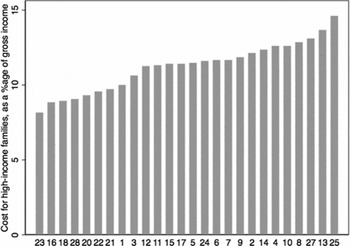
The cost of the service for these model families is reported in Figure 1 (low-income model family) and Figure 2 (high-income model family). The graphs show that the extent of variation is substantial. For our low-income model family, the cost for exactly the same service can vary between a low of 4 per cent of gross earnings to a high of over 21 per cent: a five-fold difference. If the two extreme cases are disregarded, variation remains sizeable, between 6 per cent and 16 per cent of gross earnings. A quick comparison of Figures 1 and 2 also shows that variation in the cost of the service is greater for low-income families. This is due to the fact that high-income families receive a smaller subsidy and tend to pay a fee that approximates the full cost of the service. The variation is only between 8 per cent and 15 per cent of gross earnings if all networks are considered, and 9 per cent and 14 per cent if the two most extreme cases are disregarded.
Cost of childcare for a low-income family (see text for definition) as a proportion of gross earnings in the twenty-six different networks Note: Numbers on the horizontal axis are network identifiers. Three networks were not included (19, 26, 29)

Cost of childcare for a high-income family (see text for definition) as a proportion of gross earnings in the twenty-six different networks Note: Numbers on the horizontal axis are network identifiers. Three networks were not included (19, 26, 29)

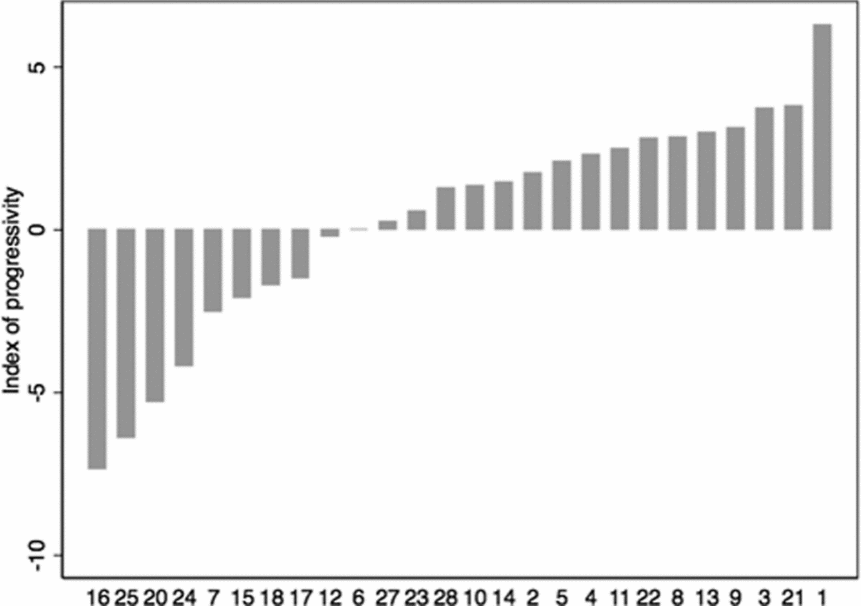
In our analyses, we also measured the progressivity of the fee schedule, with an index calculated as the difference between the cost of childcare for high-income and for low-income families expressed as a percentage of gross annual income. The progressivity index is presented in Figure 3, and illustrates the existence of large differences across networks. This is in spite of the fact that, in cash terms, high-income families pay more than low-income families in every network (according to the law).
Progressivity index: difference in percentage points between the cost for a high-income family (as a percentage of gross income) and the cost for a low-income family Note: Numbers on the horizontal axis are network identifiers. Three networks were not included (19, 26, 29)

Figure 3 provides an indication of the progressivity (or lack thereof) of the fee schedule used in the twenty-six networks. As can be seen, some networks have a progressive schedule, some networks charge proportionally to earnings and some other networks have a regressive fee schedule. This great extent of variation provides the ideal conditions in which to test hypotheses concerning the impact of cost on access for families with different income levels. In this respect, it is important to note that the progressivity index is strongly and negatively correlated to the cost of childcare for low-income families (r = ‒0.91), but only weakly correlated to the cost for high-income families (r = ‒0.30).
Availability
The impact of availability on the extent to which disadvantaged groups have access to childcare is more difficult to model than that of cost. In fact, it has been demonstrated that a higher supply of childcare slots tends to be associated with higher demand. This is also visible in our data. Supply is more developed in urban areas than in rural ones, but unmet demand is also greater in urban areas (Bonoli and Vuille, Reference Bonoli and Vuille2013). This suggests that, during the expansion phase of childcare services, supply may contribute to creating demand. A similar phenomenon has been observed in Italy, where the longer waiting lists are found in the regions which have higher supply (Suardi, Reference Suardi2012).
Our hypothesis on the impact of availability on access for disadvantaged children needs to take this observation into account. What matters in relation to the access bias we are interested in is not so much the number of childcare slots that exist, but the intensity of the competition among families who want to obtain them. Competition is stronger where the imbalance between (low) supply and (high) demand is greater.
For these reasons, we use two different variables to test the availability hypothesis (our third hypothesis above). First, we use a simple measure of supply, the coverage rate (number of slots per 100 children aged nought to four) obtained from administrative data.
Second, in order to capture the extent of competition for scarce childcare places, we use information collected in our survey regarding the length of the waiting period before obtaining a childcare place. On this basis, we calculated an index of ‘competition for childcare’ in each network as a weighted average of a categorical variable using sampling weights, and coded as follows: 1 – waited less than one month, 2 – waited from one to six months, 3 – waited from seven to eleven months, 4 – waited one to two years, 5 – waited more than two years.
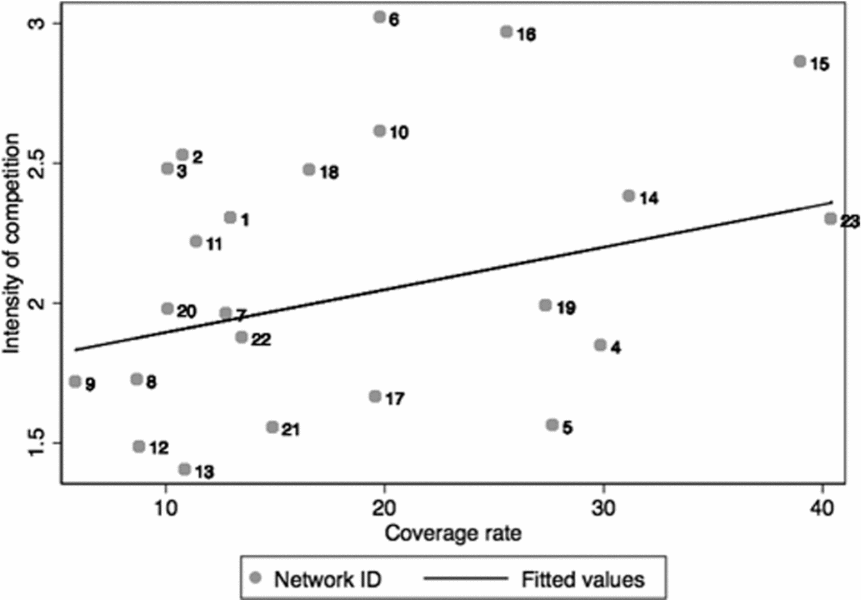
Figure 4 shows that the coverage rate is weakly but positively related to competition. Competition, measured by the length of waiting lists, tends to be stronger in networks where the coverage rate is also higher.
Relationship between coverage rate and the competition for childcare index

The macro-level data presented above show that the canton of Vaud provides ideal conditions to test the impact of cost and availability/competition on access to childcare for disadvantaged families. In fact, while these two variables display a high degree of variation across the canton, most other relevant factors are kept constant: the school system, taxation, and the labour market.
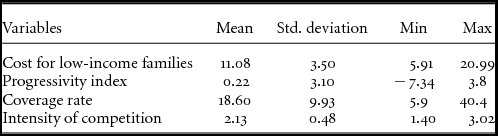
Table 2 summarises our dataset at the macro-level.
Descriptive statistics of the macro-level dataset
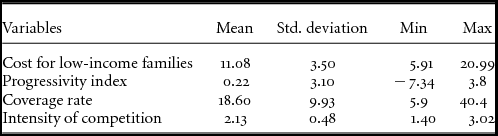
Notes: These statistics were obtained after dropping the missing observations of all variables included. The total number of observations obtained is the same as the one reported in Table 3 under N, i.e., 23.
Model specification
We use a multilevel logit model, both in the form of a random intercept and a random slope model. In the random slope specification, the effect of the dichotomous variable identifying households with a monthly income of more than 10,000 CHF is allowed to vary across networks. Cross-level interaction effects are then created using the household income measured at the individual level and the institutional variables measuring the supply and cost of childcare. This cross-level interaction provides information on whether the fee structure explains the variation in the effect of income across networks. A positive coefficient indicates a positive impact of the institutional variable to the advantage of high-income families (since our reference category is the low-income household). Once the cross-level interaction is included, the coefficient of the institutional variable must be interpreted as the effect of this institutional factor for low-income households, as they are our reference category. The interaction effect then measures the difference in the effect of the institutional factor between the reference category and the category it is interacted with. For instance, an interaction effect between the cost of childcare for low-income families and the income category of the household will be included in our analyses. The single effect of the cost of childcare, once the interaction effect is also included in the model, will thus reflect the impact of this cost for low-income families only. The interaction term between cost and the category identifying high-income families will measure the difference in the impact of the cost between the reference category, low-income families, and high-income families.
Rescaled probability weights were included at the network level to obtain a more accurate estimation of the effect of our independent variables for the whole population. Odds ratios are provided for a more intuitive interpretation of the results. The appropriateness of using odds ratios has been recently disputed (see, e.g., Mood, Reference Mood2009). In our case, however, we are not interested in comparing the size of the effect of our independent variables across models or groups. Moreover, the inclusion of many controls and the fact that the coefficients did not vary much across models guarantees that the interpretation of these coefficients is not too contingent on the residual variance of the models. We also graphically confirm our main results using predicted probabilities that are not subject to the same previously mentioned problems as in the case of odds ratios. We are thus confident in the interpretability of the coefficients of our independent variables.
Findings
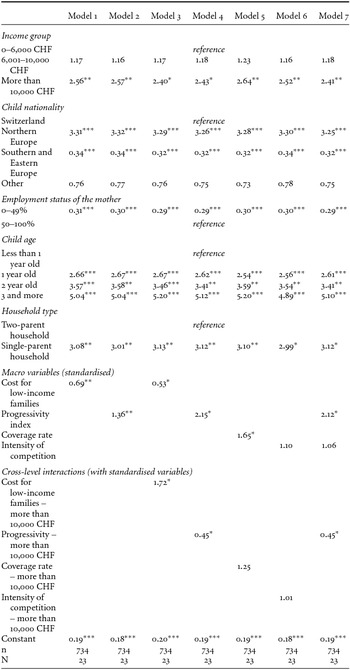
In Table 3, we present the main results of our analysis. Models 1 and 2 display the results of the random intercept analyses. As we can observe in both cases, the effect of income is significant when comparing high-income to low-income households. It shows the existence of an important access bias as high-income families are more than twice as likely to use childcare than low-income ones. The employment status of the mother is, as expected, a strong determinant in explaining access to childcare. Our first hypothesis, on the volume of work performed by the household, is thus unsurprisingly confirmed. More particularly, the threshold of 50 per cent appears decisive, as a more fine-grained differentiation does not affect the size of the coefficients, and creates categories with too few observations.
Individual and institutional determinants of childcare use

Notes: Significance levels: *p<0.05, **p<0.01, ***p<0.001
Residual diagnostics are available upon request.
With regard to the network level variables, the high cost of childcare for low-income families appears to reduce the overall chances of using childcare, whereas a more progressive fee structure significantly improves them. Indicators of the supply of places and intensity of competition among families were only introduced as cross-level interactions with the income variable as they obviously affect the general likelihood of the use of childcare.
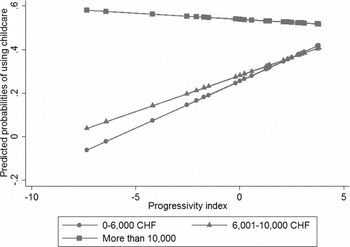
In Models 3–6, the random slope analyses are displayed and provide the empirical test of our second hypothesis with regard to the impact of the fee structure on the access bias for low-income families. As can be observed in Model 3, a one standard deviation increase in the cost of childcare for low-income families reduces, as expected, the chances for this group of families to use childcare by a factor of 1.89 (1/.53). For high-income families, as one would expect, the cost of childcare simulated for the low-income household type does not affect their decision (model not shown). With regard to the progressivity of the fee structure, the results are even stronger: the more progressive the fee structure of the network, the higher the chances for low-income families to use childcare, by a factor of 2.15. Here again, high-income families are not affected by the progressivity (model not shown). This is good news for policy-makers, because it seems that adopting more progressive fee structures for childcare will not hurt high-income families while it will improve access for low-income children. A graphical representation of this effect can be observed in Figure 5. From this graph, it is evident that high-income families remain unaffected by the progressivity of the fee structure. Since many networks in the canton of Vaud actually apply a regressive fee structure, low- and medium-income families are greatly harmed by the higher relative costs imposed upon them.
Progressivity index and use of childcare by income category

Let us now turn to our third hypothesis, on the impact of availability. Looking at the cross-level interactions in Model 5, Table 3, we see that the impact of the coverage rate is similar across income groups (since the cross-level interaction is not significant). The same observation can be made in the case of competition (Model 6). As a result, we can conclude that our data do not support our third hypothesis, i.e., that lack of availability and competition explain the exclusion of disadvantaged children from centre-based care.
We then test both the second and third hypotheses simultaneously to observe if, controlling for the availability of childcare places, the progressivity of the fee structure still explains inequality in access by income level. Since the coverage rate is almost equivalent to the proportion of individuals using childcare for more than eight hours a week in each network (r = 0.71), the inclusion of this macro-level variable explains almost all the variance in the dependent variable between networks, and might, as such, thus lead to an underestimation of the effect of the fee structure when both are included. Nevertheless, we re-ran the previous analysis in Model 6 including the coverage rate within each network. Despite a drop in significance (the interaction effects are still significant at the 10 per cent level) and slightly smaller coefficients, our conclusions remain unchanged (model not shown, available upon request). Because we are more confident in the reliability of our indicator of the intensity of competition, which also accounts for the demand side, we also re-ran the analysis in Model 6 adding the former to test both the second and third hypotheses simultaneously. As Model 7 indicates, regardless of the intensity of competition for childcare places, the progressivity still matters significantly in explaining the disadvantage experienced by low-income households. In other words, when controlling for the degree of availability of childcare in a given network, increasing the progressivity of the fee structure is likely to lead to a more equal access to childcare by income level.
Finally, we can turn to our fourth hypothesis, which assumes an impact of values that may be related to the country of origin. The nationality of the child seems to explain inequality of access in the canton of Vaud. In comparison to Swiss children, children whose nationality is of a North European country are more likely to be found in childcare, whereas the opposite is true for children originating from South and East European countries. Can this result be interpreted as evidence of the impact of cultural factors? On the one hand, many correlates of nationality are controlled for: income, employment status and, in models not shown, the education level of the parents (which turned out not to be a significant predictor of use once income is included in the model). On the other hand, our categorisation of nationalities is too imprecise to provide an opportunity to link predominant national family values to the observed behaviour. One important factor seems to be whether the grandparents live nearby, which is more likely in the case of Swiss children or for children who are nationals of a Southern European country. Migration from southern Europe dates from the 1960s and 1970s, which means families from these communities can more easily rely on the grandparents for informal care (see Bonoli and Vuille, Reference Bonoli and Vuille2013). Thus, on balance, the observed link between nationality and childcare use cannot be attributed to cultural differences on the basis of the evidence discussed in this paper.
Conclusion
As with virtually all the studies available on the social bias in access to childcare services, in this paper we have also found that the probability of being cared for in a centre-based childcare facility is considerably greater for children living in high-income households. The pro-high-income bias remains significant after controlling for the volume of parental employment, in particular maternal employment, and the nationality, which might reflect cultural values in the use of childcare.
What else explains this bias apart from the volume of parental employment? In this paper, we focused on two main hypotheses: the cost of the service for low-income families, and the general availability, and intensity, of competition for childcare places. On this basis, we can conclude that in the Swiss canton of Vaud, the cost of the service charged to low-income families is a key factor in restricting their access to centre-based childcare facilities. Children from low-income households are more likely to spend time in a childcare centre in the municipalities where they pay lower fees. The progressivity of the fee structure is also strongly related to the probability of having access to childcare centres for children from low-income families. More progressive fee structures are associated with higher participation by children from low-income families. Interestingly, high progressivity is not significantly related to lower use by higher income families. This suggests that a more progressive fee structure could rebalance the distribution of childcare participation, without penalising other income groups.
In our analysis, availability seems to be less important in determining access to childcare services for low-income families. It should be noted that availability is more difficult to measure than cost. In fact, availability depends on both supply and demand. As argued above, in the current context of shortage, supply and demand for childcare are strongly interrelated. In this paper, we have shown that a higher supply of childcare spaces is associated with higher levels of use (which is obvious) but not with a lower anti-poor bias. This suggests that increasing supply, in the current context of shortage, will probably increase demand, keeping competition for childcare places constant and resulting in the persistence of the social access bias. Our measure of the intensity of competition, which considers the length of the waiting list, turned out not to be significantly related to the access bias.
This result contradicts the findings of previous studies (Van Lancker and Ghysels, Reference Van Lancker and Ghysels2012), which, as seen above, found that the access bias to childcare services for low-income children is due to lack of availability and not cost. One reason for this difference may be that in the canton of Vaud there is more variation in cost of childcare services (which can vary substantially) than there is in availability, as can be seen in Table 2. Shortage of childcare places is very strong everywhere, and small differences in availability do not allow more low-income families to obtain a place, since these are taken up by other middle- to high-income families who are also experiencing shortage. In a way, our near-experiment is better suited to demonstrate the existence of a fee effect than an availability effect as the reason for the access bias. It could be the case that an increase to Swedish levels of the coverage rate will significantly reduce the access bias, but a network with such high coverage does not exist in the canton of Vaud, and so we could not test the availability hypothesis in the context of strong variation.
However, the importance of cost should not be dismissed. Given the near-experimental quality of our research design, we are very confident in the robustness of our results, and can conclude that large differences in the cost of childcare services are likely to impact on access in a significant manner. After all, as in so many other fields of public policy and life, money may be what matters when it comes to explaining access to childcare services.
Acknowledgments
This paper uses data which have been generously made available to us by StatVaud and by the Fondation pour l’accueil de jours des enfants, Vaud, Switzerland. An earlier version of this paper was presented at the XVIII ISA World Congress of Sociology, Yokohama, Japan, 13–19 July 2014. We are grateful for comments received by conference participants, and especially to Bea Cantillon, Ive Marx and Wim van Lancker. The paper was written under the auspices of the National centre of competence in research on the lifecourse and vulnerability (LIVES) at the University of Lausanne and greatly benefitted from exchanges with other members of LIVES, particularly Rafael Lalive and Daniel Oesch.
Appendix
Model-families’ characteristics