Cu6Sn5, an intermetallic compound (IMC), plays an important role in the solder/Cu systemReference Laurila, Vuorinen and Kivilahti1 and some other applications, such as lithium-ion batteries.Reference Tarascon and Armand2 Generally, the hexagonal η-Cu6Sn5 is the stable form during soldering. However, it would distort to monoclinic η8-Cu5Sn4 (P21/c) or η6-Cu5Sn4 (C2) due to the ordered occupancy of Cu in the trigonal bipyramidal sites during the superstructure ordering procedure, which is usually encountered in B8-type IMCs.Reference Larsson, Stenberg and Lidin3–Reference Lidin and Larsson5 When the temperature decreases below 186 °C, it is likely to transform to monoclinic η′-Cu6Sn5.Reference Gangulee, Das and Bever6, Reference Ghosh and Asta7 Synchrotron x-ray diffraction (XRD) studies confirmed that this transformation would occur after aging for a certain time at temperatures usually encountered by electronic devices in service.Reference Nogita, Gourlay and Nishimura8, Reference Schwingenschlögl, Paola, Nogita and Gourlay9 In thermal analysis procedure, a transitional reaction was observed, referred to as η8 or η6. It was also indicated that the kinetics was sluggish, and a first-order transformation was more suggestive.Reference Ghosh and Asta7 Importantly, the density changes with the structural evolutions. It may be catastrophic to the intrinsically brittle IMC as reported by Nogita et al. that more cracks were observed at the interface of Sn–Cu/Cu if no Ni was added to inhibit the transformation.Reference Larsson, Stenberg and Lidin4 So far, several studies have been conducted with the bulk, powder, or single crystal of Cu6Sn5.Reference Larsson, Stenberg and Lidin3–Reference Gangulee, Das and Bever6 Nevertheless, systematic characterizations of the formation of η′ at different temperatures have not been conducted. When solder joints are involved, the evolution behavior of the interfacial IMC is quite different from those of the bulk or powder Cu6Sn5 in many aspects, such as grain coarsening, defects, and stress conditions.Reference Laurila, Vuorinen and Kivilahti1 Therefore, investigations about the interfacial η′-Cu6Sn5 are critical to better understanding the reliability issues of soldering.
Laboratory XRD is preferred here in the examination of crystal structure because it can provide overall statistic information of a sample and the peak intensities offer us a macroscopic measurement about the “amount” of the microscopic changes. It is more convenient to operate many samples compared with other methods. The time-temperature-formation curve was fitted from the occurrence of η′-Cu6Sn5 characteristic peaks.
In the present experiments, Sn-0.7Cu solder was selected with the consideration of industrial applications and avoidance of possible influences resulted from other elements (e.g., Ag). The joints were fabricated from dip soldering with polycrystalline Cu foil. The dimensions were ∼0.1 × 12 × 12 mm3. The foil was polished and deoxidized with a 5 vol%HCl solution. After the coating with rosin mildly activated flux, the soldering was conducted at 250 °C (±2 °C) with the duration of 60 s in a solder bath of ∼200 g. Followed by air cooling, isothermal aging was conducted in the temperature range from 105 to 180 °C. The lower temperatures of 105 and 120 °C were obtained in oil bath with an accuracy of ±0.8 °C. The others were conducted in SHIMADZU thermostatic chamber (SHIMADZU, Kyoto, Japan). The accuracy was ±1 °C within a diameter of 30 mm and a distance of 100 mm upward and downward from the thermocouple. In this study, the volumes of samples were quite small and they were placed clinging to the thermocouple, so the temperature could be estimated with tiny variations. The time durations of aging varied from 1 h to 10 days. For the as-soldered samples, scanning electron microscope and image analyzer were used to determine the thickness and grain size of interfacial IMCs. A solution of 5 vol%HNO3–2 vol%HCl–93 vol%CH3OH was applied to reveal the cross-sectional microstructure. Ultrasonic cleaning in a 5 vol%HNO3 solution was performed to emerge the top morphology of IMCs. The crystal structure of interfacial Cu6Sn5 was investigated by SHIMADZU XRD-6000 (Cu Kα radiation, 0.154056 nm). Low scanning speed (1°/min) and small sampling pitch were selected. The operating voltage and current were 40 kV and 30.0 mA, respectively.
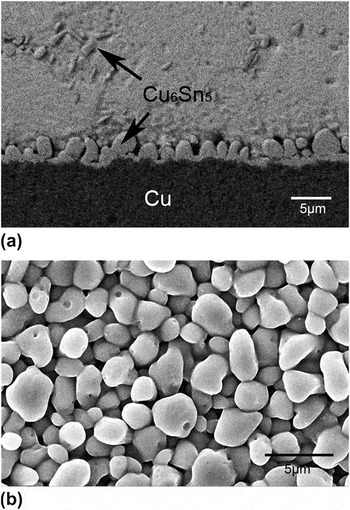
The microstructure characteristics of as-soldered Sn–0.7Cu/Cu are shown in Fig. 1. A continuous Cu6Sn5 layer formed at the solder/Cu interface. The grains presented as tiny and smooth scallops, as shown in Fig. 1(b). The thickness and grain diameter were both measured to be ∼2 μm.
Microstructure of interfacial Cu6Sn5 in Sn–0.7Cu/Cu joint: (a) cross section in backscattered electron mode and (b) top morphology in secondary electron mode.

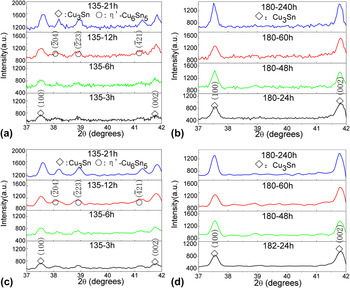
On the basis of the Cu6Sn5 models proposed by Lidin and Larsson,Reference Lidin and Larsson5 the XRD spectra of η and η′ were calculated. Simultaneously, careful comparisons with the existing spectra of η [Joint Committee on Powder Diffraction Standards (JCPDS 47-1575)], η′ (JCPDS 65-2303), and those with a wide scan range in our experiments were conducted. It was confirmed that the unique peaks of η′ phase were mainly located in 30–45°. Figure 2 shows the XRD patterns of interfacial Cu6Sn5 after aging at 135 and 180 °C as typical examples to illustrate the phase evolutions. Some information of Cu3Sn was also explored. For η′-Cu6Sn5, peaks  ,
 , and
 were detected in the samples with a longer aging time at 135 °C. Those with a shorter time, however, became obscure to distinguish from the background noise, as shown in Fig. 2(a). This means that the formation of η′ was a slow procedure. For those at 180 °C in Fig. 2(b), no information of η′-Cu6Sn5 was detected, which may be attributed to the smaller driving force. Although the spectra here were best fit for η′ phase, one possible query is that whether there was some information of η8 or η6. The published differential scanning calorimetry (DSC) results implied η8 and η6 might be transitional phases, but not the final state of the transformation.Reference Ghosh and Asta7 The synchrotron XRD results of Nogita et al.Reference Nogita, Gourlay and Nishimura8 and Schwingenschlögl et al.Reference Schwingenschlögl, Paola, Nogita and Gourlay9 also demonstrated that only η and η′ were discovered after aging, but not η8 or η6. These all indicated that the results here were trustworthy.
X-ray diffraction (XRD) patterns of interfacial Cu6Sn5 after aging at (a) 135 °C and (b) 180 °C for different times; (c) and (d) are the smoothing results of (a) and (b), respectively.

To calculate the peak intensities and thus qualify the formation time of η′-Cu6Sn5 quasi-quantitatively, curve smoothing was performed to reduce the background noise. The Savitzky–GolayReference Savitzky and Golay10 smoothing filter was used during this procedure. One remarkable advantage is that features of the distribution, such as relative maxima, minima, and width, are preserved. The points of window were nine, and the polynomial order was two. No boundary condition was selected. The smoothing patterns are presented in Figs. 2(c) and 2(d). The peaks discussed earlier become more distinguishable. The peaks of η′-Cu6Sn5,  ,
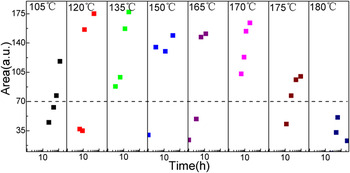
 , and
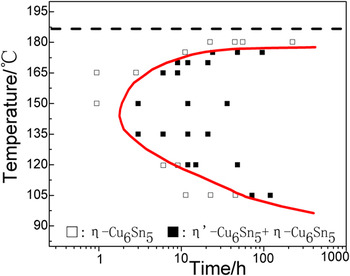
 , were integrated and then the areas were added up. The evolution of intensities (peak areas) with aging time and temperature is illustrated in Fig. 3. The areas grew with the increase of aging time at respective temperature. For the same aging time, relatively high values were found in the medium temperatures. For example, the values of 135 °C and those aged longer than 12 h at 175 °C are higher than 70 (in arbitrary units). However, in the case of higher temperature, e.g., 180 °C, or aging with a shorter time at 175 °C, the intensity values are lower than 70 and there are no obvious characteristic peaks (see Fig. 2). Similar phenomenon can be observed in the other temperatures. To establish a standard for the formation of η′-Cu6Sn5, intensity value of 70 (in arbitrary units) was thus regarded as a critical value with a consideration of the distribution of the peak areas. If the value was higher than 70, it was supposed that η′ formed. According to this standard, the formation times of η′-Cu6Sn5 at different aging temperatures were obtained and summarized in Fig. 4. The solid squares represent the mixture of η and η′ and the hollow squares, η phase. The boundary of two regions was fitted as a curve, which illustrated the formation of interfacial η′-Cu6Sn5 in Sn–0.7Cu/Cu joints. It is noted that the critical area value may be better interpreted as “critical data stripe.” A deviation of several units from 70 has slight influence on the incubation times and the shape of the curve.
Evolution of intensities (peak areas) of η′-Cu6Sn5 characteristic peaks  ,
 , and
 with aging time and temperature. (The horizontal dotted line indicates the critical value of peak area.)

Time-temperature-formation curve of interfacial η′-Cu6Sn5 summarized from XRD results.

It is of great importance of temperature in the formation time of η′-Cu6Sn5. As the temperature ascended from 105 to 150 °C, the time was obviously shortened from ∼72 to 3h. When it continued to go up, the formation was gradually inhibited. At 180 °C, no η′-Cu6Sn5 was detected even after aging for 10 days. A minimum formation time was observed in the temperature range of 135–150 °C. Generally, the time-temperature-transformation (TTT) diagram of diffusional isothermal phase transformation presented as classical C-curve, which can be described by the general form of Johnson–Mehl–Avrami equation.Reference Christian11 It is determined by the balance of the diffusion of atoms and the driving force for nucleation and growth. However, it might be inappropriate to identify the time-temperature-formation curve with that in bulk samples. After isothermal aging, the origin of interfacial η′-Cu6Sn5 may form directly from “phase transformation” of existing η phase or from “interfacial reaction” at temperatures below 186 °C. During the phase transformation procedure, although the composition of Cu–Sn compound varied a little with the possible transitional reactions,Reference Ghosh and Asta7 the nucleation and growth of η′ still relied on the atomic short-range diffusion between the phase boundary of η and η′. Therefore, it is a diffusional phase transformation which can be described by the classical C-curve (C1).Reference Christian11 Tremendous results have demonstrated that diffusion-controlled mechanism prevails in the solid state “interfacial reaction.”Reference Laurila, Vuorinen and Kivilahti1 At the same time, the nucleation and growth velocity of η′ phase is limited by the driving force of the reaction. So the contribution of interfacial reaction to the formation of η′ phase also shows a “C” curve (C2) relationship with the experimental temperature. It is a pity that we are uncertain about the respective features of C1 and C2. Which mechanism is dominant, “phase transformation” from existing η or “interfacial reaction” at lower temperatures, or both, is really a pending question. The time-temperature-formation curve of interfacial η′-Cu6Sn5 could not be simply treated as a classical TTT diagram. This is exactly the complexity of interfacial conditions compared with the bulk samples.
However, this study pays more attention to the possible effects resulted from the formation of interfacial η′-Cu6Sn5, but not the formation itself. Temperature ∼100–200 °C and time up to hundreds or thousands of hours were often selected in the study of Cu–Sn growth kinetics. Cu6Sn5 was generally regarded as a single phase. In fact, according to Fig. 4, the reported results were mainly the behaviors of the mixture of η and η′. Stress would accumulate at the interface during the formation of η′-Cu6Sn5. With respect to solder interconnects, it might influence the growth and deformation behaviors of IMCs. Until now, the effects of η′ formation have not been verified. Delicate experimental design is not available. Therefore, the obtained curve can provide strong supports for future analysis and design.
With laboratory XRD, the specimen is simple to prepare and the examination is convenient to perform. While for DSC, it is not easy to detect the transformation due to the small quality of thin IMC layer and additional heating/cooling procedure might affect the incubation time. Provided that there is a slight difference between the result of this investigation and that of synchrotron XRD, the time-temperature-formation curve would shift leftward a little. The main trends with temperature are still maintained. This shift has no notable influence on the reliability evolution in long-term service. Consequently, it is supposed that laboratory XRD is feasible to characterize the formation of interfacial η′-Cu6Sn5 in solder joints.
The time-temperature-formation curve of interfacial η′-Cu6Sn5 in Sn–0.7Cu/Cu solder joints was fitted from the occurrence of characteristic peaks. Minimum formation time was observed in the temperature range of 135–150 °C.
ACKNOWLEDGMENT
The authors thank Prof. J.S. Zhang, Y.N. Wang, F. Ye, and Dr. L.J. Luo for their warm and sincere help.