1 Introduction
Eulerian models for gas–particle flows require as input a constitutive model for the particle phase stress. A great deal of work has been done in the literature on the development of constitutive models by adapting the kinetic theory of dense gases to particulate flows. The earliest and most widely used kinetic-theory models have been derived for flows of inelastic, smooth, frictionless spheres with no effects from interstitial fluid (Jenkins & Savage Reference Jenkins and Savage1983; Lun et al. Reference Lun, Savage, Jeffrey and Chepurniy1984; Jenkins & Richman Reference Jenkins and Richman1985b ; Gidaspow Reference Gidaspow1994; Garzó & Dufty Reference Garzó and Dufty1999). They have been extended or modified to account for particle roughness (Lun Reference Lun1991; Kumaran Reference Kumaran2006; Chialvo & Sundaresan Reference Chialvo and Sundaresan2013; Yang, Padding & Kuipers Reference Yang, Padding and Kuipers2016), dense regime (Chialvo & Sundaresan Reference Chialvo and Sundaresan2013; Berzi & Vescovi Reference Berzi and Vescovi2015), decomposition of particle fluctuations into correlated and uncorrelated parts (Février, Simonin & Squires Reference Février, Simonin and Squires2005; Fox Reference Fox2014), role of the interstitial fluid (Koch Reference Koch1990; Gidaspow Reference Gidaspow1994; Balzer, Boëlle & Simonin Reference Balzer, Boëlle and Simonin1995; Boëlle, Balzer & Simonin Reference Boëlle, Balzer and Simonin1995; Ma & Kato Reference Ma and Kato1998; Koch & Sangani Reference Koch and Sangani1999; Lun & Savage Reference Lun, Savage, Pöschel and Brilliantov2003; Garzó et al. Reference Garzó, Tenneti, Subramaniam and Hrenya2012) and cohesion (Gidaspow & Huilin Reference Gidaspow and Huilin1998; Kim & Arastoopour Reference Kim and Arastoopour2002; Ye, Van Der Hoef & Kuipers Reference Ye, Van Der Hoef and Kuipers2005; Van Wachem & Sasic Reference Van Wachem and Sasic2008; Takada, Saitoh & Hayakawa Reference Takada, Saitoh and Hayakawa2016; Kellogg et al. Reference Kellogg, Liu, LaMarche and Hrenya2017).
An alternative way to simulate granular flows is through the discrete element method (DEM) (Cundall & Strack Reference Cundall and Strack1979). Its strength lies in its flexibility to directly include the particle size distribution (Rognon et al. Reference Rognon, Roux, Naaïm and Chevoir2007; Tripathi & Khakhar Reference Tripathi and Khakhar2011; Gu, Ozel & Sundaresan Reference Gu, Ozel and Sundaresan2016c ), complex particle–particle interactions including van der Waals forces (Rognon et al. Reference Rognon, Roux, Naaïm and Chevoir2008; Gu, Chialvo & Sundaresan Reference Gu, Chialvo and Sundaresan2014), electrostatic forces (Kolehmainen et al. Reference Kolehmainen, Ozel, Boyce and Sundaresan2016), capillary forces (Forsyth, Hutton & Rhodes Reference Forsyth, Hutton and Rhodes2002), liquid bridges (Boyce et al. Reference Boyce, Ozel, Kolehmainen and Sundaresan2017), solid bridges (Kuwagi, Mikami & Horio Reference Kuwagi, Mikami and Horio2000) or a combination thereof (Gu, Ozel & Sundaresan Reference Gu, Ozel and Sundaresan2016b ). However, such a method becomes impractical for a large number of particles, and consequently there have been efforts to deduce continuum rheological models based on DEM simulations (Campbell Reference Campbell2002; MiDi Reference MiDi2004; da Cruz et al. Reference da Cruz, Emam, Prochnow, Roux and Chevoir2005; Jop, Forterre & Pouliquen Reference Jop, Forterre and Pouliquen2006; Olsson & Teitel Reference Olsson and Teitel2007; Rognon et al. Reference Rognon, Roux, Naaïm and Chevoir2008; Otsuki & Hayakawa Reference Otsuki and Hayakawa2009; Sun & Sundaresan Reference Sun and Sundaresan2011; Gu et al. Reference Gu, Chialvo and Sundaresan2014, Reference Gu, Ozel and Sundaresan2016c ). Most of these simulations used to deduce models are based on particle-only DEM simulations where particles are sheared or flow down a slope. The deficiencies of these resultant models when applied to fluid–solid flows are threefold. First, the effects of the interstitial fluid are not accounted for in these DEM simulations. Second, these simulations are mostly one-dimensional in nature, and thus the effects of dilation and compaction of the particle phase are not probed adequately. Third, it has been reported in several studies (Gu et al. Reference Gu, Chialvo and Sundaresan2014; Takada, Saitoh & Hayakawa Reference Takada, Saitoh and Hayakawa2014; Saitoh, Takada & Hayakawa Reference Saitoh, Takada and Hayakawa2015) that local complex flow structures would form when cohesive forces are included in these simulations, whose effects are not fully captured by these nearly one-dimensional flows.
These deficiencies can be addressed through Eulerian–Lagrangian simulations, where the local-average equations of the fluid phase are solved using Eulerian grids and the motion of the particles is followed through DEM (an approach commonly referred to as CFD (computational fluid dynamics)-DEM in the literature). Indeed, CFD-DEM simulations have been used to deduce models for systems such as dilute gas–solid turbulent flows (Capecelatro, Desjardins & Fox Reference Capecelatro, Desjardins and Fox2014, Reference Capecelatro, Desjardins and Fox2015, Reference Capecelatro, Desjardins and Fox2016a ,Reference Capecelatro, Desjardins and Fox b ) and granular flows in bedload transport (Maurin, Chauchat & Frey Reference Maurin, Chauchat and Frey2016).
In this paper, we seek to deduce a rheological model for granular materials in fluidized suspensions from CFD-DEM simulations. First, we consider the case of non-cohesive particles fluidized by gas (§ 3.1), and demonstrate that the approach yields models that are consistent with the analytically derived kinetic theory models, which indicates the validity of the methodology. We also show intriguing results that were previously not observed through traditional methods, such as the dependency of bulk viscosity on the state of dilation or compaction and the gravity dependence of stress. Then, we demonstrate that this methodology can be used to cases where complex inter-particle interaction is important (§ 3.2). We use the van der Waals force as an example, which is known to affect flow behaviours of Geldart Group A particles (Geldart Reference Geldart1973) that are frequently encountered in industry. We show that this approach yields results that are consistent with previous studies of cohesive particles (Rognon et al. Reference Rognon, Roux, Naaïm and Chevoir2008; Gu et al. Reference Gu, Chialvo and Sundaresan2014; Irani, Chaudhuri & Heussinger Reference Irani, Chaudhuri and Heussinger2014), thus further corroborating the methodology. Different from these studies, the present methodology is able to probe a wider parameter space. We then propose an adaptation of the kinetic-theory-based model for granular flows in the presence of van der Waals interaction between particles. This methodology can be readily applied to systems where other complex inter-particle interactions are present.
2 Mathematical modelling and flow configurations
2.1 Mathematical modelling
For fluidization simulations through CFD-DEM, the gas phase equations are solved using an OpenFOAM-based computational fluid dynamics solver (OpenCFD 2013), while the particle phase DEM equations are evolved via the LIGGGHTS platform (Kloss et al. Reference Kloss, Goniva, Hager, Amberger and Pirker2012). The two phases are coupled via CFDEMcoupling (Zhou et al. Reference Zhou, Kuang, Chu and Yu2010; Goniva et al. Reference Goniva, Kloss, Deen, Kuipers and Pirker2012; Kloss et al. Reference Kloss, Goniva, Hager, Amberger and Pirker2012).
In DEM (Cundall & Strack Reference Cundall and Strack1979), particles are tracked by solving Newton’s equations of motion:
 $$\begin{eqnarray}\displaystyle & \displaystyle m_{i}\frac{\text{d}\boldsymbol{v}_{i}}{\text{d}t}=\mathop{\sum }_{j}(\boldsymbol{f}_{c,ij}^{n}+\boldsymbol{f}_{c,ij}^{t})+\mathop{\sum }_{k}\boldsymbol{f}_{v,ik}+\boldsymbol{f}_{g\rightarrow p,i}+m_{i}\boldsymbol{g}, & \displaystyle\end{eqnarray}$$
 $$\begin{eqnarray}\displaystyle & \displaystyle I_{i}\frac{\text{d}\unicode[STIX]{x1D74E}_{i}}{\text{d}t}=\mathop{\sum }_{j}\boldsymbol{T}_{t,ij}. & \displaystyle\end{eqnarray}$$
In the equations, particle
 $i$
has mass
 $m_{i}$
, moment of inertia
 $I_{i}$
, translational and rotational velocities
 $\boldsymbol{v}_{i}$
and
 $\unicode[STIX]{x1D74E}_{i}$
. There are several forces acting on the particle
 $i$
.
 $\boldsymbol{f}_{c,ij}^{n}$
and
 $\boldsymbol{f}_{c,ij}^{t}$
are the normal and tangential contact forces from the collision of two particles
 $i$
and
 $j$
.
 $\boldsymbol{f}_{v,ik}$
is the van der Waals force from the interactions between two particles
 $i$
and
 $k$
.
 $\boldsymbol{f}_{g\rightarrow p,i}$
is the total interaction force on the particle
 $i$
due to surrounding gas (explained further below).
 $m_{i}\boldsymbol{g}$
is the gravitational force. The torque acting on particle
 $i$
due to particle
 $j$
is
 $\boldsymbol{T}_{t,ij}$
, which results from the tangential force and is equal to
 $\boldsymbol{R}_{ij}\times \boldsymbol{f}_{c,ij}^{t}$
.
 $\boldsymbol{R}_{ij}$
is the vector from the centre of particle
 $i$
to the contact point. Rolling friction is not accounted for in the present simulations.
The particle contact forces
 $\boldsymbol{f}_{c,ij}^{n}$
and
 $\boldsymbol{f}_{c,ij}^{t}$
are calculated using a Hertzian contact model as shown below (Johnson Reference Johnson1987; Renzo & Maio Reference Renzo and Maio2004):
 $$\begin{eqnarray}\displaystyle & \displaystyle \boldsymbol{f}_{c,ij}^{n}={\textstyle \frac{4}{3}}Y^{\ast }\sqrt{r^{\ast }}\unicode[STIX]{x1D6FF}_{n}^{3/2}\boldsymbol{n}_{ij}+2\sqrt{{\textstyle \frac{5}{6}}}\unicode[STIX]{x1D6FD}\sqrt{S_{n}m^{\ast }}\boldsymbol{v}_{ij}^{n}, & \displaystyle\end{eqnarray}$$
 $$\begin{eqnarray}\displaystyle & \displaystyle \boldsymbol{f}_{c,ij}^{t}=\left\{\begin{array}{@{}ll@{}}\displaystyle -8G^{\ast }\sqrt{r^{\ast }\unicode[STIX]{x1D6FF}_{n}}\boldsymbol{t}_{ij}+2\sqrt{{\textstyle \frac{5}{6}}}\unicode[STIX]{x1D6FD}\sqrt{S_{t}m^{\ast }}\boldsymbol{v}_{ij}^{t}\quad & \text{for }|\,\boldsymbol{f}_{c,ij}^{t}|<\unicode[STIX]{x1D707}_{p}|\boldsymbol{f}_{c,ij}^{n}|\\ \displaystyle -\unicode[STIX]{x1D707}_{p}|\boldsymbol{f}_{c,ij}^{n}|\frac{\boldsymbol{t}_{ij}}{|\boldsymbol{t}_{ij}|}\quad & \text{for }|\boldsymbol{f}_{c,ij}^{t}|\geqslant \unicode[STIX]{x1D707}_{p}|\boldsymbol{f}_{c,ij}^{n}|,\end{array}\right. & \displaystyle\end{eqnarray}$$
where
 $$\begin{eqnarray}\displaystyle \frac{1}{Y^{\ast }}=\frac{1-\unicode[STIX]{x1D708}_{i}^{2}}{Y_{i}}+\frac{1-\unicode[STIX]{x1D708}_{j}^{2}}{Y_{j}},\quad \frac{1}{r^{\ast }}=\frac{1}{r_{i}}+\frac{1}{r_{j}}, & & \displaystyle\end{eqnarray}$$
 $$\begin{eqnarray}\displaystyle \unicode[STIX]{x1D6FD}=\frac{\ln (e_{p})}{\sqrt{\ln ^{2}(e_{p})+\unicode[STIX]{x03C0}^{2}}},\quad S_{n}=2Y^{\ast }\sqrt{r^{\ast }\unicode[STIX]{x1D6FF}_{n}}, & & \displaystyle\end{eqnarray}$$
 $$\begin{eqnarray}\displaystyle \frac{1}{G^{\ast }}=\frac{2(2+\unicode[STIX]{x1D708}_{i})(1-\unicode[STIX]{x1D708}_{i})}{Y_{i}}+\frac{2(2+\unicode[STIX]{x1D708}_{j})(1-\unicode[STIX]{x1D708}_{j})}{Y_{j}},\quad S_{t}=8G^{\ast }\sqrt{r^{\ast }\unicode[STIX]{x1D6FF}_{n}}. & & \displaystyle\end{eqnarray}$$
The subscripts
 $i$
,
 $j$
denote spherical particle
 $i$
or
 $j$
, and the superscript
 $\ast$
denotes the effective particle property of those two particles. The effective particle mass
 $m^{\ast }$
is calculated as
 $m^{\ast }=m_{i}m_{j}/(m_{i}+m_{j})$
;
 $\unicode[STIX]{x1D6FF}_{n}$
is the normal overlap distance;
 $\boldsymbol{n}_{ij}$
represents the unit normal vector pointing from particle
 $j$
to particle
 $i$
;
 $\boldsymbol{v}_{ij}^{n}$
represents the normal velocity of particle
 $j$
relative to particle
 $i$
;
 $\boldsymbol{t}_{ij}$
represents the tangential displacement obtained from the integration of the relative tangential velocity during the contact,
 $\boldsymbol{v}_{ij}^{t}$
; and
 $\unicode[STIX]{x1D707}_{p}$
is the particle sliding friction coefficient. Here,
 $Y$
is Young’s modulus,
 $G$
is the shear modulus,
 $\unicode[STIX]{x1D708}$
is Poisson’s ratio and
 $r$
is the particle radius.
The van der Waals force
 $\boldsymbol{f}_{v,ik}$
between particles
 $i$
an
 $k$
is modelled as,
 $$\begin{eqnarray}\displaystyle \boldsymbol{f}_{v,ik}=-f_{v,ik}\boldsymbol{n}_{ik}=\left\{\begin{array}{@{}ll@{}}-F_{vdw}(A,s)\boldsymbol{n}_{ik}\quad & \text{for }s_{min}<s<s_{max},\\ -F_{vdw}(A,s_{min})\boldsymbol{n}_{ik}\quad & \text{for }s\leqslant s_{min}.\end{array}\right. & & \displaystyle\end{eqnarray}$$
Here,
 $F_{vdw}$
is the magnitude of the van der Waals force given by
 $$\begin{eqnarray}\displaystyle F_{vdw}(A,s)=\frac{A}{3}\frac{2r_{i}r_{k}(r_{i}+r_{k}+s)}{s^{2}(2r_{i}+2r_{k}+s)^{2}}\left[\frac{s(2r_{i}+2r_{k}+s)}{(r_{i}+r_{k}+s)^{2}-(r_{i}-r_{k})^{2}}-1\right]^{2}, & & \displaystyle\end{eqnarray}$$
where
 $A$
is the Hamaker constant (Hamaker Reference Hamaker1937) which depends on the material properties (Israelachvili Reference Israelachvili2010), and
 $s$
is the distance between the particle surfaces. It is assumed that the force saturates at a minimum separation distance,
 $s_{min}$
, which corresponds to typical inter-molecular spacing (Yang, Zou & Yu Reference Yang, Zou and Yu2000). This constant maximum force is also applied when the particles are in contact. As the magnitude of the van der Waals force decreases rapidly as the distance between the surfaces increases, a maximum cutoff distance
 $s_{max}=(r_{i}+r_{k})/4$
(Aarons & Sundaresan Reference Aarons and Sundaresan2006) is employed to speed up the simulation. For
 $s>s_{max}$
, the van der Waals force is not accounted for.
To accelerate the computations, simulations typically employ a soft Young’s modulus (
 $Y^{S}$
) that is much smaller than the real value (
 $Y^{R}$
). The superscript
 $S$
denotes that the parameter corresponds to the case where a soft Young’s modulus is used, and the superscript
 $R$
denotes that the parameters correspond to real particle properties. However, as shown previously (Moreno-Atanasio, Xu & Ghadiri Reference Moreno-Atanasio, Xu and Ghadiri2007; Kobayashi et al.
Reference Kobayashi, Tanaka, Shimada and Kawaguchi2013; Gu, Ozel & Sundaresan Reference Gu, Ozel and Sundaresan2016a
; Liu et al.
Reference Liu, LaMarche, Kellogg and Hrenya2016; Wilson, Dini & van Wachem Reference Wilson, Dini and van Wachem2016; Murphy & Subramaniam Reference Murphy and Subramaniam2017), this cohesion model (2.8) would yield simulation results that are dependent on the Young’s modulus of the particle. Thus, the cohesion model must be modified if one wishes to soften the particles without significantly affecting the simulation results. A modified cohesion model has been developed (Gu et al.
Reference Gu, Ozel and Sundaresan2016a
) based on conserving the cohesive energy to produce results that are insensitive to Young’s modulus. This modified cohesion model, shown below, is used in the simulations:
 $$\begin{eqnarray}\displaystyle \boldsymbol{f}_{v,ik}^{M}=-f_{v,ik}^{M}\boldsymbol{n}_{ik}=\left\{\begin{array}{@{}ll@{}}-F_{vdw}(A^{R},s-s_{o})\boldsymbol{n}_{ik}\quad & \text{for }s_{min}^{S}<s<s_{max}\equiv (r_{i}+r_{k})/4\\ -F_{vdw}(A^{S},s_{min}^{R})\boldsymbol{n}_{ik}\quad & \text{for }s\leqslant s_{min}^{S}.\end{array}\right. & & \displaystyle\end{eqnarray}$$
Here,
 $A^{S}=A^{R}\unicode[STIX]{x1D703}$
, where
 $\unicode[STIX]{x1D703}$
is
 $(Y^{S}/Y^{R})^{2/5}$
;
 $s_{min}^{S}$
is the minimum separation distance for soft Young’s modulus and
 $s_{o}$
is an additional model parameter. They can be found by solving the following equations:
 $$\begin{eqnarray}\displaystyle & \displaystyle F_{vdw}(\unicode[STIX]{x1D703},s_{min}^{R})=F_{vdw}(1,s_{min}^{S}-s_{o}), & \displaystyle\end{eqnarray}$$
 $$\begin{eqnarray}\displaystyle & \displaystyle F_{vdw}(1,s_{min}^{R})s_{min}^{R}+\int _{s_{min}^{R}}^{s_{max}}F_{vdw}(1,s)\,\text{d}s=f_{v,ik}(\unicode[STIX]{x1D703},s_{min}^{R})s_{min}^{S}+\int _{s_{min}^{S}}^{s_{max}}F_{vdw}(1,s-s_{o})\,\text{d}s. & \displaystyle \nonumber\\ \displaystyle & & \displaystyle\end{eqnarray}$$
It should be noted that the applicability of this modified cohesion model (Gu et al. Reference Gu, Ozel and Sundaresan2016a ) is restricted to weakly cohesive Geldart Group A particles (Geldart Reference Geldart1973). Strongly cohesive Geldart Group C particles tend to form large agglomerates and are difficult to suspend via fluidization. As shown by Gu et al. (Reference Gu, Ozel and Sundaresan2016a ), the modified cohesion model captures the bed dynamics satisfactorily in the case of Group A particles, but not the Group C particles. In the present study we focus only on Group A particles.
The fluid phase is modelled by solving the following conservation of mass and momentum equations in terms of the locally averaged variables:
 $$\begin{eqnarray}\displaystyle & \displaystyle \frac{\unicode[STIX]{x2202}}{\unicode[STIX]{x2202}t}(1-\unicode[STIX]{x1D719})+\unicode[STIX]{x1D735}\boldsymbol{\cdot }[(1-\unicode[STIX]{x1D719})\boldsymbol{u}_{g}]=0, & \displaystyle\end{eqnarray}$$
 $$\begin{eqnarray}\displaystyle & \displaystyle \unicode[STIX]{x1D70C}_{g}(1-\unicode[STIX]{x1D719})\left(\frac{\unicode[STIX]{x2202}\boldsymbol{u}_{g}}{\unicode[STIX]{x2202}t}+\boldsymbol{u}_{g}\boldsymbol{\cdot }\unicode[STIX]{x1D735}\boldsymbol{u}_{g}\right)=-\unicode[STIX]{x1D735}p_{g}+\unicode[STIX]{x1D735}\boldsymbol{\cdot }\unicode[STIX]{x1D749}_{g}+\unicode[STIX]{x1D731}_{d}+\unicode[STIX]{x1D70C}_{g}(1-\unicode[STIX]{x1D719})\boldsymbol{g}. & \displaystyle\end{eqnarray}$$
Here,
 $\unicode[STIX]{x1D70C}_{g}$
is the density of the gas which is assumed to be constant,
 $\unicode[STIX]{x1D719}$
is the particle volume fraction,
 $\boldsymbol{u}_{g}$
is the gas velocity,
 $p_{g}$
is the gas phase pressure,
 $\unicode[STIX]{x1D749}_{g}$
is the gas phase deviatoric stress tensor. The total gas–particle interaction force per unit volume of the mixture
 $-\unicode[STIX]{x1D731}_{d}$
, exerted on the particles by the gas, is composed of a generalized buoyancy force due to the slowly varying (in space) local-average gas phase stress
 $(-p_{g}\unicode[STIX]{x1D644}+\unicode[STIX]{x1D749}_{g})$
and the force due to the rapidly varying flow (in space) field around the particles.
In finite-volume-method-based computations employed in our simulations,
 $\unicode[STIX]{x1D731}_{d}$
in any computational cell is related to
 $\boldsymbol{f}_{g\rightarrow p,i}$
of all the particles in that cell as
 $\unicode[STIX]{x1D731}_{d}=-\sum _{i\in cell}\boldsymbol{f}_{g\rightarrow p,i}/V_{c}$
where
 $V_{c}$
is the volume of the computational cell. On a per particle basis, the total interaction force on the particle by the gas can be written as
 $\boldsymbol{f}_{g\rightarrow p,i}=-V_{p,i}\unicode[STIX]{x1D735}p_{g}|_{\boldsymbol{x}=\boldsymbol{x}_{p,i}}+V_{p,i}\unicode[STIX]{x1D735}\boldsymbol{\cdot }\unicode[STIX]{x1D749}_{g}|_{\boldsymbol{x}=\boldsymbol{x}_{p,i}}+\boldsymbol{f}_{d,i}$
, where
 $V_{p,i}$
is the particle volume and
 $\boldsymbol{f}_{d,i}$
is the drag force calculated by the Wen & Yu (Reference Wen and Yu1966) drag law. As discussed in appendix B, particle phase stress extracted from the simulations is not sensitive to the drag law used in the simulations. Here,
 $|_{\boldsymbol{x}=\boldsymbol{x}_{p,i}}$
denotes that the Eulerian variable is interpolated to the location of particle
 $i$
. The gas phase deviatoric stress tensor contribution is relatively insignificant in
 $\boldsymbol{f}_{g\rightarrow p,i}$
for modelling gas-fluidized beds of particles (Agrawal et al.
Reference Agrawal, Loezos, Syamlal and Sundaresan2001) and is hence ignored.
2.2 Flow configurations
We perform simulations in periodic domains in which one can examine the flow dynamics without wall-induced restrictions. To drive the flow in this periodic domain, we decompose the pressure term
 $p_{g}$
in equation (2.14) into two components as follows:
 $p_{g}(\boldsymbol{x},t)=p_{g}^{\prime \prime }(\boldsymbol{x},t)-\bar{\unicode[STIX]{x1D70C}}|\boldsymbol{g}|(z-z_{o})$
. Here,
 $p_{g}^{\prime \prime }$
is the computed gas pressure that obeys the periodic boundary condition and
 $\bar{\unicode[STIX]{x1D70C}}|\boldsymbol{g}|(z-z_{o})$
represents the mean vertical pressure drop due to the total mass of a two-phase mixture;
 $\bar{\unicode[STIX]{x1D70C}}$
is the domain-averaged mixture density;
 $z$
is the coordinate in the direction that is opposite of gravity and
 $z_{o}$
is a reference elevation.
Although we will present our results in dimensionless form, it is useful to present typical dimensional quantities to demonstrate that the simulations have been done for gas–particle systems of practical interest. With this in mind, in table 1, we present the simulation parameters in both dimensional and dimensionless form. Simulations were performed for two domain-averaged particle volume fractions
 $\langle \unicode[STIX]{x1D719}\rangle =$
 $0.1$
and
 $0.3$
with different values of particle diameter and acceleration due to gravity (which was lowered to help probe relevant dimensionless groups). The simulations were run for a sufficiently long duration (
 $10\unicode[STIX]{x1D70F}_{p}^{St}$
) to ensure that a statistical steady state is reached (see table 1 for the definition of
 $\unicode[STIX]{x1D70F}_{p}^{St}$
). Subsequently, snapshots were collected at every
 $\unicode[STIX]{x1D70F}_{p}^{St}$
time instant for a duration of
 $20\unicode[STIX]{x1D70F}_{p}^{St}$
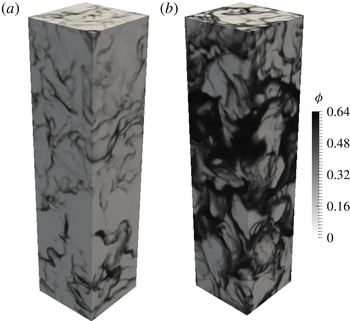
. Snapshots of the particle volume fraction fields obtained in simulations with different domain-averaged particle volume fractions for non-cohesive particles with
 $Fr_{p}=65$
are shown in figure 1. The computational data from these snapshots were then post-processed to compute the particle phase stress
 $\unicode[STIX]{x1D748}$
and granular temperature
 $T$
for each cell with a volume of
 $V_{c}$
:
 $$\begin{eqnarray}\displaystyle \unicode[STIX]{x1D748}=\frac{1}{V_{c}}\mathop{\sum }_{i\in cell}\left[\mathop{\sum }_{j\in cell,(j\neq i)}\frac{1}{2}\boldsymbol{r}_{ij}\,\otimes \,\boldsymbol{f}_{ij}+m_{i}(\boldsymbol{v}_{\boldsymbol{i}}-\boldsymbol{u}_{s}|_{\boldsymbol{x}=\boldsymbol{x}_{i}})\otimes (\boldsymbol{v}_{\boldsymbol{i}}-\boldsymbol{u}_{s}|_{\boldsymbol{x}=\boldsymbol{x}_{i}})\right], & & \displaystyle\end{eqnarray}$$
and
 $$\begin{eqnarray}\displaystyle T=\frac{1}{3}\mathop{\sum }_{i\in cell}[(\boldsymbol{v}_{\boldsymbol{i}}-\boldsymbol{u}_{s}|_{\boldsymbol{x}=\boldsymbol{x}_{i}})\boldsymbol{\cdot }(\boldsymbol{v}_{\boldsymbol{i}}-\boldsymbol{u}_{s}|_{\boldsymbol{x}=\boldsymbol{x}_{i}})], & & \displaystyle\end{eqnarray}$$
where
 $\boldsymbol{r}_{ij}$
is the centre-to-centre contact vector from particle
 $j$
to particle
 $i$
,
 $\boldsymbol{f}_{ij}$
is the total force between the two particles,
 $\boldsymbol{v}_{\boldsymbol{i}}$
is the velocity of particle
 $i$
and
 $\boldsymbol{u}_{s}|_{\boldsymbol{x}=\boldsymbol{x}_{i}}$
is the local-average particle velocity at the location of the particle, obtained by interpolating from the Eulerian velocity of the solid phase at the cell centres (more details in Ozel et al. (Reference Ozel, Gu, Milioli, Kolehmainen and Sundaresan2017)). In appendix C, we present how we choose the mapping mesh size to compute the particle phase stress. In appendix D, we present how frequently local variables of granular temperature and particle volume fractions take different values; all the analyses that follow are based on a parameter space where enough statistics have been collected.
Computational domain and simulation parameters.

Snapshots of the particle volume fraction field in a periodic domain. Domain-averaged particle volume fraction
 $\langle \unicode[STIX]{x1D719}\rangle$
is (a) 0.1 and (b) 0.3. Simulation parameters are listed in table 1. Fluidization simulations of non-cohesive particles are performed with
 $Fr_{p}=65$
. Figures are taken from Ozel et al. (Reference Ozel, Kolehmainen, Radl and Sundaresan2016).

3 Simulation results
In fluidization, the normal stress in the vertical direction is usually larger than those in the lateral directions (Koch & Sangani Reference Koch and Sangani1999). Normal stress differences were probed briefly in this study (see appendix A) and it was found to be dependent on domain-averaged particle volume fraction
 $\langle \unicode[STIX]{x1D719}\rangle$
and local particle volume fraction
 $\unicode[STIX]{x1D719}$
. As the normal stress difference has not been demonstrated to be responsible for any known flow phenomena in fluidized beds, we have not probed it further in this study.
By following Goldstein, Handler & Sirovich (Reference Goldstein, Handler and Sirovich1993), Garzó & Dufty (Reference Garzó and Dufty1999), Jenkins & Richman (Reference Jenkins and Richman1985a ) and Jenkins & Richman (Reference Jenkins and Richman1985b ), the particle phase stress tensor is expressed as:
 $$\begin{eqnarray}\displaystyle \unicode[STIX]{x1D748}=[p-\unicode[STIX]{x1D707}_{b}(\unicode[STIX]{x1D735}\boldsymbol{\cdot }\boldsymbol{u}_{s})]\unicode[STIX]{x1D644}-2\unicode[STIX]{x1D707}_{s}\unicode[STIX]{x1D64E}, & & \displaystyle\end{eqnarray}$$
where
 $p$
is pressure,
 $\unicode[STIX]{x1D707}_{b}$
is bulk viscosity,
 $\unicode[STIX]{x1D707}_{s}$
is shear viscosity and
 $\unicode[STIX]{x1D64E}$
is the rate of deformation tensor:
 $$\begin{eqnarray}\displaystyle \unicode[STIX]{x1D64E}={\textstyle \frac{1}{2}}[\unicode[STIX]{x1D735}\boldsymbol{u}_{s}+(\unicode[STIX]{x1D735}\boldsymbol{u}_{s})^{\text{T}}]-{\textstyle \frac{1}{3}}(\unicode[STIX]{x1D735}\boldsymbol{\cdot }\boldsymbol{u}_{s})\unicode[STIX]{x1D644}. & & \displaystyle\end{eqnarray}$$
It is worth noting that only linear terms in the spatial gradients are retained in (3.1). A more rigorous way to model inhomogeneous gas–solid flows is to perform systematic derivations of the kinetic equations up to high-order terms (Burnett and super-Burnett orders) starting from the Boltzmann equation (e.g. see Sela, Goldhirsch & Noskowicz (Reference Sela, Goldhirsch and Noskowicz1996), Sela & Goldhirsch (Reference Sela and Goldhirsch1998), Kumaran (Reference Kumaran2004, Reference Kumaran2006)). The number of spatial derivatives in the high-order terms for the stress tensor is much more than that for Navier–Stokes level of modelling used here. They are functions of all hydrodynamic variables. Initial assessment has been performed on the isotropic part of the stress tensor (based on constitutive relations suggested by one referee), and suggests that the contributions of second-order terms are minimal. For further investigations, one would have to perform even more complex binning of the data and also include an anisotropic streaming stress tensor. These are beyond the scope of this manuscript, which seeks to deduce a simple model for cohesive systems that captures most of the effects. Thus, we choose not to directly model these higher-order terms.
Based on simulation results, we propose closures for pressure
 $p$
, bulk viscosity
 $\unicode[STIX]{x1D707}_{b}$
and shear viscosity
 $\unicode[STIX]{x1D707}_{s}$
for both non-cohesive and cohesive particles. In the following, we first illustrate that the present methodology can yield results for non-cohesive particles that are consistent with analytically derived kinetic-theory models, and demonstrate the suitability of the methodology (§ 3.1). Then, we modify these closures to include cohesion (§ 3.2).
3.1 Non-cohesive particles
As shown in table 1, fluidization simulations with non-cohesive particles are performed for several Froude numbers corresponding to different values of particle diameter and acceleration due to gravity as well as for different domain-averaged particle volume fractions. In the model development, independent variables and scalings are carefully chosen so that the stress results from these different simulations collapse, ensuring the generality of the proposed model.
3.1.1 Pressure
From (3.1), we have
 $$\begin{eqnarray}\displaystyle {\textstyle \frac{1}{3}}\text{tr}(\unicode[STIX]{x1D748})=p-\unicode[STIX]{x1D707}_{b}\unicode[STIX]{x1D735}\boldsymbol{\cdot }\boldsymbol{u}_{\boldsymbol{s}}. & & \displaystyle\end{eqnarray}$$
As detailed in § 2.2,
 $\unicode[STIX]{x1D748}$
is computed for each computational cell, and
 $\text{tr}(\unicode[STIX]{x1D748})$
is binned with particle volume fraction
 $\unicode[STIX]{x1D719}$
, granular temperature
 $T$
, and rate of dilation
 $\unicode[STIX]{x1D735}\boldsymbol{\cdot }\boldsymbol{u}_{\boldsymbol{s}}$
.
Figure 2 shows the dimensionless trace of the stress tensor
 $(1/3)\text{tr}(\unicode[STIX]{x1D748})/(\unicode[STIX]{x1D70C}_{s}v_{t}^{2})$
versus the dimensionless rate of dilation
 $d(\unicode[STIX]{x1D735}\boldsymbol{\cdot }\boldsymbol{u}_{\boldsymbol{s}})/v_{t}$
for two combinations of particle volume fraction
 $\unicode[STIX]{x1D719}$
and dimensionless granular temperature
 $T/v_{t}^{2}$
. It is found that
 $\text{tr}(\unicode[STIX]{x1D748})$
exhibits a linear relationship with
 $\unicode[STIX]{x1D735}\boldsymbol{\cdot }\boldsymbol{u}_{\boldsymbol{s}}$
for both
 $\unicode[STIX]{x1D735}\boldsymbol{\cdot }\boldsymbol{u}_{\boldsymbol{s}}<0$
and
 $\unicode[STIX]{x1D735}\boldsymbol{\cdot }\boldsymbol{u}_{\boldsymbol{s}}>0$
segments. This finding is consistent with (3.3), and thus supports the suitability of the constitutive equation (3.1). Furthermore, since
 $\text{tr}(\unicode[STIX]{x1D748})$
varies substantially with
 $\unicode[STIX]{x1D735}\boldsymbol{\cdot }\boldsymbol{u}_{\boldsymbol{s}}$
in the system, the pressure
 $p$
is extracted from bins where
 $\unicode[STIX]{x1D735}\boldsymbol{\cdot }\boldsymbol{u}_{\boldsymbol{s}}\approx 0$
. It is worth noting that the flow domain is fully periodic and there is no macroscopic dilation or compression,
 $\langle \unicode[STIX]{x1D735}\boldsymbol{\cdot }\boldsymbol{u}_{\boldsymbol{s}}\rangle =0$
.
Dimensionless trace of the stress tensor versus dimensionless rate of dilation for two combinations of local particle volume fraction (
 $\unicode[STIX]{x1D719}=0.315$
and
 $0.435$
) and granular temperature. In both cases,
 $\text{tr}(\unicode[STIX]{x1D748})$
exhibits a linear relationship with
 $\unicode[STIX]{x1D735}\boldsymbol{\cdot }\boldsymbol{u}_{s}$
for both
 $\boldsymbol{u}_{s}<0$
and
 $\boldsymbol{u}_{s}>0$
segments, as indicated by the dashed lines. Data from fluidization simulations of non-cohesive particles;
 $Fr_{p}=799$
;
 $\langle \unicode[STIX]{x1D719}\rangle =0.1$
.

Figure 3(a) shows the variation of
 $p/(\unicode[STIX]{x1D70C}_{s}v_{t}^{2})$
with
 $T/v_{t}^{2}$
. It is found that
 $p$
scales with
 $T$
, which is consistent with the standard kinetic theory (Lun et al.
Reference Lun, Savage, Jeffrey and Chepurniy1984),
 $$\begin{eqnarray}\displaystyle & \displaystyle p=\unicode[STIX]{x1D70C}_{s}H(\unicode[STIX]{x1D719})T, & \displaystyle\end{eqnarray}$$
 $$\begin{eqnarray}\displaystyle & \displaystyle H(\unicode[STIX]{x1D719})=\unicode[STIX]{x1D719}[1+4\unicode[STIX]{x1D702}\unicode[STIX]{x1D719}g_{0}], & \displaystyle\end{eqnarray}$$
where
 $\unicode[STIX]{x1D702}=(1+e_{p})/2$
and
 $g_{0}$
is the radial distribution function at contact.
Figure 3(b) shows a plot of
 $p/(\unicode[STIX]{x1D70C}_{s}T)$
against
 $\unicode[STIX]{x1D719}$
for various
 $Fr_{p}$
and
 $\langle \unicode[STIX]{x1D719}\rangle$
. The data collapse onto a single curve, and it is found that the standard kinetic theory captures the collapse well. Throughout this paper, we have used
 $g_{0}$
proposed by Chialvo & Sundaresan (Reference Chialvo and Sundaresan2013):
 $$\begin{eqnarray}\displaystyle g_{0}=\frac{1-\unicode[STIX]{x1D719}/2}{(1-\unicode[STIX]{x1D719})^{3}}+\frac{\unicode[STIX]{x1D6FC}_{g_{0}}\unicode[STIX]{x1D719}^{2}}{(\unicode[STIX]{x1D719}_{c}-\unicode[STIX]{x1D719})^{3/2}}, & & \displaystyle\end{eqnarray}$$
where
 $\unicode[STIX]{x1D6FC}_{g_{0}}=0.58$
, and
 $\unicode[STIX]{x1D719}_{c}$
is a jamming volume fraction that varies with the sliding friction coefficient
 $\unicode[STIX]{x1D707}_{p}$
(Chialvo, Sun & Sundaresan Reference Chialvo, Sun and Sundaresan2012; Chialvo & Sundaresan Reference Chialvo and Sundaresan2013). The jamming condition was found by Sun & Sundaresan (Reference Sun and Sundaresan2011) to depend on the nature of the deformation. Simple shear appears to afford the smallest value of
 $\unicode[STIX]{x1D719}_{c}$
among all types of deformations. For
 $\unicode[STIX]{x1D707}_{s}=0.5$
, simple shear simulations yielded
 $\unicode[STIX]{x1D719}_{c}=0.587$
(Chialvo et al.
Reference Chialvo, Sun and Sundaresan2012). In the present simulations, where appreciable compaction and dilation are also at play,
 $\unicode[STIX]{x1D719}_{c}=0.61$
was found to fit the data better and is used in all subsequent figures.
(a) Dimensionless pressure versus dimensionless granular temperature for various local particle volume fractions (
 $\unicode[STIX]{x1D719}=0.105,0.195,0.315,0.405,0.465$
). In all cases,
 $p$
scales with
 $T$
as indicated by the dashed line with slope of
 $1$
. Data from fluidization simulations of non-cohesive particles;
 $Fr_{p}=65$
;
 $\langle \unicode[STIX]{x1D719}\rangle =0.1$
. (b) Pressure scaled by granular temperature versus local particle volume fraction for various Froude numbers and domain-averaged particle volume fractions. Dashed line: equation (3.5).

3.1.2 Bulk viscosity
According to (3.3) as well as figure 2, bulk viscosity
 $\unicode[STIX]{x1D707}_{b}$
can be found by computing the slope of
 $(1/3)\text{tr}(\unicode[STIX]{x1D748})$
versus
 $-\unicode[STIX]{x1D735}\boldsymbol{\cdot }\boldsymbol{u}_{\boldsymbol{s}}$
. As indicated in the figure, the slope differs between
 $\unicode[STIX]{x1D735}\boldsymbol{\cdot }\boldsymbol{u}_{\boldsymbol{s}}<0$
and
 $\unicode[STIX]{x1D735}\boldsymbol{\cdot }\boldsymbol{u}_{\boldsymbol{s}}>0$
. Thus,
 $\unicode[STIX]{x1D707}_{b}$
is calculated for
 $\unicode[STIX]{x1D735}\boldsymbol{\cdot }\boldsymbol{u}_{\boldsymbol{s}}<0$
(corresponding to compaction) and
 $\unicode[STIX]{x1D735}\boldsymbol{\cdot }\boldsymbol{u}_{\boldsymbol{s}}>0$
(corresponding to dilation) separately.
Figure 5(a) shows the dimensionless bulk viscosity
 $\unicode[STIX]{x1D707}_{b}/(\unicode[STIX]{x1D70C}_{s}dv_{t})$
versus
 $T/v_{t}^{2}$
for two particle volume fractions. It is found that
 $\unicode[STIX]{x1D707}_{b}$
scales with
 $\sqrt{T}$
, which is consistent with the standard kinetic theory. According to Lun et al. (Reference Lun, Savage, Jeffrey and Chepurniy1984)
 $$\begin{eqnarray}\displaystyle \unicode[STIX]{x1D707}_{b}=\left(\unicode[STIX]{x1D702}\frac{8}{3\sqrt{\unicode[STIX]{x03C0}}}\unicode[STIX]{x1D719}^{2}g_{0}\right)\unicode[STIX]{x1D70C}_{s}d\sqrt{T}. & & \displaystyle\end{eqnarray}$$
However, unlike the standard kinetic theory, it is found that bulk viscosity is larger for compaction than for dilation for a given particle volume fraction and granular temperature. This behaviour of bulk viscosity has also been observed in simulations of travelling waves in particle–fluid suspensions (Moon, Kevrekidis & Sundaresan Reference Moon, Kevrekidis and Sundaresan2006; Derksen & Sundaresan Reference Derksen and Sundaresan2007). One can interpret this behaviour as
 $\unicode[STIX]{x1D707}_{b}$
being a function of
 $\unicode[STIX]{x1D735}\boldsymbol{\cdot }\boldsymbol{u}_{\boldsymbol{s}}/(\sqrt{T}/d)$
, which is indicative of a higher-order effect.
We plot the bulk viscosity scaled by granular temperature,
 $\unicode[STIX]{x1D707}_{b}/(\unicode[STIX]{x1D70C}_{s}d\sqrt{T})$
, against
 $\unicode[STIX]{x1D719}$
for different Froude numbers
 $Fr_{p}$
and
 $\langle \unicode[STIX]{x1D719}\rangle$
in figure 5(b). Values of bulk viscosity for compaction and those for dilation each collapse. The bulk viscosity data could be captured by
 $$\begin{eqnarray}\displaystyle \unicode[STIX]{x1D707}_{b}=\left(\unicode[STIX]{x1D6FC}_{\unicode[STIX]{x1D707}_{b}}\unicode[STIX]{x1D702}\frac{8}{3\sqrt{\unicode[STIX]{x03C0}}}\unicode[STIX]{x1D719}^{2}g_{0}\right)\unicode[STIX]{x1D70C}_{s}d\sqrt{T}, & & \displaystyle\end{eqnarray}$$
where
 $\unicode[STIX]{x1D6FC}_{\unicode[STIX]{x1D707}_{b}}=1$
for dilation and
 $\unicode[STIX]{x1D6FC}_{\unicode[STIX]{x1D707}_{b}}=1.5$
for compaction.
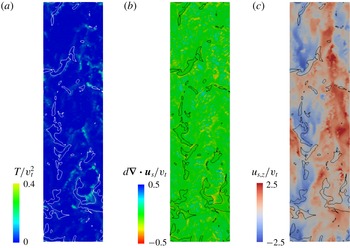
By following Capecelatro et al. (Reference Capecelatro, Desjardins and Fox2014), snapshots of granular temperature, dilation/compression
 $\unicode[STIX]{x1D735}\boldsymbol{\cdot }\boldsymbol{u}_{\boldsymbol{s}}$
and vertical solid velocity with a solid volume fraction contour (
 $\unicode[STIX]{x1D719}=0.3$
) were generated (see figure 4). As seen from the figure, the granular temperature is very low within falling clusters and it reaches maximum values just out of a cluster, where maximum dilation
 $\unicode[STIX]{x1D735}\boldsymbol{\cdot }\boldsymbol{u}_{\boldsymbol{s}}<0$
occurs. As discussed by Fox (Reference Fox2014), viscous heating due to dilation/compaction behaves as a source term for the granular temperature.
Snapshots of (a) granular temperature, (b) dilation/compression
 $\unicode[STIX]{x1D735}\boldsymbol{\cdot }\boldsymbol{u}_{\boldsymbol{s}}$
, (c) vertical solid velocity with local solid volume fraction iso-contours (
 $\unicode[STIX]{x1D719}=0.3$
).
 $Fr_{p}=75$
. Domain-averaged volume fraction
 $\langle \unicode[STIX]{x1D719}\rangle =0.1$
.

(a) Dimensionless bulk viscosity versus dimensionless granular temperature for two local particle volume fractions (
 $\unicode[STIX]{x1D719}=0.315$
and
 $0.435$
). Filled (unfilled) symbols are for compaction (dilation). In all cases,
 $\unicode[STIX]{x1D707}_{b}$
scales with
 $\sqrt{T}$
as indicated by the dashed line with slope of
 $1/2$
. Data from fluidization simulations of non-cohesive particles;
 $Fr_{p}=799$
;
 $\langle \unicode[STIX]{x1D719}\rangle =0.1$
. (b) Bulk viscosity scaled by granular temperature versus local particle volume fraction for different Froude numbers and domain-averaged particle volume fractions. Solid line: equation (3.8) with
 $\unicode[STIX]{x1D6FC}_{\unicode[STIX]{x1D707}_{b}}=1.5$
. Dashed line: same equation with
 $\unicode[STIX]{x1D6FC}_{\unicode[STIX]{x1D707}_{b}}=1$
.

3.1.3 Shear viscosity
The shear viscosity,
 $\unicode[STIX]{x1D707}_{s}$
, is calculated as:
 $$\begin{eqnarray}\displaystyle \unicode[STIX]{x1D707}_{s}=\frac{\unicode[STIX]{x1D749}\mathbf{:}(2\unicode[STIX]{x1D64E})}{(2\unicode[STIX]{x1D64E})\mathbf{:}(2\unicode[STIX]{x1D64E})}, & & \displaystyle\end{eqnarray}$$
where the deviatoric stress tensor
 $\unicode[STIX]{x1D749}=-\unicode[STIX]{x1D748}+(1/3)\text{tr}(\unicode[STIX]{x1D748})\unicode[STIX]{x1D644}$
.
Kinetic-theory-based models derived for gas–solid systems (Koch Reference Koch1990; Gidaspow Reference Gidaspow1994; Balzer et al.
Reference Balzer, Boëlle and Simonin1995; Boëlle et al.
Reference Boëlle, Balzer and Simonin1995; Ma & Kato Reference Ma and Kato1998; Koch & Sangani Reference Koch and Sangani1999; Lun & Savage Reference Lun, Savage, Pöschel and Brilliantov2003; Garzó et al.
Reference Garzó, Tenneti, Subramaniam and Hrenya2012) have taken into consideration the potential influence of the slip velocity
 $u_{slip}=|\boldsymbol{u}_{g}-\boldsymbol{u}_{s}|$
on shear viscosity. Therefore, in our analysis,
 $\unicode[STIX]{x1D707}_{s}$
was computed in each Eulerian grid, and initially binned with
 $u_{slip}$
,
 $\unicode[STIX]{x1D719}$
and
 $T$
. Figure 6 shows the dimensionless shear viscosity
 $\unicode[STIX]{x1D707}_{s}/(\unicode[STIX]{x1D70C}_{s}dv_{t})$
versus
 $T/v_{t}^{2}$
for various dimensionless slip velocities
 $u_{slip}/v_{t}$
. Two regimes are readily identified, as indicated by the dashed lines, where
 $\unicode[STIX]{x1D707}_{s}$
scales with
 $T$
in the low
 $T$
regime and with
 $T^{1/2}$
in the high
 $T$
regime. These two flow regimes are also observed in the kinetic-theory-based models derived for gas–solid systems (Koch Reference Koch1990; Gidaspow Reference Gidaspow1994; Balzer et al.
Reference Balzer, Boëlle and Simonin1995; Boëlle et al.
Reference Boëlle, Balzer and Simonin1995; Ma & Kato Reference Ma and Kato1998; Koch & Sangani Reference Koch and Sangani1999; Lun & Savage Reference Lun, Savage, Pöschel and Brilliantov2003; Garzó et al.
Reference Garzó, Tenneti, Subramaniam and Hrenya2012). However, unlike these studies, it is found that
 $u_{slip}$
affects
 $\unicode[STIX]{x1D707}_{s}$
minimally. Therefore,
 $\unicode[STIX]{x1D707}_{s}$
was simply binned with
 $\unicode[STIX]{x1D719}$
and
 $T$
.
We plot the scaled shear viscosity in the high
 $T$
regime
 $\unicode[STIX]{x1D707}_{s,c}/(\unicode[STIX]{x1D70C}_{s}d\sqrt{T})$
against
 $\unicode[STIX]{x1D719}$
for various
 $Fr_{p}$
and
 $\langle \unicode[STIX]{x1D719}\rangle$
in figure 7(a). The data are consistent with the predictions of standard kinetic theory that does not account for effects of interstitial fluid (Lun et al.
Reference Lun, Savage, Jeffrey and Chepurniy1984):
 $$\begin{eqnarray}\displaystyle \unicode[STIX]{x1D707}_{s,c} & = & \displaystyle \left(\frac{2+\unicode[STIX]{x1D6FC}_{0}}{6}\right)\left[\frac{5\sqrt{\unicode[STIX]{x03C0}}}{48g_{0}\unicode[STIX]{x1D702}(2-\unicode[STIX]{x1D702})}\left(1+\frac{8}{5}\unicode[STIX]{x1D719}\unicode[STIX]{x1D702}g_{0}\right)\left(1+\frac{8}{5}\unicode[STIX]{x1D702}(3\unicode[STIX]{x1D702}-2)\unicode[STIX]{x1D719}g_{0}\right)\right.\nonumber\\ \displaystyle & & \displaystyle +\left.\frac{16}{5}\unicode[STIX]{x1D702}\frac{\unicode[STIX]{x1D719}^{2}g_{0}}{\sqrt{\unicode[STIX]{x03C0}}}\right]\unicode[STIX]{x1D70C}_{s}d\sqrt{T},\end{eqnarray}$$
where
 $\unicode[STIX]{x1D6FC}_{0}=1.6$
. The modified kinetic theory proposed by Chialvo & Sundaresan (Reference Chialvo and Sundaresan2013) that is based on an inertial number model in the dense regime (MiDi Reference MiDi2004; da Cruz et al.
Reference da Cruz, Emam, Prochnow, Roux and Chevoir2005; Jop et al.
Reference Jop, Forterre and Pouliquen2006) yields essentially indistinguishable predictions as (3.10), as illustrated in figure 7(a). This consistency again affirms the validity of the computational approach followed in the present study.
Dimensionless shear viscosity versus dimensionless granular temperature for various dimensionless slip velocities and
 $\unicode[STIX]{x1D719}=0.465$
. Two regimes are identified.
 $\unicode[STIX]{x1D707}_{s}$
scales with
 $T$
in the low
 $T$
regime and with
 $T^{1/2}$
in the high
 $T$
regime, as indicated by the two dashed lines with slopes of
 $1$
(left) and
 $1/2$
(right). Data from fluidization simulations of non-cohesive particles;
 $Fr_{p}=286$
;
 $\langle \unicode[STIX]{x1D719}\rangle =0.3$
.

Scaled shear viscosity versus local particle volume fraction for different Froude numbers and domain-averaged particle volume fractions. (a) Data in the high
 $T$
regime where
 $\unicode[STIX]{x1D707}_{s}$
scales with
 $T^{1/2}$
are plotted. Dashed line: equation (3.10). Dotted line: the modified kinetic theory proposed by Chialvo & Sundaresan (Reference Chialvo and Sundaresan2013). (b) Data in the low
 $T$
regime where
 $\unicode[STIX]{x1D707}_{s}$
scales with
 $T$
are plotted. Dashed line: equation (3.12).

We found that shear viscosity data in the low
 $T$
regime could be captured as,
 $$\begin{eqnarray}\displaystyle \unicode[STIX]{x1D707}_{s,g}=f_{\unicode[STIX]{x1D707}_{s,g}}(\unicode[STIX]{x1D719})\unicode[STIX]{x1D70C}_{s}T\sqrt{d/g}. & & \displaystyle\end{eqnarray}$$
Such a dependence of transport coefficient on gravity has also been observed before; from numerical simulations, it was found that gravity affects heat conductivity of molecular gas (Doi, Santos & Tij Reference Doi, Santos and Tij1999). Figure 7(b) shows a plot of
 $\unicode[STIX]{x1D707}_{s}/\unicode[STIX]{x1D70C}_{s}T\sqrt{d/g}$
against
 $\unicode[STIX]{x1D719}$
extracted from simulations performed using different particle diameters and acceleration due to gravity (which are combined in terms of Froude number). Data collapse reasonably well onto a single curve, supporting the scaling. The dashed line in figure 7(b) corresponds to
 $$\begin{eqnarray}\displaystyle f_{\unicode[STIX]{x1D707}_{s,g}}=\unicode[STIX]{x1D6FC}_{\unicode[STIX]{x1D707}_{s},g}g_{0}\unicode[STIX]{x1D719}^{2}, & & \displaystyle\end{eqnarray}$$
where
 $\unicode[STIX]{x1D6FC}_{\unicode[STIX]{x1D707}_{s},g}=8.0$
.
The transition from the high
 $T$
regime to the low
 $T$
regime can be understood as a change in time between inter-particle collisions.
 $\unicode[STIX]{x1D707}_{s}\sim \unicode[STIX]{x1D70C}_{s}T\unicode[STIX]{x1D70F}$
, where
 $\unicode[STIX]{x1D70F}$
is a collision time for the system. At high
 $T$
conditions, the collision time scales as
 $d/\sqrt{T}$
. In the low
 $T$
regime, collisions appear to be largely determined by gravitational fall and hence the
 $\sqrt{d/g}$
scaling for collision time. In our computationally generated model approach, we simply bridge the low and high
 $T$
regimes via
 $$\begin{eqnarray}\displaystyle \unicode[STIX]{x1D707}_{s}=\text{min}(\unicode[STIX]{x1D707}_{s,g},\unicode[STIX]{x1D707}_{s,c}). & & \displaystyle\end{eqnarray}$$
3.1.4 Pseudo-thermal energy balance
As proposed kinetic-theory-based models for pressure, bulk viscosity, and shear viscosity directly depend on granular temperature, a balance of pseudo-thermal energy (PTE) of particle velocity fluctuations needs to be solved to obtain the granular temperature. In fluidized gas–particle mixtures, the rate of production of PTE by shear
 $-\unicode[STIX]{x1D748}\boldsymbol{ : }\unicode[STIX]{x1D735}\boldsymbol{u}_{\boldsymbol{s}}$
is, to a good approximation, balanced locally by the rate of dissipation of PTE by inter-particle collisions
 $J_{coll}$
. Therefore, we set
 $$\begin{eqnarray}\displaystyle -\unicode[STIX]{x1D748}\boldsymbol{ : }\unicode[STIX]{x1D735}\boldsymbol{u}_{\boldsymbol{s}}=J_{coll}. & & \displaystyle\end{eqnarray}$$
This approximation is supported by the following two observations.
First, our computational results show that
 $u_{slip}$
affects
 $-\unicode[STIX]{x1D748}\boldsymbol{ : }\unicode[STIX]{x1D735}\boldsymbol{u}_{\boldsymbol{s}}$
minimally, and thus all the terms that depend on
 $u_{slip}$
affect the rates of generation and dissipation of PTE only in a secondary fashion; this is consistent with the high particle Stokes number, as shown in table 1. Hence any terms involving
 $u_{slip}$
cannot be probed using our results. The weak role of
 $u_{slip}$
is illustrated in figure 8, where the scaled rate of production of PTE by shear
 $-\unicode[STIX]{x1D748}\boldsymbol{ : }\unicode[STIX]{x1D735}\boldsymbol{u}_{\boldsymbol{s}}d/\unicode[STIX]{x1D70C}_{s}v_{t}^{3}$
is plotted against
 $T/v_{t}^{2}$
for various
 $u_{slip}/v_{t}$
.
Second, at high
 $T$
regime, the expression for
 $J_{coll}$
from the kinetic theory of granular materials is found to match
 $-\unicode[STIX]{x1D748}\boldsymbol{ : }\unicode[STIX]{x1D735}\boldsymbol{u}_{\boldsymbol{s}}$
from the simulations. This is illustrated in figure 9(a) where the scaled rate of production of PTE by shear
 $-\unicode[STIX]{x1D748}\boldsymbol{ : }\unicode[STIX]{x1D735}\boldsymbol{u}_{\boldsymbol{s}}d/\unicode[STIX]{x1D70C}_{s}T^{3/2}$
is plotted against
 $\unicode[STIX]{x1D719}$
for various
 $Fr_{p}$
and
 $\langle \unicode[STIX]{x1D719}\rangle$
. Data collapse onto a single curve, which is described well by (3.14) where
 $J_{coll}$
is equal to
 $J_{coll,MKT}$
from modified kinetic theory (Chialvo & Sundaresan Reference Chialvo and Sundaresan2013):
 $$\begin{eqnarray}\displaystyle J_{coll,MKT}=\frac{12}{\sqrt{\unicode[STIX]{x03C0}}}\unicode[STIX]{x1D719}^{2}g_{0}(1-e_{eff}^{2})\frac{\unicode[STIX]{x1D70C}_{s}T^{3/2}}{d}. & & \displaystyle\end{eqnarray}$$
In this equation, the restitution coefficient
 $e_{p}$
in the standard kinetic theory (Lun et al.
Reference Lun, Savage, Jeffrey and Chepurniy1984) is replaced by an effective restitution coefficient
 $e_{eff}$
(Chialvo & Sundaresan Reference Chialvo and Sundaresan2013) to account for the total energy loss due to inelasticity and friction during an inter-particle collision, which is supported by analytical derivations of kinetic theory for slightly frictional particles (Jenkins & Zhang Reference Jenkins and Zhang2002). Based on simple shear simulations of frictional particles, Chialvo & Sundaresan (Reference Chialvo and Sundaresan2013) related
 $e_{eff}$
to the particle sliding friction coefficient
 $\unicode[STIX]{x1D707}_{p}$
as the following,
 $$\begin{eqnarray}\displaystyle e_{eff}=e_{p}-{\textstyle \frac{3}{2}}\unicode[STIX]{x1D707}\text{exp}(-3\unicode[STIX]{x1D707}). & & \displaystyle\end{eqnarray}$$
Both observations above suggest that the approximation
 $-\unicode[STIX]{x1D748}\boldsymbol{ : }\unicode[STIX]{x1D735}\boldsymbol{u}_{\boldsymbol{s}}=J_{coll}$
is reasonable, and therefore we formulate models for
 $J_{coll}$
based on
 $-\unicode[STIX]{x1D748}\boldsymbol{ : }\unicode[STIX]{x1D735}\boldsymbol{u}_{\boldsymbol{s}}$
data from simulations, when (3.15) is not valid (e.g. as in the low
 $T$
regime).
Dimensionless production rate of PTE by shear versus dimensionless granular temperature for various dimensionless slip velocities and
 $\unicode[STIX]{x1D719}=0.465$
. Two regimes are identified.
 $-\unicode[STIX]{x1D748}\boldsymbol{ : }\unicode[STIX]{x1D735}\boldsymbol{u}_{\boldsymbol{s}}$
scales with
 $T^{2}$
in the low
 $T$
regime and with
 $T^{3/2}$
in the high
 $T$
regime, as indicated by the two dashed lines with slope of
 $2$
(left) and
 $3/2$
(right). Data from fluidization simulations of non-cohesive particles;
 $Fr_{p}=286$
;
 $\langle \unicode[STIX]{x1D719}\rangle =0.3$
.

Rescaled rate of production of PTE by shear scaled versus local particle volume fraction for different Froude numbers and domain-averaged particle volume fractions. (a) Data in the high
 $T$
regime where
 $-\unicode[STIX]{x1D748}\boldsymbol{ : }\unicode[STIX]{x1D735}\boldsymbol{u}_{\boldsymbol{s}}$
scales with
 $T^{3/2}$
are plotted. Dashed line: equation (3.15). (b) Data in the low
 $T$
regime where
 $-\unicode[STIX]{x1D748}\boldsymbol{ : }\unicode[STIX]{x1D735}\boldsymbol{u}_{\boldsymbol{s}}$
scales with
 $T^{2}$
are plotted. Dashed line: equation (3.22).

Before we move on to the low
 $T$
regime, one can further improve the model accuracy by including a term that linearly depends on
 $\unicode[STIX]{x1D735}\boldsymbol{\cdot }\boldsymbol{u}_{\boldsymbol{s}}$
. Specifically, we have the following expression for the rate of dissipation
 $J_{coll}$
:
 $$\begin{eqnarray}\displaystyle J_{coll}=J_{0}+J_{u}(\unicode[STIX]{x1D735}\boldsymbol{\cdot }\boldsymbol{u}_{\boldsymbol{s}}). & & \displaystyle\end{eqnarray}$$
We triple binned
 $(-\unicode[STIX]{x1D70E}_{s}\boldsymbol{ : }\unicode[STIX]{x1D735}u_{s})$
(which is assumed to balance with the rate of dissipation) with
 $\unicode[STIX]{x1D719}$
,
 $T$
and
 $\unicode[STIX]{x1D735}\boldsymbol{\cdot }u_{s}$
. To evaluate and model the terms
 $J_{0}$
and
 $J_{u}$
, from the triple-binned data gathered above, for each combination of
 $\unicode[STIX]{x1D719}$
and
 $T$
, we calculate the intercept (to obtain
 $J_{0}$
) and slope (to obtain
 $J_{u}$
) of
 $(-\unicode[STIX]{x1D70E}_{s}\boldsymbol{ : }\unicode[STIX]{x1D735}u_{s})$
versus
 $(\unicode[STIX]{x1D735}\boldsymbol{\cdot }u_{s})$
.
We can keep the same expression as in (3.15) for
 $J_{0}$
. As shown in figure 10(a), the data from different granular temperatures collapse onto a curve that is captured by the dashed line, validating the model. Furthermore, this collapse and agreement with the model prediction are both achieved for different particle diameters (different Froude numbers in the legend).
For
 $J_{u}$
, we write (Gidaspow Reference Gidaspow1994):
 $$\begin{eqnarray}\displaystyle J_{u}=-3(1-e_{eff}^{2})\unicode[STIX]{x1D719}^{2}\unicode[STIX]{x1D70C}_{s}g_{0}T. & & \displaystyle\end{eqnarray}$$
To test out this expression, in a similar fashion as done for
 $J_{0}$
, we rescale
 $J_{u}$
by
 $T$
, and plot against
 $\unicode[STIX]{x1D719}$
in figure 10(b). We see data collapse onto a curve, supporting the scaling with
 $T$
in the expression. For the model to capture the collapse, it is found that a proportionality constant
 $\unicode[STIX]{x1D6FC}_{J_{u}}$
of
 $3.5$
is needed. As indicated by the dashed line in figure 10(b), this constant works for different solid volume fractions, granular temperatures and particle diameters (as indicated by Froude number
 $Fr_{p}$
). Thus, we have the following
 $$\begin{eqnarray}\displaystyle J_{u}=-3\unicode[STIX]{x1D6FC}_{J_{u}}(1-e_{eff}^{2})\unicode[STIX]{x1D719}^{2}\unicode[STIX]{x1D70C}_{s}g_{0}T, & & \displaystyle\end{eqnarray}$$
where
 $\unicode[STIX]{x1D6FC}_{J_{u}}=3.5$
.
Rescaled
 $J_{0}$
(a) or rescaled
 $J_{u}$
(b) is plotted against solid volume fraction for different granular temperatures and different Froude numbers. To obtain these values, we calculate the intercept (to obtain
 $J_{0}$
) and slope (to obtain
 $J_{u}$
) of
 $(-\unicode[STIX]{x1D70E}_{s}\boldsymbol{ : }\unicode[STIX]{x1D735}u_{s})$
versus
 $(\unicode[STIX]{x1D735}\boldsymbol{\cdot }u_{s})$
. In (a), the dashed line is from equation (3.15). In (b), the dashed line is from equation (3.19), where
 $\unicode[STIX]{x1D6FC}_{J_{u}}=3.5$
. Data from fluidization simulations of non-cohesive particles;
 $Fr_{p}=65$
;
 $\langle \unicode[STIX]{x1D719}\rangle =0.3$
.

Now, we can move on to the lower granular temperature region.
It is useful to express (3.15) as
 $$\begin{eqnarray}\displaystyle J_{coll,MKT}=f_{J}(\unicode[STIX]{x1D719})\unicode[STIX]{x1D70C}_{s}T/\unicode[STIX]{x1D70F}_{vis}, & & \displaystyle\end{eqnarray}$$
where
 $\unicode[STIX]{x1D70F}_{vis}=d^{2}\unicode[STIX]{x1D70C}_{s}/\unicode[STIX]{x1D707}_{s}$
. In the high
 $T$
regime, as discussed in § 3.1.3 on definitions of
 $\unicode[STIX]{x1D707}_{s}$
, we have
 $\unicode[STIX]{x1D707}_{s}\sim \unicode[STIX]{x1D70C}_{s}d\sqrt{T}$
, and the expression returns back to the one in (3.15).
At low
 $T$
regime, where
 $\unicode[STIX]{x1D707}_{s}\sim \unicode[STIX]{x1D70C}_{s}T\sqrt{d/g}$
, we then anticipate
 $$\begin{eqnarray}\displaystyle J_{coll,g}=f_{J,g}(\unicode[STIX]{x1D719})\frac{\unicode[STIX]{x1D70C}_{s}T^{2}}{d^{2}}\sqrt{d/g}. & & \displaystyle\end{eqnarray}$$
If this model is reasonable, the rate of production of PTE by shear in the low
 $T$
regime, scaled as
 $-\unicode[STIX]{x1D748}\boldsymbol{ : }\unicode[STIX]{x1D735}\boldsymbol{u}_{\boldsymbol{s}}d^{2}/\unicode[STIX]{x1D70C}_{s}T^{2}\sqrt{d/g}$
, should only be a function of
 $\unicode[STIX]{x1D719}$
independent of the Froude number of the particles used in the simulations. Figure 9(b) confirms that the data do collapse reasonably well, supporting the model form chosen in (3.21). The dashed line in this figure corresponds to
 $$\begin{eqnarray}\displaystyle f_{J,g}(\unicode[STIX]{x1D719})=\unicode[STIX]{x1D6FC}_{J,g}\unicode[STIX]{x1D719}^{2}g_{0}(1-e_{eff}^{2}), & & \displaystyle\end{eqnarray}$$
where
 $\unicode[STIX]{x1D6FC}_{J,g}=45$
.
As in the case of shear viscosity, we bridge
 $J_{coll}$
in the low and high
 $T$
regimes via
 $$\begin{eqnarray}\displaystyle J_{coll}=\text{min}(J_{coll,g},J_{coll,c}), & & \displaystyle\end{eqnarray}$$
where
 $$\begin{eqnarray}\displaystyle J_{coll,c}=J_{0}+J_{u}(\unicode[STIX]{x1D735}\boldsymbol{\cdot }\boldsymbol{u}_{\boldsymbol{s}}). & & \displaystyle\end{eqnarray}$$
3.1.5 Summary
It is found that the results for non-cohesive particles in the high
 $T$
regime obtained by post-processing CFD-DEM simulations agree well with the constitutive expressions afforded by the kinetic theory of granular materials, which have been modified to include the effect of inter-particle friction. These findings demonstrate the validity of the adopted methodology. The present computational approach has also revealed a low
 $T$
regime, where the inter-particle collision time is determined by gravitational fall between collisions. Modifications to the kinetic-theory constitutive models are proposed to capture both the low and high
 $T$
regimes. Table 2 includes a summary of the constitutive models for non-cohesive particles.
Computationally generated kinetic-theory-based models for non-cohesive and cohesive particles proposed in the present study.

3.2 Cohesive particles
Fluidization simulations were performed including inter-particle van der Waals forces with two Hamaker constants (see table 1). The cohesion strength is characterized by the Bond number
 $Bo^{\ast }=F_{coh}^{max}/(m_{p}|\boldsymbol{g}|)$
. Here,
 $F_{coh}^{max}$
is the maximum cohesive force between two particles. From (2.9), for
 $s=s_{min}^{R}\ll d$
,
 $F_{coh}^{max}$
becomes:
 $$\begin{eqnarray}\displaystyle F_{coh}^{max}=F_{vdw}(A^{R},s_{min}^{R})=\frac{A^{R}d}{24{s_{min}^{R}}^{2}}. & & \displaystyle\end{eqnarray}$$
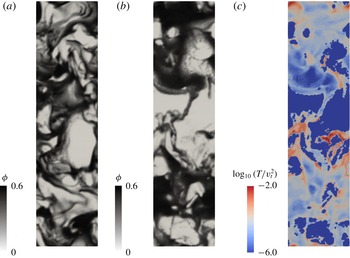
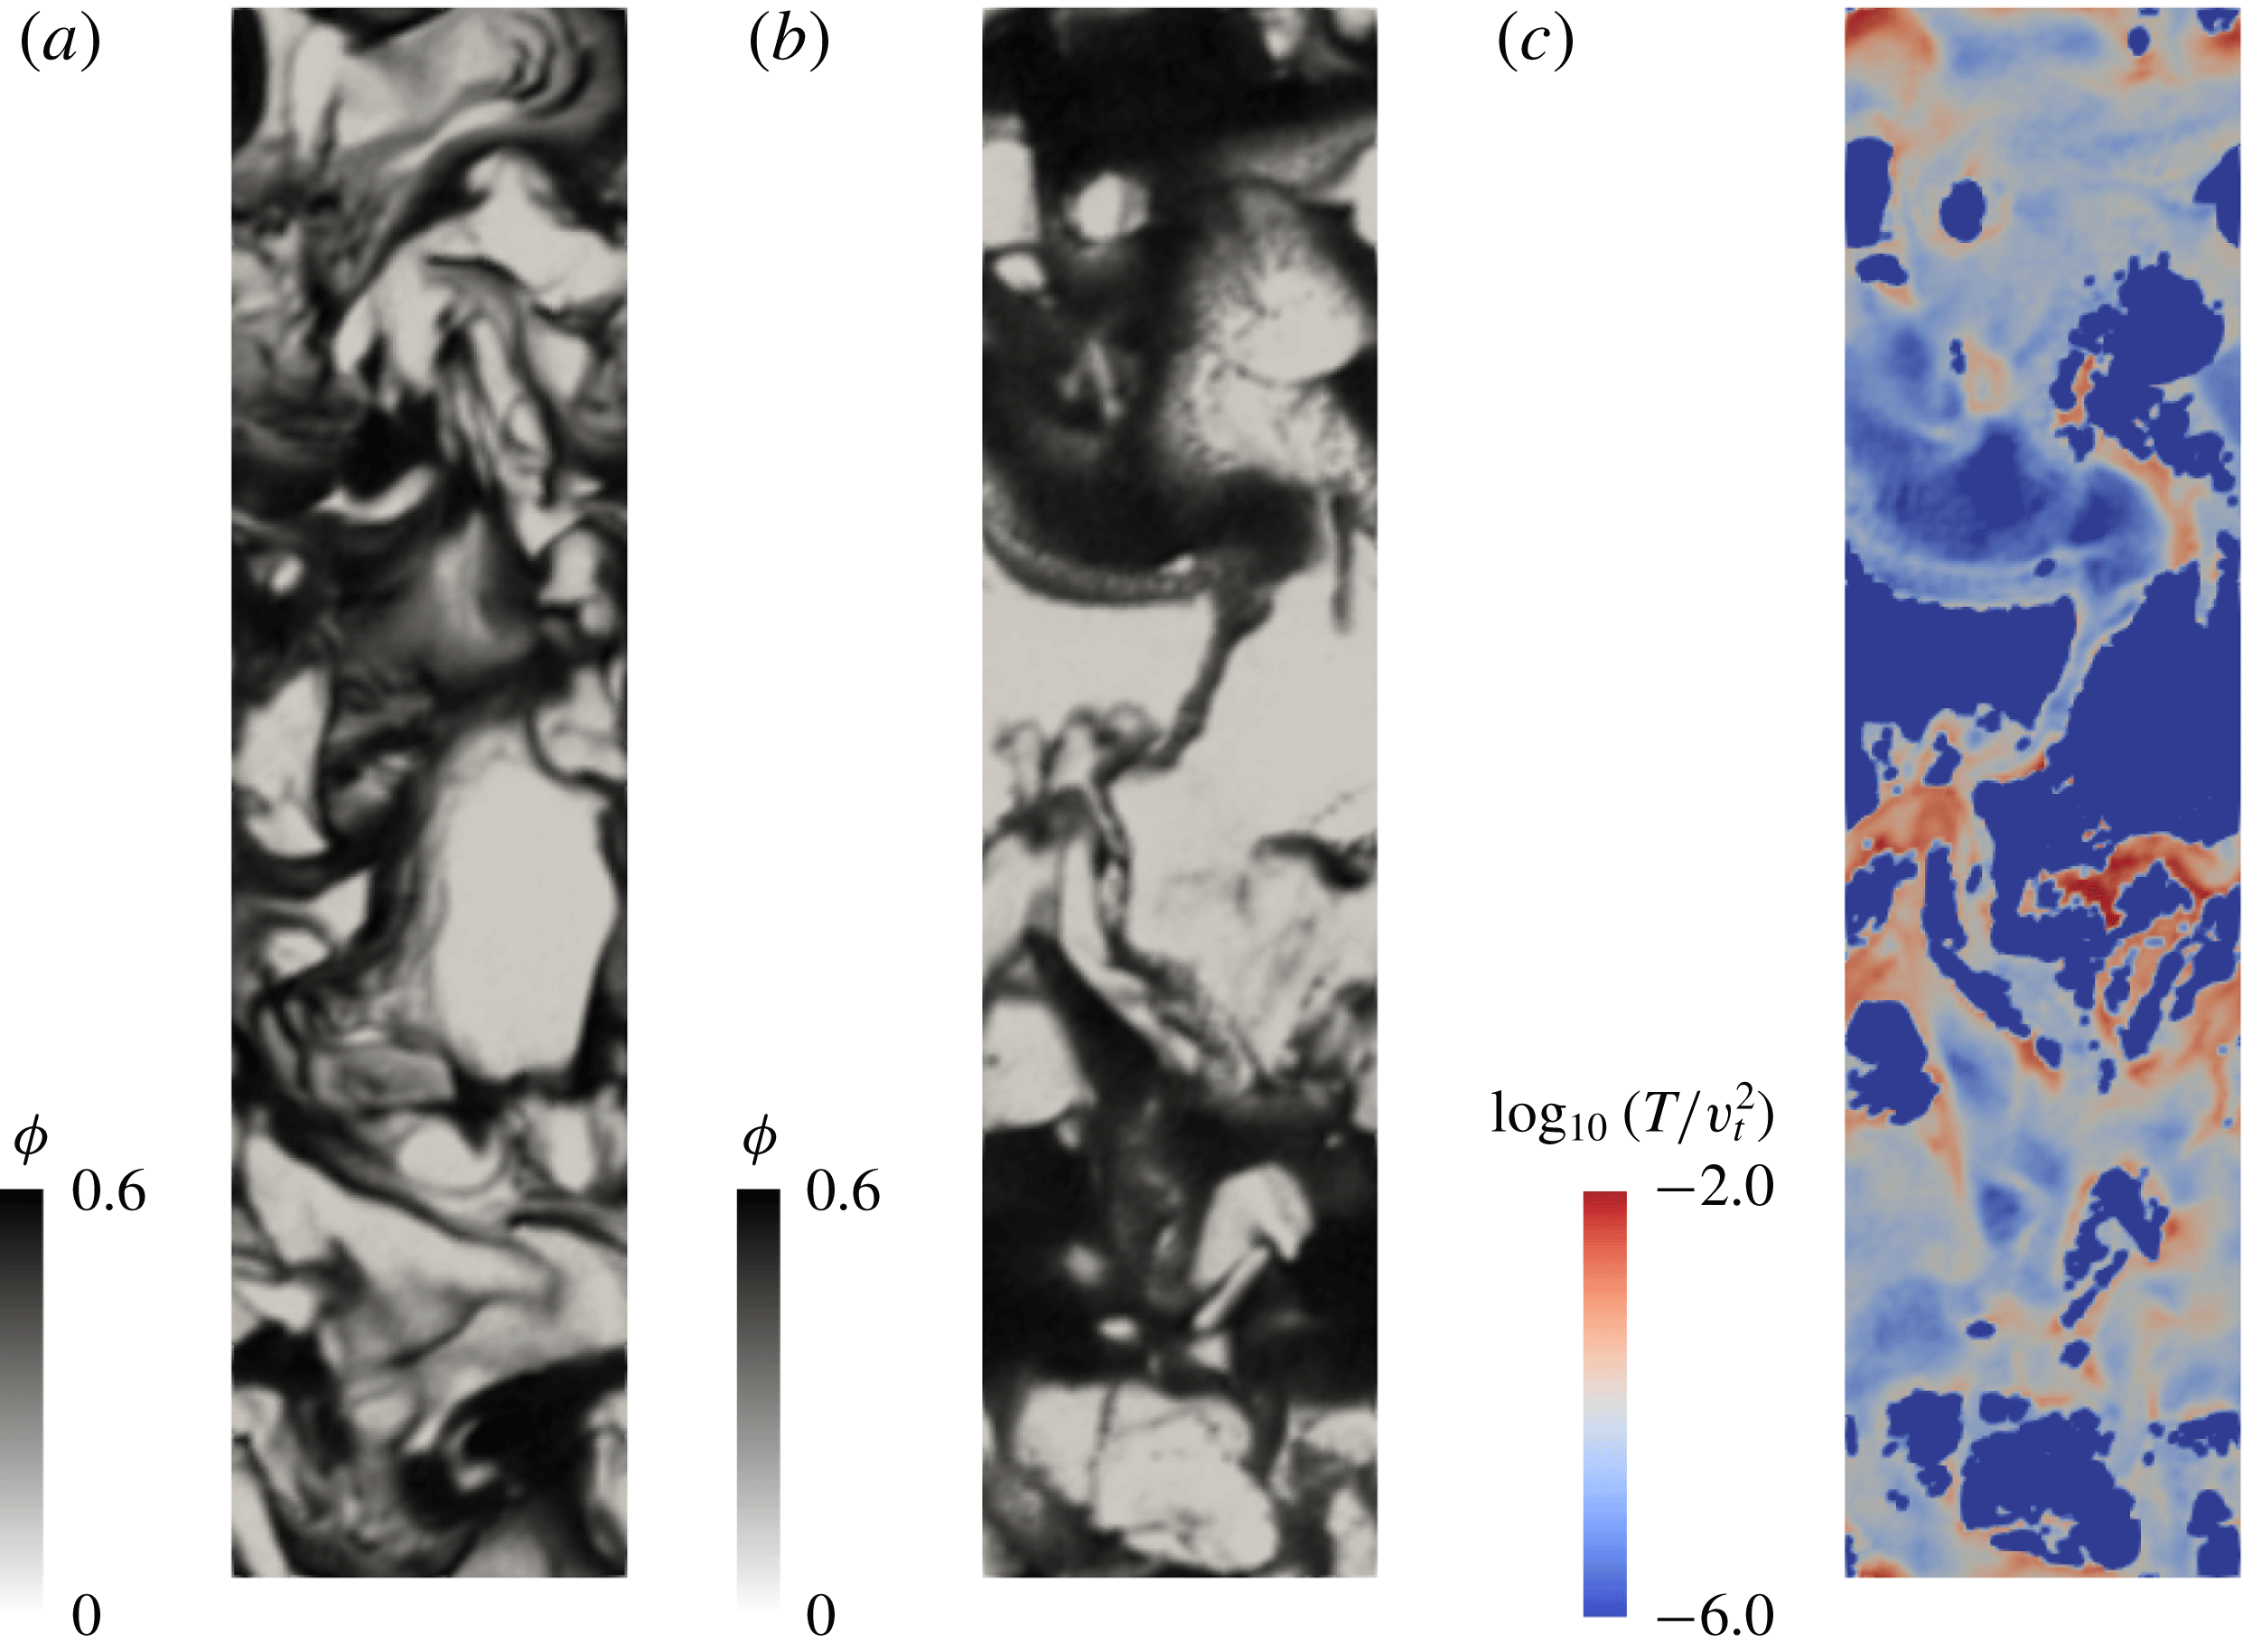
Figure 11(a,b) shows solid volume fraction on the
 $y$
–
 $z$
plane for non-cohesive and high cohesive cases, respectively. As expected, the cohesive case shows larger clusters compared with the non-cohesive case. It is also seen that there is a more uniform distribution of particles at moderate and high solid volume fractions.
Snapshots of solid volume fraction for (a) non-cohesive, (b) high cohesive cases and (c) local granular temperature for high cohesive case.
 $Fr_{p}=75$
. Domain-averaged volume fraction
 $\langle \unicode[STIX]{x1D719}\rangle =0.3$
.
Dimensionless pressure versus dimensionless granular temperature for various particle volume fractions. Data from fluidization simulations of cohesive particles;
 $Bo^{\ast }=960$
in (a) and
 $Bo^{\ast }=96$
in (b);
 $Fr_{p}=65$
;
 $\langle \unicode[STIX]{x1D719}\rangle =0.3$
.

Average coordination number versus dimensionless granular temperature for various particle volume fractions. Data from fluidization simulations of cohesive particles;
 $Bo^{\ast }=960$
;
 $Fr_{p}=65$
;
 $\langle \unicode[STIX]{x1D719}\rangle =0.3$
.


3.2.1 Pressure
It is known from previous studies (Rognon et al.
Reference Rognon, Roux, Naaïm and Chevoir2008; Gu et al.
Reference Gu, Chialvo and Sundaresan2014; Irani et al.
Reference Irani, Chaudhuri and Heussinger2014) that cohesion bifurcates the inertial regime into two regimes: a new rate-independent regime (namely cohesive regime) at low shear rates and an inertial regime at high shear rates, where Bagnold scaling is observed and cohesion has little influence. The present CFD-DEM simulations reveal both of these regimes, as shown in figure 12. We also determined the average coordination number
 $Z$
, defined as the average number of contacts per particle in each cell, and binned the results with
 $\unicode[STIX]{x1D719}$
and
 $T$
, as illustrated in figure 13. Two trends which have been reported previously for cohesive particles (Rognon et al.
Reference Rognon, Roux, Naaïm and Chevoir2008; Gu et al.
Reference Gu, Chialvo and Sundaresan2014; Irani et al.
Reference Irani, Chaudhuri and Heussinger2014) are observed. First, at low
 $T$
,
 $Z$
increases with
 $\unicode[STIX]{x1D719}$
and plateaus at high
 $\unicode[STIX]{x1D719}$
values. Second, at a given
 $\unicode[STIX]{x1D719}$
, increasing
 $T$
lowers
 $Z$
, which is indicative of the disruption of the particle contact network. This consistency in the regime transition with the previous studies manifested in both a macroscopic quantity (
 $p$
) and the microstructure (
 $Z$
) again affirms the validity of the methodology in this study.
However, different from these previous studies of cohesive particles (Rognon et al.
Reference Rognon, Roux, Naaïm and Chevoir2008; Gu et al.
Reference Gu, Chialvo and Sundaresan2014; Irani et al.
Reference Irani, Chaudhuri and Heussinger2014), the present methodology explores easily a wider parameter space; e.g. lower particle volume fractions in the low
 $T$
temperature regime, which have been difficult to access (Gu et al.
Reference Gu, Chialvo and Sundaresan2014; Irani et al.
Reference Irani, Chaudhuri and Heussinger2014). The results for this region are shown in figure 14. In this figure, to study the effects of cohesion, we subtract the contribution from collisions that are present for non-cohesive particles
 $\unicode[STIX]{x1D70C}_{s}H(\unicode[STIX]{x1D719})T$
from the total pressure
 $p$
. We focus on the low temperature region where pressure is essentially temperature independent. One can see that, as
 $\unicode[STIX]{x1D719}$
increases,
 $p-\unicode[STIX]{x1D70C}_{s}H(\unicode[STIX]{x1D719})T$
starting from
 $0$
initially decreases to become negative, and then increases.
This non-monotonic behaviour in the low temperature region can be understood physically as the following. In the low temperature region, effects from cohesion dominate over particle agitation. These effects from cohesion are manifested differently depending on the number of particles present locally. At low particle volume fractions (
 $\unicode[STIX]{x1D719}<0.2$
), where there are not enough particles to form force chains that can transmit stress over large distances (low
 $Z$
in figure 13), the attractive van der Waals interaction between particles decreases the pressure. At high particle volume fractions (
 $\unicode[STIX]{x1D719}>0.2$
), where the particles tend to form force chains (high
 $Z$
in figure 13), the pressure increases.
We model this non-monotonic behaviour manifested by
 $p-\unicode[STIX]{x1D70C}_{s}H(\unicode[STIX]{x1D719})T$
in the low temperature region as follows. At low particle volume fraction, where attractive pair interaction is the principal correction, we write:
 $$\begin{eqnarray}\displaystyle \frac{d^{2}}{F_{coh}^{max}}(p-\unicode[STIX]{x1D70C}_{s}H(\unicode[STIX]{x1D719})T)=-\unicode[STIX]{x1D6FC}_{coh,1}\unicode[STIX]{x1D719}^{2}\quad \text{for }\unicode[STIX]{x1D719}<\unicode[STIX]{x1D719}_{a}. & & \displaystyle\end{eqnarray}$$
Here,
 $\unicode[STIX]{x1D719}_{a}=0.2$
and
 $\unicode[STIX]{x1D6FC}_{coh,1}=3\times 10^{-3}$
. As shown in figure 14, this equation, denoted by a solid line, captures the data for
 $\unicode[STIX]{x1D719}<0.2$
. At high particle volume fraction, to capture the increase of pressure due to the force chains, we add a new term that is consistent with a previous study (Gu et al.
Reference Gu, Chialvo and Sundaresan2014) on the right-hand side:
 $$\begin{eqnarray}\displaystyle \frac{d^{2}}{F_{coh}^{max}}(p-\unicode[STIX]{x1D70C}_{s}H(\unicode[STIX]{x1D719})T)=-\unicode[STIX]{x1D6FC}_{coh,1}\unicode[STIX]{x1D719}^{2}+\unicode[STIX]{x1D6FC}_{coh,2}\frac{(\unicode[STIX]{x1D719}-\unicode[STIX]{x1D719}_{a})^{2}}{\unicode[STIX]{x1D719}_{c}-\unicode[STIX]{x1D719}}\quad \text{for }\unicode[STIX]{x1D719}\geqslant \unicode[STIX]{x1D719}_{a}. & & \displaystyle\end{eqnarray}$$
Here,
 $\unicode[STIX]{x1D6FC}_{coh,2}=3.4\times 10^{-3}$
. As shown in figure 14, this equation, denoted by a dashed line, captures the data for
 $\unicode[STIX]{x1D719}>0.2$
.
Assembling these models together, we obtain the following:
 $$\begin{eqnarray}\displaystyle p=\left\{\begin{array}{@{}ll@{}}\displaystyle \unicode[STIX]{x1D70C}_{s}\unicode[STIX]{x1D719}[1+2(1+e_{p})\unicode[STIX]{x1D719}g_{0}]T-\unicode[STIX]{x1D6FC}_{coh,1}\frac{F_{coh}^{max}}{d^{2}}\unicode[STIX]{x1D719}^{2}\quad & \text{for }\unicode[STIX]{x1D719}<\unicode[STIX]{x1D719}_{a}\\ \displaystyle \unicode[STIX]{x1D70C}_{s}\unicode[STIX]{x1D719}[1+2(1+e_{p})\unicode[STIX]{x1D719}g_{0}]T-\unicode[STIX]{x1D6FC}_{coh,1}\frac{F_{coh}^{max}}{d^{2}}\unicode[STIX]{x1D719}^{2}+\unicode[STIX]{x1D6FC}_{coh,2}\frac{F_{coh}^{max}}{d^{2}}\frac{(\unicode[STIX]{x1D719}-\unicode[STIX]{x1D719}_{a})^{2}}{(\unicode[STIX]{x1D719}_{c}-\unicode[STIX]{x1D719})}\quad & \text{for }\unicode[STIX]{x1D719}\geqslant \unicode[STIX]{x1D719}_{a},\end{array}\right. & & \displaystyle \nonumber\\ \displaystyle & & \displaystyle\end{eqnarray}$$
where
 $\unicode[STIX]{x1D6FC}_{coh,1}=3\times 10^{-3}$
,
 $\unicode[STIX]{x1D6FC}_{coh,2}=3.4\times 10^{-3}$
,
 $\unicode[STIX]{x1D719}_{a}=0.2$
and
 $\unicode[STIX]{x1D719}_{c}=0.61$
.
For bulk viscosity, it is found that the inclusion of cohesion has a negligible impact on the values, and thus (3.8) is applied.
3.2.2 Shear viscosity
Figure 15(a–c) displays the variation of dimensionless shear stress (
 $\unicode[STIX]{x1D70F}\equiv \unicode[STIX]{x1D707}_{s}\dot{\unicode[STIX]{x1D6FE}}$
,
 $\dot{\unicode[STIX]{x1D6FE}}\equiv \sqrt{2\unicode[STIX]{x1D64E}\boldsymbol{ :}\unicode[STIX]{x1D64E}}$
) with dimensionless granular temperature at different particle volume fractions, for both non-cohesive (a) and cohesive particles (b–c). Similar to pressure, shear stress is largely unaffected by cohesion in the high
 $T$
regime, but becomes temperature independent in the low
 $T$
limit. This behaviour is consistent with previous findings (Gu et al.
Reference Gu, Chialvo and Sundaresan2014; Irani et al.
Reference Irani, Chaudhuri and Heussinger2014).
Figure 11(c) shows granular temperature in the y–z plane for the high cohesive case. Comparing figures 11(b) and 11(c) one can see that for high solid volume regions (clusters in the figure), the particles at boundary tend to have higher
 $T$
and thus in inertial regime. Particles inside the clusters tend to have lower
 $T$
and stay in cohesive regime.
Dimensionless shear stress versus dimensionless granular temperature for various particle volume fractions. Data from fluidization simulations of both (a) non-cohesive particles and (b,c) cohesive particles;
 $Bo^{\ast }=960$
in (b) and
 $Bo^{\ast }=96$
in (c);
 $Fr_{p}=65$
;
 $\langle \unicode[STIX]{x1D719}\rangle =0.3$
.

The variation of scaled excess shear stress with local particle volume fraction at different scaled granular temperatures. Data from fluidization simulations of cohesive particles;
 $Bo^{\ast }=960$
;
 $Fr_{p}=65$
;
 $\langle \unicode[STIX]{x1D719}\rangle =0.3$
. Data from (a) are rescaled in (b) through
 $x/W(x)$
, where
 $x=\unicode[STIX]{x1D6FC}_{W}(\unicode[STIX]{x1D70C}_{s}T/\unicode[STIX]{x1D70F}_{y})$
. Solid line in (b): equation (3.31).

The dip in the shear stress observed at the transition between these two regimes can readily be attributed to the destruction of force chains (as evidenced by a sharp decrease in
 $Z$
) by increased particle agitation. To study this dip and the low temperature region, we examine in figure 16(a) the excess shear stress, defined as the difference in the shear stress in a cohesive system and a corresponding non-cohesive system. Specifically, we plot
 $(d^{2}/F_{coh}^{max})(\unicode[STIX]{x1D707}_{s}-\unicode[STIX]{x1D707}_{s}^{\ast })\dot{\unicode[STIX]{x1D6FE}}$
, where
 $\unicode[STIX]{x1D707}_{s}^{\ast }=\text{min}(\unicode[STIX]{x1D707}_{s,g},\unicode[STIX]{x1D707}_{s,c})$
and
 $\unicode[STIX]{x1D707}_{s}$
denote viscosities of non-cohesive and cohesive systems, respectively. In order to capture the residual dependence on granular temperature, we adopt the model of Irani et al. (Reference Irani, Chaudhuri and Heussinger2014) based on the fluidity approach of Picard et al. (Reference Picard, Ajdari, Bocquet and Lequeux2002),
 $$\begin{eqnarray}\displaystyle \unicode[STIX]{x1D707}\dot{\unicode[STIX]{x1D6FE}}=\unicode[STIX]{x1D707}_{s}^{\ast }\dot{\unicode[STIX]{x1D6FE}}+\unicode[STIX]{x1D70F}_{y}\frac{W(x)}{x}. & & \displaystyle\end{eqnarray}$$
Here,
 $\unicode[STIX]{x1D70F}_{y}$
is the yield stress;
 $W(x)$
is the Lambert–W function, which is defined as
 $W^{-1}(z)=z\exp (z)$
. For computation, its principal branch (
 $x>0$
) can be approximated (Winitzki Reference Winitzki, Kumar, Gavrilova, Kenneth Tan and L’Ecuyer2003) as
 $W(x)\approx [2\ln (1+0.8842y)-\ln (1+0.9294\ln (1+0.5106y))-1.213]/[1+1/(2\ln (1+0.8842y)+4.688)]$
, where
 $y=\sqrt{2ex+2}$
. Here,
 $e$
is Napier’s constant. As detailed by Irani et al. (Reference Irani, Chaudhuri and Heussinger2014),
 $W(x)/x$
captures the competition between kinetic energy supplied by shear and the cohesive energy. Correspondingly, we set
 $x=f_{1}(\unicode[STIX]{x1D719})\unicode[STIX]{x1D70C}_{s}Td^{2}/F_{coh}^{max}$
. Similar to the expression for pressure, the yield stress
 $\unicode[STIX]{x1D70F}_{y}$
has the form
 $\unicode[STIX]{x1D70F}_{y}=f_{2}(\unicode[STIX]{x1D719})F_{coh}^{max}/d^{2}$
.
Thus, (3.29) becomes,
 $$\begin{eqnarray}\displaystyle f_{2}(\unicode[STIX]{x1D719})=\frac{d^{2}}{F_{coh}^{max}}\frac{f_{1}(\unicode[STIX]{x1D719})\displaystyle \frac{\unicode[STIX]{x1D70C}_{s}Td^{2}}{F_{coh}^{max}}}{W\left(f_{1}(\unicode[STIX]{x1D719})\displaystyle \frac{\unicode[STIX]{x1D70C}_{s}Td^{2}}{F_{coh}^{max}}\right)}(\unicode[STIX]{x1D707}\dot{\unicode[STIX]{x1D6FE}}-\unicode[STIX]{x1D707}^{\ast }\dot{\unicode[STIX]{x1D6FE}}). & & \displaystyle\end{eqnarray}$$
We find
 $f_{1}(\unicode[STIX]{x1D719})$
and
 $f_{2}(\unicode[STIX]{x1D719})$
as follows: at various chosen
 $\unicode[STIX]{x1D719}$
values, we demand that equation (3.30) be satisfied at two temperatures. Such an analysis leads to us conclude that
 $f_{1}(\unicode[STIX]{x1D719})$
and
 $1/f_{2}(\unicode[STIX]{x1D719})$
have essentially the same
 $\unicode[STIX]{x1D719}$
dependence. Therefore,
 $x=f_{1}(\unicode[STIX]{x1D719})\unicode[STIX]{x1D70C}_{s}Td^{2}/F_{coh}^{max}\sim (1/f_{2}(\unicode[STIX]{x1D719}))(\unicode[STIX]{x1D70C}_{s}Td^{2}/F_{coh}^{max})\sim \unicode[STIX]{x1D70C}_{s}T/\unicode[STIX]{x1D70F}_{y}$
. Within the framework of the computationally deduced model, the
 $\unicode[STIX]{x1D719}$
dependence of
 $\unicode[STIX]{x1D70F}_{y}$
as denoted by
 $f_{2}(\unicode[STIX]{x1D719})$
is simply correlated as
 $$\begin{eqnarray}\displaystyle \unicode[STIX]{x1D70F}_{y}=\frac{f_{\unicode[STIX]{x1D719}}(\unicode[STIX]{x1D719})}{\unicode[STIX]{x1D719}_{c}-\unicode[STIX]{x1D719}}\frac{F_{coh}^{max}}{d^{2}}, & & \displaystyle\end{eqnarray}$$
where
 $f_{\unicode[STIX]{x1D719}}(\unicode[STIX]{x1D719})=\unicode[STIX]{x1D719}(0.0249\unicode[STIX]{x1D719}^{3}-0.0215\unicode[STIX]{x1D719}^{2}+0.0048\unicode[STIX]{x1D719}+0.0005)$
. Correspondingly,
 $x=\unicode[STIX]{x1D6FC}_{W}(\unicode[STIX]{x1D70C}_{s}T/\unicode[STIX]{x1D70F}_{y})$
, where
 $\unicode[STIX]{x1D6FC}_{W}=14$
.
Using the
 $x/W(x)$
scaling from the fluidity approach where
 $x$
is defined as above, the data points from different temperatures shown in figure 16(a) are now collapsed onto a single curve in (b). This collapse of data is captured by (3.31), as denoted by the solid line in the figure.
Thus, we have the final shear viscosity model for cohesive particles:
 $$\begin{eqnarray}\displaystyle \unicode[STIX]{x1D707}=\unicode[STIX]{x1D707}_{s}^{\ast }+\frac{\unicode[STIX]{x1D70F}_{y}}{\dot{\unicode[STIX]{x1D6FE}}}\frac{W\left(\unicode[STIX]{x1D6FC}_{W}\displaystyle \frac{\unicode[STIX]{x1D70C}_{s}T}{\unicode[STIX]{x1D70F}_{y}}\right)}{\unicode[STIX]{x1D6FC}_{W}\displaystyle \frac{\unicode[STIX]{x1D70C}_{s}T}{\unicode[STIX]{x1D70F}_{y}}}. & & \displaystyle\end{eqnarray}$$
It should be noted that this yield-stress-based model for cohesive particles is consistent with prior observations from both experiments and simulations. For fluidization of Geldart Group A particles (Geldart Reference Geldart1973), for which inter-particle van der Waals forces start to become important compared to particle weight, a bubbleless expanded regime is observed in both experiments (Geldart Reference Geldart1973; Menon & Durian Reference Menon and Durian1997) and simulations (Hou, Zhou & Yu Reference Hou, Zhou and Yu2012; Gu et al.
Reference Gu, Ozel and Sundaresan2016b
). Both experiments (Geldart Reference Geldart1973; Menon & Durian Reference Menon and Durian1997) and simulations (Hou et al.
Reference Hou, Zhou and Yu2012; Gu et al.
Reference Gu, Ozel and Sundaresan2016b
) found that particles are essentially in a static state in this regime. This regime corresponds to the case where the shear stress supplied in the system does not overcome the yield stress
 $\unicode[STIX]{x1D70F}_{y}$
. Furthermore, it has been found in these experimental and simulation studies that the formation of this regime depends on particle volume fraction of the system, which is consistent with the dependence of
 $\unicode[STIX]{x1D70F}_{y}$
on particle volume fraction
 $\unicode[STIX]{x1D719}$
.
3.2.3 Pseudo-thermal energy balance
Similar to the analysis on non-cohesive particles, figure 17 shows the variation of
 $(-\unicode[STIX]{x1D748}\boldsymbol{ : }\unicode[STIX]{x1D735}\boldsymbol{u}_{\boldsymbol{s}})$
with temperature at three different volume fractions. At high
 $T$
, cohesion has little effect. However, the cohesive systems differ noticeably from the non-cohesive case at low temperatures; this behaviour can be explained by two hypotheses: (i) the part of (
 $-\unicode[STIX]{x1D748}\boldsymbol{ : }\unicode[STIX]{x1D735}\boldsymbol{u}_{\boldsymbol{s}}$
) associated with cohesive yield stress is not a source of PTE or (ii) there is an additional rate of PTE dissipation associated with the cohesive yield stress. There is precedence in the literature for the first argument. For example, in frictional–kinetic models, only the kinetic part of the stress is recognized as a source in the PTE balance in a number of studies (Ocone, Sundaresan & Jackson Reference Ocone, Sundaresan and Jackson1993; Alam & Nott Reference Alam and Nott1997; Srivastava & Sundaresan Reference Srivastava and Sundaresan2003). In this spirit, we identify
 $-\unicode[STIX]{x1D748}\boldsymbol{ : }\unicode[STIX]{x1D735}\boldsymbol{u}_{\boldsymbol{s}}-\dot{\unicode[STIX]{x1D6FE}}\unicode[STIX]{x1D70F}_{y}W(x)/x$
as the source of PTE.
Dimensionless rate of production of PTE by shear versus dimensionless granular temperature for various particle volume fractions. Data from fluidization simulations of cohesive particles; rate of production of PTE is triple binned by particle volume fraction, granular temperature and rate of dilation. The data are then processed by conditioning on the rate of dilation being zero, and plotted here for;
 $Bo^{\ast }=960$
;
 $Fr_{p}=65$
;
 $\langle \unicode[STIX]{x1D719}\rangle =0.3$
. Solid lines: equations (3.24) (3.21) (3.34).

Regarding the dissipation term of PTE by inter-particle collisions, cohesion is known (from both experiments (Kim & Dunn Reference Kim and Dunn2007) and simulations (Murphy & Subramaniam Reference Murphy and Subramaniam2015; Gu et al.
Reference Gu, Ozel and Sundaresan2016a
; Kellogg et al.
Reference Kellogg, Liu, LaMarche and Hrenya2017)) to alter the effective restitution coefficient for a two-particle collision. When two cohesive particles undergo a head-on collision, the effective restitution coefficient goes to zero as the impact velocity drops below some critical value; the effective restitution coefficient approaches the non-cohesive limit at high impact velocities. Based on energy balance, a relation has been derived and verified with particle–surface collision experiments (Kim & Dunn Reference Kim and Dunn2007; Gu et al.
Reference Gu, Ozel and Sundaresan2016a
) to connect the effective restitution coefficient for cohesive particles
 $e_{coh}$
to the one for non-cohesive particles
 $e_{eff}$
(accounting for inelasticity and friction only). Replacing the impact velocity
 $v_{impact}$
with granular temperature
 $T$
as
 $T=v_{impact}^{2}$
, we have the following relation
 $$\begin{eqnarray}\displaystyle e_{coh}=\sqrt{e_{eff}^{2}-\frac{\unicode[STIX]{x1D6FC}_{e}F_{coh}^{max}d}{mT}}. & & \displaystyle\end{eqnarray}$$
PTE balance now becomes
 $$\begin{eqnarray}\displaystyle -\unicode[STIX]{x1D748}\boldsymbol{ : }\unicode[STIX]{x1D735}\boldsymbol{u}_{\boldsymbol{s}}-\dot{\unicode[STIX]{x1D6FE}}\unicode[STIX]{x1D70F}_{y}W(x)/x=\text{min}(J_{coll,g}(e_{coh}),J_{coll,c}(e_{coh})), & & \displaystyle\end{eqnarray}$$
where
 $\unicode[STIX]{x1D6FC}_{e}$
is fit to be
 $1\times 10^{-7}$
. As shown in figure 17, this equation captures all the regimes as well as the transitions between them.
3.2.4 Summary
Analysis of the results obtained with cohesive particles reveals the following. First, the cohesion introduces a correction to the pressure, which could be non-negligible at low
 $T$
values. Second, the cohesive system manifests a yield stress, whose decreasing strength with increasing particle agitation can be quantified via the fluidity approach. Third, cohesive interaction lowers the effective coefficient of restitution in a
 $T$
-dependent fashion that is easily rationalized based on two-particle collision studies. Table 2 includes a summary of the proposed closure models.
4 Summary
In this paper, we have formulated constitutive models for particle phase stress based on CFD-DEM simulations of gas-fluidized beds of non-cohesive and mildly cohesive (Geldart Group A) particles. Based on the simulation results, closures for pressure, bulk viscosity, shear viscosity and the rate of dissipation of the pseudo-thermal energy are proposed.
For non-cohesive particles, the present results are consistent with analytically derived kinetic-theory models in the high
 $T$
limit, confirming their validity. In addition, the present study has uncovered a low
 $T$
regime where the closures manifest different scalings and a definite dependence on gravitational acceleration.
Particles interacting through van der Waals force are then studied as a model cohesive system. Cohesion has little effect on pressure in the high
 $T$
regime. In the low
 $T$
regime, it lowers the pressure at low particle volume fractions and increases it at higher volume fractions when force chains begin to form. Cohesive systems subjected to shear manifest yield stress, whose strength increases rapidly with particle volume fraction. Interestingly, the results suggest that particle agitation lowers the effective yield stress; this weakening of the yield-stress contribution is readily accounted for in the model via the fluidity approach described previously in the literature (Picard et al.
Reference Picard, Ajdari, Bocquet and Lequeux2002; Irani et al.
Reference Irani, Chaudhuri and Heussinger2014).
The main motivation of this study is to investigate fluidization characteristics of mildly cohesive particles and how inter-play between cohesion and interstitial fluid alters mesostructures of flow and solid phase stresses. A powerful approach to modelling gas–particle flows with dynamic agglomerates is to use a population balance model coupled with Eulerian transport equations (see e.g. Marchisio, Vigil & Fox (Reference Marchisio, Vigil and Fox2003), Marchisio & Fox (Reference Marchisio and Fox2013), Kellogg et al. (Reference Kellogg, Liu, LaMarche and Hrenya2017)). In mildly cohesive systems, for example fluidization of cohesive Geldart Group A particles, a simpler approach that incorporates the effects of cohesion into stress models directly without solving an additional population balance is attractive. Previous studies such as those of Arastoopour (Reference Arastoopour2001), Kim & Arastoopour (Reference Kim and Arastoopour2002), Seu-Kim & Arastoopour (Reference Seu-Kim and Arastoopour1995), extended the standard kinetic theory of granular materials to simulate cohesive particles. In these studies and herein, we show how one can still retain the framework of the kinetic theory of granular materials to evolve the granular temperature in particulate flows, but modify it in a simple fashion to account for cohesion. This opens up the possibility of simulating fluidization behaviour of mildly cohesive (Geldart Group A (Geldart Reference Geldart1973)) particles using the kinetic-theory framework, which is widely used to simulate fluidization of non-cohesive (Geldart Group B) particles.
In this study, we considered only gas–solid flows in unbounded domains and showed that the assumption of local equilibrium of granular temperature is valid to a very good approximation. However, the presence of wall boundaries further complicates the flow behaviour and not only alters macroscale structures but also it causes production, destruction and redistribution of the granular temperature. Effects of wall boundaries on the constitutive relations are beyond the scope of this study and should be investigated in further studies.
The present approach can be applied to particles interacting through complex inter-particle forces, such as the liquid-bridge force when the particles are wet and the electrostatic force when the particles carry charges.
Normal stress components scaled by the trace of the stress versus particle volume fraction. The results are based on data from fluidization simulations of non-cohesive particles with
 $Fr_{p}=65$
performed for different domain-averaged particle volume fractions.

Acknowledgement
This work is supported by a grant from the ExxonMobil Research & Engineering Co.
Appendix A.
Figure 18 plots scaled normal stress components
 $\unicode[STIX]{x1D70E}_{i}/(1/3\text{tr}(\unicode[STIX]{x1D748}))$
against particle volume fraction
 $\unicode[STIX]{x1D719}$
. The data are from fluidization simulations of non-cohesive particles with
 $Fr_{p}=65$
. Horizontal normal stress components
 $\unicode[STIX]{x1D70E}_{xx}$
and
 $\unicode[STIX]{x1D70E}_{yy}$
are indistinguishable, to within computational accuracy. At higher volume fractions, the variation of stress is under
 $\pm 20\,\%$
. As volume fraction decreases, the anisotropy increases. This behaviour is expected as there are fewer collisions at lower volume fractions.
Appendix B. Effect of microscopic drag law on constitutive relations
To study the effects of the microscopic drag law on the constitutive relations, we performed an additional simulation with Beetstra’s drag law (Beetstra, van der Hoef & Kuipers Reference Beetstra, van der Hoef and Kuipers2007). In this simulation, the domain size is
 $180d_{p}\times 180d_{p}\times 720d_{p}$
with a particle diameter of
 $145~\unicode[STIX]{x03BC}\text{m}$
and domain-averaged solid volume fraction
 $\langle \unicode[STIX]{x1D719}\rangle$
of
 $0.1$
. We generated figure 3(b) (scaled solid pressure versus solid volume fraction) of the manuscript and the scaled solid shear viscosity versus scaled granular temperature for Beetstra’s drag law, which is shown in figure 19. These figures show that the dependency of solid pressure and shear viscosity is essentially independent of choice of the microscopic drag law.
(a) Pressure scaled by granular temperature versus local particle volume fraction and (b) shear viscosity versus granular temperature for the Wen & Yu (Reference Wen and Yu1966) and Beetstra et al. (Reference Beetstra, van der Hoef and Kuipers2007) drag laws. In the legend, W–Y and B denote Wen & Yu and Beetstra drag laws, respectively. Particle diameters
 $d_{p}$
are
 $75~\unicode[STIX]{x03BC}\text{m}$
and
 $145~\unicode[STIX]{x03BC}\text{m}$
for Wen & Yu and Beetstra et al. cases, respectively. Domain-averaged solid volume fraction
 $\langle \unicode[STIX]{x1D719}\rangle =0.1$
.

Changing the drag law can alter the details of the mesoscale structure and the prevailing granular temperature; however, as is clear from the comparison we show here, the drag law does not have any systematic effect on the relationship between particle phase viscosity and granular temperature. In other words, in our simulations, the fluid–particle drag principally supplies energy to sustain the fluctuating motion of the particles in this dissipative system.
Appendix C. Effect of mapping mesh size on constitutive relations
The computed Eulerian particle velocity
 $\boldsymbol{u}_{s}$
and granular temperature
 $T$
are dependent on the mapping mesh size selection. To study the mesh dependency of these variables, we mapped particle velocity and solid volume fraction on a mesh size of
 $4d_{p}$
and
 $5d_{p}$
. It is worth remembering that the mesh size and the CFD grid size are
 $3d_{p}$
in our reference case. Figure 20 shows the scaled solid pressure versus solid volume fraction for various mapping cell sizes. The discrepancy from Lun et al. (Reference Lun, Savage, Jeffrey and Chepurniy1984) increases as the mapping mesh size increases. It is expected that, with larger mesh size, we account for inhomogeneities from averaging whereas the kinetic theory uses the assumption of homogeneous distribution of particles in a control volume.
Pressure scaled by granular temperature versus particle volume fraction for various mapping mesh sizes.
 $Fr_{p}=65$
;
 $\langle \unicode[STIX]{x1D719}\rangle =0.1$
.

Capecelatro et al. (Reference Capecelatro, Desjardins and Fox2015) stated that computed statistics, such as particle fluctuating energy, were independent of the number of particles if the number of particles inside a cell volume is greater than
 $10$
. We have checked the number of particles in a cell volume in the range of volume fractions (
 $0.1<\unicode[STIX]{x1D719}<0.6$
) that we have studied. As an example, we have approximately 10 particles inside the filtering volume with the smallest cell size of
 $\unicode[STIX]{x1D6E5}=3d_{p}$
at the filtered solid volume fraction
 $\unicode[STIX]{x1D719}=0.2$
which should give adequate statistics.
Appendix D. Number of realizations of macroscopic quantities
Figure 21 shows how frequently local variables of granular temperature and particle volume fraction take different values. The numbers in this figure are per snapshot, and we typically use data from more than eight snapshots. As exemplified in the figure, all analyses in the manuscript are based on a parameter space where enough statistics have been collected, as one can confirm by comparing the figure here with other figures in the manuscript; specifically, in each bin (characterized by a set of
 $\unicode[STIX]{x1D719}$
and
 $T$
) from which the result is averaged, we have collected over
 ${\sim}100$
data points.
Collection of statistics for a given local granular temperature and local particle volume fraction, based on data from a single snapshot. Non-cohesive particles with
 $Fr_{p}=65$
and
 $\langle \unicode[STIX]{x1D719}\rangle =0.3$
.