I. INTRODUCTION
The crystallite size and lattice strain are quantities often obtained from X-ray powder diffraction patterns. Several methods can be used to obtain these quantities, such as the Scherrer equation (Patterson, Reference Patterson1939; Azároff and Buerger, Reference Azároff and Buerger1958; Klug and Alexander, Reference Klug and Alexander1974; Langford and Wilson, Reference Langford and Wilson1978; Vives et al., Reference Vives, Gaffet and Meunier2004; Burton et al., Reference Burton, Ong, Rea and Chan2009; Holzwarth and Gibson, Reference Holzwarth and Gibson2011) Warren/Averbach Fourier decomposition (Warren and Averbach, Reference Warren and Averbach1950), Williamson–Hall plot (Hall, Reference Hall1949; Williamson and Hall, Reference Williamson and Hall1953), Whole Powder Pattern Modeling – WPPM (Scardi et al., Reference Scardi, Ortolani and Leoni2010) and Debye Function Analysis (Cervellino et al., Reference Cervellino, Frison, Bertolotti and Guagliardi2015). Among these methods, the Scherrer equation and the Williamson–Hall plot are arguably the easiest to apply which makes them widely used, despite being rough approximations. In the Scherrer equation, the volume averaged crystal size for the column underlying the hkl direction depends on the full width at half maximum of the diffraction peak by the following equation:
 $$D = \displaystyle{{k\lambda} \over {\beta \;\cos \theta}}, $$
in which D is the crystallite size, β is the full width at half maximum, λ is the X-ray wavelength, θ is the Bragg angle of the reflection under consideration, and k is a constant related to the shape and symmetry of the crystallite and is approximately 1 for a spherical crystallite (James, Reference James1962; Langford and Wilson, Reference Langford and Wilson1978). In the Williamson–Hall plot, the width β is treated as a linear combination of the effects of size, β D, and lattice strain, β S: β = β D + β S. These are very crude models but still, are useful when comparing samples prepared in a series in which one parameter is varied, for example, calcination time.
To apply some of the models mentioned above, it is necessary to remove the effect of the instrumental broadening from the diffraction peak. This is achieved by measuring β in a polycrystalline sample free of lattice strain and with a very large crystallite size so that all the width of the diffraction peak is because of the instrumental effects. Nowadays, one of the main samples used for this purpose is the reference material LaB6 (SRM660b) commercialized by the National Institute of Standard Technology – NIST (Black et al., Reference Black, Windover, Henins, Filliben and Cline2010), which can be considered expensive for researchers in developing countries. Other samples can also be used, for example, Courbion and Ferey (Reference Courbion and Ferey1988) synthesized Na2Ca3Al2F14 (not certified by NIST) that was used by Gozzo et al. (Reference Gozzo, De Caro, Giannini, Guagliardi, Schmitt and Prodi2006) to remove the instrumental width of a synchrotron source obtaining the smallest intrinsic width known by the authors.
In this work, the authors present a co-precipitation synthesis route combined with a calcination step at a high temperature to obtain polycrystalline CeO2 suitable for use as a line width reference sample. The authors show that the diffraction patterns of the CeO2 samples prepared with this route have diffraction peak widths as sharp as the LaB6, and therefore can substitute the latter as a line profile reference material. This route has the advantage of being simple and less expensive than to acquire the SRM660b.
II. EXPERIMENTAL
A. Specimen preparation
The cerium oxide (CeO2) samples were synthesized by first dissolving 15 g of cerium sulfate tetra-hydrate (Ce[SO4]2 · 4H2O), reagent from Sigma Aldrich with purity >98%, in 100 ml of distilled water at room temperature. This solution was kept under constant agitation using a magnetic stirrer and at the end of 15 min, the cerium sulfate was completely dissolved. Second, 25 ml of ammonium hydroxide (NH4OH), reagent from Dinâmica with 26% NH3, was slowly added to this solution. During this process, which took 20 min, the solution was also kept under constant agitation. The result was the formation of a precipitate. Third, this mixture was placed on a Falcon® tube and centrifuged at 1500 r.p.m. (25 Hz) for 5 min and the supernatant was removed. Distilled water was added to the Falcon® tube and the mixture was centrifuged again. This washing process was repeated six times. A sample of this precipitate was dried at 100 °C and X-ray powder diffraction measurements showed it was nanocrystalline CeO2. Audebrand et al. (Reference Audebrand, Auffrédic and Louër2000) used a similar route to obtain CeO2 nanoparticles. It is believed that the mixture of cerium (IV) sulfate and ammonium hydroxide creates a hydrous oxide CeO2 · xH2O which decomposes to CeO2 (Audebrand et al., Reference Audebrand, Auffrédic and Louër2000; Tok et al., Reference Tok, Boey, Dong and Sun2007).
Fourth, the precipitate was added to 25 ml of an aqueous solution containing 20% of hydrogen peroxide and kept under agitation for 60 min using a magnetic stirrer, for cleaning purposes, removing any organic impurities (Mikutta et al., Reference Mikutta, Kleber, Kaiser and Jahn2005). This step does not interfere with the CeO2. This mixture of CeO2 and water was taken to a furnace to dry at 100 °C and the resulting powder was ground in an agate mortar.
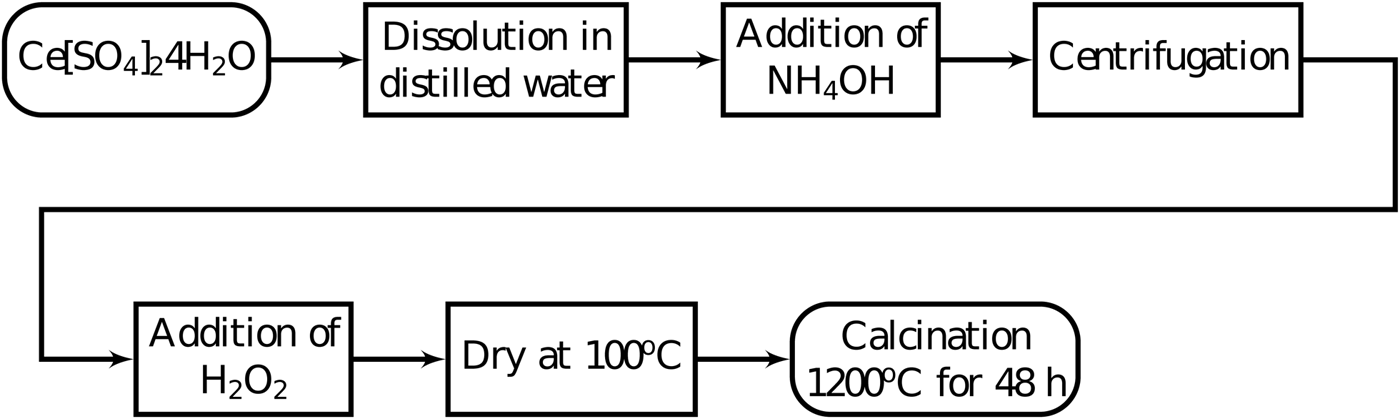
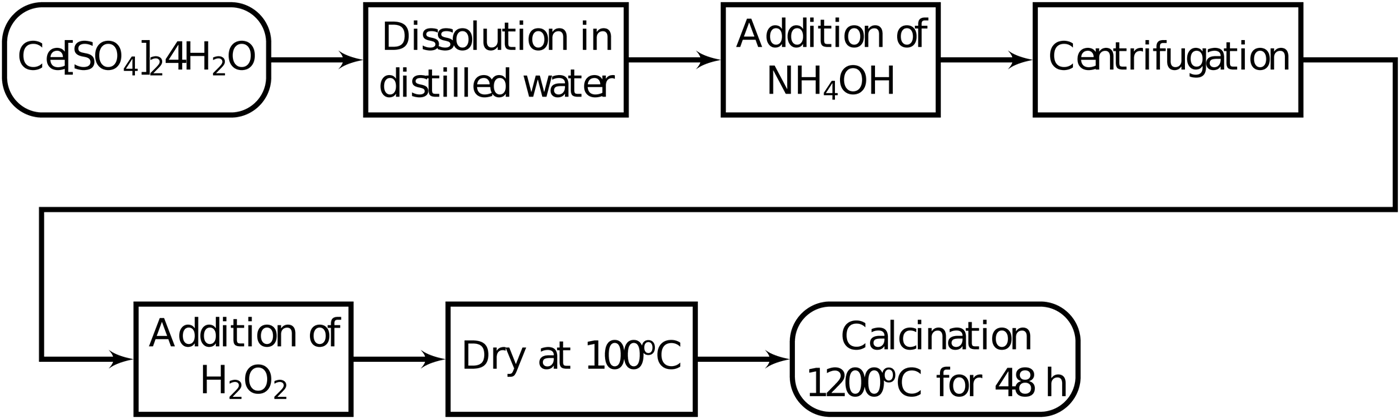
X-ray powder diffraction measurements showed very broad peaks indicating that the powder was formed of nanoparticles. The nanoparticles were exposed to air and did not present apparent instability. However, the authors recommend the specimen to be stored in a manner to avoid humidity. This powder was then calcined at 1200 °C for 48 h in a rotary tube furnace for particle growth (Braga et al., Reference Braga, Dias, Sousa, Soares and Sasaki2015; Guimarães et al., Reference Guimarães, Sasaki, Sousa, Miranda, Carvalho, Menezes and Oliveira2015). Two heating rates were tested in the calcination step, 5 and 15 °C min−1. Figure 1 shows the summary of these steps.
Co-precipitation synthesis steps to synthesize cerium oxide to use as a reference material for X-ray diffraction peak widths.
B. Experimental methods
The X-ray powder diffraction measurements were done on a laboratory setup and at a synchrotron facility. The laboratory setup was a Xpert Pro MPD – PANalytical diffractometer, using CoKα (λ = 1.7889 Å) radiation at 40 kV and 40 mA in parallel beam geometry using a hybrid monochromator composed of one mirror and two Ge (220) crystals. The height of the X-ray beam emerging from the hybrid monochromator was 1.2 mm. Divergence slits of 1/8° and diffracted beam Soller slits of 0.02 rad were used to control axial divergence. The full width at half maximum of the Si(111) reflection of a Si single crystal reference sample was approximately 0.0068°. The diffraction patterns were obtained from 2θ = 20° to 120° with steps of 0.013° in 150 min. The specimen in this diffractometer was prepared over a zero-background silicon plate with a diameter of 25 and 2 mm thickness, containing a cavity with a diameter of 10 mm and depth of 0.2 mm.
High-resolution synchrotron powder diffraction data were collected using beamline 11-BM at the Advanced Photon Source, Argonne National Laboratory using an average wavelength of 0.41 Å. Discrete detectors covering an angular range from 6 to 16° 2θ are scanned over a 34° 2θ range, with data points collected every 0.001° 2θ and scan speed of 0.01°/s. The beam divergence at 30 keV was 0.005° (Wang et al., Reference Wang, Toby, Lee, Ribaud, Antao, Kurtz, Ramanathan, Von Dreele and Beno2008). A Kapton capillary of the inner diameter of 0.8 mm was filled with 8 to 10 mm of the sample and closed in both extremities with play dough.
The full width at half maximum was obtained by fitting the diffraction peaks with a Split-pseudoVoigt function. This function has two parameters for peak width, one for each side of the peak, so that it can try to account for asymmetry. The software used for this purpose was the Xpert High Score from PANalytical (Degen et al., Reference Degen, Sadki, Bron, König and Nénert2014).
The micrographs were obtained in a TM-3000 Hitachi scanning electron microscope using 30 000× magnification and operating at 15 kV.
III. RESULTS AND DISCUSSION
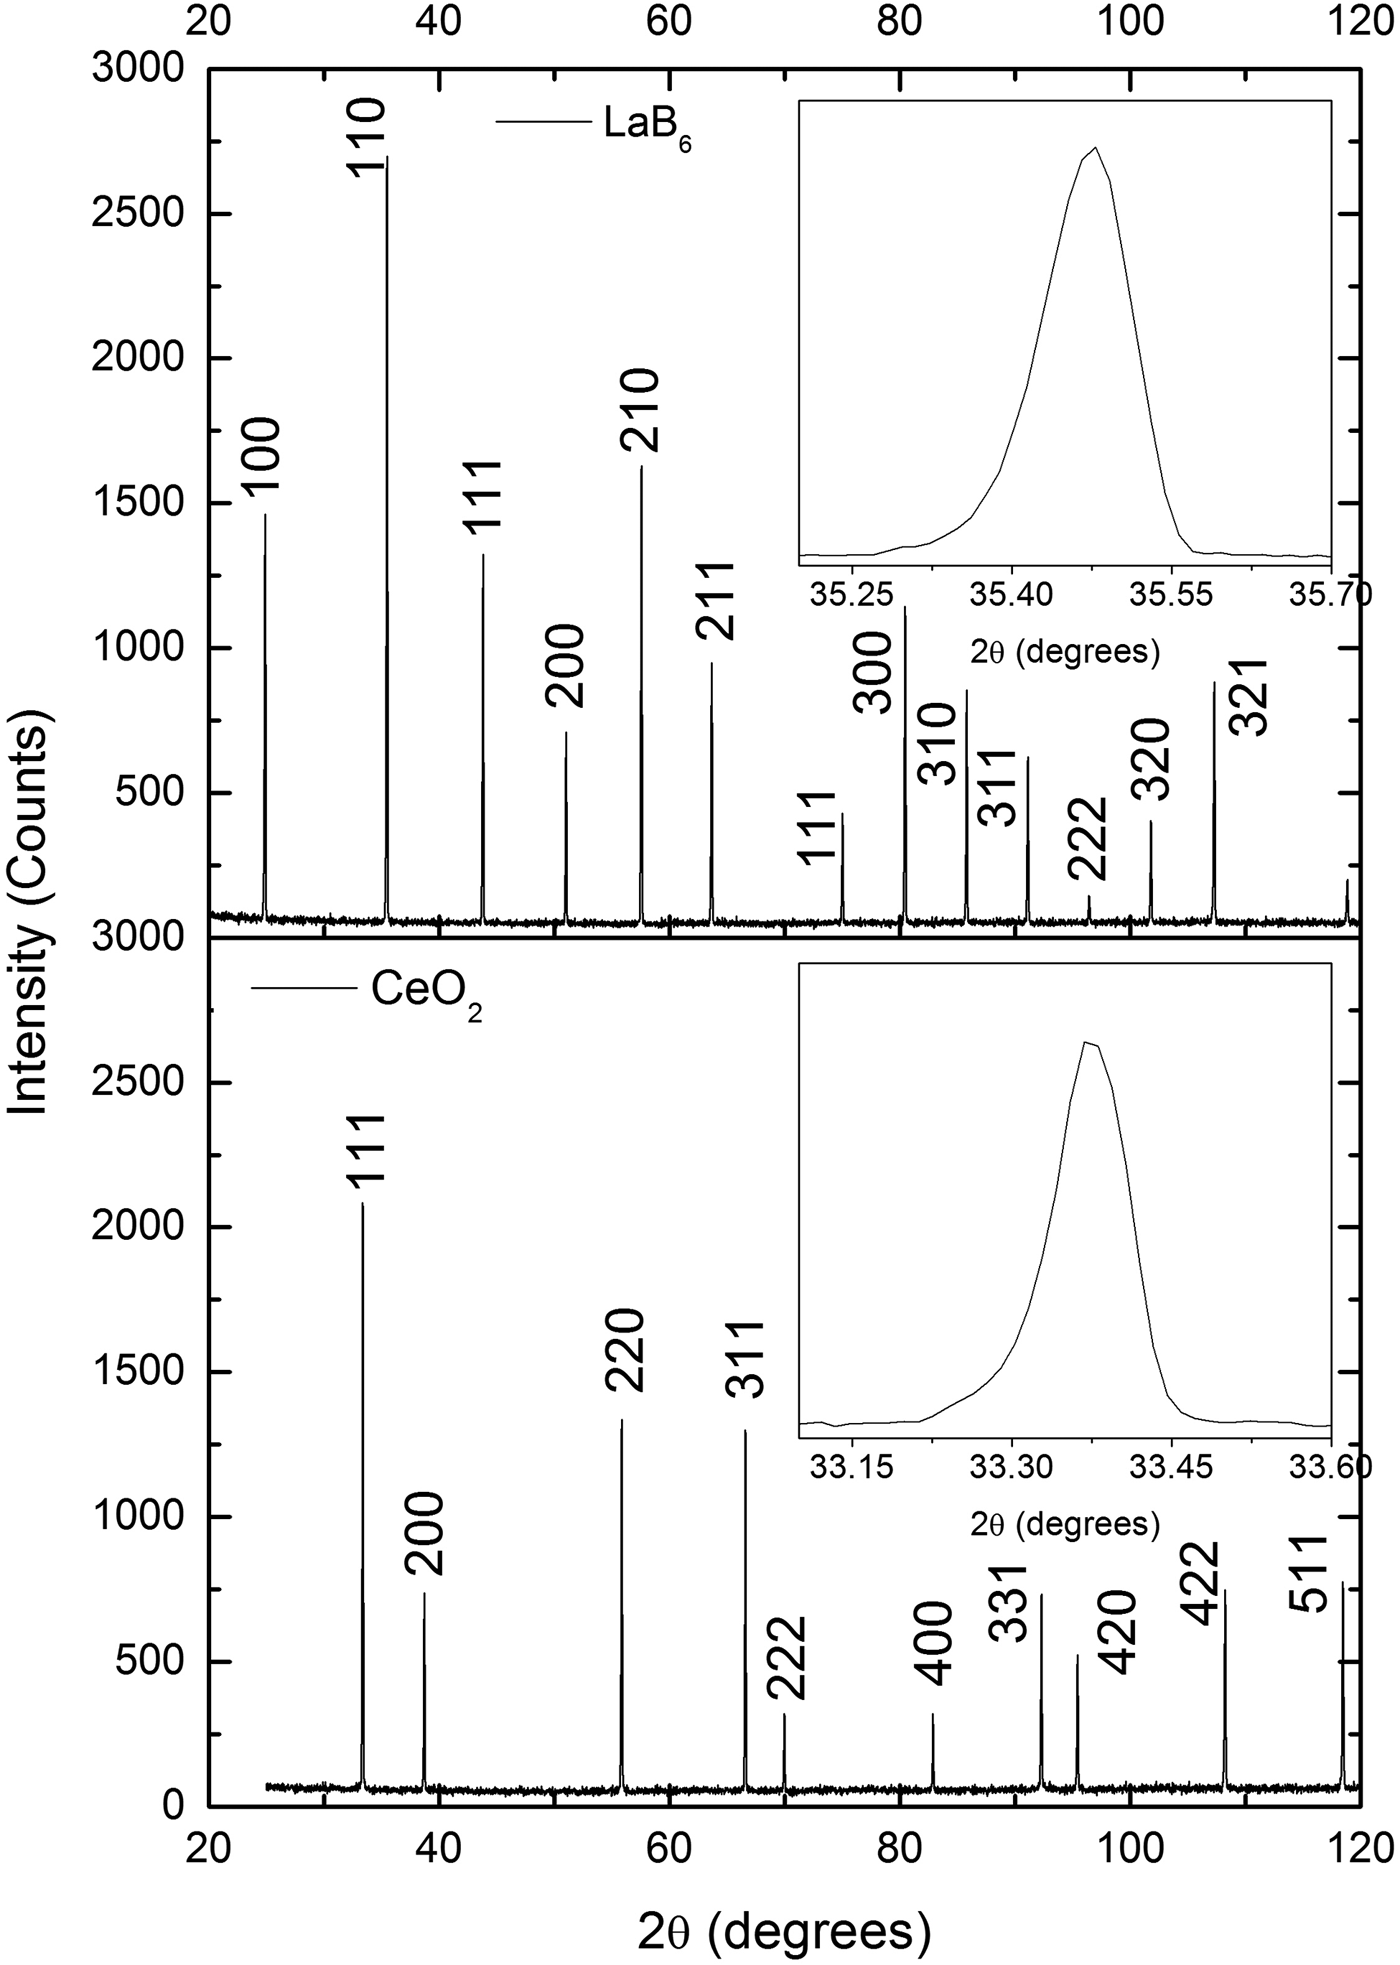
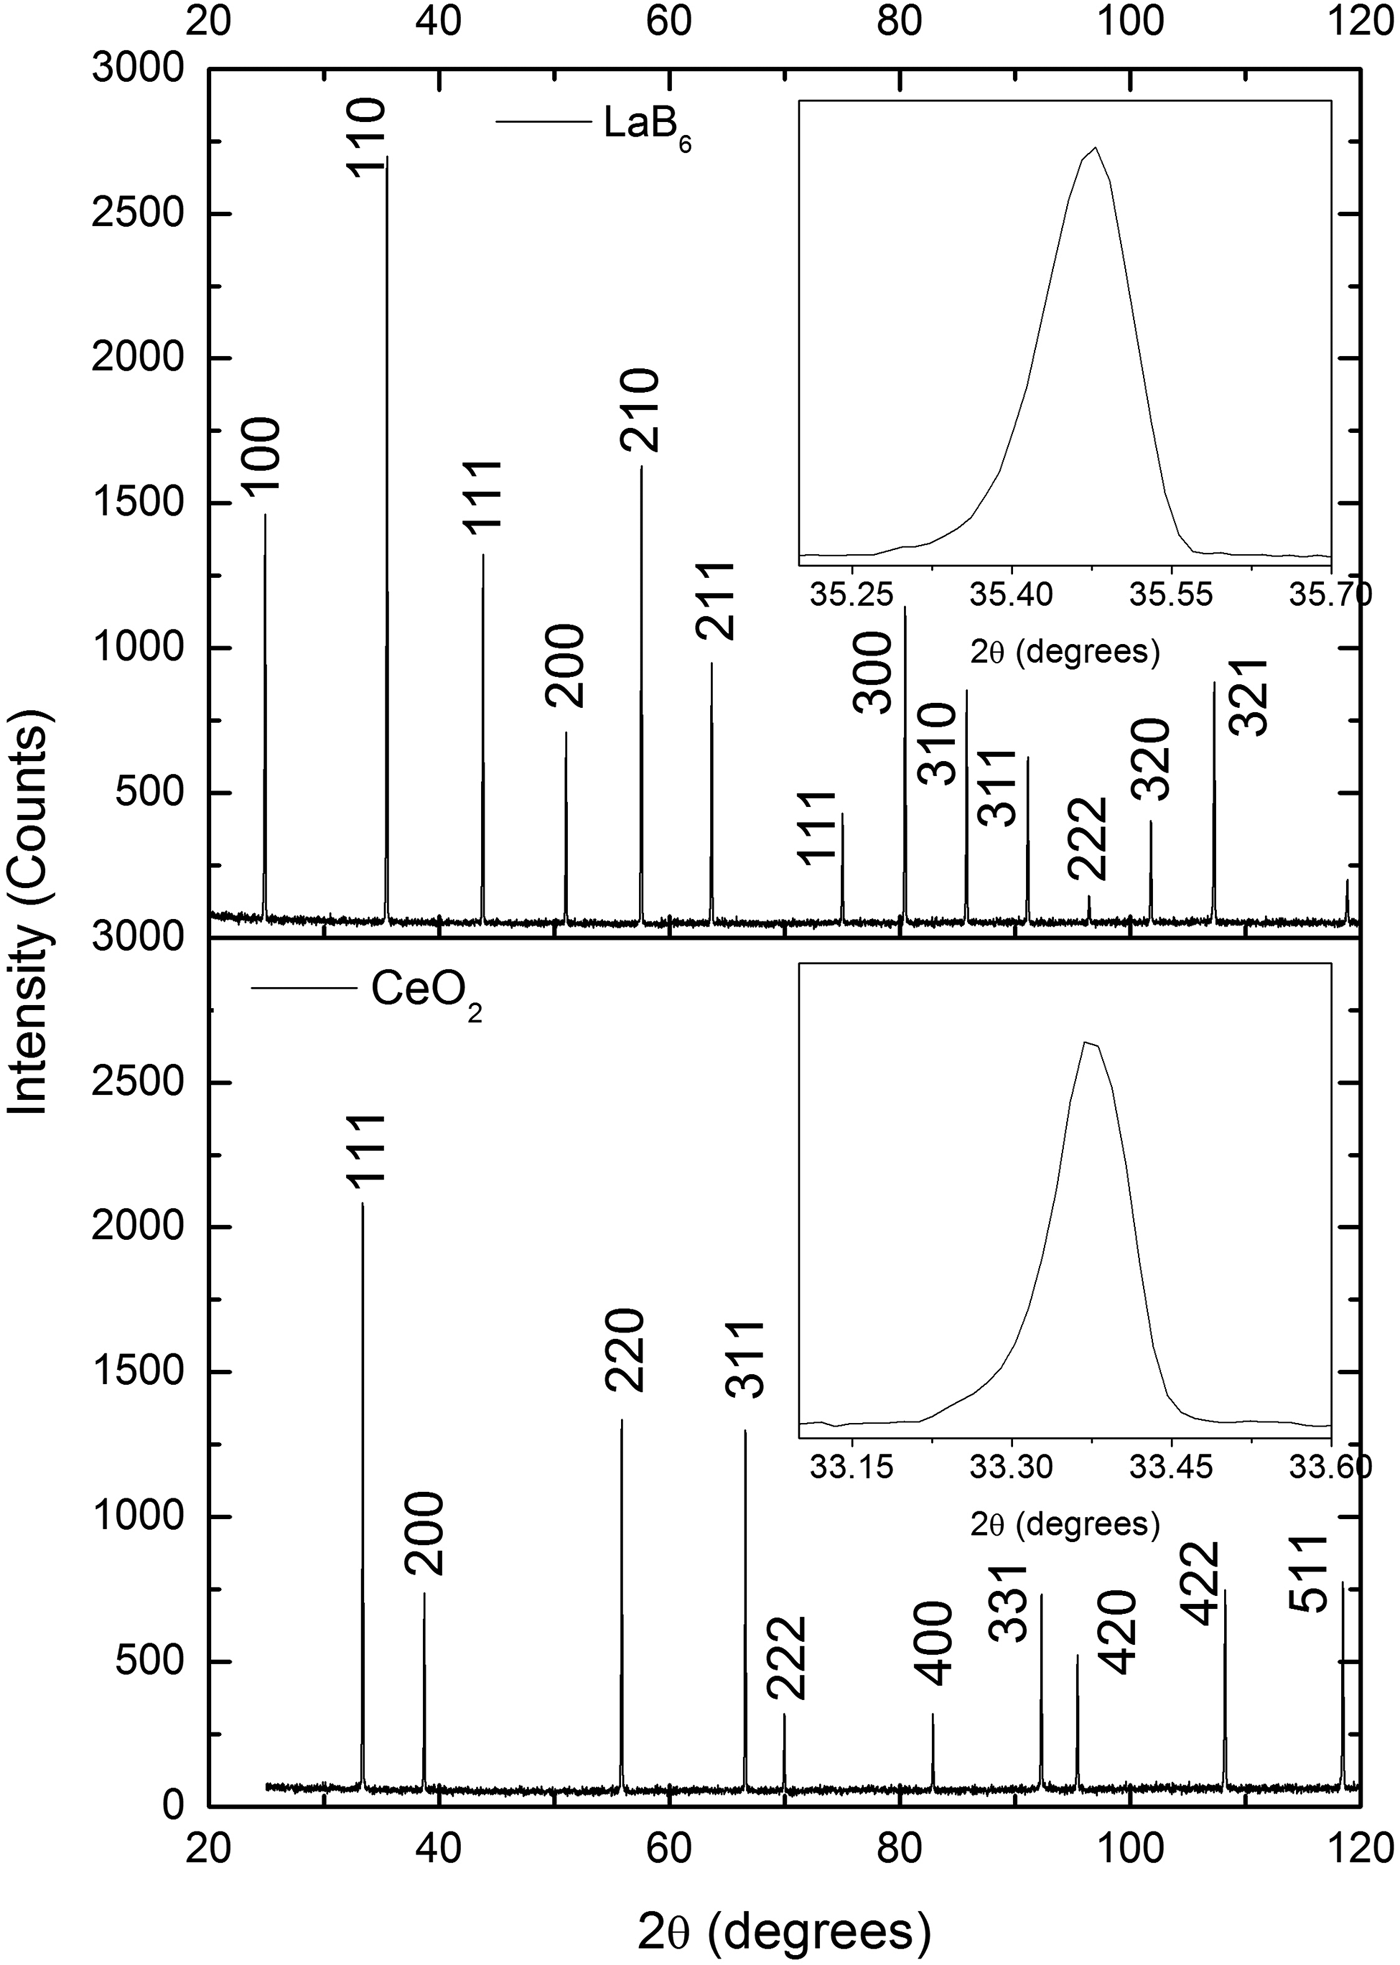
The diffraction patterns of the CeO2 samples prepared in this work and the LaB6 sample produced by the NIST are very similar when peak widths are compared (Figure 2). Because these widths are a measure of crystallite size and lattice strain, these results suggest that the CeO2 samples are composed of large crystallites with negligible lattice strain, just like the LaB6.
Comparison of the X-ray powder diffraction patterns of one CeO2 sample prepared in this work and LaB6 supplied by NIST. The peak widths of both patterns are very similar, which suggests that the CeO2 sample is composed of large crystallites with negligible strain, just like LaB6. The diffraction patterns were obtained under the same conditions in a parallel beam laboratory diffractometer.
Two sets of samples were prepared with different heating rates, namely 5 °C/min and 15 °C/min−1, to test their effect on the widths of the diffraction peaks. It is supposed that the heating rate determines the speed that the nanoparticles fuse to form larger particles. A slow rate would favor growth by allowing more time for neighbor particles to coalesce, giving rise to large particles and small peak widths. On the other hand, a fast rate could introduce defects on the crystalline structure by not allowing enough time for the atoms to accommodate in the crystallite boundary and release the stress, which would result in large peak widths.
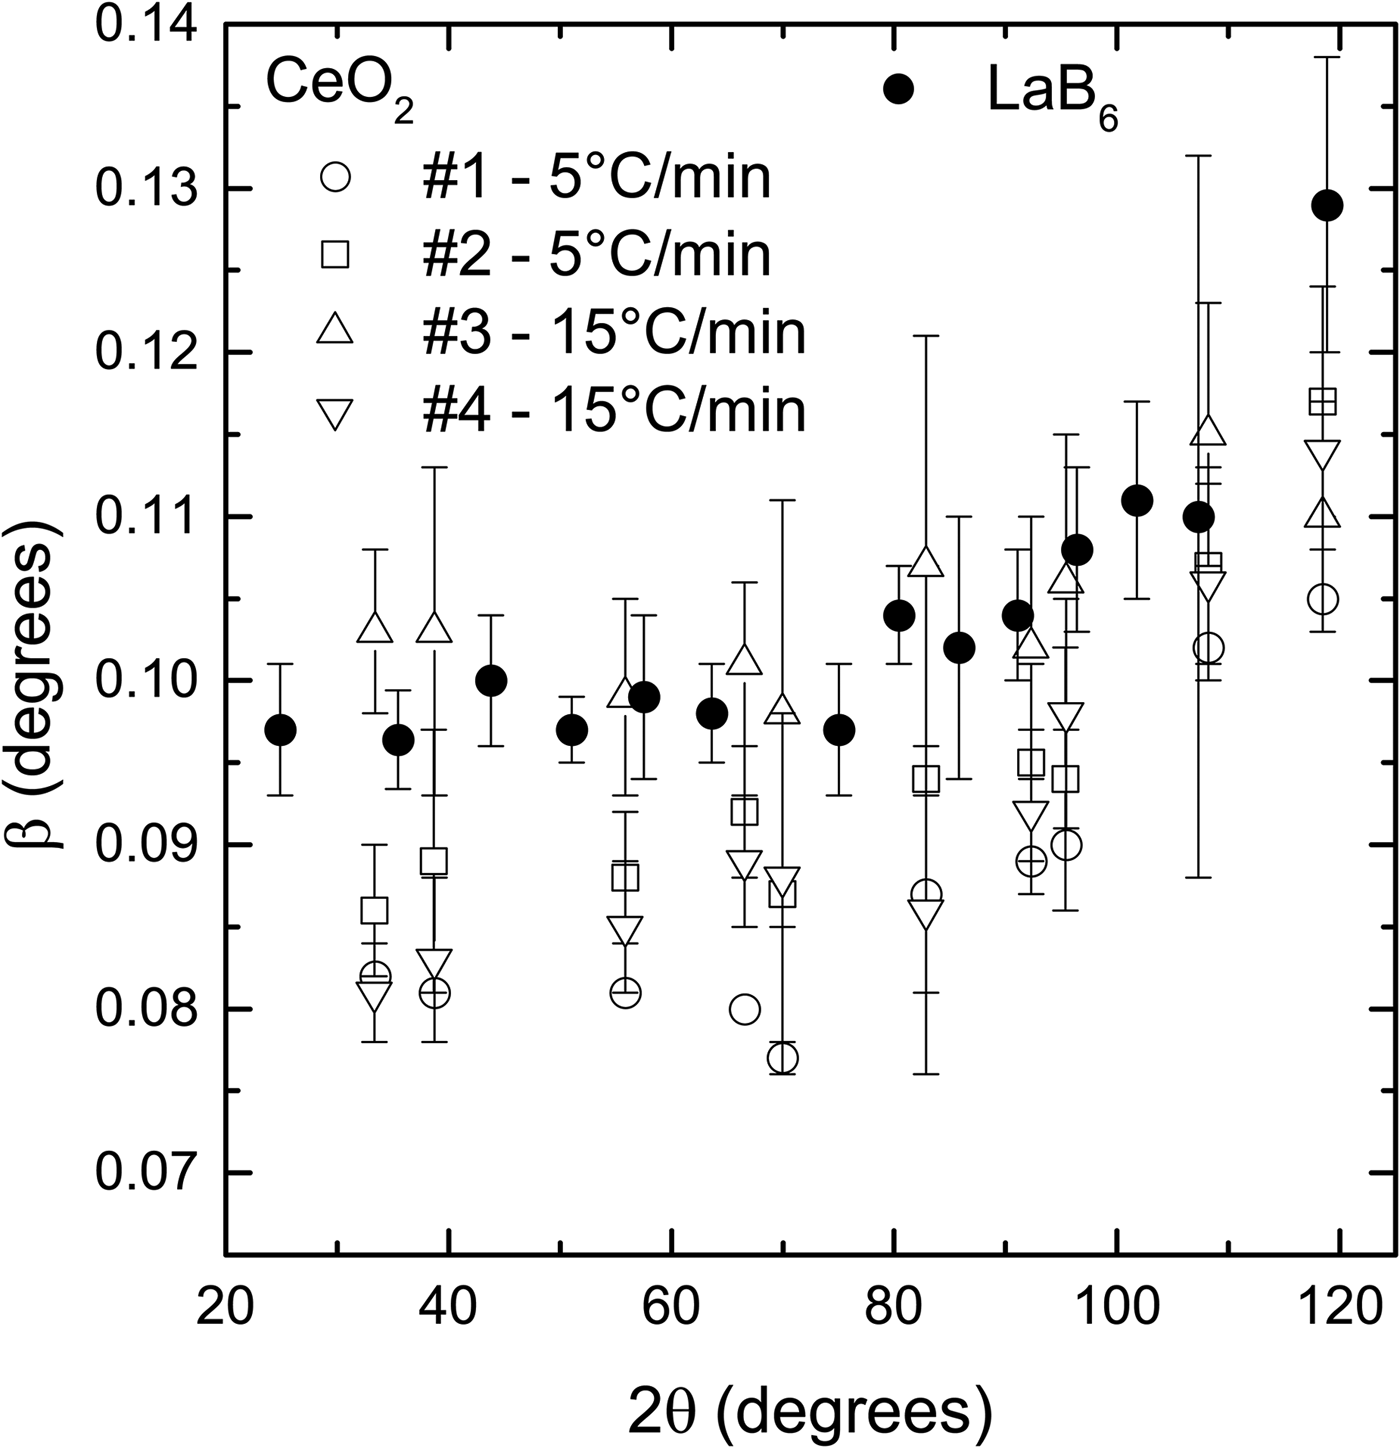
The spread in peak widths of the CeO2 samples prepared under the same conditions is larger than a supposed difference in widths caused by the heating rate (Figure 3). For example, sample #1, prepared with 5 °C/min−1, has smaller peak widths than the two samples prepared with 15 °C/min−1 (#3, #4). However, sample #2, which was also prepared with 5 °C/min−1, has peak with values between samples #3 and #4.
Comparison of the diffraction peak widths of the CeO2 samples prepared using two heating rates and LaB6 supplied by NIST. The spread in peak widths of the samples prepared under the same conditions is larger than any supposed difference caused by the heating rate. The widths of all CeO2 samples are smaller or slightly larger with the widths of LaB6. The powder diffraction patterns were obtained under the same conditions in a parallel beam laboratory diffractometer.
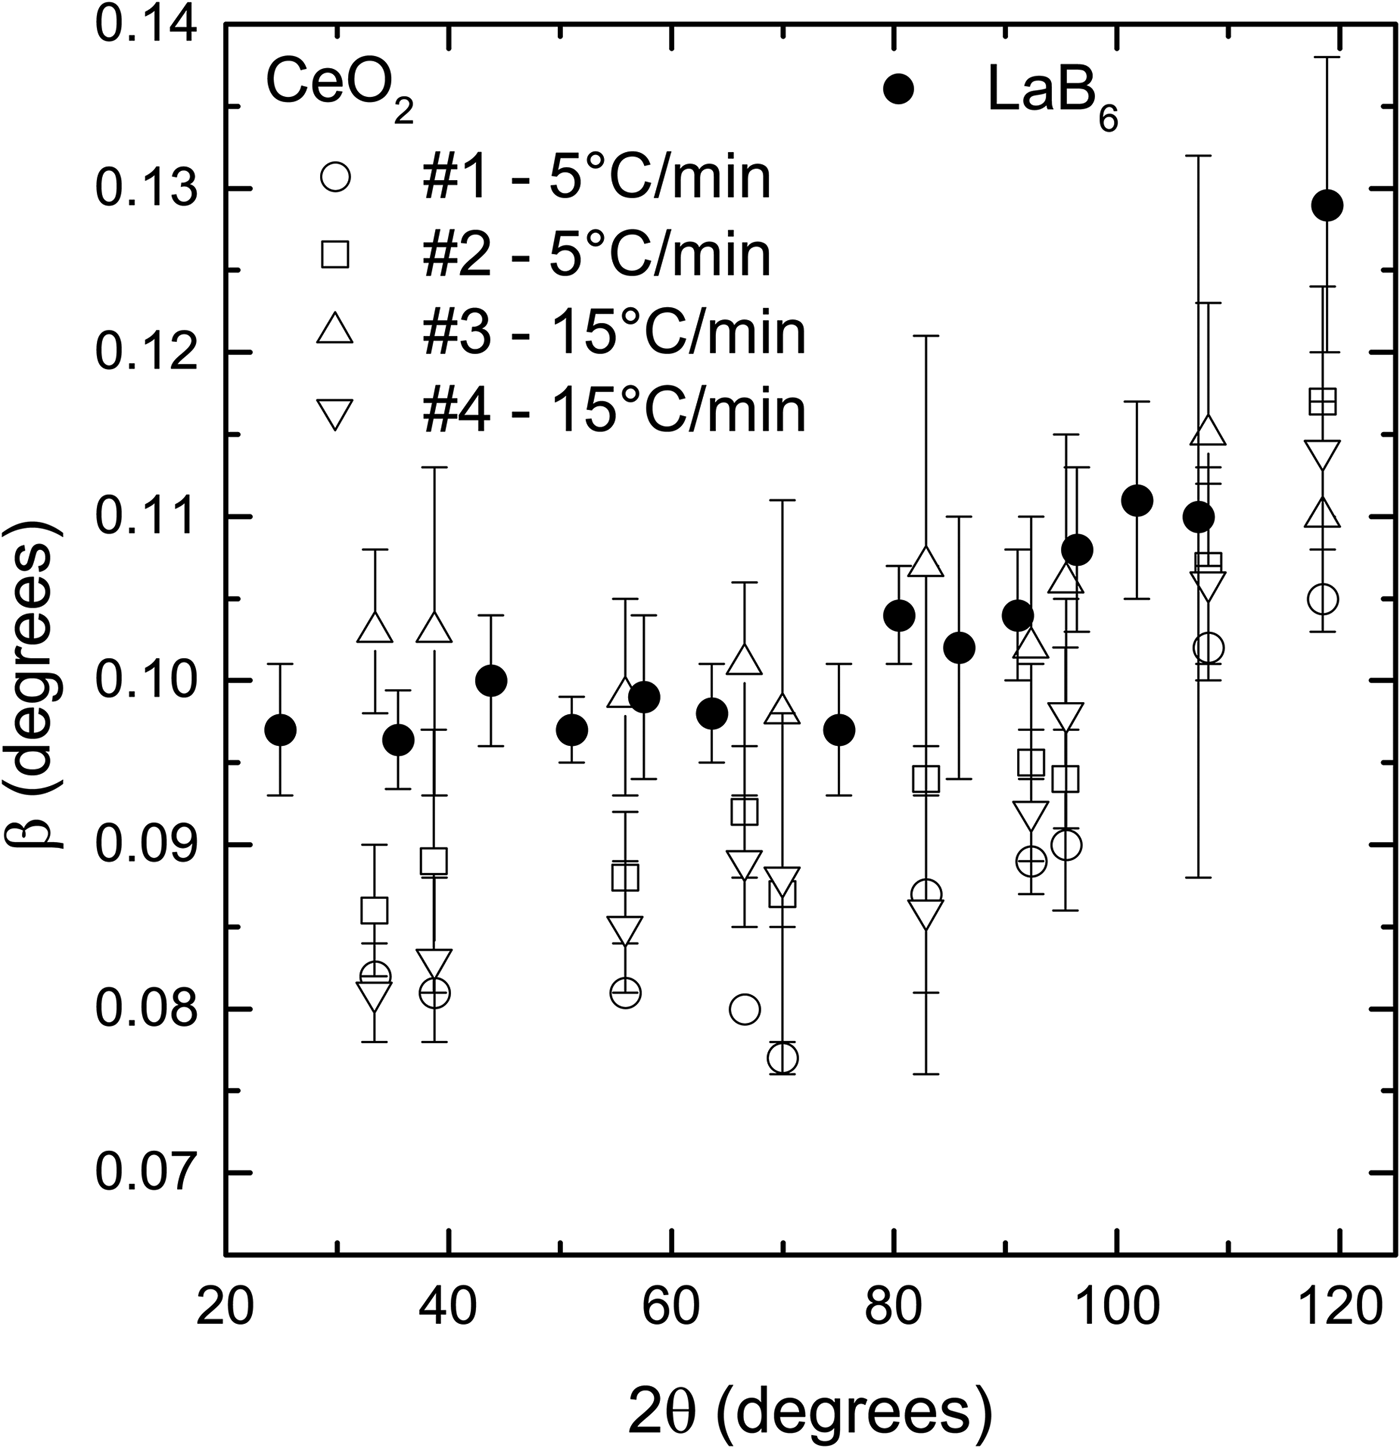
Despite this intrinsic spread in peak widths produced by the synthesis route presented in this work, in general, the peak widths of the CeO2 samples are smaller or slightly larger than the peak widths of the LaB6 (Figure 3). Because the peak widths are the most relevant features of a reference material used to remove instrumental broadening, CeO2 samples prepared following the synthesis route shown in this work can be used instead of LaB6.
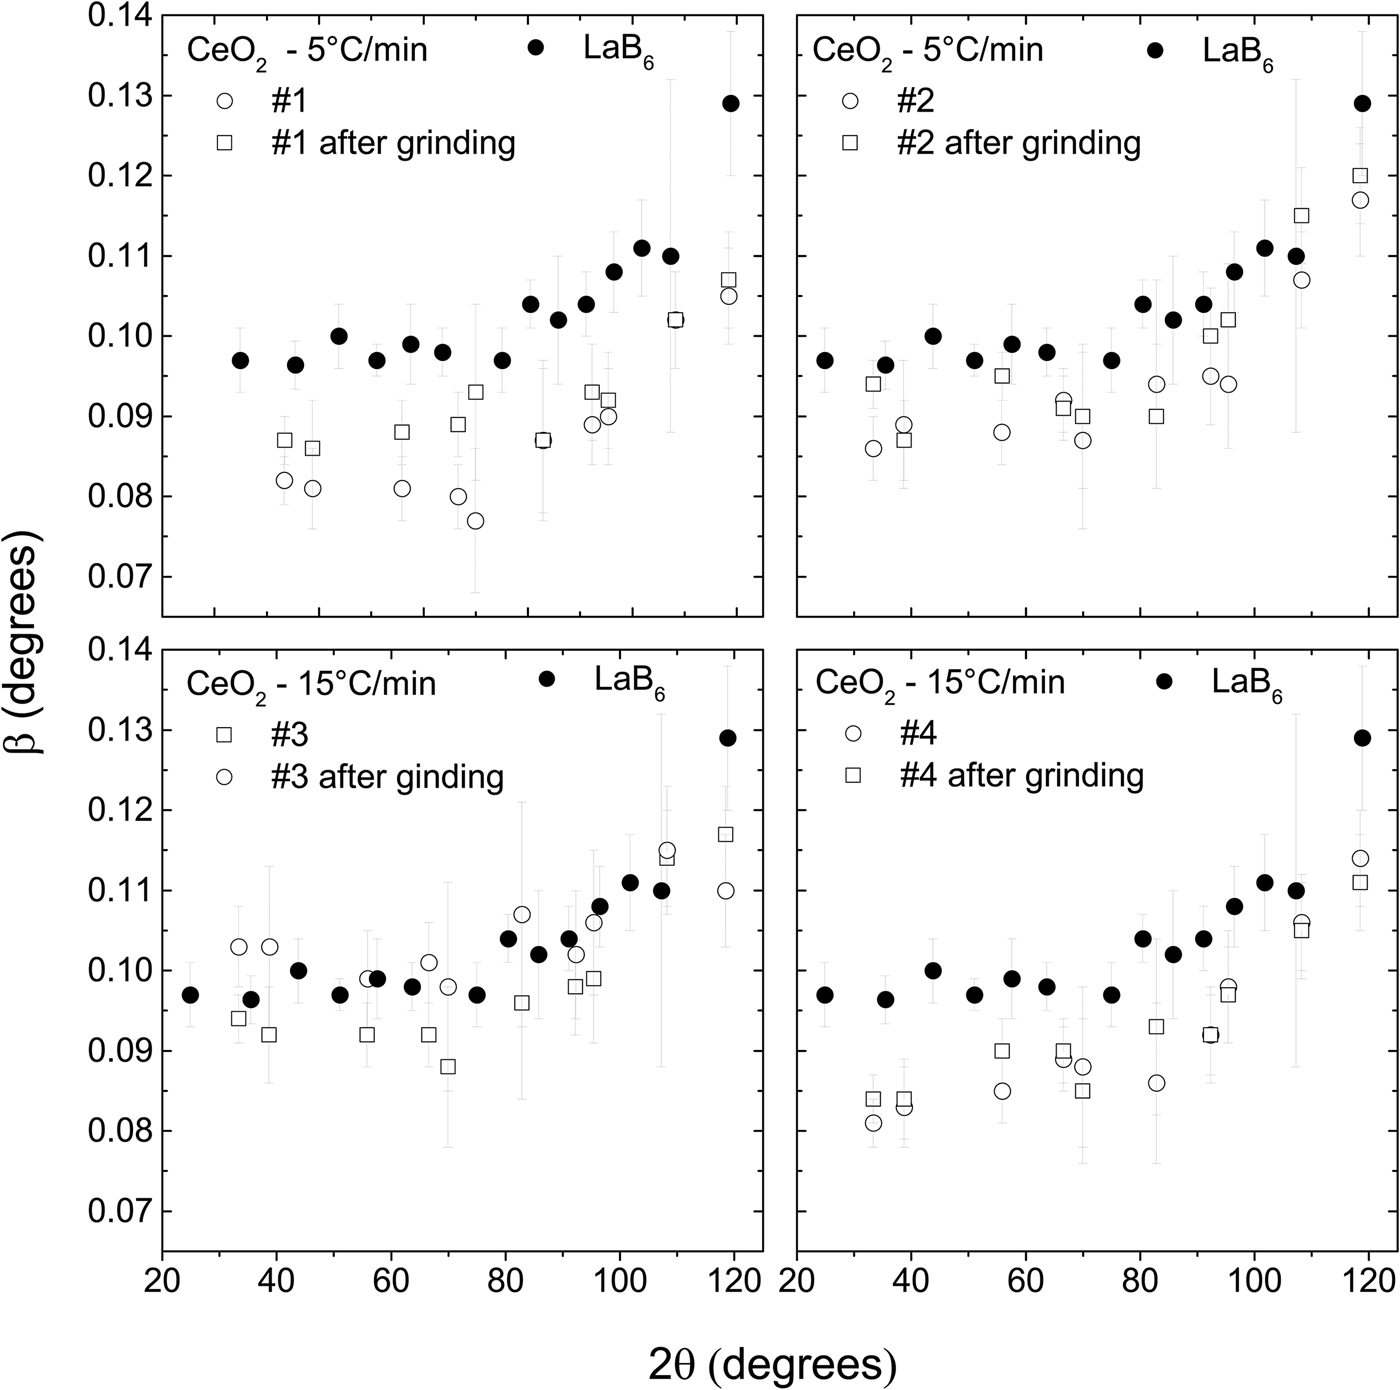
The CeO2 samples were also ground to test the effect of this treatment on the peak widths. A finer powder with a sharp particle distribution delivered by the grinding process is easier to mount for X-ray powder diffraction measurements and prevents surface roughness and preferred orientations. On the other hand, it is believed that grinding could induce micro strain in the crystalline structure, which in turn broadens the diffraction peaks. Another possibility is that the crystallites are broken in the process, also resulting in broader peaks.
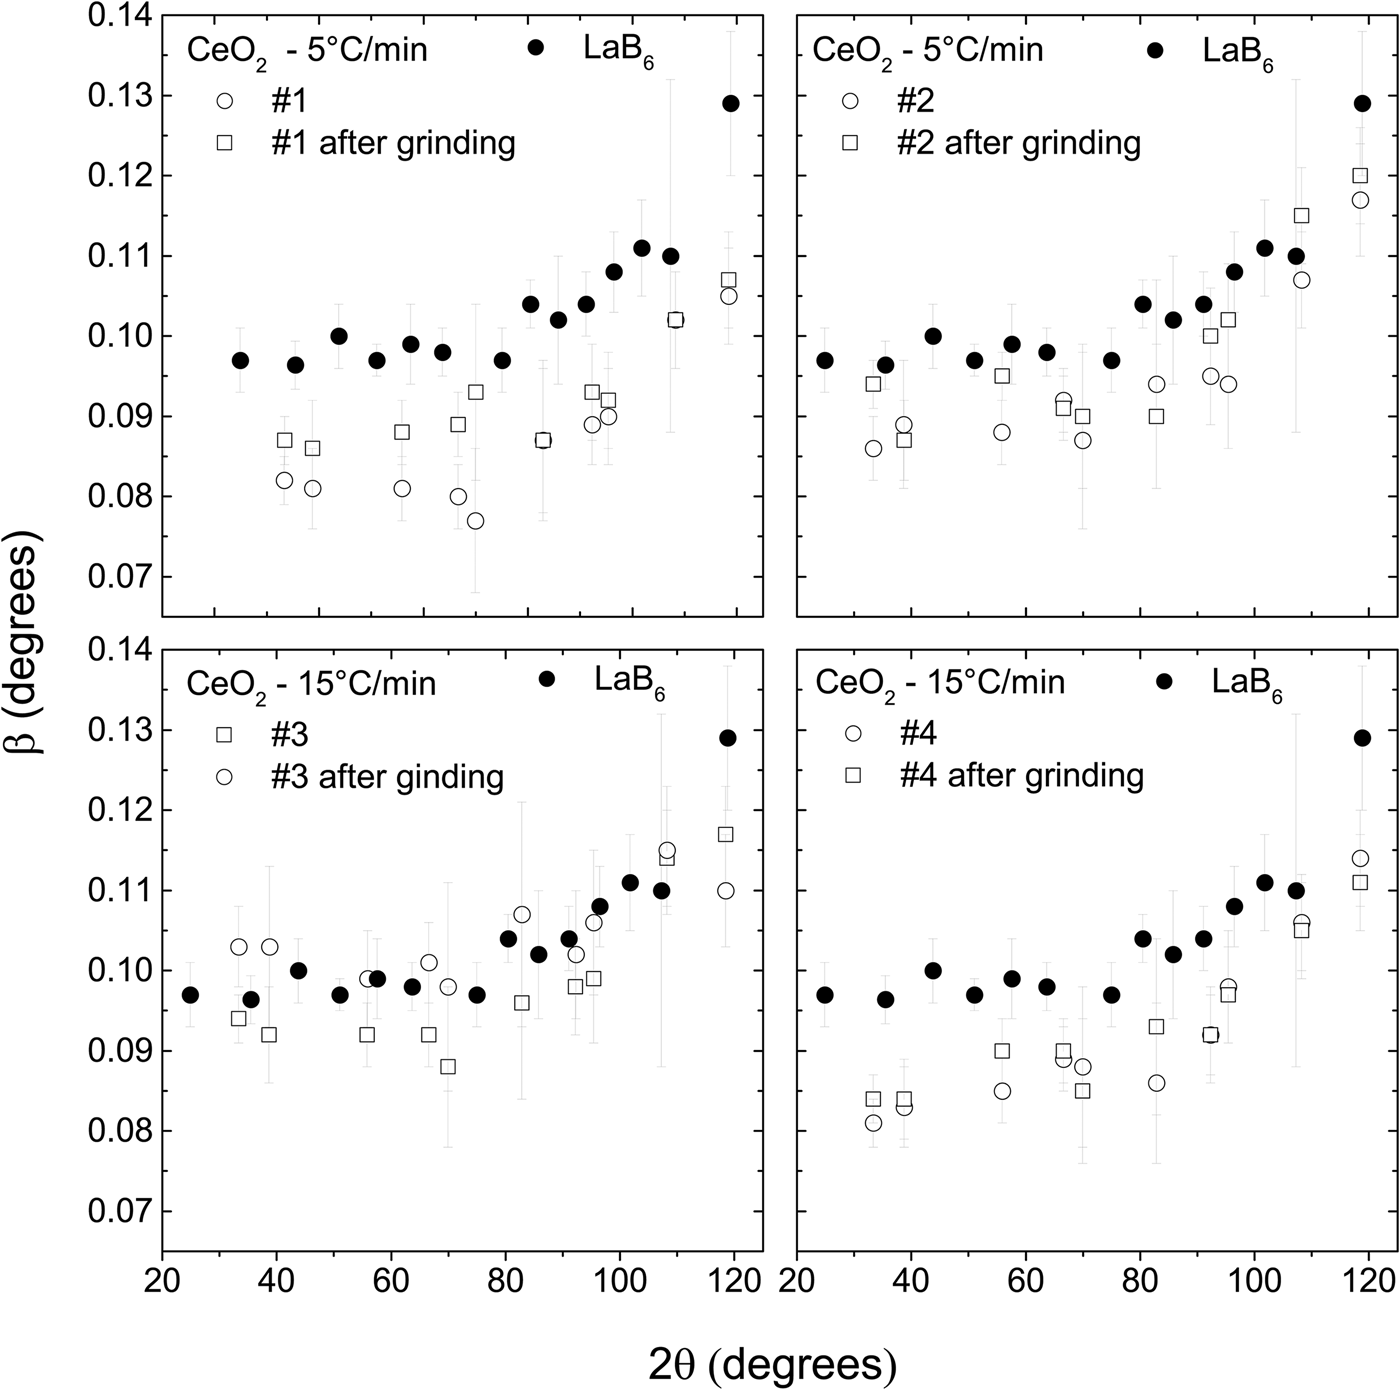
The peak widths of the CeO2 samples increase after they were ground (Figure 4), suggesting that some lattice strain is introduced and/or average crystallite size is reduced. Nevertheless, the peak widths are still smaller or very slightly larger than the peak widths of LaB6. Therefore, these ground samples could also be used to substitute LaB6 for removing instrumental width.
The widths of the diffraction peaks of the CeO2 samples increase after they are ground. Nevertheless, they are still smaller than the widths of the LaB6. The powder diffraction patterns were obtained under the same conditions in a parallel beam laboratory diffractometer.
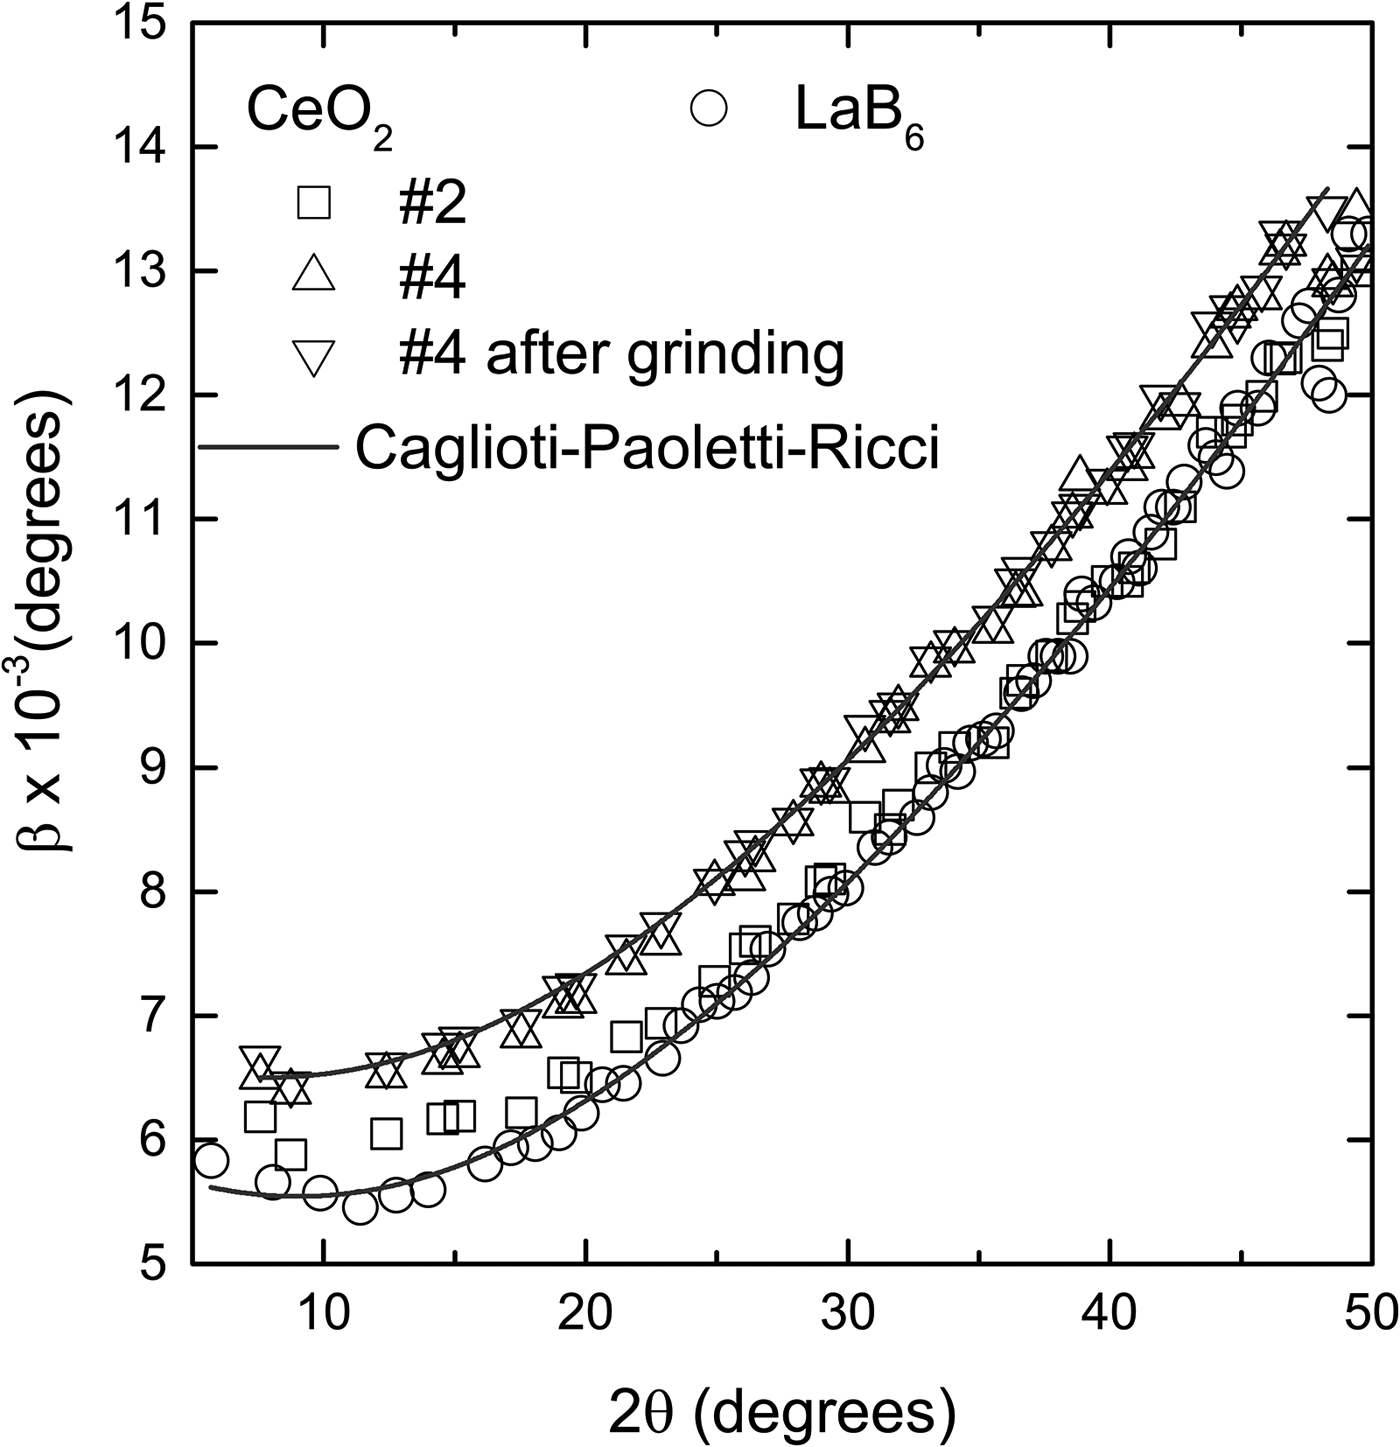
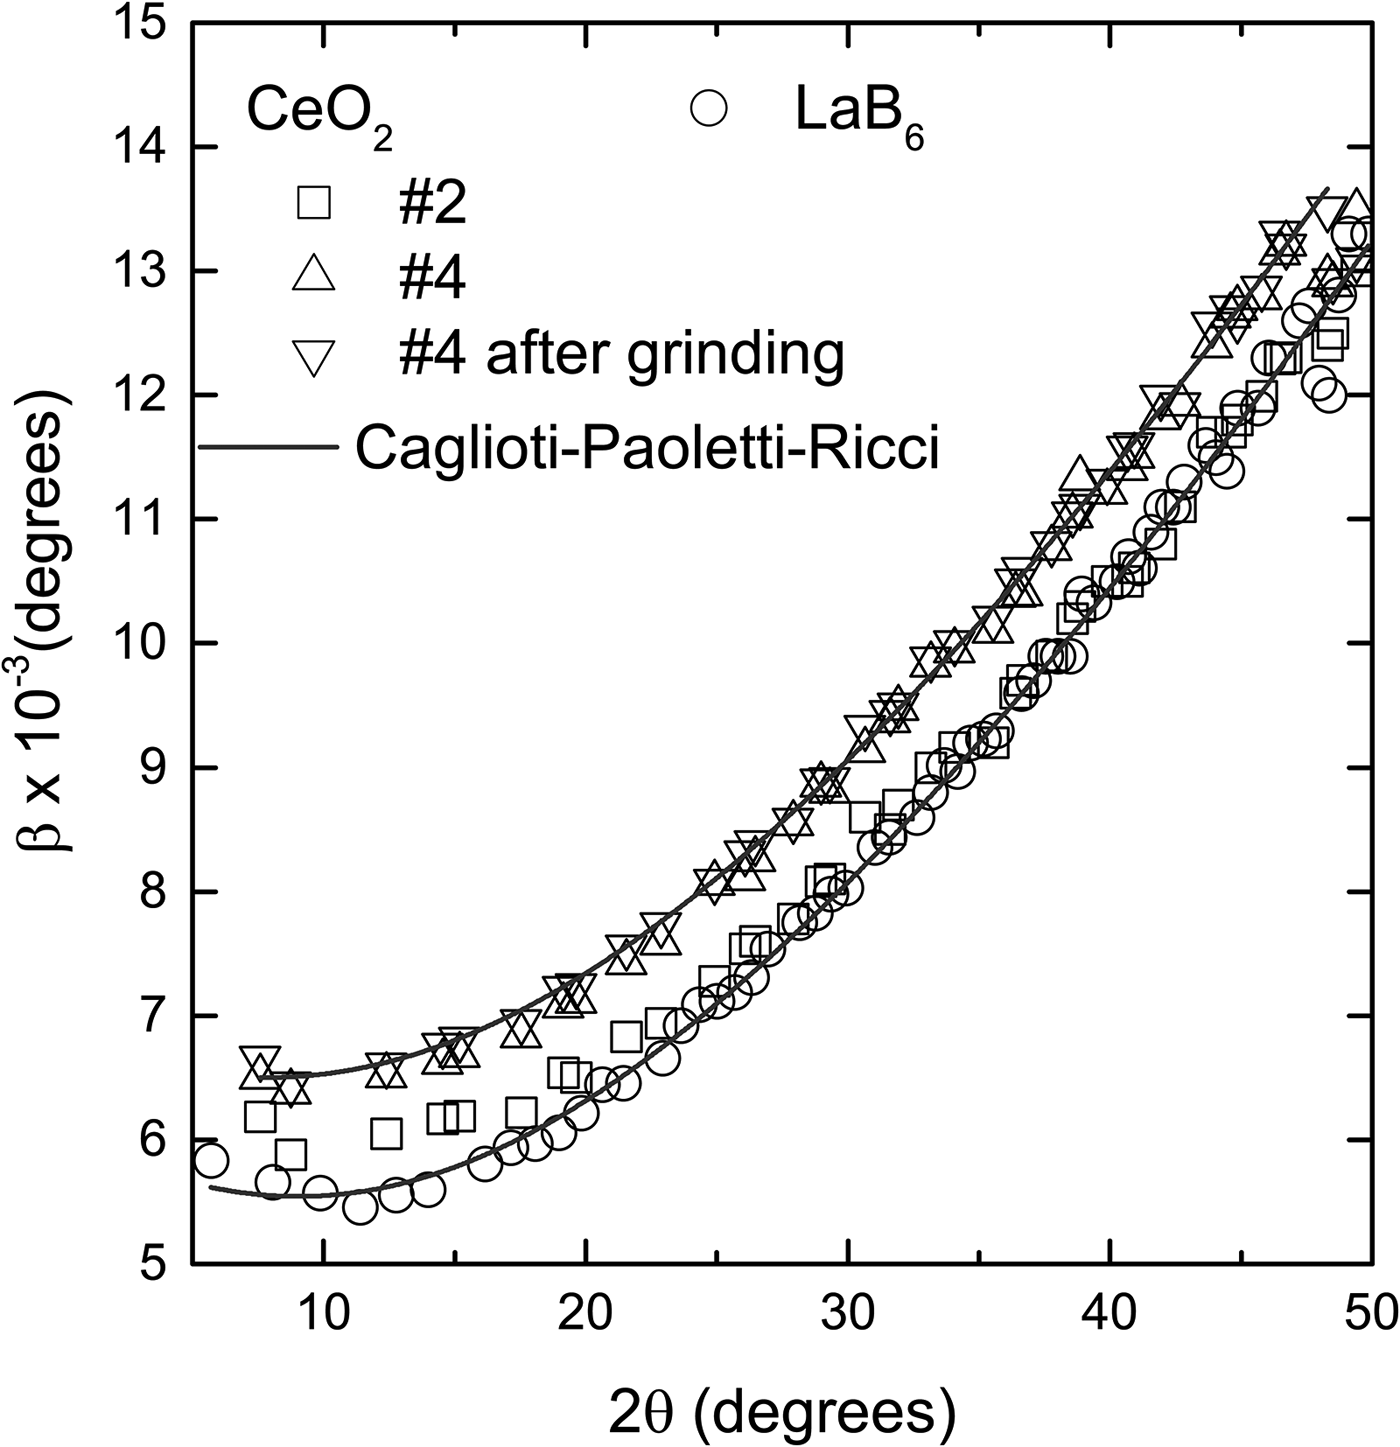
The widths of the diffraction peaks of the LaB6 and CeO2 samples, obtained in a high-resolution synchrotron instrument, are only slightly different, <0.001° (Figure 5). Because the instrument contribution to the widths of the diffraction peaks in this apparatus is a lot less than in a conventional diffractometer, it is easier to detect the contribution of the crystallite size and/or lattice strain of the sample. Sample #2 and LaB6 have practically the same widths while #4 has slightly larger ones. This confirms that the contributions of size and lattice strain of CeO2 to the peak widths are similar to the contributions of LaB6, therefore these samples can be used to remove instrumental broadening.
Comparison of the diffraction peak widths of the CeO2 and LaB6 obtained in a high-resolution synchrotron facility. The widths of sample #2 are almost the same as the widths of LaB6, and smaller than #4 by approximately 0.001°. Grinding has a negligible effect on the widths. The points for each sample follow a typical Caglioti–Paoletti–Ricci (Reference Caglioti, Paoletti and Ricci1958) curve with U = 9.66 ± 0.28 × 10⁻⁴, V = −1.54 ± 0.14 × 10⁻⁴ and W = 3.68 ± 0.16 × 10⁻⁵ for LaB6 and #2, and U = 8.94 ± 0.46 × 10⁻⁴, V = −9.23 ± 0.23 × 10⁻⁵ and W = 4.32 ± 0.27 × 10⁻⁵ for #4. The error bars are, in average, of the size of the points and were omitted for better visualization.
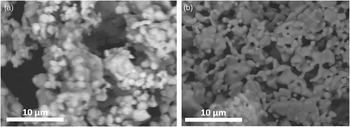
The cerium samples were also characterized morphologically using scanning electron microscopy. Figure 6 shows the micrographs of LaB6 (A) and CeO2 15 °C/min−1 (B). Both samples are composed of particles roughly in the range between 1 and 5 µm. The CeO2 also presents large particles of about 10 µm (not shown here), which are probably generated by the coalescence of smaller particles. Nevertheless, even with the presence of large and small particles (crystallite size distribution) probably lattice strain as well, this sample is comparable with the LaB6 because it provides slightly smaller diffraction peak widths. The presence of small and large particles in the CeO2 may be an issue if one tries to use this sample as a standard for a purpose other than to obtain the instrumental widths, for example, the large spread in particle distribution introduces preferred orientation effects which must not happen in an intensity standard (Langford and Louër, Reference Langford and Louër1996). Nevertheless, this effect does not compromise the diffraction peak widths and therefore does not diminish the capacity of the sample for removing diffraction peak instrumental broadening.
Scanning electron microscope images of (a) LaB6 (SRM660b) and (b) CeO2.

IV. CONCLUSION
The authors have presented a simple synthesis route, based on co-precipitation, to obtain micron size polycrystalline CeO2 powder to be used as an X-ray diffraction peak width reference material. The full width at half maximum of the CeO2 diffraction peaks is as small as the one of the LaB6 SRM660b supplied by NIST, indicating they represent the instrumental breadth of the 11-BM beamline, being free from sample effects. For the parallel beam laboratory diffractometer, the difference in full width at half maximum of the two samples is larger and possibly caused by sample mounting and absorption. In addition, the CeO2 samples are less expensive than the SRM660b.
ACKNOWLEDGEMENTS
J. M. Sasaki would like to thank the Conselho Nacional de Desenvolvimento Científico e Tecnológico - CNPq/Brazil for his research fellowship under grant number 3063692014-1. A. M. L. Batista and M. A. R. Miranda would like to thank Fundação Cearense de Apoio ao Desenvolvimento Científico e Tecnológico – FUNCAP/Brazil for their graduate scholarship. Use of the Advanced Photon Source at Argonne National Laboratory was supported by the U. S. Department of Energy, Office of Science, Office of Basic Energy Sciences, under Contract No. DE-AC02-06CH11357.