





Depression is becoming an increasingly pertinent issue worldwide. Rates of depression are rising across populations (Moreno-Agostino et al., Reference Moreno-Agostino, Wu, Daskalopoulou, Hasan, Huisman and Prina2021). In the United States alone, it is among the most prevalent mental health disorders. Almost one in ten Americans experienced a depressive episode in 2020 (Goodwin et al., Reference Goodwin, Dierker, Wu, Galea, Hoven and Weinberger2022). This phenomenon is especially concerning given depression’s multiple biopsychosocial repercussions. For example, higher depressive symptoms have been found to predict negative cardiovascular outcomes and diseases (Shiga, Reference Shiga2023), increased risk of suicide (Nanayakkara, Misch, Chang, & Henry, Reference Nanayakkara, Misch, Chang and Henry2013), decreased work productivity (Woo et al., Reference Woo, Kim, Hwang, Frick, Choi, Seo, Kang, Kim, Ham, Lee and Park2011), and disrupted social relationships (Domenech-Abella, Mundo, Haro, & Rubio-Valera, Reference Domenech-Abella, Mundo, Haro and Rubio-Valera2019). To address this increasing trend, it is essential to first determine the long-term predictors of depressive symptoms. Such efforts can inform target outcomes for prevention programs and help address the widening treatment gap.
One potential predictor of depression is a lack of assertiveness (LOA), which refers to difficulties expressing one’s needs or desires. LOA has been associated with heightened depressive symptoms (Ball, Otto, Pollack, & Rosenbaum, Reference Ball, Otto, Pollack and Rosenbaum1994). Conversely, assertiveness training has been linked to relief of depression symptoms (LaPointe & Rimm, Reference LaPointe and Rimm1980; Sanchez, Lewinsohn, & Larson, Reference Sanchez, Lewinsohn and Larson1980). Assertiveness training is a key part of social skills training, an effective psychological treatment (Speed, Goldstein, & Goldfried, Reference Speed, Goldstein and Goldfried2018). If left unaddressed, LOA can trigger distrust and resentment as unfulfilled needs accumulate over time. Moreover, a well-established distal risk factor for depression is resentment-based hostility, an inclination toward distrust of others, marked by the mindset that others are malicious or unethical, and related to persistent anger (Cook & Medley, Reference Cook and Medley1954). Hostility has consistently predicted greater depression severity across multiple empirical studies (Asberg, Reference Asberg2013; Heponiemi et al., Reference Heponiemi, Elovainio, Kivimaki, Pulkki, Puttonen and Keltikangas-Jarvinen2006; Nabi et al., Reference Nabi, Singh-Manoux, Ferrie, Marmot, Melchior and Kivimaki2010; Stewart, Fitzgerald, & Kamarck, Reference Stewart, Fitzgerald and Kamarck2010).
Although LOA and hostility are established predictors of depressive symptoms, the exact pathways linking them to depression severity have not been widely studied. Determining the mediators between these predictors and depression severity might help in designing preventive interventions. One possible mediator of the pathway from LOA and hostility to depressive symptoms is low social support. Social support is operationalized here as structural support, that is, the size of a person’s friendship network (Bergeman et al., Reference Bergeman, Plomin, Pedersen, McClearn and Nesselroade1990). Assertiveness allows one to interact with others in an appropriate and positive manner. This proposition is supported by findings from Elliott and Gramling (Reference Elliott and Gramling1990), who found that assertiveness enhanced the positive effects of social support on depression. Lower assertiveness has also been associated with fewer friends (Eskin, Reference Eskin1995) and greater loneliness among various populations (Gambrill, Florian, & Splaver, Reference Gambrill, Florian and Splaver1986). Taken together, this research suggests that LOA negatively affects one’s interactions with others and reduces social support.
Similarly, hostility is theorized to reduce social support. People higher in hostility are more prone to anger and unfriendly behaviors, which may harm relationships (Matthews, Reference Matthews1982). Indeed, evidence has shown that people high in hostility have lower social support (Hardy & Smith, Reference Hardy and Smith1988; Smith et al., Reference Smith, Pope, Sanders, Allred and O’Keeffe1988). This pattern is particularly true when factors such as specific hostility dimensions and gender are taken into account (Räikkönen, Keskivaara, & Keltikangas-Järvinen, Reference Räikkönen, Keskivaara and Keltikangas-Järvinen1992). Cynical hostility has also been linked to increased loneliness (Segel-Karpas & Ayalon, Reference Segel-Karpas and Ayalon2020; Segel-Karpas & Ermer, Reference Segel-Karpas and Ermer2021). Both LOA and hostility are thus associated with decreased social support. In turn, social support deficits are established predictors of depression across diverse populations (e.g. Alsubaie, Stain, Webster, & Wadman, Reference Alsubaie, Stain, Webster and Wadman2019; Aroian, Uddin, & Blbas, Reference Aroian, Uddin and Blbas2017; Liu, Gou, & Zuo, Reference Liu, Gou and Zuo2016; Sullivan, Moore, Blom, & Slater, Reference Sullivan, Moore, Blom and Slater2020), suggesting that social relationships protect against depression symptoms. To our knowledge, only one study has examined the mediating role of social support between hostility and depression, and this was in cardiac patients (Brummett et al., Reference Brummett, Babyak, Barefoot, Bosworth, Clapp-Channing, Siegler, Williams and Mark1998). Based on existing literature, it is plausible that social support would mediate the effect of both LOA and hostility on depressive symptoms in a parallel mediation model.
Additionally, LOA and hostility may not be independent predictors; LOA might precede and predict greater hostility as emotions of mistrust and resentment grow over time. For example, in earlier work, Maiuro, Cahn, and Vitaliano (Reference Maiuro, Cahn and Vitaliano1986) found that men with lower assertiveness (i.e. lower request behaviors) had higher covert anger/hostility. Relatedly, lower assertiveness and associated passive behaviors were linked to poorer emotional adjustment and traits that would dovetail with a heightened tendency toward hostility (Furnham, Cuppello, & Semmelink, Reference Furnham, Cuppello and Semmelink2024). However, the precise temporal ordering among LOA, hostility, social support, and depressive symptoms remains understudied. Plausibly, individuals with LOA may experience difficulties resolving conflicts, as LOA hinders direct communication necessary for addressing perceived inequities. These processes may make them feel unjustly treated and lead them to adopt a cynical attitude toward others, thereby increasing hostility. LOA also seems to emerge early in life (Patterson, Littman, & Bricker, Reference Patterson, Littman and Bricker1967), which suggests that it would precede hostility. Hostility could, in turn, erode social support and trigger depressive symptoms over time, forming a plausible causal mediational chain. Hence, this study also aimed to test a serial mediation model. Examining both the parallel and serial mediation models would allow us to determine whether LOA and hostility are independent predictors or whether hostility follows LOA in the potentially causal mediational chain.
Furthermore, a key threat to causal inference in these models is genetic confounding. LOA (Coccaro, Bergeman, & McClearn, Reference Coccaro, Bergeman and McClearn1993; Rushton et al., Reference Rushton, Fulker, Neale, Nias and Eysenck1986), hostility (Hur, Reference Hur2006), social support (Gonggrijp et al., Reference Gonggrijp, van de Weijer, van Dongen, Bijleveld and Boomsma2024), and depression (Sullivan, Neale, & Kendler, Reference Sullivan, Neale and Kendler2000) are all substantially heritable. Hence, the associations among them could reflect shared genetic factors rather than environmentally mediated pathways. To address this, both the serial and parallel mediation models were evaluated using the behavioral genetics framework of the Swedish Adoption/Twin Study of Aging (SATSA; Pedersen et al., Reference Pedersen, McClearn, Plomin, Nesselroade, Berg and DeFaire1991; Pedersen, Reference Pedersen2015). As monozygotic twins share 100% of their genotype, within-pair differencing in monozygotic twins removes all genetic confounding. In comparison, within-pair differencing in dizygotic twins holds, on average, only 50% of segregating genetic factors constant. By comparing within-pair difference estimates between monozygotic and dizygotic twins, environmental effects can thus be isolated from genetic effects (McAdams, Rijsdijk, Zavos, & Pingault, Reference McAdams, Rijsdijk, Zavos and Pingault2021; McGue, Osler, & Christensen, Reference McGue, Osler and Christensen2010). This allows us to test whether the proposed pathways reflect genuine environmental processes, rather than genetic confounding.
Accordingly, the present study tested two main hypotheses. For the serial mediation model, we hypothesized that higher Time 2 (T2) hostility and lower Time 3 (T3) social support would significantly mediate the effects of Time 1 (T1) LOA on Time 4 (T4) depression severity. For the parallel mediation model, we hypothesized that lower T2 social support would significantly mediate the effects of T1 LOA and hostility on T3 depressive symptoms. We further hypothesized that if these indirect pathways are environmentally mediated, they would remain significant within monozygotic pairs, whereas attenuation to non-significance would indicate genetic confounding. The monozygotic within-pair difference models constituted the confirmatory tests; the dizygotic difference models were the prespecified sensitivity analyses; and all remaining models were exploratory and are reported as supplementary.
Method
Participants
Data were derived from the SATSA project, retrieved through the Inter-university Consortium for Political and Social Research (ICPSR; Pedersen, Reference Pedersen2015; Pedersen et al., Reference Pedersen, McClearn, Plomin, Nesselroade, Berg and DeFaire1991), which spans 26 years (1984–2010). The base population included 3,838 participants: all Swedish Twin Registry twins separated before age 11, coupled with a matched sample of twin dyads reared together. The analytic sample comprised twin dyads in which at least one twin had valid baseline depression data (N = 2,034; 1,017 pairs). Out of the twin dyads included, 487 pairs had valid baseline depression data from both twins. Of the 317 monozygotic and 645 dizygotic pairs, 10 and 18, respectively, had complete observed data on all model constructs; the proportion of imputed item-level values ranged from 24.4% to 83.0% across constructs and waves. Missing data in partially observed pairs were handled by using random forest imputation with twins arranged in wide format. Regarding demographics, there were 42.5% males and 57.5% females, with a mean age of 58.7 years (standard deviation [SD] = 13.8; range = 26–93). Ethnicity was not captured in SATSA, but all participants were born in Sweden (Lichtenstein et al., Reference Lichtenstein, De Faire, Floderus, Svartengren, Svedberg and Pedersen2002); findings may thus not generalize to more culturally diverse samples. Of the twin pairs, 317 were monozygotic (identical), 645 were dizygotic (non-identical), and 55 were of indeterminate zygosity; the latter were removed from zygosity-stratified models. Additionally, 514 dyads were reared apart before 11 years of age, and 503 were reared together, matching the adoption-based design.
Procedures
Seven questionnaire waves and seven waves of in-person testing (IPT) were implemented from 1984 to 2010, although Questionnaire 7 (2010) was unavailable and thus excluded from analysis. The 1984 questionnaire set was mailed to 2,845 available base-population individuals, of whom 2,018 responded (70.9%), and captured health behaviors as well as psychosocial and physical well-being. Subsequent questionnaires repeated identical self-reports apart from the hostility measure, as detailed below (Finkel & Pedersen, Reference Finkel and Pedersen2004). IPTs comprised interviews, neurocognitive tests, and physical examinations but were provided only to twins aged 50 years or older (Finkel & Pedersen, Reference Finkel and Pedersen2004); thus, IPT-based values reflect an older subgroup. The constructs evaluated here included depression, hostility, LOA, and social support, derived from both sources. Table 1 displays the assessment waves and mean ages for each construct. SATSA received ethics approval from the relevant Swedish ethics committees, all participants provided voluntary informed consent, and the data are retrievable via the publicly available ICPSR repository. Further details are provided in Finkel and Pedersen (Reference Finkel and Pedersen2004).
Assessment waves and mean ages for constructs in the serial and parallel mediation models

Table 1. Long description
The table is divided into two primary sections.
Serial mediation model variables:
* T 1 Lack of assertiveness: Q 1 (1984), Q 2 (1987); Mean age 58–61.
* T 2 Hostility: I P T 2 (1989–1991), Q 3 (1990); Mean age 63–65.
* T 3 Social support: Q 4 (1993), Q 5 (2003); Mean age 67–77.
* T 4 Depression severity: I P T 7 (2005–2007), Q 6 (2007); Mean age 79–81.
* T 1 Depression severity: Q 2 (1987); Mean age 61.
* T 1 Hostility: Q 1 (1984), Q 2 (1987); Mean age 58–61.
* T 1 Social support: Q 2 (1987); Mean age 61.
Parallel mediation model variables:
* T 1 Lack of assertiveness: Q 1 (1984), Q 2 (1987); Mean age 58–61.
* T 1 Hostility: Q 1 (1984), Q 2 (1987); Mean age 58–61.
* T 2 Social support: I P T 2 (1989–1991), Q 3 (1990), Q 4 (1993); Mean age 63–67.
* T 3 Depression severity: I P T 5 (1999–2001), I P T 6 (2002–2004), Q 5 (2003), I P T 7 (2005–2007), Q 6 (2007); Mean age 73–81.
* T 1 Social support: Q 2 (1987); Mean age 61.
* T 1 Depression severity: Q 2 (1987); Mean age 61.
Note: Q refers to Questionnaire and I P T refers to In-Person Testing. Mean ages were calculated based on a baseline mean age of 58.7 on 1st January 1985.
Note: Q1, Questionnaire 1; Q2, Questionnaire 2; Q3, Questionnaire 3; Q4, Questionnaire 4; Q5, Questionnaire 5; Q6, Questionnaire 6; IPT1, In-Person Testing 1; IPT2, In-Person Testing 2; IPT3, In-Person Testing 3; IPT4, In-Person Testing 4; IPT5, In-Person Testing 5; IPT6, In-Person Testing 6; IPT7, In-Person Testing 7. Participants’ mean age on 1st January 1984 was 58.7. Mean ages at subsequent waves were derived by adding elapsed years to this baseline. The mean age ranges reported were rounded down.
Measures
Lack of assertiveness (LOA)
LOA is defined as the inclination to struggle with asserting oneself and to suppress anger instead of expressing it constructively. It was measured using the ‘Inhibition of Aggression’ scale from the Karolinska Scales of Personality (KSP; af Klinteberg, Schalling, & Magnusson, Reference Klinteberg, Schalling and Magnusson1986), whereby individuals rated the degree to which each statement described them (e.g. ‘I have a hard time saying no when someone asks me to do something even if I don’t want to do it’). This measure reflects the inhibition of assertive and aggressive expression in particular and does not assess the broader temperamental concept of behavioral inhibition to novelty (Fox et al., Reference Fox, Henderson, Marshall, Nichols and Ghera2005; Kagan, Reference Kagan1994); thus, we labeled and interpreted it as LOA consistently. Participants used a 5-point scale, such that higher scores reflected greater LOA; 8 items were reverse-scored to achieve this. Internal consistency was acceptable across all time points (McDonald’s omega = .67 to .75). Previous research has shown that LOA scores correlated highly across waves (Gustavsson et al., Reference Gustavsson, Weinryb, Göransson, Pedersen and Åsberg1997; Weinryb, Gustavsson, Asberg, & Rossel, Reference Weinryb, Gustavsson, Asberg and Rossel1992), as well as with biomarkers (af Klinteberg et al., Reference Klinteberg, Schalling and Magnusson1986), marital functioning (Gustavsson et al., Reference Gustavsson, Weinryb, Göransson, Pedersen and Åsberg1997), and personality disorder (Ekselius, Hetta, & von Knorring, Reference Ekselius, Hetta and von Knorring1994).
Hostility
Hostility was measured with the Cook-Medley Hostility Scale (Cook & Medley, Reference Cook and Medley1954). It consists of the paranoid alienation (e.g. ‘I have a feeling that I’ve often been punished unjustly’) and cynicism (e.g. ‘I think that most people would lie to get ahead’) subscales, which can be summed into a single trait-level score (Costa Jr., Zonderman, McCrae, & Williams Jr., Reference Costa, Zonderman, McCrae and Williams1986). The 1984 timepoint used 19 items, and later waves used 10 items (5 per subscale); only the repeatedly administered 10 items were analyzed for consistency. Responses applied the same 5-point scale, in which values were reverse-coded so that higher scores denoted more hostility. Internal consistency was good (McDonald’s omega = .79 to .86), and the scores have been consistently linked to conflictual behaviors (Hardy & Smith, Reference Hardy and Smith1988; Smith, Sanders, & Alexander, Reference Smith, Sanders and Alexander1990) and personality (Costa Jr. et al., Reference Costa, Zonderman, McCrae and Williams1986).
Social support
Social support was assessed with eight of nine items based on the Interview Schedule for Social Interaction (ISSI; Bergeman et al., Reference Bergeman, Plomin, Pedersen, McClearn and Nesselroade1990; Henderson, Duncan-Jones, Byrne, & Scott, Reference Henderson, Duncan-Jones, Byrne and Scott1980), which inquired about the number of individuals available in diverse settings. We used only those items that explicitly referenced friends (e.g. ‘How many individuals (friends) do you meet or talk to on the phone in an ordinary week?’). Response formats varied across items (i.e. ranging from 2 to 5-point items), so items were standardized within each time point before averaging; thus, the composite was a standardized index, and its unstandardized coefficients should be interpreted accordingly. One item was binary; it was kept in the composite but removed from invariance testing. Higher scores indicated greater levels of friends’ social support. Internal consistency was good (McDonald’s omega = .86 to .89), and the original ISSI demonstrated sufficient test–retest reliability and construct validity (Eklund, Bengtsson-Tops, & Lindstedt, Reference Eklund, Bengtsson-Tops and Lindstedt2007; Henderson et al., Reference Henderson, Duncan-Jones, Byrne and Scott1980).
Depression severity
Depression severity was assessed with the 20-item Center for Epidemiologic Studies Depression Scale (CES-D; Radloff, Reference Radloff1977), which inquired about the extent to which each symptom was present in the past week. Items were scored from 0 (never or almost never) to 3 (always or almost always), with four positively worded items reverse-coded, so that higher values indicated greater depression severity. Internal consistency ranged from good to excellent (McDonald’s omega = .85 to .91). Moreover, the CES-D scores displayed moderate test–retest reliability and good construct validity (Li & Hicks, Reference Li and Hicks2010; Morin, Belleville, Belanger, & Ivers, Reference Morin, Belleville, Belanger and Ivers2011; Radloff, Reference Radloff1977).
Analytic plan
The key confirmatory model was the within-pair difference-score path model among monozygotic twins, which eliminates all genetic variance. The key sensitivity analysis model was the associated dizygotic model, which retains, on average, about 50% of additive genetic variance (Gonggrijp et al., Reference Gonggrijp, van de Weijer, Bijleveld, van Dongen and Boomsma2023). Serial and parallel model structures were fit within each subsample. Composites were item averages, with social support items standardized before analyses due to response scale variations. We used lavaan (Rosseel, Reference Rosseel2012) to estimate models with robust maximum likelihood. Indirect effects were derived using the product-of-coefficients method and reported as standardized coefficients with 95% Monte Carlo confidence intervals based on 20,000 draws (Pesigan & Cheung, Reference Pesigan and Cheung2024). Item-level missing data were managed using random forest imputation with twin pairs arranged in wide format before calculating composites (Stekhoven & Buhlmann, Reference Stekhoven and Buhlmann2012), and internal consistency was calculated using McDonald’s omega (Dunn, Baguley, & Brunsden, Reference Dunn, Baguley and Brunsden2014).
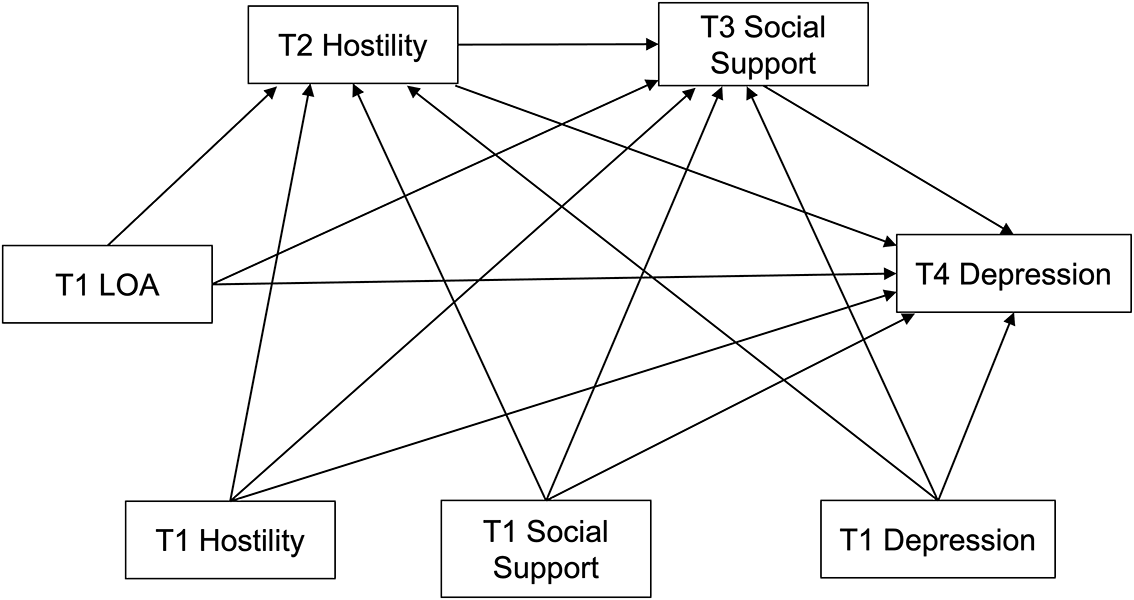
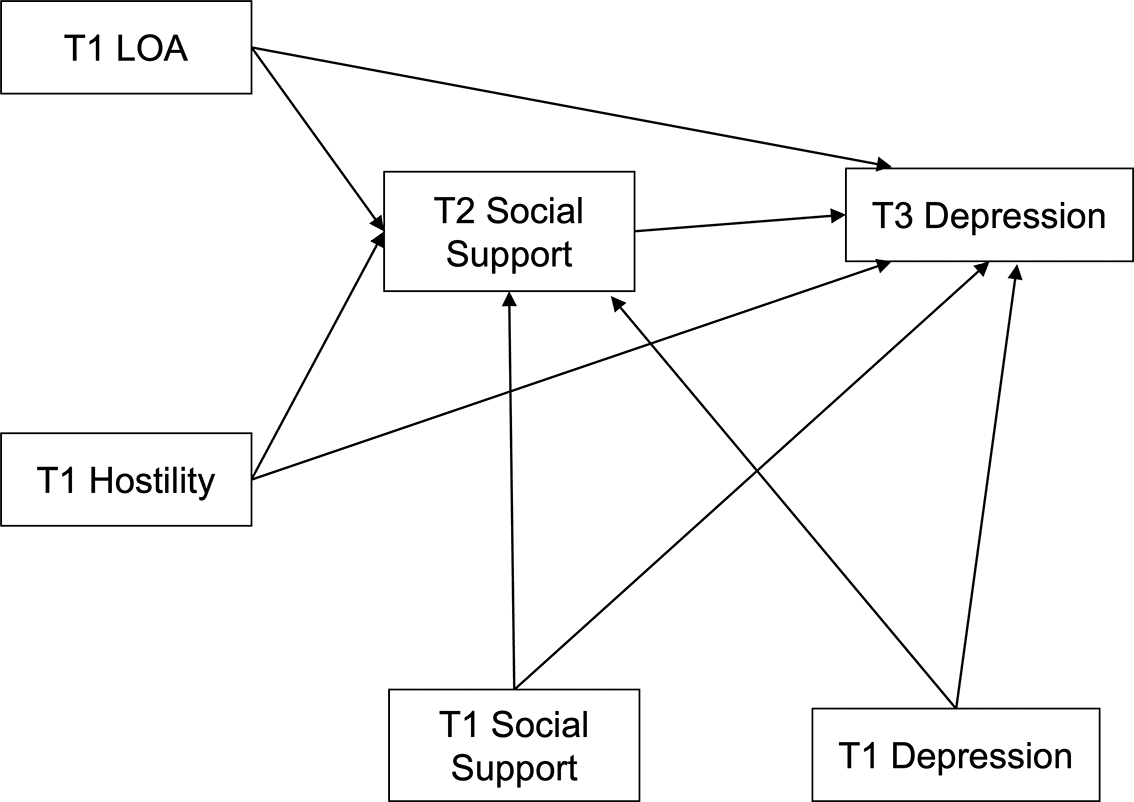
All other models were supplementary. Preliminary descriptive analyses comprised univariate ACE (Additive genetic, Common environmental, and unique Environmental) decompositions of each construct and intraclass twin correlations by zygosity and rearing status. First, bivariate ACE decompositions divided cross-construct covariance into genetic, common, and unique environmental components. Second, phenotypic cluster-robust structural equation models (SEMs) were estimated, replacing composites with latent factors. Each latent factor was composed of three parcels derived by assigning items in a balanced manner across waves (Little, Rhemtulla, Gibson, & Schoemann, Reference Little, Rhemtulla, Gibson and Schoemann2013; Little, Rioux, Odejimi, & Stickley, Reference Little, Rioux, Odejimi and Stickley2022; Yang, Nay, & Hoyle, Reference Yang, Nay and Hoyle2010). Cluster-robust models were estimated since they adjust standard error (SE) computations to account for twin clustering but do not eliminate between-pair variance from point estimates. Latent factors were estimated only in these models, because the difference-score, multiple-group, and multilevel models were either fit in substantially smaller samples (317 and 645 pairs) or had to estimate parameters for multiple groups or levels, which would not support the additional parameters of a measurement model. These models, which controlled for baseline measurements of all mediators and outcomes, were then compared with models using different baseline covariate specifications (depression-only, none). Third, cluster-robust multiple-group models evaluated moderation by zygosity and rearing status, contrasting freely estimated (versus path-constrained) models. Fourth, two-level models with twin pairs as the nesting unit differentiated between-pair from within-pair effects. Finally, we checked for multicollinearity (via tolerance and variance inflation factor [VIF]), longitudinal measurement invariance (via change in comparative fit index [CFI] and root mean square error of approximation [RMSEA]), predictor-to-mediator robustness, and the fit of alternative models. Akaike/Bayesian information criteria (AIC/BIC) were compared only among models with common indicator sets. Figures 1 and 2 present conceptual diagrams of the serial and parallel model structures; all parameter estimates are reported in Tables 2 and 3.
Conceptual path diagram of the serial mediation model.
Note: T1, Timepoint 1; T2, Timepoint 2; T3, Timepoint 3; T4, Timepoint 4; LOA, lack of assertiveness; Depression, depression severity. All T1 variables were correlated with each other. Almost all models in the primary and supplementary analyses used observed composites. Note that only the cluster-robust phenotypic path models in Supplementary Tables S5–S10 and S17 used latent factors, built with three parcels per latent construct.

Figure 1. Long description
The flowchart consists of seven rectangular nodes connected by unidirectional arrows.
At the far left is the primary predictor node: T 1 L O A.
Along the bottom are three baseline control nodes: T 1 Hostility, T 1 Social Support, and T 1 Depression.
In the upper-middle section are two serial mediators: T 2 Hostility followed by T 3 Social Support.
At the far right is the outcome node: T 4 Depression.
Pathways are as follows:
* T 1 L O A has four outgoing arrows pointing to T 2 Hostility, T 3 Social Support, T 4 Depression, and T 1 Hostility.
* T 1 Hostility points to T 2 Hostility, T 3 Social Support, and T 4 Depression.
* T 1 Social Support points to T 2 Hostility, T 3 Social Support, and T 4 Depression.
* T 1 Depression points to T 2 Hostility, T 3 Social Support, and T 4 Depression.
* T 2 Hostility points to T 3 Social Support and T 4 Depression.
* T 3 Social Support points to T 4 Depression.
The diagram illustrates a dense network where every preceding timepoint variable serves as a predictor for all subsequent timepoint variables in the sequence.
Conceptual path diagram of the parallel mediation model.
Note: T1, Timepoint 1; T2, Timepoint 2; T3, Timepoint 3; LOA, lack of assertiveness; Depression, depression severity. All T1 variables were correlated with each other. Almost all models in the primary and supplementary analyses used observed composites. Note that only the cluster-robust phenotypic path models in Supplementary Tables S5–S10 and S17 used latent factors, built with three parcels per latent construct.

Within-pair difference path estimates for serial and parallel mediation models in monozygotic (MZ) twins

Table 2. Long description
The table is divided into two primary sections: Serial mediation model and Parallel mediation model. Columns include Term, b (unstandardized coefficient), S E (standard error), p (p-value), 95% C I (confidence interval), and beta (standardized coefficient).
1. Serial Mediation Model:
* Regressions: Significant paths include T 1 Hostility to T 2 Hostility (beta = 0.560, p < 0.001), T 1 Dep to T 2 Hostility (beta = 0.171, p < 0.001), T 2 Hostility to T 3 S S (beta = -0.152, p = 0.008), T 1 S S to T 3 S S (beta = 0.567, p < 0.001), T 3 S S to T 4 Dep (beta = -0.238, p < 0.001), T 2 Hostility to T 4 Dep (beta = 0.227, p < 0.001), T 1 L O A to T 4 Dep (beta = 0.147, p = 0.001), and T 1 Dep to T 4 Dep (beta = 0.215, p < 0.001).
* Variances and covariances: All reported variances for T 2 Hostility, T 3 S S, and T 4 Dep are significant (p < 0.001).
* Defined parameters: The indirect effect from T 2 Hostility to T 4 Dep through T 3 S S (b = 0.020, p = 0.014, 95% C I [0.005, 0.038], beta = 0.036) and the total effect of T 1 L O A (b = 0.097, p < 0.001, 95% C I [0.043, 0.152], beta = 0.170) are significant.
2. Parallel Mediation Model:
* Regressions: Significant paths include T 1 Hostility to T 2 S S (beta = -0.086, p = 0.043), T 1 S S to T 2 S S (beta = 0.671, p < 0.001), T 1 Dep to T 2 S S (beta = -0.111, p = 0.003), T 2 S S to T 3 Dep (beta = -0.206, p = 0.002), T 1 L O A to T 3 Dep (beta = 0.205, p < 0.001), T 1 Hostility to T 3 Dep (beta = 0.100, p = 0.039), and T 1 Dep to T 3 Dep (beta = 0.251, p < 0.001).
* Variances and covariances: Variances for T 2 S S and T 3 Dep are significant (p < 0.001).
* Defined parameters: Total effect of T 1 L O A (b = 0.099, p < .001, 95% C I [0.056, 0.143], beta = 0.216) and Total effect of T 1 hostility (b = 0.048, p = 0.014, 95% C I [0.010, 0.088], beta = 0.118) are both significant. The indirect effect of T 1 Hostility is significant only with Monte Carlo intervals (b = 0.007, p = 0.120, 95% C I [0.0001, 0.0186], beta = 0.018). Initialisms used: L O A (lack of assertiveness), S S (social support), Dep (depression), T 1 through T 4 (Timepoints 1 to 4), C I (confidence interval), S E (standard error), M Z (monozygotic).
Note: Model was run on the difference scores of MZ twin pairs to control for shared familial confounding. Model was constructed using observed composites. b, unstandardized regression coefficient; p, p-value; CI, confidence interval; β, standardized regression coefficient; T1, Timepoint 1; T2, Timepoint 2; T3, Timepoint 3; T4, Timepoint 4; LOA, lack of assertiveness; SS, social support; Dep, depression. SS items were standardized before averaging. Delta 95% CIs are reported for regressions, variances, and covariances. Monte Carlo 95% CIs are reported for defined parameters.
Within-pair difference path estimates for serial and parallel mediation models in dizygotic (DZ) twins

Table 3. Long description
The table is divided into two primary sections: Serial mediation model and Parallel mediation model. Each section includes columns for Term, b (unstandardized coefficient), S E (standard error), p (p-value), 95% C I (confidence interval), and beta (standardized coefficient).
Serial Mediation Model Highlights:
* T 1 L O A yields T 2 Hostility (a 1 path): b = 0.093, p = 0.003, beta = 0.089.
* T 2 Hostility yields T 3 S S (a 2 path): b = -0.181, p < 0.001, beta = -0.163.
* T 3 S S yields T 4 Dep (b path): b = -0.088, p < 0.001, beta = -0.175.
* Indirect effect from T 2 Hostility to T 4 Dep through T 3 S S: b = 0.016, p = 0.010, 95% C I [0.006, 0.030], beta = 0.029. Serial indirect effect: b = 0.001, p = 0.057, 95% C I [0.0003, 0.0035], beta = 0.003. Total indirect effect: b = 0.012, p = 0.018, 95% C I [0.003, 0.024], beta = 0.021.
* Total effect of T 1 L O A: b = 0.042, p = 0.052, 95% C I [-0.0005, 0.0849], beta = 0.072.
Parallel Mediation Model Highlights:
* T 1 L O A yields T 2 S S (a 1 path): b = -0.041, p = 0.222, beta = -0.034.
* T 1 Hostility yields T 2 S S (a 2 path): b = -0.082, p = 0.009, beta = -0.077.
* T 2 S S yields T 3 Dep (b path): b = -0.069, p < 0.001, beta = -0.174.
* Indirect effect of T 1 Hostility: b = 0.006, p = 0.036, 95% C I [0.001, 0.012], beta = 0.013. Total indirect effect: b = 0.008, p = 0.029, 95% C I [0.002, 0.018], beta = 0.019.
* Total effect of T 1 L O A: b = 0.049, p = 0.005, 95% C I [0.015, 0.083], beta = 0.103. Total effect of T 1 Hostility: b = 0.072, p < .001, 95% C I [0.040, 0.105], beta = 0.172.
Initialisms used: L O A (lack of assertiveness), S S (social support), Dep (depression), T 1 through T 4 (Timepoints 1 to 4), C I (confidence interval), S E (standard error), D Z (dizygotic).
Note: Model was run on the difference scores of DZ twin pairs to control for shared familial confounding. Model was constructed using observed composites. b, unstandardized regression coefficient; p, p-value; CI, confidence interval; β, standardized regression coefficient; T1, Timepoint 1; T2, Timepoint 2; T3, Timepoint 3; T4, Timepoint 4; LOA, lack of assertiveness; SS, social support; Dep, depression. SS items were standardized before averaging. Delta 95% CIs are reported for regressions, variances, and covariances. Monte Carlo 95% CIs are reported for defined parameters.
Results
Preliminary descriptive analyses
Zero-order correlations by wave (Supplementary Table S1 in the online supplemental materials [OSM]), univariate ACE decompositions (Supplementary Table S2), and intraclass twin correlations (Supplementary Table S3) are available in the OSM. Variance decompositions yielded moderate to high heritability (h²) for LOA (h 2 = .408, c 2 = .175, e 2 = .417), hostility (h 2 = .529 to .587, c 2 = .000 to .003, e 2 = .410 to .471), social support (h 2 = .541 to .562, c 2 = .033 to .074, e 2 = .385 to .405), and depression (h 2 = .699 to .771, c 2 = .017 to .055, e 2 = .212 to .247). The intraclass correlations for monozygotic twins reared apart were moderate to high (r = .369 to .817).
Within-pair differences in monozygotic twins
Within-pair difference scores in monozygotic twins (n = 317 pairs) eliminated all genetic confounding by design (core confirmatory analysis). In the serial mediation model, T1 LOA did not significantly predict T2 hostility (β = 0.019, p = .687). However, higher T2 hostility significantly predicted lower T3 social support (β = −0.152, p = .008), which in turn significantly predicted higher T4 depression (β = −0.238, p < .001). T1 LOA did not significantly predict T3 social support (β = −0.075, p = .061). However, both T1 LOA (β = 0.147, p = .001) and T2 hostility (β = 0.227, p < .001) directly predicted T4 depression. The serial indirect effect (b = 0.000, 95% CI [−0.002, 0.003], β = 0.001), the indirect effect via hostility (b = 0.003, 95% CI [−0.010, 0.017], β = 0.004), and the indirect effect via social support (b = 0.010, 95% CI [−0.0005, 0.0242], β = 0.018) were all non-significant. However, the indirect effect from T2 hostility to T4 depression through T3 social support was significant (b = 0.020, 95% CI [0.005, 0.038], β = 0.036; Table 2).
In the parallel mediation model, T1 LOA (β = −0.053, p = .198) did not significantly predict lower T2 social support. However, T1 hostility (β = −0.086, p = .043) significantly negatively predicted T2 social support, which in turn negatively predicted T3 depression (β = −0.206, p = .002). T1 LOA (β = 0.205, p < .001) and T1 hostility (β = 0.100, p = .039) both had significant, direct, and positive effects on T3 depression. The T1 hostility indirect effect was not significant by the delta-method test (b = 0.007, p = .120), although its Monte Carlo confidence interval (CI) marginally excluded zero (95% CI [0.0001, 0.0186], β = 0.018; Table 2); we therefore do not interpret it as evidence of mediation.
Within-pair differences in dizygotic twins
Difference scores in dizygotic twins (n = 645 pairs) retained approximately 50% of the genetic variance (key sensitivity analysis). In the serial mediation model, T1 LOA significantly positively predicted T2 hostility (β = 0.089, p = .003), which in turn negatively predicted T3 social support (β = −0.163, p < .001). Lower T3 social support in turn predicted higher T4 depression (β = −0.175, p < .001). Higher T1 LOA did not directly predict T3 social support (β = −0.061, p = .063) or T4 depression (β = 0.051, p = .166). T2 hostility also did not significantly predict T4 depression (β = 0.088, p = .078). The indirect effects of T1 LOA through T2 hostility (b = 0.005, 95% CI [−0.001, 0.012], β = 0.008) and T3 social support (b = 0.006, 95% CI [−0.0004, 0.0146], β = 0.011) were both non-significant. Even though the Monte Carlo CI of the serial indirect effect marginally excluded zero (95% CI [0.0003, 0.0035]), this estimate was non-significant by the delta-method test (b = 0.001, p = .057), and its standardized beta magnitude (β = 0.003) was trivial. As in the monozygotic models, the indirect effect from T2 hostility to T4 depression through T3 social support was significant (b = 0.016, 95% CI [0.006, 0.030], β = 0.029; Table 3).
In the parallel mediation model, T1 LOA still did not significantly predict T2 social support (β = −0.034, p = .222). T1 hostility significantly negatively predicted T2 social support (β = −0.077, p = .009), which in turn negatively predicted T3 depression (β = −0.174, p < .001). Both T1 LOA (β = 0.097, p = .006) and T1 hostility (β = 0.158, p < .001) also had significant, positive, and direct effects on T3 depression. The T1 hostility indirect effect was significant (b = 0.006, 95% CI [0.001, 0.012], β = 0.013), but the T1 LOA indirect effect was not significant (b = 0.003, 95% CI [−0.002, 0.009], β = 0.006; Table 3).
Supplementary analyses
The supplementary analyses were largely consistent with the primary analyses. First, the zero-order correlations supported the direction of associations across all time points (Supplementary Table S1). The zero-order hostility–social support association was negative across all time points (r = −.536 to −.329; Supplementary Table S1). A covariate-removal step also verified that the hostility–social support association was consistently negative in all model specifications (Supplementary Table S21).
Additionally, bivariate correlations from the ACE models (Supplementary Table S4) exhibited low non-shared environmental correlations for most variables, particularly LOA–hostility (r[E] = .238) and LOA–social support (r[E] = −.125 to −.115). Only the social support–depression correlation in the parallel model had a high non-shared environmental correlation (r[E] = −.767). The substantial difference from the corresponding correlation in the serial model (r[E] = −.322) may be attributable to the use of different waves to construct each model. In contrast, genetic correlations were moderate to high in magnitude for all pairs (r[A] = −.758 to .855). These bivariate estimates should be interpreted cautiously, because a correlation between two variance components is scaled by those components; when either is near zero, the estimate becomes unstable.
Subsequently, cluster-robust latent-factor models (Supplementary Tables S5–S6) displayed significant effects for all hypothesized structural pathways. A sensitivity analysis comparing this latent-factor model with all three baseline covariates to depression-only (Supplementary Tables S7–S8) and no-covariate (Supplementary Tables S9–S10) configurations replicated this finding. Similarly, rearing-moderated models (Supplementary Tables S11–S12) and zygosity-moderated models (Supplementary Tables S13–S14) displayed significant effects for all hypothesized structural pathways. These results indicate that most structural pathways are significant when genetic factors are not accounted for. Constrained (versus freely estimated) models did not significantly differ by rearing status in the parallel model (Δχ2(9) = 13.280, p = .150) or by zygosity in either the serial or the parallel model (serial Δχ2(15) = 8.557, p = .900; parallel Δχ2(9) = 6.940, p = .643). The unconstrained model fit better only in the rearing-moderated serial model (Δχ2(15) = 30.160, p = .011). Apart from that model, few differences in path magnitudes by rearing status or zygosity were detected, although the tests do not establish equivalence and also retain between-pair variance.
Multilevel models (Supplementary Tables S15–S16), which decomposed within- and between-pair effects, showed that the effects were primarily significant within pairs but non-significant between pairs. As anticipated, the LOA–hostility path in the multilevel model was stronger than the corresponding monozygotic difference-score estimate. This pattern occurs because the multilevel model aggregates monozygotic and dizygotic twin pairs and thus retains about half the genetic variance in dizygotic pairs. Hence, it differentiates between-pair and within-pair variance but not environmental from genetic sources, rendering it supplementary to the monozygotic–dizygotic comparison. Thus, the monozygotic difference model was retained as primary. Among models fit to identical indicators, the hypothesized serial and parallel models had lower AIC and BIC than the full-mediation alternatives (Serial: ΔAIC = 7.15, ΔBIC = 1.53; Parallel: ΔAIC = 89.11, ΔBIC = 77.88; Supplementary Table S17).
Assumption checks
No multicollinearity concerns were identified across any structural equation pathway (all VIF < 5; Supplementary Table S18). For measurement invariance, a level was considered supported when either criterion was met (|ΔCFI| ≤ 0.010 or ΔRMSEA ≤ 0.015; Supplementary Table S19). Metric invariance held for all constructs except T3 social support in the serial model, which met neither criterion (ΔCFI = −0.024, ΔRMSEA = 0.018) and retained configural invariance only. T3 depression in the parallel model, both on its own and in the T1–T3 longitudinal comparison, did not attain scalar invariance. Partial invariance is thus reported, and the results should be interpreted cautiously. We also examined the predictor-mediator relationship in phenotypic models in which genetic variance was not partialed out. There was substantial change ranging from −37.91% to 26.25% in the predictor–mediator relationship when baseline mediators, outcomes, and interactions were controlled for and when predictor effects were isolated. However, the relationships all remained significant (Supplementary Table S20). Finally, to confirm the direction of the hostility-to-social-support pathway, we computed zero-order correlations at every wave (Supplementary Table S1) and partial correlations and regression coefficients across 17 covariate specifications (Supplementary Table S21).
Discussion
This study examined the associations among LOA, hostility, social support, and depression over a 23-year period using a genetically informed design. When examining the cluster-robust phenotypic models without accounting for genetic factors (Supplementary Tables S5–S6), all structural pathways and indirect effects were significant in both the serial and parallel models. However, when all genetic factors were accounted for in the monozygotic difference-score models, only some findings remained robust. In the serial model, hostility predicted lower social support, which in turn predicted higher depression. The indirect effect of hostility on depression through social support was significant. LOA and hostility also both directly predicted depression. The results in the parallel, monozygotic difference-score model converged with these findings. Hostility predicted lower social support, which in turn predicted higher depression. Although non-significant by the delta-method test, the indirect effect of hostility was in the same direction and had a Monte Carlo interval that marginally excluded zero. LOA and hostility both directly predicted depression as well. Because genetic confounding was removed by design, these pathways are consistent with non-shared environmental processes, although residual non-shared confounding, reverse causation, and differential measurement error cannot be excluded (Asbury, Dunn, Pike, & Plomin, Reference Asbury, Dunn, Pike and Plomin2003; Liang & Eley, Reference Liang and Eley2005).
However, not all pathways were robust to genetic control. The LOA–hostility and LOA–social support paths in the serial model were non-significant, rendering all indirect effects of LOA to be non-significant. In the parallel model, LOA did not significantly predict social support, and the indirect effect of LOA was non-significant as well. This suggests that these pathways may be carried substantially by genetic variance shared between the constructs, rather than by environmental experience. This is supported by the bivariate decompositions, which indicated that the genetic correlations of LOA with hostility and social support were much larger in magnitude than their non-shared environmental correlations. Alternatively, within-pair difference scores for LOA were likely the least reliable in the design, so attenuation due to measurement error is a competing explanation.
The dizygotic difference-score models, which remove only about 50% of the additive genetic variance, supported these interpretations. The LOA–social support pathway was significant in the phenotypic models but was not significant in either the dizygotic or the monozygotic difference models; this graded attenuation is consistent with genetic confounding. Relatedly, the LOA–hostility pathway was significant in the dizygotic models (β = 0.089) but not in the monozygotic models (β = 0.019). This pattern is also consistent with genetic confounding, given that dizygotic differencing removes only half of the additive genetic variance. The two estimates were not formally compared, however, and the dizygotic models were fit in about twice as many pairs, so the difference in statistical significance may not reflect a difference in effect size.
The findings suggest that the relationships of LOA with hostility and social support are consistent with genetic confounding. However, the hostility–social support–depression pathway was robust to genetic control. This aligns with the psychosocial vulnerability model of hostility (Smith, Reference Smith1992), which proposes that hostility erodes social relationships and in turn elevates depression risk. The mediating role of social support in predicting depression was also supported. This aligns with the convoy model, in which one’s personal characteristics affect one’s social convoy, which in turn contributes to well-being in later life (Antonucci, Ajrouch, & Birditt, Reference Antonucci, Ajrouch and Birditt2013; Fuller, Ajrouch, & Antonucci, Reference Fuller, Ajrouch and Antonucci2020).
The present study had several limitations. First, key variables were measured with self-report questionnaires, which may introduce social desirability bias, response bias, and common method variance (Demetriou, Ozer, & Essau, Reference Demetriou, Ozer, Essau, Cautin and Lilienfeld2015). Second, we assessed social support only from friends and did not assess family support. Future studies could examine family support across populations and cultures, where effects may differ (Poulin et al., Reference Poulin, Deng, Ingersoll, Witt and Swain2012). Third, our sample comprised Swedish twins (mean age 58.7 years). Thus, findings from this midlife and older adult Swedish sample may not generalize to younger or non-twin cohorts. Fourth, attrition was substantial over the 23-year observation window. Additionally, only twins aged 50 years or older were invited to IPTs, causing missing data for younger participants (Finkel & Pedersen, Reference Finkel and Pedersen2004). Random forest imputation addressed missing data, but it cannot fully recover unobserved data (Hong & Lynn, Reference Hong and Lynn2020). Fifth, the use of observed composites in the primary models carries measurement error, which attenuates within-pair estimates more than individual-level ones (Frisell, Öberg, Kuja-Halkola, & Sjölander, Reference Frisell, Öberg, Kuja-Halkola and Sjölander2012).
Despite some limitations, this study has several clear strengths. First, we leveraged the SATSA dataset, which provides a large, population-based sample and 26 years of longitudinal follow-up, of which 23 years were analyzed here (Pedersen, Reference Pedersen2015). This enabled mediation analysis with temporally ordered measures, strengthening confidence in our results compared with cross-sectional studies (Maxwell, Cole, & Mitchell, Reference Maxwell, Cole and Mitchell2011). We also implemented a behavioral genetics framework, which enabled the isolation of environmental pathways from genetic confounders. Finally, the concurrent evaluation of parallel and serial mediation models clarified whether LOA and hostility act jointly or sequentially in predicting depressive symptoms.
If replicated, these findings could inform efforts to prevent and treat depression in middle-aged and older adults, underscoring the clinical importance of these processes. Because the effects of LOA on hostility and social support did not survive genetic control, these particular pathways are unlikely to be productive prevention targets, although genetic confounding of an observational association does not establish that assertiveness training would be ineffective. However, the pathway from hostility to depression through social support was significant. LOA and hostility also both had significant direct effects on depression after accounting for all genetic factors. These findings suggest actionable clinical pathways that target environmental experiences, rather than fixed genetic vulnerabilities (Kendler & Prescott, Reference Kendler and Prescott2006; Polderman et al., Reference Polderman, Benyamin, de Leeuw, Sullivan, van Bochoven, Visscher and Posthuma2015). Clinicians should monitor changes in assertiveness, hostility, and social support over time, rather than relying on static baseline measures (Molenaar & Beltz, Reference Molenaar, Beltz, Wright and Hallquist2020). When heightened LOA or hostility appears, clinicians could focus on both assertiveness and social skills training (Speed et al., Reference Speed, Goldstein and Goldfried2018), intercepting both the direct LOA–depression pathway and hostility–social support–depression chain. Because hostility had direct, environmentally mediated effects, addressing hostile attributional biases should also be central in prevention and relapse strategies (Mathes Winnicki & Schmidt, Reference Mathes Winnicki and Schmidt2023; Zhou et al., Reference Zhou, Zhao, Zhu, Liu, Meng, Shao, Zhu, Xiang, He, Zhao, Yuan, Gao, Jiang and Zhu2023). Given the significant direct effects, future twin-based designs could identify other environmental mechanisms linking LOA and hostility to depression.
Supplementary material
The supplementary material for this article can be found at http://doi.org/10.1017/S0033291726106230.
Data availability statement
The data used in this study were derived from the Swedish Adoption/Twin Study of Aging (SATSA). These data are publicly available to qualified researchers through the Inter-university Consortium for Political and Social Research (ICPSR). Researchers can obtain access by applying directly through the ICPSR repository (https://www.icpsr.umich.edu/web/ICPSR/studies/3843). Analytic code supporting the findings of this study is available from the corresponding author upon reasonable request. All measures and analytic procedures are described in sufficient detail within the manuscript and supplemental materials to permit replication.
Funding statement
The present research was supported by the National University of Singapore (NUS) Presidential Young Professorship (PYP) Start-Up Grant and the White Space Fund (A-0009981-00-00; A-0009981-01-00), both awarded to Nur Hani Zainal. Since 1984, the Swedish Adoption/Twin Study of Aging (SATSA) has been funded by the following: the National Institute on Aging (AG-04563, AG-10175), the MacArthur Foundation Research Network on Successful Aging, the Swedish Council for Working Life and Social Research (Forskningsrådet för arbetsliv och socialvetenskap, FAS), and the Swedish Research Council (Vetenskapsrådet). None of the funding agencies is responsible for the analyses or interpretations presented here.
Competing interests
The authors declare that they have no competing interests.
Pre-registration statement
This study was not preregistered. The present investigation relied on secondary analyses of an existing longitudinal-archival dataset (the Swedish Adoption/Twin Study of Aging, SATSA) spanning multiple waves over more than two decades. The analytic strategy required extensive harmonization of variables across waves and alignment of constructs measured at different time points before formal model specification was feasible. Consequently, the mediation models were developed after careful data preparation and theoretical integration of the available measures, which rendered prospective preregistration impractical for this secondary data analysis.



 Open access

