
I. INTRODUCTION
Upconversion luminescent nanoparticles (UCNPs) have attracted much interest due to their multiple applications in areas such as lasers, TV displays, and fluorescence imaging. In biomedicine, UCNPs have been successfully used for cell imaging because of their luminescence intensity, which does not fade. The rare earth elements used as dopants have the advantage that their antiStokes luminescence emission wave length (visible spectra λ = 400–700 nm) is shorter than the excitation wave length (λ = 980 nm). Reference Blasse and Grabmaier1 The upconversion process (UCP) is different from conventional luminescence processes or down-conversion, which are defined by the presence of only a single excited state; in contrast, the UCP depends on the accumulation of low-energy pump photons through multiple metastable excited states. Reference Blasse and Grabmaier1,Reference Da Costa, Doughan, Han and Krull2
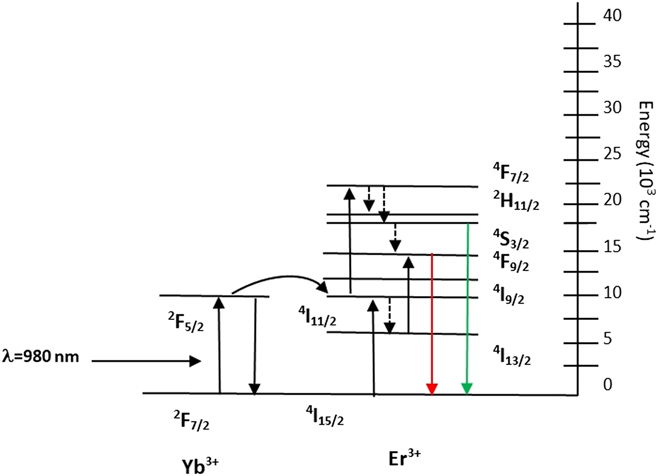
In this study we used the UCNPs Y2O3:Yb3+, Er3+ (1%, 10% mol) and Gd2O3:Yb3+, Er3+ (1%, 10% mol). Reference Chávez, Contreras and Hirata3 The nanoparticles showed red emission (λ = 660 nm) due to the energy transfer upconversion process (ETU) between the two lanthanide ions Er3+ and Yb3+. Reference Blasse and Grabmaier1 In the ETU process, the sensitizer ion Yb3+ receives energy at 980 nm wave length and the electron is excited from the base state 2F7/2 to 2F5/2. This energy is transferred to the Er3+ ion (activator), which leads to excitation from the base state 4I15/2 to a metaestable state 4I11/2. This electron receives a second photon and rises to the 4F9/2 level, with subsequent decay to the base state with emission in red. Reference Chávez, Contreras and Hirata3,Reference Zhang4 The color of the emission varies according with the percentage of dopant elements. In a previous study in our laboratory, different hosts and dopants were examined to obtain the nanoparticles with the best properties and luminesce to be used as biolabels; results were published in Ref. Reference Chávez, Contreras and Hirata3.
To be considered as biolabels, the UCNPs should be biocompatible and functionalized with specific ligands on the surface that allow them to identify certain specific cells. We prepared UCNPs coated with a thin silica shell by the TEOS technique; these were then functionalized with amine groups (NH2), which in turn were used to enable folic acid conjugation by the APTES/TEOS technique. Reference Chávez, Juárez-Moreno and Hirata6 Silanes attached to the surface of the UCNPs by the formation of a Si–O–Si bond. 3-(Aminopropyl) triethoxysilane (APTES) has been previously used Reference Sudimack and Lee10,Reference Sounderya and Zhang12 to bind biomolecules to the surface of a given nanomaterial by its amine terminal groups. The APTES is used as a coupling agent for the modification of silica surfaces to increase adhesion in fiberglass-epoxy composites. APTES films are used to promote protein adhesion and cell growth for biological implants. It can be used to join metal nanoparticles to silica substrates because of the strong interaction between the amine group and the metal particles. The amine groups fixed to the UCNP surface then attaches to folic acid ligands (FA), thus functionalizing the UCNPs. The FA binds with the folic acid receptor (FR), which is over-expressed on the surface of the MCF-7 breast cancer cells. Once the FA–FR binding occurs, the cell proceeds to internalize the UCNP-NH2-FA by endocytosis. Reference Lu, Sega, Leamon and Low7
MCF-7 breast cancer cells derive from invasive ductal carcinoma (IDC), one of the most common types of breast cancer about 80% of all breast cancers are invasive ductal carcinomas. This type of cancer shows a proliferative response to estrogens. The MCF-7 cell line is able to process estradiol via cytoplasmic estrogen receptors and can also form domes. Reference Soule, Vazquez, Long, Albert and Brennan8
The UCNPs both bare and functionalized, were characterized by transmission electron microscopy (TEM), Fourier transform infrared spectroscopy (FTIR), and luminescence measurements. UCNP cytotoxicity was examined with the MTT colorimetric assay (methyl-134 thiazolyltetrazolium). Reference Hemmer, Yamano, Kishimoto, Venkatachalam, Hyodoand and Soga9 This colorimetric assay shows the percentage of living and dead cells after their incubation with the UCNPs. All UCNPs-NH2-FA were noncytotoxic and were clearly localized within the cell cytoplasm via confocal microscope. The herein observed internalization of functionalized nanoparticles within cancerous cells is a novelty and constitutes an advance in the possibilities of cancer detection. However, further in vivo studies are needed to verify nanoparticle internalization in cancer cells of living organisms.
II. MATERIALS AND METHODS
A. Upconversion luminescence
Known upconversion processes (UCP) can be classified into five mechanisms: excited state absorption (ESA); cooperative upconversion (CUC); photon avalanche (PA), also called addition de photons par transfert d’energie (APTE); energy migration upconversion (EMU) and energy transfer upconversion (ETU). Reference Blasse and Grabmaier1,Reference Da Costa, Doughan, Han and Krull2
In the ESA process, a single ion (such as Er3+) absorbs at least two photons. The absorbed electrons start at the ground state; if resonance conditions occur, the electron is promoted to the first metastable energy level (E1). The E1 level has a long half-life, which allows the absorption of a second photon and the successive promotion of the electron to a higher excited state (E2). The relaxation of the electron to the ground state results in the emission of a photon with higher energy and shorter wave length than the original absorbed photons.
Energy transfer upconversion (ETU) has a successive absorption of two resonant excitation photons, such as Yb3+ with Er3+, Tm3+, or Ho3+, among others; thus, the population of electrons reaches the higher state E2. The difference with the ESA process is that both ions can be excited to the metaestable energy level E1 at the same time; the activator receives energy from the sensitizer, so the electron can rise to the higher energy level E2. The sensitizer relaxes to the ground state and the activator emits with a shorter wave length photon. The energy transfer occurs due to a coulombic overlap in two electronic systems, such as the sensitizer-activator. This process is twice as efficient as the ESA process due to this overlap of electric fields of both ions (see Fig. 1 for details), where state E1 is 2F5/2 for Yb3+ and level 4I11/2 for Er3+ ions, respectively, and state E2 may be 4F7/2 for Er3+ with the relaxation to 4S3/2 level or 4F9/2 depending of the percentage of the doping for Er3+ ion and further decay to base state with red or green emission. Reference Blasse and Grabmaier1
Excited state absorption process between Er3+ and Yb3+.

The cooperative upconversion (CUC) process can occur between two or three ions because it is distinguished by second order electronic transitions. This process is more difficult to achieve than ETU or ESA. The photon avalanche (PA) depends on ESA and ETU to obtain a higher population of ions and it has three nonlinear mechanisms: transmission, emission, and rise-time. In this mechanism there are four energy levels: ground state, E1, E2, and E3, the last levels are the excited states and level E3 is the highest. The promotion starts from ground state to level E2, the electron relaxes to E1 and results in either the promotion of a ground state electron to the E1 state in the same ion, or in that of a neighboring ion via ion-pair relaxation energy transfer processes. The incident energy is in resonance with the E1 near E3 levels, so this result in the promotion to level E3. Nonradiative relaxation from the E3 to the E1 state results in ion-pair relaxation energy transfer, promoting two ground state electrons, either in the same ion or neighboring ions or some combination thereof, to the E1 state. The electrons are back to E3 due to the resonant ESA process; this process can be repeated several times and there is an exponential increase of the electron population to E3. The relaxation from E3 to ground state results in radiative upconversion emission. Reference Blasse and Grabmaier1–Reference Zhang4
Energy migration upconversion (EMU) has the characteristic of avoiding the requirement for activator ions, with long-lived metastable excited states; this process allows a higher degree of tunability of the standard upconversion luminescence. The nanoparticles with core–shell and four types of rare earth ions can exhibit this behavior. The ions used can be of four types: sensitizers, accumulators, migrators, and activators; and these ions are confined in different areas of the host lattice. Each type of ion has a function; the sensitizer and accumulator are in the core of the material and the sensitizer obtains the photons. This energy is transferred to the accumulator ions. The main property of these ions is that they have long-life metaestable energy levels and they promote the electrons to a higher energy state, such as Tm3+, Er3+, and Ho3+. The migrator ions extract the energy from the core and transfer it to the shell, the migrator ions take the energy stored by accumulators and they transfer it to an activator present in the shell. The relaxation of the activator ion results in the emission of a photon with radiative emission. Reference Blasse and Grabmaier1–Reference Zhang4
B. Selection of the host lattice and dopant ions
The host lattice plays an important role when combined with the dopant ions because it has a strong influence on the UCP. The distance between de ions depends on the host lattice, as do their relative spatial position, coordination numbers, and the anions surrounding the dopant. It is essential for the selection of the host lattice to have high efficiency of color emission. The most important requirements of the host lattice are low phonon energy and small lattice mismatch to the dopant ions. The low phonon energy minimizes nonradiative loss and maximizes the radiative emission. Typical host lattices can be heavy halides such as chlorides or bromides, but these have limited use because they are hygroscopic and chemically unstable. Fluorides have good qualities and also oxides provide high chemical stability. The combination of lanthanide elements with trivalent ions produces excellent materials for the UCP. These ions have a similar ionic size as the used upconversion phosphors. This is why we chose the host lattices Y2O3 and Gd2O3. The optical properties are phase-dependent and depend on the different crystal fields around trivalent lanthanide ions in matrices of various symmetries. The electronic coupling between the 4f energy levels and higher electronic configurations increase f–f transition probabilities of the dopant ions due to the uneven and low-symmetry crystal fields. Reference Chávez, Contreras and Hirata3,Reference Zhang4
The advantage of combining trivalent lanthanide ions, such as Er3+ and Yb3+, with transition metals (TM) such as Yttrium as the host, is that there are a cooperative upconversion mechanisms involving both ions. The absorption and luminescence properties of TM may change due to the environment and the coordination geometry, in comparison with lanthanide ions with f–f transitions that are independent of their environment. So, the selection of TM ion is important to optimize energetic positions of the absorption and luminescence because it opens the way toward UC materials where excitation in the NIR leads to broadband emission in the visible spectral region. Reference Zhang4,Reference Kong, Shan and Ju5
The new discoveries in nanomaterials with UCP with crystal host lattices have developed new paths in biomedicine. The luminescent biolabels excited in the NIR region have great advantage over down-conversion materials or organic dyes because the photodegradation is reduced and also biological tissues are much more transparent to NIR than to ultraviolet light. The UCNPs of size less than 100 nm are better candidates for biolabels in comparison with bulk materials because both have 4f–4f electronic transitions and the same luminescence peaks, but nanosize materials can penetrate organs and tissues. One of the disadvantages of nanosize materials is that their efficiency may be reduced due to surface defects and the lanthanide ions can show surface deactivation. This deactivation may be caused directly by neighboring surface quenching centers or the energy contained in dopants can randomly migrate and travel from the dopant around the surface or directly to the surface quenching sites. The phonons also influence the optical properties and may reduce the efficiency of bulk materials that does not have surface-induced deactivations. As explained before, the host lattice needs to have low phonon energy to avoid these problems.
UCNPs do not show blinking and photobleaching; they have chemical stability, show NIR light excitation and large anti-Stokes emissions. These properties make them excellent candidates for biolabels. The most important characteristics of UCNPs to be applicable to biomedicine are: (i) multicolor emissions with high efficiency, (ii) uniform shape, form and stoichiometric composition; it is required that all the UCNPs have identical optical properties as well as cellular uptake; (iii) engineered surfaces (functionalization) for phase transfer and for coupling to targeting ligands; the functionalized surface allows their dispersion in aqueous phase for biological applications. Also, the UCNPs need specific ligands to target biological moieties to identify specific regions or cells. (iv) Biocompatibility it is very important, the UCNPs need to be noncytotoxic and biocompatible to cells. Reference Blasse and Grabmaier1,Reference Zhang4
C. Synthesis of the UCNPs
1. Sol–gel method
The precursors used were: Y(NO3)3 (99.9965%; Alfa Aesar, Haverhill, Massachusetts) or Gd(NO3)3 (99.99% Alfa Aesar, Haverhill, Massachusetts) with Yb(NO3)3 (99.9%; Alfa Aesar, Haverhill, Massachusetts) and Er(NO3)3 (99.9%; Alfa Aesar, Haverhill, Massachusetts). They were diluted with 14% mol concentration of HNO3; in addition, tartaric acid (C4H6O6; Sigma Aldrich, St. Louis, Missouri) was dissolved in de-ionized water with molar concentration of 1:2 for the ions present in the Y2O3 and Gd2O3. Each individual solution was mixed under constant stirring. Both solutions were mixed and stirred for 24 h at room temperature. The pH of 5.0 was verified and the mixture was heated under constant stirring at 80 °C for 2 h which yielded a denser sol. The sol was heated at 120 °C until a gel was produced and dried to form the xerogel. The xerogel was collected and annealed at 1200 °C for 2 h for the UCNPs Y2O3:Yb3+, Er3+ (1%, 10% mol) and at 900 °C for 2 h for Gd2O3:Yb3+, Er3+ (1%, 10% mol) nanoparticles. Reference Chávez, Contreras and Hirata3
2. Combustion synthesis
We also prepared UCNPs by this method to compare with samples synthesized with the sol–gel. The solution for the combustion synthesis of Gd2O3:Er3+/Yb3+ was prepared with the precursors Gd(NO3)3 (99.9965%; Alfa Aesar, Haverhill, Massachusetts), Yb(NO3)3 (99.9%; Alfa Aesar, Haverhill, Massachusetts), Er(NO3)3 (99.9%; Alfa Aesar, Haverhill, Massachusetts) dissolved in 20 mL of deionized water. They were stirred to homogenize the solution. Carbohydrazide (CH6N4O 97%; Alfa Aesar, Haverhill, Massachusetts) was added into the solution until a transparent color was obtained. The solution was placed inside a muffle furnace preheated at 500 °C and a reaction with spontaneous combustion occurred; the reaction was exothermic and this phenomenon heated the precursor mixture to an even higher temperature. A large amount of gases was produced due to the gas-phase reaction. Then, the obtained powder was post-annealed at 900 °C for 2 h and kept inside the oven for cooling until reaching room temperature. This process allows the sample to crystallize. Reference Chávez, Contreras and Hirata3 The same reaction was used for the Y2O3:Er3+/Yb3+ samples but the precursor changed to Y(NO3)3 (99.9%; Alfa Aesar, Haverhill, Massachusetts). The same post-annealing treatment was performed at a higher temperature of 1200 °C. The difference in the annealing temperature is due to the chemical stability of the gadolinium oxide and yttrium oxide; it is reported that the gadolinium oxide host provides better luminescence properties at 900 °C than any other sample annealed. Reference Chávez, Contreras and Hirata3
D. Silica and aminosilane functionalization
To be biocompatible the UCNPs need to have a core shell structure to protect the nanoparticle and the cells involved. Also, the biolabels need to have specific properties to target a specific tumor: the size must be less than a 100 nm and the surface needs to have the proper ligands that bind to the surface of the cells. Reference Zhang4,Reference Sudimack and Lee10
We covered the surface with a thin silica shell by the Stöber method Reference Stöber, Fink and Bohn11 and then added the amine groups with the APTES technique. Reference Sounderya and Zhang12 The bare UCNPs (10 mmol) were mixed with distilled water and agitated constantly for 20 min. At the same time, we separately mixed ethanol and 0.6 mL of TEOS (Tetraethyl orthosilicate, 98%; Sigma Aldrich, St. Louis, Missouri). Both solutions were mixed with ammonium hydroxide (NH4OH, Sigma Aldrich, St. Louis Missouri), 0.2 mL of surfactant IGEPAL (Sigma Aldrich, St. Louis Missouri) and distilled water and agitated for 24 h. The coated UCNPs required centrifugation, filtration and they were then annealed at 900 °C for 2 h. UCNPs were ultrasonicated before the aminosilane functionalization (UCNP-NH2) to avoid agglomeration, then they were mixed with ethanol, 0.02 mL of 3-aminopropyl-trimethoxysilane (APTES, 98% Sigma Aldrich, St. Louis, Missouri), 0.14 mL of TEOS and 0.2 mL of ammonium hydroxide, for 4 h. They were dried and centrifuged again. Reference Chávez, Juárez-Moreno and Hirata6,Reference Sounderya and Zhang12
E. Ultrasonication
To avoid agglomeration, the UCNPs were ultrasonicated with a high intensity ultrasonic processor (Sonics & Materials, Inc., Newtown, Connecticut). We applied 70% of the amplitude for about 30 min with 20 mL of isopropanol/ethanol. For the cytotoxicity assays, they were washed and ultrasonicated with distilled water.
F. Folic acid conjugation
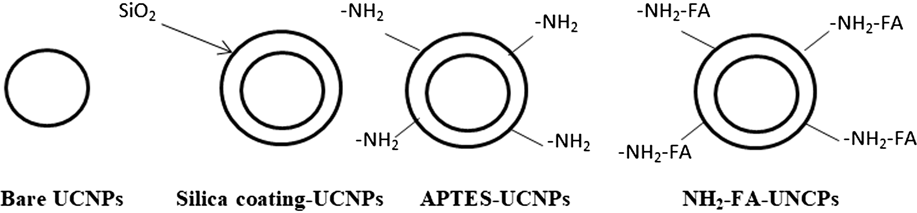
After the aminosilane functionalization, the UCNPs were functionalized with folic acid ligands. To achieve this, a Schlenk system was used with 0.500 g of FA y 500 μL de distilled triethylamine (TEA) in 10 mL of dry dimethyl sulfoxide (DMSO) in an N2 atmosphere with n-hydroxisuccinimide (NHS, 99% PS) (C4H5NO3) in the presence of N,N′-dicyclohexylcarbodiimide (DCC) (C13H22N2). We mixed in the darkness, all night at 37 °C, 0.260 g of NHS and 0.470 g of DCC and filtered, the UCNP-NH2 had a brown color. They were dispersed in 25 mL of a carbonate/bicarbonate buffer (0.01 M pH = 9.0) and further ultrasonicated for 5 min. Then, 3 mL of a FA-NHS solution were added. The solution was agitated again in the darkness for 2 h. The resulting UCNP-NH2-FA were centrifuged (6000 rpm for 15 min), washed with DMSO (3 × 45 mL) and ethanol (5 × 45 mL). Finally, they were vacuum dried overnight at 30 °C and they turned into yellow in color. Figure 2 shows the schematic illustration outlining the preparation of amino-silane-folic acid-UCNPs.
Schematic illustration outlining the preparation of amino-silane-folic acid-UCNPs.

G. Characterization
Transmission electron microscopy (TEM) was used to study the morphology and size of the UCNP (JEM-2100-F, JEOL, Peabody, Massachusetts). This was also used to do the EDS analysis spectra (energy-dispersive X-ray spectroscopy) to confirm the presence of silica on the surface of the UCNPs. The fluorescence spectrometer (PL, Hitachi® FL-4500, Hitachi, Ltd., Tokyo, Japan) with a laser with 980 nm for excitation was used to analyze the photoluminescence of the bare and functionalized UCNPs. FTIR (Fourier transform infrared spectroscopy) analysis was done to confirm the aminosilane-folic acid functionalization in the range of 400–4000 cm−1 (Thermonicolet 1700, Thermo Fisher Scientific, Waltham, Massachusetts).
H. Cell culture
The MCF-7 breast cancer cell line was developed by Dr. Herbert Soule. He obtained the cells from a breast cancer patient in the Detroit area and developed it at the Michigan Cancer Foundation, Detroit. This model became very useful to the scientific community. Reference Soule, Vazquez, Long, Albert and Brennan8,Reference Lippman and Bolan16
The MCF-7 (HTB-22) breast cancer cells were obtained from American Type Culture Collection (ATCC; Manassas, Virginia). They were cultured in Dubelcco’s Modified Eagle Media (DMEM; Sigma Aldrich, St. Louis, Missouri) supplemented with 10% SFB, 1% antibiotic/antimicotic, 1% L-glutamine, 1.5 g/L sodium bicarbonate and 0.01 mg/mL of human recombinant insulin. Cells were propagated in growth medium and maintained at 37 °C and 5% CO2. Reference Sanchez-Sanchez, Tapia-Moreno, Juarez-Moreno, Patterson, Cadena-Nava, Douglas and Vazquez-Duhalt14
I. Cytotoxicity assay
Cellular cytotoxicity is defined as an alteration of cellular functions which leads to damage that can be detected. Different authors have developed in vitro test cells to predict the toxic effects of drugs and chemical compounds, using experimental and primary cultures as primary isolated organs as established cell lines. One of the ways to measure cytotoxic effects and cell viability is with the evaluation of the cell membrane integrity. The MTT assay (methy-134 thiazolyltetrazolium) is a method to evaluate the potential of the cell with a colorimetric reaction. If the cell is alive, it processes the MTT reagent into formazan and turns violet in color; otherwise, the dead cell looked yellow. We tested the bare UCNPs and functionalized UCNP-NH2-FA with the TOX1 in vitro toxicology assay kit (Sigma-Aldrich, St. Louis, Missouri). We used a 96-well plate containing 10,000 cells per well. The UCNPs were previously ultrasonicated and diluted at 0.001 µg/mL to 1 µg/mL in RPMI-1640 media. MCF-7 cells were incubated for 24 h at 37 °C and 5% CO2. The positive control was the incubation of cells in the complete RPMI-1640 media without UCNPs, simulating cell behavior under ideal conditions. We used DMSO (Dimethyl sulfoxide to induce cell death for negative control. After incubation time, cells were washed with phosphate buffer solution pH 7.4 (PBS 1×) (137 mM NaCl, 2.7 mM KCl, 10 mM Na2HPO4, 1.8 mM KH2PO4 pH 7.4) and MTT reagent was added to the plate. The absorbance measurements were done with an ELISA plate reader (Thermo Scientific, Waltham, Massachusetts) at 570 and 690 nm. We did the comparison of cell viability between positive (live cells) and negative (dead cells) control groups and the damage induced by different concentrations of UCNPs on cells. We measured the background at 690 nm and then subtracted the absorbance readings at 570 nm. All data obtained from incubated UCNPs were normalized to data from three positive control wells with no UCNPs in three independent experiments. Reference Chávez, Juárez-Moreno and Hirata6,Reference Hemmer, Yamano, Kishimoto, Venkatachalam, Hyodoand and Soga9
J. Confocal microscopy cell imaging
The cell nucleus was stained with the fluorescent stain DAPI (4′,6-diamidino-2-phenylindole) (blue color); this dye binds strongly to A-T (adenine-thymine) rich regions in DNA and is extensively used in fluorescence microscopy. We incubated 300,000 MCF-7 cells in RPMI-1640 media overnight at 37 °C and 5% CO2 in Petri dishes coated with poly-d-lysine (Mat-Tek P35GC1.5-10C) 1 µg/mL of UCNP-NH2-FA for 24 h at 37 °C and 5% CO2. The cells were rinsed with PBS 1× and fixed with 4% formaldehyde-PBS solution at 4 °C for 15 min. They were then permeabilized with 0.5% triton X/PBS 1× for 15 min at 4 °C. We used the inverted laser-scanning microscope Olympus FluoView FV1000 (Olympus, London, United Kingdom) to observe the incubated cells with the UCNPs. The nuclear staining with DAPI was visualized with an argon ion laser (ex at λ = 405 nm) with DAPI filters for emission at 455 nm.
The UCNPs fluorescence was detected using the NIR laser (980 nm) and RFP (red fluorescent protein) filter channel (ex at λ = 487 nm and emission at λ = 660 nm). We used a Plan Achromatic 60×/1.48 N.A. oil immersion objective. The MetaMorph software (Molecular Devices, Sunnyvale, California) for Olympus was used to capture the images of Confocal ant they were captured using the FV-10 ASW software and were analyzed with the FV-10ASW viewer version 4.1 from Olympus (Tokyo, Japan). Reference Martínez-Carpio13
K. Statistical analysis
With exception of confocal imaging acquisition, all other experiments were done in a 3-fold independent manner with internal triplicates. The results were expressed as mean ± standard deviation of three independent experiments. Data were evaluated by analysis of variance (ANOVA), followed by Tukey’s Multiple Comparison Test, using GraphPad Prism version 6.0c software (GraphPad Software, Inc., La Jolla, California). The results were considered statistically significant when P < 0.05 otherwise ns: no-statically significance was indicated.
III. RESULTS
A. TEM images of UCNPs
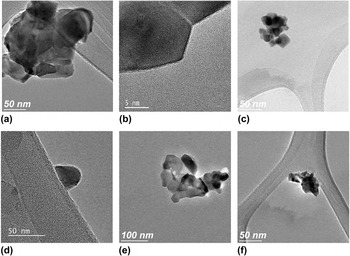
The compositions obtained for the UCNPs synthesized by the sol–gel method were (Y0.89Yb0.1Er0.01)2O3 and (Gd0.89Yb0.1Er0.01)2O3, respectively. TEM images of bare and functionalized UCNPs of Y2O3:Er3+/Yb3+ (1%, 10% mol) and Gd2O3:Er3+/Yb3+ (1%, 10% mol) are shown in Fig. 3. They presented a spheroidal form with an average size of 70 nm (±10 nm) for the UCNPs Y2O3:Er3+/Yb3+ and 50 nm for Gd2O3:Er3+/Yb3+. The agglomerates were observed in all samples as shown in Figs. 3(a) and 3(c) for the bare nanoparticles. The silica core shell was approximately 5 nm thick, as observed in Figs. 3(b) and 3(d) for Y2O3 and Gd2O3, respectively. To avoid the agglomeration we did ultrasonication and we used a surfactant for the coating of the UCNPs.
TEM images of UCNPs Y2O3:Er3+/Yb3+ (1%, 10% mol) of (a) bare and (b) functionalized UCNP-NH2-FA. Gd2O3:Er3+/Yb3+ (1%, 10% mol) of (c) bare and (d) functionalized UCNP-NH2-FA. Also the comparison with the UCNPs done by combustion synthesis is: (e) bare Y2O3:Er3+/Yb3+ (1%, 10% mol) and (f) bare Gd2O3:Er3+/Yb3+ (1%, 10% mol).

The same composition was obtained for the UCNPs prepared by combustion synthesis, but the nanoparticles did not meet our criteria due to the several concentrations of agglomerates and the varieties of different shapes presented, not only spheroidal, as depicted in Figs. 3(e) and 3(f).
B. Upconversion luminescence
Several authors prepared UCNPs; for example, Vetrone Reference Vetrone, Boyer and Capobianco18 prepared nanocrystalline Y2O3:Er3+ by combustion synthesis and a hydrolysis procedure and he studied the effect of Yb3+ codoping on the upconversion emission in Y2O3 nanocrystals. Also, Hirai Reference Hirai and Orikoshi19 synthesized rare earth ions (Er3+, Yb3+) doping Gd2O3 nanocrystals and investigated the upconversion luminescence process. The Er3+ ion has favorable metastable energy levels with longer excited states; Yb3+ ions have a large absorption cross section of around 980 nm and can efficiently transfer the excitation energy to Er3+ ions.
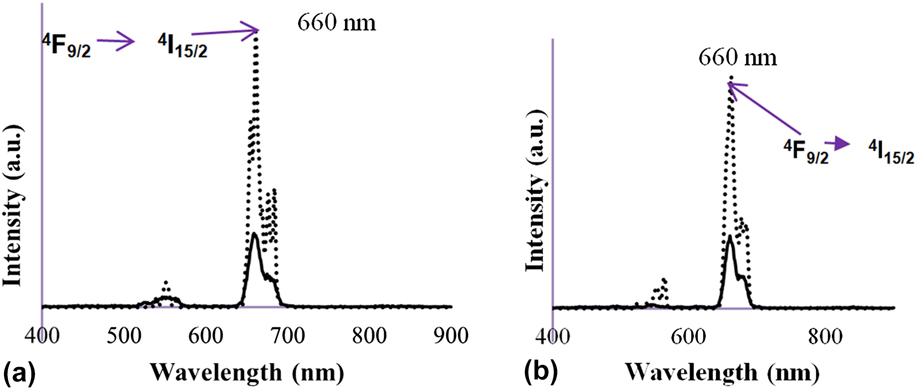
The upconversion luminescence spectra of bare and functionalized UCNP-NH2-FA with 980 nm laser excitation is shown in Fig. 4. The red emission of the nanoparticles Y2O3:Er3+, Yb3+ (1%, 10% mol) was at λ = 661 nm, Fig. 4(a) and the Gd2O3:Er3+, Yb3+ UCNPs, Fig. 4(b) was also at the same wave length. The electronic transition of the Er3+ ion in this emission with higher intensity was 4F9/2 → 4I15/2. In this case, the same transitions were present because we used the same lanthanide ions as dopant elements, and the difference in the size of the UCNPs was due to the size lattices of the hosts Y2O3 and Gd2O3.
The emission spectra (ex λ = 980) bare and functionalized UCNPs of (a) Y2O3:Er3+/Yb3+ (1%, 10% mol) and (b) Gd2O3:Er3+/Yb3+ (1%, 10% mol).

The combustion synthesis samples had a strong luminescence spectrum, the same as that of the sol–gel synthesis samples.
C. EDS spectra of coated UCNPs
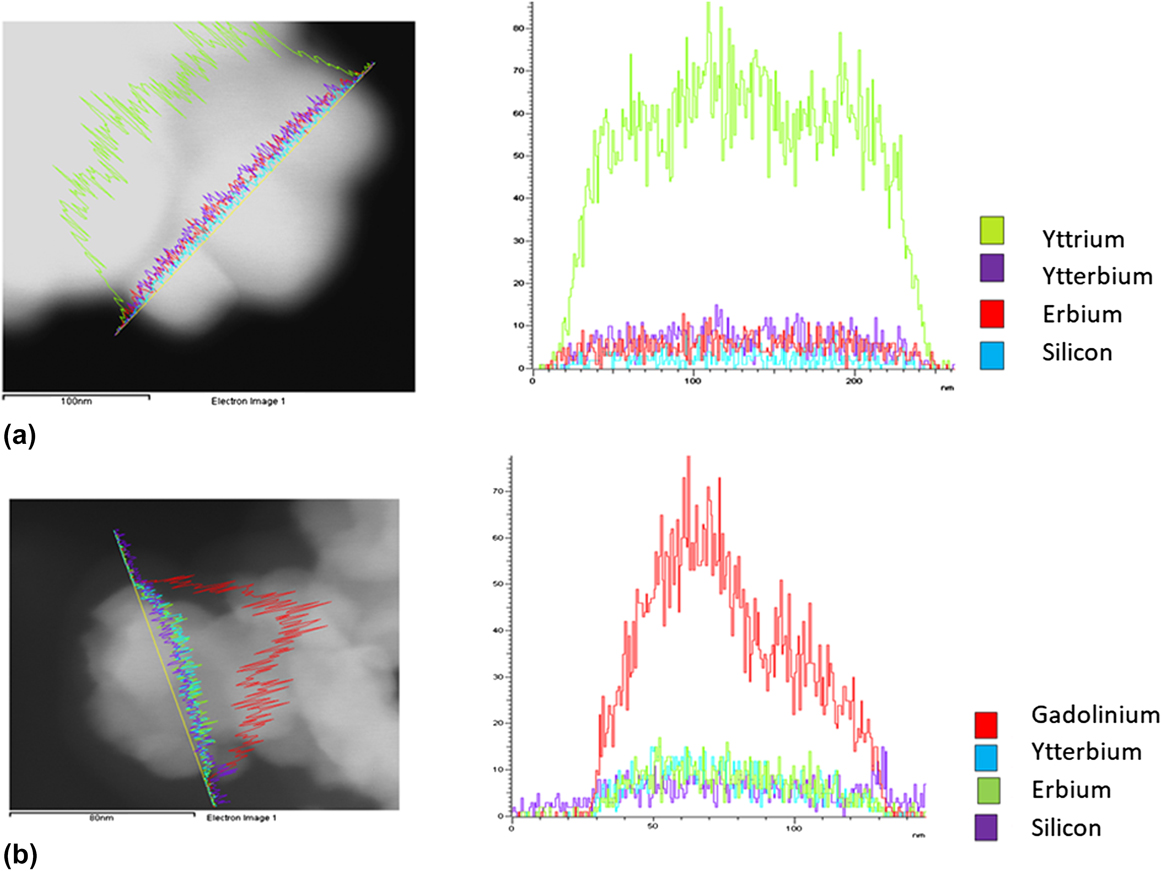
The analytical technique EDS (Energy-dispersive X-ray spectroscopy) is used to do elemental analysis or chemical characterization of a sample. The EDS technique detects X-rays emitted from the sample during bombardment by an electron beam to characterize the elemental composition of the analyzed volume. Materials as small as 1 µm or less can be analyzed. When the sample is bombarded by the electron beam, electrons are ejected from the atoms comprising the sample’s surface. The resulting electron vacancies are filled by electrons from a higher state, and an X-ray is emitted to balance the energy difference between the two electron’s states. The X-ray energy which is a characteristic of the element from which it was emitted was used to verify the elements contained on the UCNPs and also if the silicon was present on the surface. The spectrum is shown in Fig. 5. The components for the UCNPs with the host Y2O3 are shown in Fig. 5(a) and for Gd2O3 are in Fig. 5(b).
The EDS spectra showing the elements present on the UCNPs (a) Y2O3:Er3+/Yb3+ (1%, 10% mol) and (b) Gd2O3:Er3+/Yb3+ (1%, 10% mol).

D. FTIR analysis
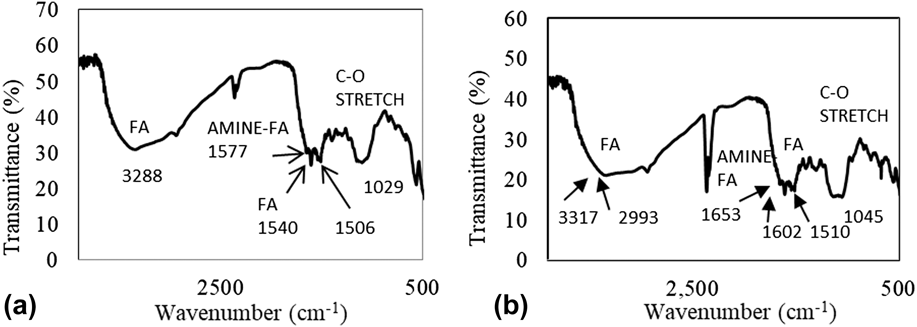
The Fourier transform infrared (FTIR) spectrometer is an instrument which obtains broadband NIR to FIR spectra. We collected the transmittance spectra. We verified the functionalization UCNP-NH2-FA with the FTIR spectroscopy. The presence of the amine groups and folic acid on the surface of the nanoparticles was detected. Figures 6(a) and 6(b) show the FTIR spectra of UCNP-NH2-FA with the hosts Y2O3 and Gd2O3, respectively.
FTIR spectra of (a) functionalized UCNPs Y2O3:Er3+/Yb3+ (1%, 10% mol) and (b) functionalized UCNPs Gd2O3:Er3+/Yb3+ (1%, 10% mol).

E. Cytotoxicity assay and cellular imaging
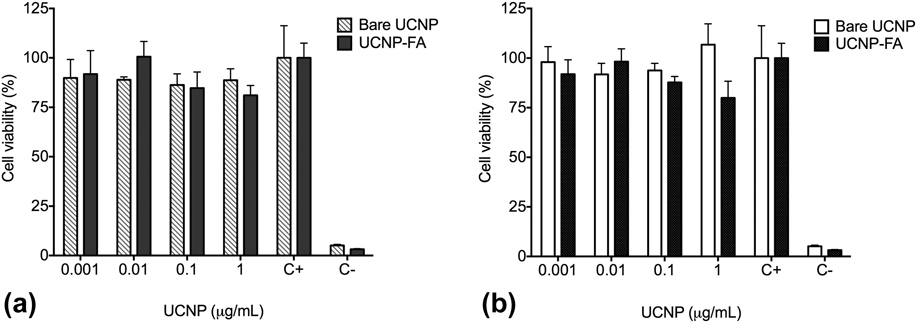
In Fig. 7 are shown the cytotoxic results of the MTT assay. The bare UCNPs for both hosts tend to agglomerate and precipitate after the addition to the well of the 96-well plate, even after being ultrasonicated. In both assays, the functionalized UCNPs showed no cytotoxicity in both cancer cell lines with more than 80% of cells viability.
Cell viability assay of MCF-7 cells with (a) bare UCNP Y2O3:Er3+/Yb3+ (1%, 10%) (lined bars) and functionalized UCNP-FR (black bars) and (b) bare UCNP Gd2O3:Er3+/Yb3+ (1%, 10%) (white bars) and functionalized UCNP-FA (black bars). Results represent the mean ± standard deviation of three independent experiments. Statistical analysis from negative control group (ANOVA, Tukey’s Multiple Comparison Test represents ns: no-statically significance was found).

F. Cancer cell imaging with UCNPs
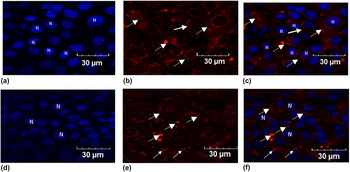
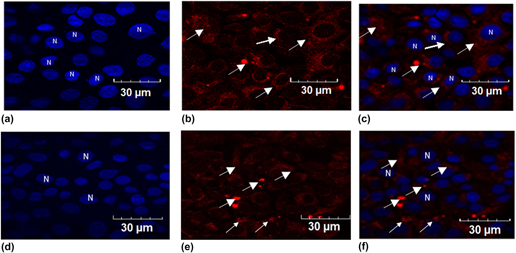
Numerous studies have reported the application of UCNPs for in vitro cellular and imaging. In vitro cellular imaging involves targeting of UCNPs to some subcellular components, such as folic acid receptors (FR). Reference Lu, Sega, Leamon and Low7 In this study, the UCNPs were functionalized with folic acid ligands that bind to the receptors overexpressed on the surface of the breast cancer cells MCF-7. The UCNP-NH2-FA was incubated into the cancer cells with the concentration of 1 µg/mL for 24 h. The cells were fixed and prepared to obtain imaging with the confocal microscope. The cell nucleus (N) stained with DAPI (ex λ = 405 nm and emission at λ = 461 nm, blue) is shown in Figs. 8(a) and 8(d). Figures 8(b) and 8(c) show the UCNPs inside cell cytoplasm (ex 980 nm + filter RFP, red fluorescent protein). Figures 8(c) and 8(f) shows the merged images of the previous ones. The UCNPs were clearly localized in the cytoplasmic region as expected.
Fluorescence red emission by Y2O3:Er3+/Yb3+ (1%, 10% mol) and Gd2O3:Er3+/Yb3+ (1%, 10% mol) incubated with MCF-7 cells (1 µg/mL) for 24 h. (a) and (d) Staining with DAPI show nuclei of MCF-7 cells labeled as “N”; (b) Y2O3 and (e) Gd2O3 UCNPs-FA excited with laser NIR 980 nm + RFP shows the functionalized UCNPs into the cell (white arrows); (c) and (f) Overlay DAPI, Laser 980 nm + RFP localize the UCNPs activity in the cytoplasm of the cells (white arrows).

IV. DISCUSSION
The nanoparticles prepared by sol–gel method resulted with a spheroidal shape, desired for biolabel applications. The nanoparticles prepared by combustion synthesis presented many agglomerates and different shapes, not only spheroidal in comparison with the ones made by sol–gel. This is one of the reasons than we choose the sol–gel as our method to produce all the UCNPs needed and continue doing the functionalization for our main purpose: the biolabels.
The UCNPs with the hosts Y2O3 and Gd2O3 co-doped with Er3+ and Yb3+ had diameters of 70 nm and 50 nm (±10 nm) respectively. The UCNPs have a stable luminescence, photostability, and long lifetimes of excited states and showed red emission (660 nm) with the characteristic electronic transition 4F9/2 to 4I15/2 as shown on the luminescence spectra, for both methods of synthesis. These spectra consist of two groups of upconversion emission peaks around 546–563 nm and 652–683 nm, according with the ESA process, the peaks corresponds to 2H11/2, 4S3/2 → 4I15/2 transitions (green) and 4F9/2 → 4I15/2 transition (red) of Er3+ ions, respectively. The green emission has less intensity than red emission due to the cross relaxation process, in which the electrons are promoted to the 4F9/2 level instead of the 2H11/2 and 4S3/2 levels. This process can be explained as follows: 4F7/2 (Er) + 4I13/2 (Er) → 4F9/2 (Er) + 4F9/2 (Er). The process will increase the electrons promoted in the 4F9/2 energy level. The luminescence of functionalized UCNP-NH2-FA had less intensity than bare UCNPs but the emission spectra were good for biolabels. The NIR excitation is an advantage because it is safer the penetration into the body and also deeper into the tissues with several inches. Reference Chatterjee, Rufaihah and Zhang15
The silica-coating done with TEOS was approximately 5 nm thick. To obtain a homogenous coating of all nanoparticles, it was necessary to use the surfactant IGEPAL. TEM and EDS analysis showed the size and the coating as depicted before. The breast cancer cells and other cells, such as ovary or lung cancer cells, overexpress the folic acid receptor (FR) on the cell membrane. If the biolabels have the FA ligands, they can easily bind with the FR of the cancer cells and they are thus able to identify them. Reference Lu, Sega, Leamon and Low7 First, the surface of the UCNPs was functionalized with aminosilanes and then the amine groups were linked with the FA groups. With the FTIR spectra we verified the presence of the amine-folic acid bonds (NH2-FA) on the surface of the UCNPs (1612–1512 cm−1) and the FA ligands (3331 cm−1) as shown in Fig. 6, all the vibrations in the band localization are marked.
The biolabels needed to be biocompatible and their cytotoxicity had to be evaluated. Cell viability was evaluated with bare and functionalized UCNPs with the MTT assay. The ability of the cells to reduce MTT is an indicator of mitochondrial integrity and its functional activity is interpreted as measure of cell viability after exposure to the UCNPs evaluated. Bare and functionalized UCNPs were analyzed and proved not to be toxic for breast cancer cells at any concentration. The statistical analysis showed no variation between the data, as depicted in Fig. 7.
In vitro cellular imaging was performed to localize the functionalized UCNPs within the cytoplasm of the breast cancer cells. We incubated the UCNPs with MCF-7 cells for 24 h. The UCNPs were clearly localized within the cell cytoplasm by confocal microscopy with no evident signs of cytotoxicity, which confirms that the UCNPs can be used as biolabels for MCF-7 breast cancer cells. Reference Horwitz, Costlow and McGuire17 This was possible because the high affinity via FA–FR, after the binding of the ligands, the UCNP is internalized into the cell via invagination process. Figure 8(c) shows the functionalized UCNPs Y2O3; Er3+, Yb3+ and Fig. 8(f) the UCNPs Gd2O3; Er3+, Yb3+ clearly into the cells. Reference Sudimack and Lee10
V. CONCLUSIONS
The UCNPs Y2O3; Er3+, Yb3+ (1%, 1% mol) functionalized with aminosilane-folic acid were taken up by MCF-7 breast cancer cells. The UCNPs-NH2-FA were biocompatible after the functionalization as expected according with the cytotoxicity results. The luminescence of the UCNPs-NH2-FA was in red at wave length of 660 nm with NIR laser excitation (λ = 980 nm). This study demonstrates that the functionalized UCNPs were clearly localized within the cell cytoplasm, which confirms that they can be used as biolabels for the cancer cells studied. Further studies with in vivo murine models with breast and cervix cancer need to be performed to confirm this important tool to diagnose cancer.
ACKNOWLEDGMENTS
The authors wish to acknowledge financial support from DGAPA-UNAM (Grant No. 111017) and CONACYT Project No. 269071. Technical support provided by E. Aparicio, F. Ruiz, M. Ponce, Dr. F. Castillón, Dr. Katrin Quester, and Leobardo Pérez is gratefully acknowledged. María Isabel Pérez Montfort corrected the English version of the manuscript. Karla Juarez-Moreno is a member of the International Network of Bionanotechnology with impact in Biomedicine, Food and Biosafety (CONACYT, Mexico).