1. Introduction
In light of the unprecedented monetary injections during the Great Recession and the COVID-19 pandemic, identifying the signals of economic abnormalities has become increasingly critical for diagnosing macroeconomic challenges and formulating appropriate policy responses. In parallel with methodological advancements in the field, precise data selection and rigorous data refinement have emerged as indispensable components of empirical economic analysis, ensuring both the credibility and robustness of research outcomes. Since the Federal Reserve began targeting the federal funds rate as a primary monetary policy tool in 1982, rather than controlling the money supply, a significant body of empirical research has investigated the efficacy of the policy rate. Bernanke and Blinder (Reference Bernanke and Blinder1992) explore the role of the federal funds rate within the monetary transmission mechanism and find that it is highly informative about future movements in real macroeconomic variables. Their research particularly highlights the impact of the federal funds rate on bank loans and deposits. Although this policy shift may suggest that money supply has lost its status as a crucial economic variable, it still plays an important role in understanding the economic environment. The VAR estimations of Christiano et al. (Reference Christiano, Eichenbaum and Evans1999), and Keating et al. (Reference Keating, Kelly, Smith and Valcarcel2019) suggest the money supply provides a more informative role as a monetary policy indicator than the policy rate. Thomas (Reference Thomas1996) demonstrates that broadly defined money (hereafter referred to as broad money) has played a significant role in shaping monetary policy in the United Kingdom over the past 25 years. Specifically, broad money has been instrumental in providing information about future fluctuations in nominal demand and inflation, among other economic indicators.Footnote 1
Meanwhile, the Federal Reserve has ceased reporting the broadly defined monetary aggregate, M3 money stock. Instead, the Federal Reserve now borrows M3 data sourced from the OECD, with the latest available data in 2006. Furthermore, the broadest monetary aggregate, M4, is no longer tracked in the FRED database. Consequently, researchers currently lack access to reliable broad monetary data sets. Meanwhile, IMF databankFootnote
2
provides monetary aggregates information at an annual frequency; however, in terms of accessibility and availability, it is relatively limited compared to FRED environment. In the absence of official broad money measurements in the U.S., this paper adopts the alternative money measures for the analysis: the Divisia monetary aggregates (Barnett (Reference Barnett1978, Reference Barnett1980)) and credit-card-augmented Divisia monetary aggregates (Barnett et al. (Reference Barnett, Chauvet, Leiva-Leon and Su2023)) (hereafter, referred to as Divisia and credit-augmented Divisia, respectively). These alternatives are proposed as potential substitutes and are analyzed for their efficacy in capturing monetary dynamics. Figure 1 illustrates that broad Divisia (right panel, M3, M4
 $-$
, and M4) more effectively captures the prolonged period of low inflation following the Great Recession, a pattern that is far less evident in narrow Divisia (M1, MZM, and M2). Even this simple observation suggests that broad Divisia may serve as a more reliable indicator for identifying and interpreting significant macroeconomic developments.
Log level of U.S. Divisia monetary aggregates.

Again, currently the Federal Reserve continues to report the M1 and M2, which are categorized as narrow simple sum monetary aggregates (hereafter, referred to as simple sum), while the OECD reports the simple sum measure of broad money, M3. The simple sum measures assign equal weight to all monetary components because it assumes that all the monetary components are perfectly substitutable. Meanwhile, the Center for Financial Stability (CFS) publishes the state-of-the-art Divisia and credit-augmented Divisia, characterizing their growth rates as a share-weighted average on the growth rates of monetary components. These aggregates, derived from economic aggregation theory, assign user cost prices to the marginal utilities of component assets.
In line with the innovative research that supports the theoretical and empirical perfection of Divisia monetary measures, this paper aims to investigate the significance of broad money and assess the performance of interest-bearing monetary aggregates by revisiting the benchmark research: Belongia and Ireland (Reference Belongia and Ireland2015), and Dery and Serletis (Reference Dery and Serletis2021). Belongia and Ireland (Reference Belongia and Ireland2015) emphasize the superiority of Divisia measures of money in forecasting key macroeconomic variables. Belongia and Ireland’s (Reference Belongia and Ireland2015) findings, revisiting Bernanke and Blinder (Reference Bernanke and Blinder1992), suggest that the Divisia serve as important intermediate targets or indicator variables, without significant deterioration in their informational content. Dery and Serletis (Reference Dery and Serletis2021) adopt Belongia and Ireland’s (Reference Belongia and Ireland2015) methodology to support the superiority of the Broad Divisia by utilizing monthly frequency data. While Bernanke and Blinder (Reference Bernanke and Blinder1992) focus on the simple sum only, Belongia and Ireland (Reference Belongia and Ireland2015) focus on the comparison between the simple sum and Divisia, and Dery and Serletis (Reference Dery and Serletis2021) focus on all ranges of Divisia, this study extends and reexamines the effectiveness of Divisia and credit-augmented Divisia across all ranges, from the narrowest to the broadest, through a series of tests.
The significance of credit has long been noted, with Bernanke and Blinder (Reference Bernanke and Blinder1988) highlighting the limitations of the dichotomy between “money” and “credit”. Their critique is supported by Liu et al. (Reference Liu, Dery and Serletis2020), who argue that existing New-Keynesian models neglect the liquidity services provided by credit card transactions. Barnett and Su (Reference Barnett and Su2016) extend the Divisia initially developed by Barnett (Reference Barnett1980) to include credit card transaction services, generalizing the theory to encompass these additional services. Despite credit card transactions not being included in central bank measures of the money supply due to accounting conventions, economic aggregation theory allows us to aggregate over service flows, such as monetary assets and credit card transaction volumes, regardless of whether the source of the services is assets or liabilities.
Despite the fact that credit card transactions account for a substantial share of modern monetary service transactions, the existing literature on monetary aggregation is subject to empirical and theoretical limitations arising from the exclusion of credit. Traditional monetary aggregates remain largely asset-based and do not fully capture the monetary service flows explained by the credit sector. One step further, this omission imposes a real economic limitation when monetary aggregates are employed to analyze monetary transmission mechanisms, policy effectiveness, and broader macroeconomic dynamics. This study addresses this limitation by incorporating credit card transaction services into the measurement of monetary aggregates. By adopting a credit-augmented Divisia, the analysis extends the concept of monetary services beyond traditional definitions to a broader framework centered on monetary transaction service provision. Such an extension is theoretically permissible within economic aggregation theory and index number theory, and empirically relevant given the growing importance of credit in payment activity.
Building on the methodologies established in the existing Divisia literature, this paper does not seek to replace prior innovative studies but rather to complement them by introducing a new monetary aggregate and examining how the inclusion of credit alters empirical results and economic implications. The ultimate objective is to assess whether credit-augmented Divisia provides additional explanatory power and yields new insights into monetary policy transmission and macroeconomic behavior, thereby offering a more comprehensive framework for monetary analysis. Adopting and extending Belongia and Ireland’s (Reference Belongia and Ireland2015) innovative benchmark research, we first conduct Granger-causality tests to explore the causal relationships between the set of real economic variables and the set of monetary indicators (including federal funds rate, simple sum, Divisia, and credit-augmented Divisia). Next, we employ both basic recursive and non-recursive VAR models to examine the inter-dependency among various economic variables, including real economic variables and monetary indicators. The introduction of non-recursive VAR models allows us to relax the strict conventional assumption that less-exogenous variables are influenced by more-exogenous variables. To be specific, the non-recursive VAR equations, which describe the responses of shocks caused by the endogenous variables, can be reformulated into the desired form by freely adjusting the components in the lower triangular matrix, which is originally acquired by Cholesky decomposition. This flexibility enables the introduction of the Taylor rule into the monetary policy shock equation, thereby refining our analysis of impulse responses. This study demonstrates that as the definition of money broadens, monetary indicators exhibit a stronger causal relationship with real economic variables and provide a more accurate representation of recent unusual economic conditions, accompanying minimized puzzle problems. In short, broad money emerges as a more reliable measure of economic activity than narrow money.
Literature review. Barnett (Reference Barnett1978, Reference Barnett1980) proposed the use of the Divisia index for monetary aggregation and derived the user cost of money by applying economic aggregation theory and index number theory. Since its introduction, both theoretical and empirical evaluations have been actively pursued within the framework of the Barnett Critique (Chrystal and MacDonald, Reference Chrystal and MacDonald1994). In both dimensions, the Divisia has been shown to outperform the simple sum reported by the Federal Reserve. Barnett et al. (Reference Barnett, Offenbacher and Spindt1984) demonstrate that the Divisia belongs to Diewert’s (Reference Diewert1976) class of superlative quantity indices and is strictly preferable to the simple sum, since monetary components are not perfectly substitutable. Belongia and Ireland (Reference Belongia and Ireland2014) show that the Divisia accurately tracks the true liquidity services flow under the New Keynesian framework, whereas the simple sum does not. Schunk (Reference Schunk2001) finds that incorporating the Divisia into VAR forecasting of U.S. real GDP yields the most accurate results. Similarly, Serletis (Reference Serletis2009) shows that autoregressive causality models estimated with the Divisia provide robust forecasts of macroeconomic activity. Serletis and Gogas (Reference Serletis and Gogas2014), inspired by King et al. (Reference King, Plosser, Stock and Watson1991), conduct a cointegration test comparing the Divisia and simple sum, finding that the use of simple sum measures induces incoherence, as emphasized in the Barnett Critique. To resolve this incoherence, Barnett (Reference Barnett1983) advocates the internally consistent nesting of aggregation-theoretic monetary aggregator functions within integrable money demand systems. More recently, Raghavan (Reference Raghavan2024) introduces the Divisia into SVARMA estimations and shows that broad Divisia measures outperform the simple sum in capturing the dynamic effects of monetary shocks.
Since the introduction of the credit-augmented Divisia, a growing body of research has examined its theoretical and empirical properties. Liu et al. (Reference Liu, Dery and Serletis2020) investigate its cyclical behavior using Hamilton’s filter and Granger-causality test, finding that both the credit-augmented Divisia and credit-augmented Divisia inside money outperform the Divisia in predicting real economic activity during and after the financial crisis. They also show that broad Divisia measures provide a superior representation of monetary service flows. Barnett and Park (Reference Barnett and Park2022) demonstrate that the credit-augmented Divisia serves as a valuable indicator for forecasting inflation and output growth, employing out-of-sample forecasting and Bayesian VAR methods. Barnett and Park (Reference Barnett and Park2024a) identify a strong co-movement between the cumulative effects of credit supply shocks, as measured by lending rates, and the historical behavior of credit-augmented Divisia through sign-restricted VAR analysis. Barnett and Park (Reference Barnett and Park2023) estimate welfare costs under a New Keynesian framework, showing that the costs of inflation are greater when credit card services are included than when they are excluded. In a related study, Barnett and Park (Reference Barnett and Park2024b) extend Belongia and Ireland (Reference Belongia and Ireland2014), demonstrating that the credit-augmented Divisia, unlike the simple sum, precisely tracks the true flow of monetary services in a New Keynesian setting. Andreadis et al. (Reference Andreadis, Fragkou, Karakasidis and Serletis2024) employ a phase space model and argue that broad Divisia aggregates are particularly useful for monetary policy and business cycle analysis, as they exhibit less volatility than narrow Divisia measures. Finally, Dery (Reference Dery2024) evaluates the information content and predictive capability of both the original and credit-augmented Divisia across sector-specific economic activities, concluding that Divisia measures of all ranges possess unique predictive power and practical empirical relevance.
Layout. This paper is organized as follows: Section 2 introduces Divisia monetary aggregates and credit-augmented Divisia monetary aggregates. Section 3 explores the concept of narrow money and broad money, and Section 4 presents the causal relationship between a set of real variables and various ranges of monetary aggregates. Section 5 examines the recursive and non-recursive VAR estimation to compare the economic implications of the narrow- and broad-money, including simple sum, Divisia, and credit-augmented Divisia. Section 6 provides a conclusion.
2. Divisia monetary aggregates
2.1 Divisia monetary aggregates
The Divisia measure demand-side monetary services using the economic aggregation theory and index number theory as developed by Barnett (Reference Barnett1980). Barnett (Reference Barnett1980) advocates for the use of either the Divisia or Fisher ideal index for monetary quantity aggregation with user cost pricing of components. The difference between the two indices is negligible, being less than the round-off error in the components, but the Divisia index is generally more straightforward to explain and interpret than the Fisher ideal index. The resulting quantity index numbers, by either formula, are elements of Diewert’s (Reference Diewert1976) class of superlative quantity index numbers. Barnett’s resulting monetary aggregates are strictly preferable to the simple sum, because the components of monetary assets are not perfect substitutes. Relative to aggregation and index number theory, a simple sum over imperfect substitutes is inadmissible.
Barnett (Reference Barnett1980) proves that the real user cost (equivalent rental price) of a monetary asset
 $i$
is
 \begin{equation} \pi _{it} =\frac {R_{t}-r_{it}}{1+R_{t}}, \end{equation}
where
 $r_{it}$
is the own rate of return on asset
 $i$
during period
 $t$
, and
 $R_{t}$
is the risk-free rate of return on pure capital, a completely illiquid asset (benchmark rate), during period
 $t$
.
The Divisia index in growth rate form in continuous time is
 \begin{equation} d\log M(\textbf {m}_{t}) = \sum _{i}{s_{it}d\log {m_{it}}}, \end{equation}
where
 $s_{it} = \pi _{it}m_{it}/\boldsymbol{\pi }'_{t}\textbf {m}_{t}$
is the expenditure share on monetary asset
 $i$
and
 $m_{it}$
is real balances of monetary asset
 $i$
during period
 $t$
.
2.2 Credit-card-augmented Divisia monetary aggregates
Credit-augmented Divisia is the measure of demand-side monetary services, including credit card transaction volumes, not credit card balances. Barnett and Su (Reference Barnett and Su2016) and Barnett et al. (Reference Barnett, Chauvet, Leiva-Leon and Su2023) introduce these new monetary aggregates. Conventional simple sum has never been augmented to include credit card balances, since accounting conventions do not permit adding liabilities to assets. Credit-augmented Divisia can be derived from the consumer decision with credit card transaction volumes along with monetary balances entered into the utility function, reflecting the fact that money and credit card transaction volumes provide services, such as liquidity and transactions services. Economic aggregation theory and index number theory measure service flow, independently of whether from assets or liabilities.
The real user cost of credit card services, derived in Barnett and Su (Reference Barnett and Su2016), is
 \begin{equation} \tilde {\pi }_{jt} = \frac {e_{jt}-R_{t}}{1+R_{t}}, \end{equation}
where
 $R_{t}$
is the risk-free rate of return on a completely illiquid asset (pure capital) during period
 $t$
, and
 $e_{jt}$
is the interest rate on credit card type
 $j$
. There are two categories of consumers using credit cards. Some consumers pay interest to the credit card issuing banks, and others do not pay interest. The “representative consumer” pays the interest rate
 $e_{jt}$
, averaged over both categories of consumers, including those who maintain rotating balances, and thereby pay interest on contemporaneous credit card transactions, and those consumers who pay off such credit card transactions before the end of the period, and thereby do not pay explicit interest on credit card transactions. The CFS considers four credit card types,
 $j$
, including Visa, MasterCard, Discover, and American Express.
The aggregation-theoretic exact approach defines the credit-augmented structural aggregator function,
 $M$
, to be the utility function,
 $v$
,
 \begin{equation} M_{t} = M({\textbf {m}}_t,{\textbf {c}}_t) = v({\textbf {m}}_t,{\textbf {c}}_t), \end{equation}
nested as a weakly separable category utility function within the full utility function, which also contains consumer goods. The growth rate of the Divisia index tracks the growth rate of the exact aggregate
 $M(\textbf {m}_t,\textbf {c}_t)$
, where
 $\textbf {m}_t$
is the vector of monetary asset quantities held by the representative consumer during period
 $t$
, and
 $\textbf {c}_t$
is the vector of the consumer’s four credit card transaction volumes during period
 $t$
.
The credit card quantities to include in the augmented Divisia index formula are the monthly credit cards transaction volumes, not the credit card balances. Including credit card balances would produce a double-counting problem, since they include carried-forward rotating balances used for transactions in prior periods. In detail, it can be said that credit card debt (like all other bank-created debt extended to the private sector) results in the creation of money. Therefore, including outstanding credit card balances as a separate stock item would lead to double-counting, since the money generated through this debt is already reflected in the money aggregates. Specifically, any credit card debt that remains unpaid at the time of monetary reporting (e.g., at the end of a reporting month) is already incorporated into these aggregates. The growth rate of the credit-augmented Divisia index is
 \begin{equation} d\log M({\textbf {m}}_{t},{\textbf {c}}_{t}) = \sum _{i}{s_{it}d\log {m_{it}}} + \sum _{j}{\tilde {s}_{jt}d\log {c_{jt}}}, \end{equation}
where
 $s_{it} = \pi _{it}m_{it}/(\boldsymbol{\pi }'_{t}\textbf {m}_{t}+\tilde {\boldsymbol{\pi }}'_{t}\textbf {c}_{t})$
is the expenditure share of monetary asset
 $i$
in the total service of monetary assets and credit cards, while
 $\tilde {s}_{jt} = \tilde {\pi }_{jt}c_{jt}/(\boldsymbol{\pi }'_{t}\textbf {m}_{t}+\tilde {\boldsymbol{\pi }}'_{t}{\textbf {c}}_{t})$
is the expenditure share of the services of credit card type
 $j$
in the total services of monetary assets and credit cards.
3. Narrow money and broad money
Bernanke and Blinder (Reference Bernanke and Blinder1992) analyze the effectiveness of simple sum M1 and M2 in tracking economic implications, while Belongia and Ireland (Reference Belongia and Ireland2015) evaluate the performance of simple sum M1, M2, Divisia M1, M2, and money zero maturity (MZM) in their models. Building on the benchmark literature that highlights the effectiveness of narrow money in capturing precise economic signals, this paper extends the analysis to track economic signals of broad money, particularly M4. The M3 monetary aggregate encompasses currency, deposits with agreed maturities of up to two years, deposits redeemable with notice of up to three months, repurchase agreements, money market fund shares/units, and debt securities with maturities up to two years. M4
 $-$
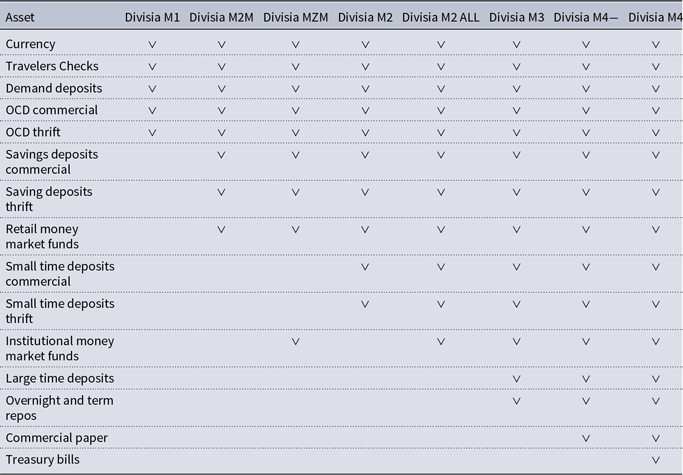
includes commercial paper in addition to the components of M3, while M4 further incorporates treasury bills. Table 1 in Appendix A outlines the monetary assets included in each aggregate used in this study.
In this research, we classify M1, M2M, MZM, M2, and M2ALL as narrow money, and M3, M4
 $-$
, and M4 as the broad money.
4. The information content of the various monetary aggregates and federal funds rates
Bernanke and Blinder (Reference Bernanke and Blinder1992), Belongia and Ireland (Reference Belongia and Ireland2015), and Dery and Serletis (Reference Dery and Serletis2021) investigate the causal relationship between the federal funds rate and real economic variables, as well as the relationship between various monetary aggregates and real variables. To examine the role of money and the federal funds rate in explaining past real economic conditions, we analyze the following equation:
 \begin{equation} Y_{t}=\alpha +\sum _{i=1}^{6}\lambda _{i}Y_{t-i}+\sum _{i=1}^{6}\beta _{i}X_{t-i}+\sum _{i=1}^{6}\gamma _{i}P_{t-i}+e_{t}, \end{equation}
where
 $Y_{t}$
represents one of several measures of real economic variables, while
 $X_{t}$
denotes a measure of monetary policy, such as various monetary aggregates or the federal funds rate.
 $P_{t}$
is the consumer price index (CPI), which adjusts each estimation for changes in the price level. The terms
 $\alpha$
,
 $\lambda _{i}$
,
 $\beta _{i}$
, and
 $\gamma _{i}$
(
 $i=1,2,\cdots ,6$
) are regression coefficients. We apply six lags of each variable (
 $i=1,2,\cdots ,6$
) and take the logarithm for all variables. The null hypothesis that neither the monetary aggregates nor the federal funds rate Granger-cause the real variables.
In exploring the role of broad money in the economy, we examine various monetary aggregates as measures of
 $X_{t}$
in equation (6). Extending on previous benchmark studies, we utilize a full range of traditional simple sum, Divisia, as well as credit-augmented Divisia for the Granger-causality test. Simple sum M1 and M2 data, reported by FRED, are measured in billions of dollars (monthly, not seasonally adjusted). M3 data is sourced from the OECD (monthly, not seasonally adjusted). Divisia and credit-augmented Divisia data, available at a monthly frequency, are provided by the CFS. The Divisia series have been publicly available since January 1967, and the credit-augmented Divisia series since July 2006. Divisia is level normalized to equal 100 in January 1967, and credit-augmented Divisia is level normalized to equal 100 in July 2006. To account for potential seasonal patterns, we applied the X-13ARIMA-SEATS seasonal adjustment procedure developed by the U.S. Census Bureau to all monetary series prior to the analysis. However, for the majority of the series, the algorithm identified no statistically or visually significant seasonal peaks in the spectral diagnostics (Table A1/B1), and consequently did not generate seasonally adjusted output. In such cases, we retained the original non-seasonally adjusted data. This approach results in seasonal adjustment being applied only where statistically justified.
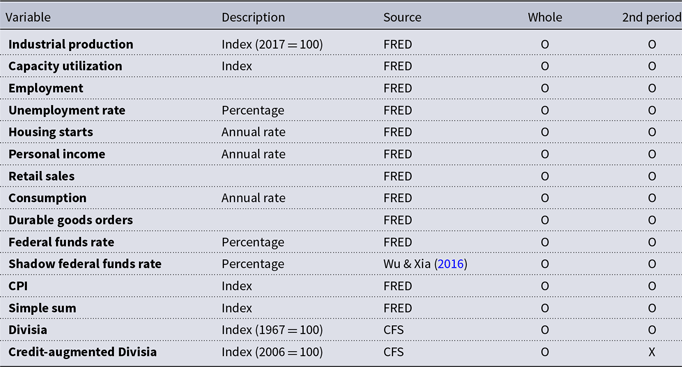
We investigate the Granger-causality test in two contexts: (1) among various real variables and monetary aggregates, and (2) among various real variables and the federal funds rates. The set of real variables includes industrial production, capacity utilization, employment, unemployment rate, housing starts, personal income, retail sales, consumption, and durable-goods orders. All real variables are provided at a monthly frequency by FRED. Industrial production is represented by a seasonally adjusted total index, normalized to a level of 100 in 2017. Capacity utilization is a total index and seasonally adjusted percent of capacity. Employment is measured in thousands of persons and is seasonally adjusted. The unemployment rate is also presented as a seasonally adjusted percentage. Housing starts are expressed as a seasonally adjusted annual rate in thousands of units. Personal income and consumption are reported in billions of dollars at seasonally adjusted annual rates, while retail sales and durable-goods orders are measured in millions of dollars and are seasonally adjusted. Table 23 in Appendix A summarizes the data information for all causality tests.
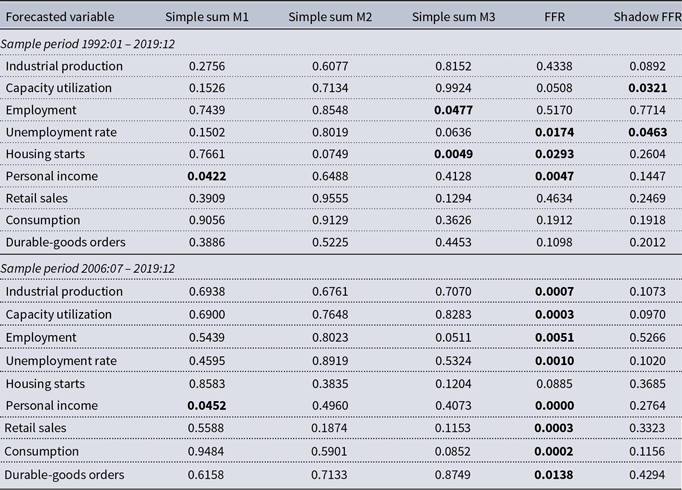
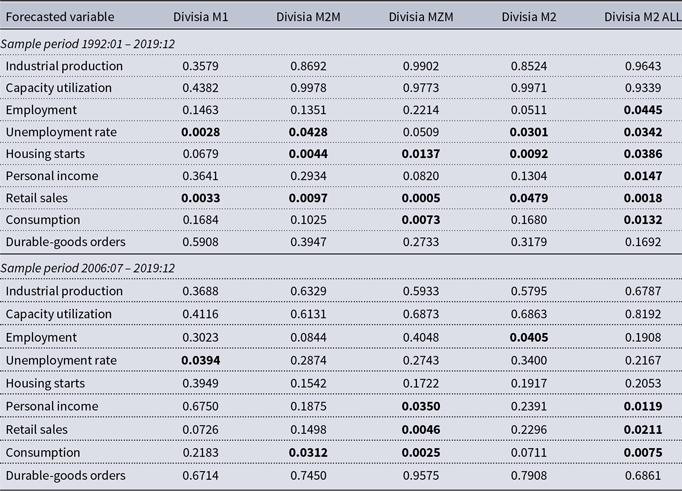
Tables 2 through 6 in Appendix A present the results of the Granger-causality tests. The values in these Tables indicate the marginal significance levels for the hypothesis that all lags of monetary aggregates (or the federal funds rates) can be excluded from the equation (6). A lower value indicates a stronger influence of the monetary measures on real variables. The sample period for the primary real economic data spans from January 1992 to December 2019. Additionally, we conduct the same test for the sub-sample period from July 2006 to December 2019, as credit-augmented Divisia data are available starting in July 2006. Therefore, through the analysis for this sub-sample period, we can directly compare the economic implications of policy rate, simple sum, Divisia, and credit-augmented Divisia. These sample periods in our study are relatively shorter than the periods adopted by the benchmark studies.
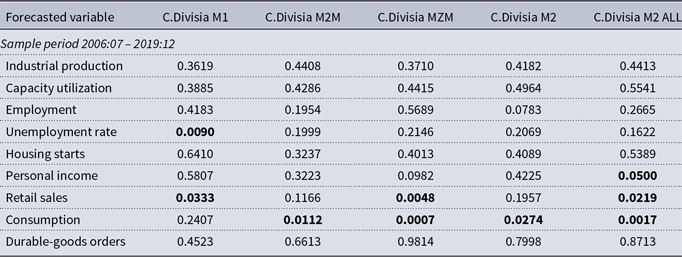
Table 2 presents the results of the Granger-causality tests conducted between a set of real variables and monetary indicators (simple sum, and two policy rates). Our findings indicate that the federal funds rate has a stronger relationship on real activities compared to other measures in
 $X$
, which aligns with the benchmark literature. In detail, the analysis shows that when the sample period is relatively short and includes the phase of recovery from an economic downturn, the policy rate becomes a particularly informative indicator, even better than any other monetary aggregates. In contrast to previous research, simple sum M1 influences personal income across both sample periods, while simple sum M2 shows no effect on any of the real variables. Meanwhile, since the federal funds rate and monetary aggregates do not enter a single unified equation in our framework, it might not be able to determine whether the federal funds rate absorbs or diminishes the explanatory power of monetary aggregates. We additionally discuss this further estimation by adding the federal funds rate as a control variable in equation (6) in Appendix C.
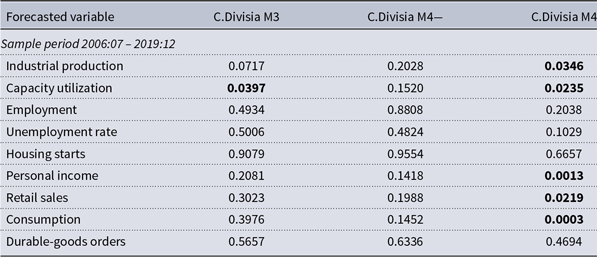
In Tables 3 through 6, we observe that the Divisia and credit-augmented Divisia exhibit a relatively stronger connection with real activities compared to the simple sum measures presented in Table 2. While simple sum M1 affects personal income, Divisia M1 and credit-augmented Divisia M1 are linked to the unemployment rate and retail sales. While simple sum M2 has no impact on any real variable (Table 2), Divisia M2 influences the unemployment rate, housing starts, and retail sales (as shown in the upper panel of Table 3 for the entire period), and it also affects employment in the second half of the period (lower panel of Table 3). Additionally, credit-augmented Divisia M2 is associated with consumption (Table 5).
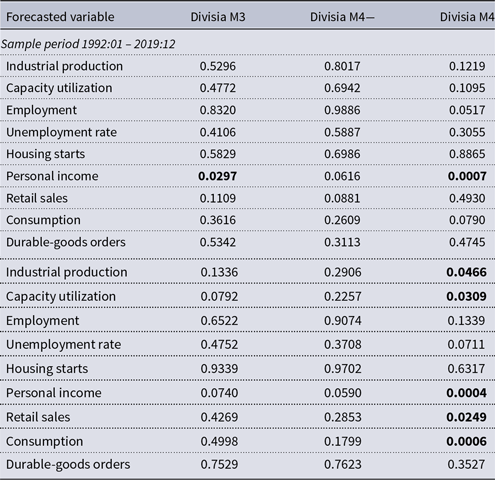
The Divisia M2 ALL and M4 exhibit significant associations with various economic variables. Notably, the lower panels of Tables 4 and 6 reveal that both Divisia M4 and credit-augmented Divisia M4 are linked to five out of nine real variables. As indicated in the result of Figure 1, the CFS emphasizes that Divisia M4 is the broadest and most important measure of money. Consistent with the CFS’s argument, our findings also demonstrate that both Divisia M4 and credit-augmented Divisia M4 show the strongest associations with numerous real activities. Since the simple sum M4 is not published, we are unable to compare its effects on real activities.
In contrast to the benchmark studies (Belongia and Ireland (Reference Belongia and Ireland2015), Dery and Serletis (Reference Dery and Serletis2021)), our short term analysis identify an abnormal behavior in two monetary aggregates: Divisia and credit-augmented Divisia M3 and M4
 $-$
. While benchmark studies generally conclude that broader definitions of monetary aggregates strengthen their connection with real economic variables, our findings track a deviation from this conventional pattern. Both Divisia M3 and M4
 $-$
exhibit weaker causal relationships with real economic variables compared to Divisia M4, even weaker than Divisia M2ALL, largely due to the composition and functional use of the assets included in each aggregate. M3 expands beyond M2 to include large time deposits, overnight and term repos; components that are mainly held by financial institutions for portfolio management rather than by households or firms for spending purposes. As a result, changes in M3 often capture financial intermediaries’ activity rather than liquidity conditions related to consumption or investment, limiting its informational content for the real economy. Similarly, while M4
 $-$
extends M3 by including commercial paper, the additional component primarily reflects short-term funding instruments used by corporations, which do not necessarily translate into broader household demand or overall liquidity in the non-bank private sector. These factors weaken the causal relationships between real economic variables and monetary aggregates. In contrast, M4 encompasses a wider set of deposits and short-term liabilities (including Treasury Bills) held by households and non-financial firms, making it a more accurate measure of effective liquidity in the real economy and thus establishing a stronger and more stable causal link with output, spending, and other macroeconomic indicators.
5. Vector autoregressive (VAR) estimation
To analyze the economic implications of monetary variables across different ranges, we construct a Vector Autoregressive (VAR) model. The theoretical reduced-form VAR model, as proposed by Sims (Reference Sims1980), serves as the foundation for this analysis:
 \begin{equation} \textbf {X}_{t} = \textbf {A}_{0} + \textbf {A}_{1}\textbf {X}_{t-1} + \cdots + \textbf {A}_{p}\textbf {X}_{t-p} + \textbf {u}_{t}, \end{equation}
where
 $p$
is the number of lags, and assume
 $\textbf {u}_{t}$
to be serially uncorrelated and to have a covariance matrix for residuals,
 $\mathbb{E} \textbf {u}_{t} \textbf {u}_{t}' = \textbf {V}$
. The reduced form VAR disturbances are related to the underlying economic shock (Structural VAR),
 $\boldsymbol{\varepsilon }_{t}$
, expressed by
 \begin{equation} {\textbf {u}}_{t} = {\textbf {B}}_{0} \boldsymbol{\varepsilon }_{t}, \end{equation}
where
 $\boldsymbol{\varepsilon }_{t}$
is serially uncorrelated with a diagonal covariance matrix
 $\boldsymbol{\Sigma }_{\varepsilon }$
of full rank (white noise), and
 $\textbf {B}_{0}$
is lower triangular matrix. Put equation (8) into the VAR equation (7) and multiply
 $\textbf {B}_{0}^{-1}$
to both hand side then we can get
 \begin{equation} \textbf {B}_{0}^{-1}\textbf {X}_{t} = \textbf {B}_{0}^{-1}\textbf {A}_{0} + \textbf {B}_{0}^{-1}\textbf {A}_{1}\textbf {X}_{t-1} + \cdots + \textbf {B}_{0}^{-1}\textbf {A}_{p}\textbf {X}_{t-p} + \boldsymbol{\varepsilon }_{t}. \end{equation}
We adopt six endogenous variables from Leeper and Roush (Reference Leeper and Roush2003) for our analysis. The data set, spanning from July 2006 to December 2019, includes the Great Recession and focuses on the behavior of economic variables during this downturn. First, real GDP and the GDP deflator are used as measures of aggregate output (
 $\textbf {Y}_{t}$
) and price level (
 $\textbf {P}_{t}$
), respectively. These data are sourced from IHS Markit.Footnote
3
To represent the short-term nominal interest rate, we use the shadow federal funds rate (
 $\textbf {R}_{t}$
), as the traditional (effective) federal funds rate played a limited role in the post-Great Recession period. As a measure of the flow of monetary services, we choose credit-augmented Divisia (
 $\textbf {CM}_{t}$
) and its user cost (
 $\textbf {UCM}_{t}$
). By using both the quantity and price index, we are able to differentiate between shocks to money demand and money supply (Belongia and Ireland, Reference Belongia and Ireland2015). Finally, we include the commodity price index (
 $\textbf {CP}_{t}$
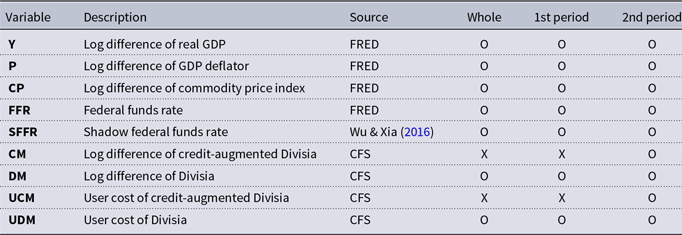
) to address the price puzzle, as suggested by Sims (Reference Sims1992). All data are provided at a monthly frequency. The price, output, commodity price, and credit-augmented Divisia variables are converted to stationary form, while the shadow federal funds rate and user cost remain in their original units. Consequently, all data are expressed in percentage terms. Based on the conventional lag-determination rule, the Akaike Information Criterion (AIC) suggests the use of 13 lags. Data information for VAR estimation is presented Table 24 in Appendix A.
In short, the vector of endogenous variables is given by;
 \begin{equation} \textbf {X}_{t} = [\textbf {P}_{t} \ \ \textbf {Y}_{t} \ \ \textbf {CP}_{t} \ \ \textbf {R}_{t} \ \ \textbf {CM}_{t} \ \ \textbf {UCM}_{t}]'. \end{equation}
We now construct a structural VAR model with six endogenous variables and uniquely determine the relationship
 $\textbf {V} = \textbf {B}_{0} \textbf {B}_{0}'$
using Cholesky decomposition. The ordering of variables becomes crucial when imposing zero restrictions with Cholesky decomposition. While there is no fixed rule for variable ordering, conventionally, the most exogenous variable is placed in the first row of the vector
 $\textbf {X}_{t}$
, and the least exogenous variable is positioned in the last row. According to the identification scheme of Cholesky decomposition, the fourth element of the vector
 $\boldsymbol{\varepsilon }_{t}$
, denoted as
 $\varepsilon _{t}^{mp}$
, can be expressed as follows:
 \begin{equation} b_{41} p_{t} + b_{42} y_{t} + b_{43} cp_{t} + b_{44} r_{t} = \varepsilon _{t}^{mp}, \end{equation}
which explains that the first three variables, price, output, and commodity price, behave sluggishly to a monetary policy shock. In contrast, the last variable, the monetary policy instrument, is adjusted immediately by the Federal Reserve in response to the monetary policy shock. In the same manner, the fifth and sixth elements of the vector
 $\boldsymbol{\varepsilon }_{t}$
, denoted as
 $\varepsilon _{t}^{md}$
and
 $\varepsilon _{t}^{ms}$
can be expressed accordingly, respectively, by
 \begin{equation} b_{51} p_{t} + b_{52} y_{t} + b_{53} cp_{t} + b_{54} r_{t} + b_{55} m_{t} = \varepsilon _{t}^{md}, \end{equation}
 \begin{equation} b_{61} p_{t} + b_{62} y_{t} + b_{63} cp_{t} + b_{64} r_{t} + b_{65} m_{t} + b_{66} u_{t} = \varepsilon _{t}^{ms}. \end{equation}
Equations (12) and (13) represent the money demand and monetary service equations, respectively. Equation (12) explains that the first four endogenous variables are determinants of money demand, which do not respond immediately to the money demand shock. The last endogenous variable is the only factor that responses instantly to the shock. In the same reasoning, Equation (13) demonstrates that the first five endogenous variables are determinants of monetary service which do not respond immediately to the monetary service shock. The last endogenous variable is the only factor that response instantly to the shock.
The use of Cholesky decomposition as an identification method is powerful and straightforward; however, it is a strict rule since the ordering of the variable is the sole determinant of the composition of the shock, leaving no room for exceptions. To relax the restriction and introduce variation, we employ a non-recursive VAR approach. Keating (Reference Keating1992) presents non-recursive VAR estimation for both long-run and contemporaneous models. By allowing variation in the contemporaneous model, he introduces a flexible form of
 $\textbf {B}_{0}^{-1}$
and demonstrates four meaningful economic representations: the AS curve, IS curve, money supply curve, and money demand curve. Inspired by this work, we utilize the algorithm for solving a non-linear equations system provided by MATLAB.Footnote
4
The fsolve function in MATLAB is employed to find solutions for these nonlinear equation systems.
Following the approaches of Leeper and Roush (Reference Leeper and Roush2003) and Belongia and Ireland (Reference Belongia and Ireland2015), the benchmark non-recursive model specifies the matrix
 $\textbf {B}_{0}^{-1}$
as
 \begin{equation} \small \textbf {B}_{0}^{-1} = \left(\begin{array}{c@{\quad}c@{\quad}c@{\quad}c@{\quad}c@{\quad}c} b_{11} & 0 & 0 & 0 & 0 & 0 \\ b_{21} & b_{22} & 0 & 0 & 0 & 0 \\ b_{31} & b_{32} & b_{33} & b_{34} & b_{35} & b_{36} \\ b_{41} & b_{42} & 0 & b_{44} & b_{45} & 0 \\ -b_{55} & b_{52} & 0 & 0 & b_{55} & b_{56} \\ -b_{65} & 0 & 0 & b_{64} & b_{65} & b_{66} \end{array}\right), \end{equation}
which is called as a model of the Taylor rule with money, where,
 \begin{equation} \textbf {B}_{0}^{-1} \textbf {u}_{t} = \boldsymbol{\varepsilon }_{t}. \end{equation}
Since restrictions are imposed on
 $\textbf {B}_{0}^{-1}$
, resulting in an over-identified matrix, we apply generalized method of moments (GMM) estimation. Following this process, the fourth, fifth, and sixth rows of matrix
 $\textbf {B}_{0}^{-1}$
can be restated as follows,
 \begin{align} b_{41} p_{t} + b_{42} y_{t} + b_{44} r_{t} + b_{45} m_{t} &= \varepsilon _{t}^{mp}, \end{align}
 \begin{align} b_{52} y_{t} + b_{55} (m_{t} - p_{t}) + b_{56} u_{t} &= \varepsilon _{t}^{md}, \end{align}
 \begin{align} b_{64} r_{t} + b_{65} (m_{t} - p_{t}) + b_{66} u_{t} &= \varepsilon _{t}^{ms}, \end{align}
respectively. Equation (16) presents an extended version of the Taylor rule that incorporates monetary variables. To determine the federal funds rate, the Federal Reserve considers changes in aggregate output and prices, as well as variations in the money supply. The last two equations enable us to focus entirely on the monetary variables. The use of Divisia-type monetary variables in money demand, as illustrated in Equation (17), provides a more accurate representation of the quantity and price of monetary services, leading to improved measurement (Belongia and Ireland (Reference Belongia and Ireland2006)). Equation (18) describes the behavior of the financial institutions that create the liquid assets, which provide households and firms with monetary services. This model demonstrates how an increase in the cost of banks resulting from a rise in the federal funds rate is directly passed on to consumers through higher user costs. Additionally, real money services are considered to account for potential short-term cost increases due to the expansion of the bank’s operational scales. Belongia and Ireland (Reference Belongia and Ireland2015) emphasize that this non-recursive modeling offers a more detailed and theoretically grounded description of banks supplying monetary assets and the non-bank public demanding those assets.
Meanwhile, we impose additional specification on the elements of
 $\textbf {B}_{0}^{-1}$
. By applying the restriction
 $b_{45} = 0$
in
 $\textbf {B}_{0}^{-1}$
, we can introduce a typical Taylor rule that excludes the money supply, referred to as the Taylor rule without money model. Alternatively, by imposing the restrictions
 $b_{41} = 0$
,
 $b_{42} = 0$
in
 $\textbf {B}_{0}^{-1}$
, we can introduce Leeper-Roush (Reference Leeper and Roush2003) specification, known as the Money-interest rate rule model. This model positions the money supply as a central determinant of the short-term interest rate. To infer the model’s implications, we examine the impulse responses along with the 2-standard deviation confidence interval calculated using the delta-method bootstrapping.Footnote
5
For the extensions, the Divisia and their corresponding user costs will replace the last two rows of
 $\textbf {X}_{t}$
matrix. Since the Divisia has a long historical context compared to the credit-augmented Divisia, we can extend the sample period from January 1992 to December 2019. Subsequently, we divide the sample period into two sub-sample periods: January 1992 to June 2006 and July 2006 to December 2019, and analyze the model for each sub-sample period. The findings from the first sub-sample will serve as a direct comparison to the benchmark work of Belongia and Ireland (Reference Belongia and Ireland2015), while the results from the second sub-sample will relate to the main discussion of this research. These data sets also indicate the optimal lag length of 13. Finally, we repeat the entire process by switching the policy rate to the effective federal funds rate.
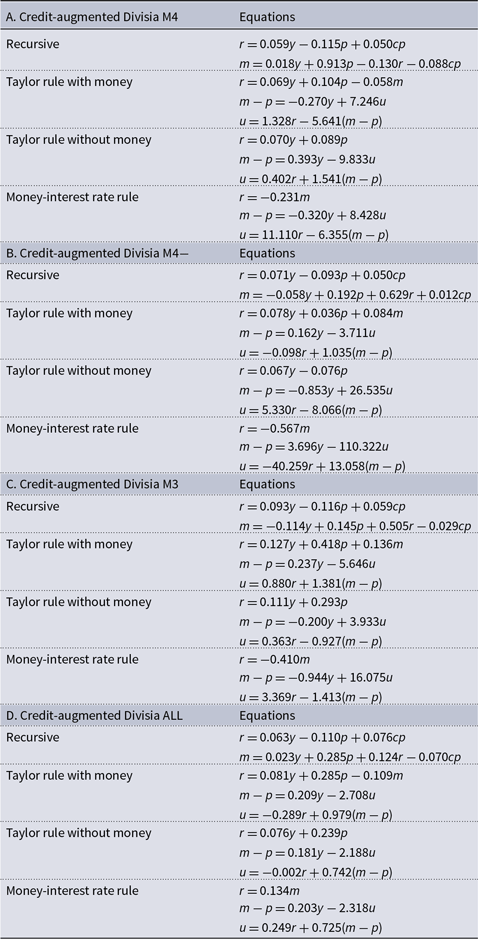
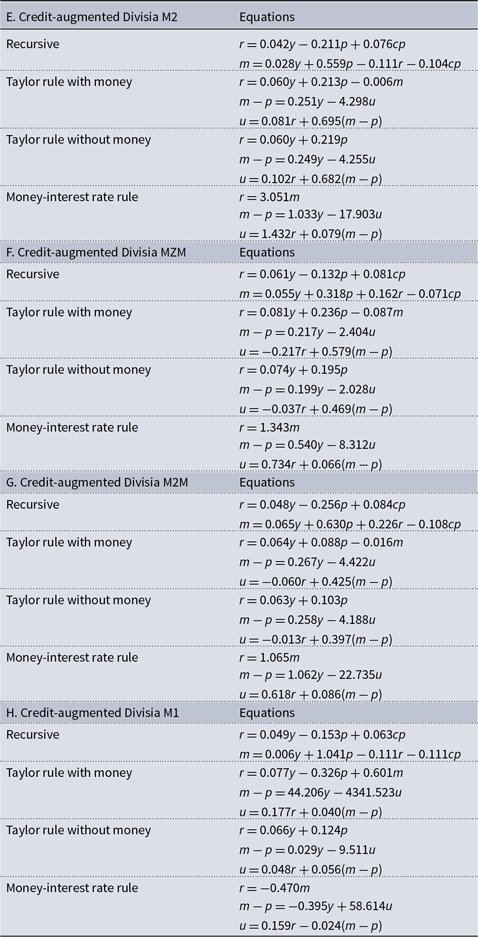
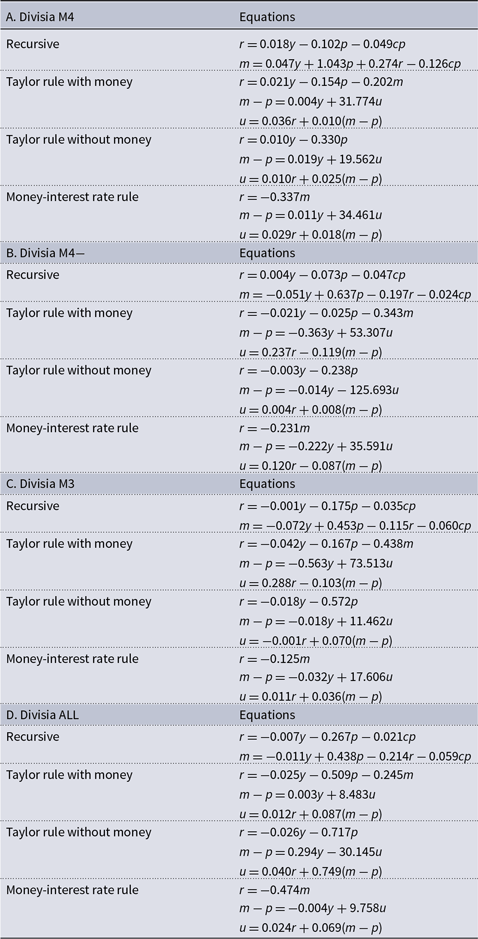
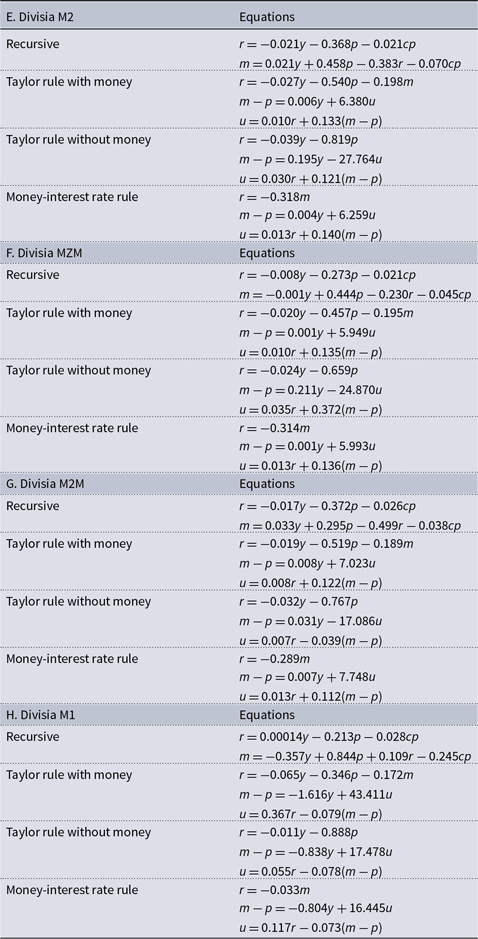
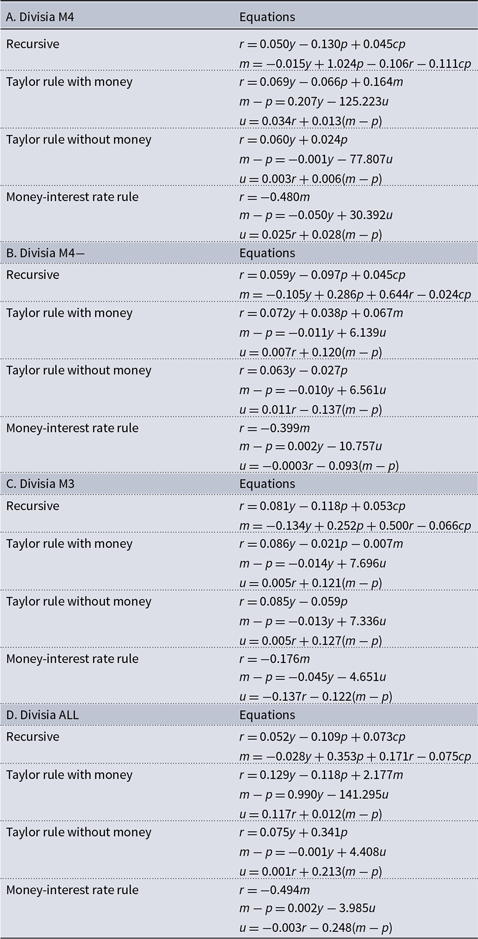
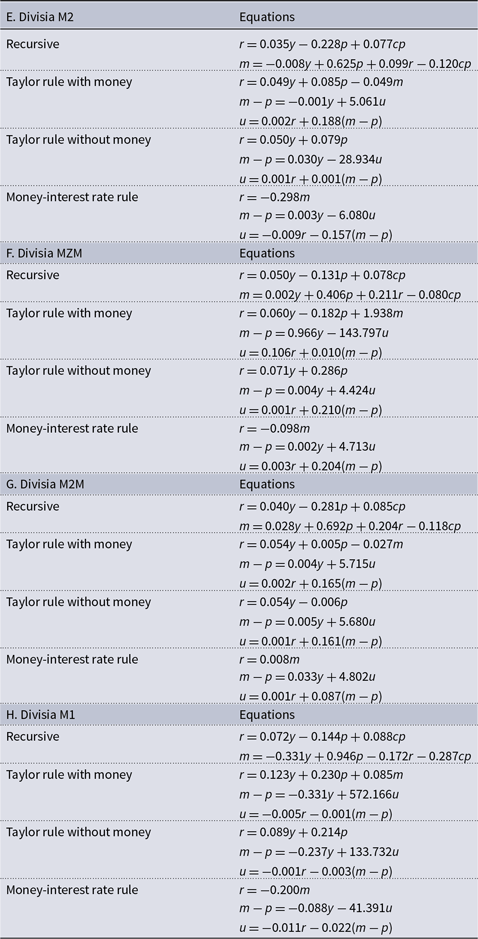
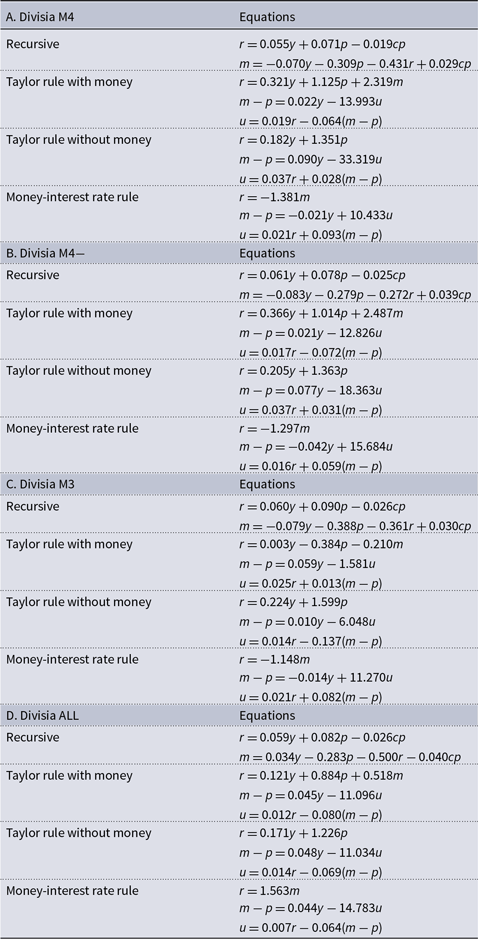
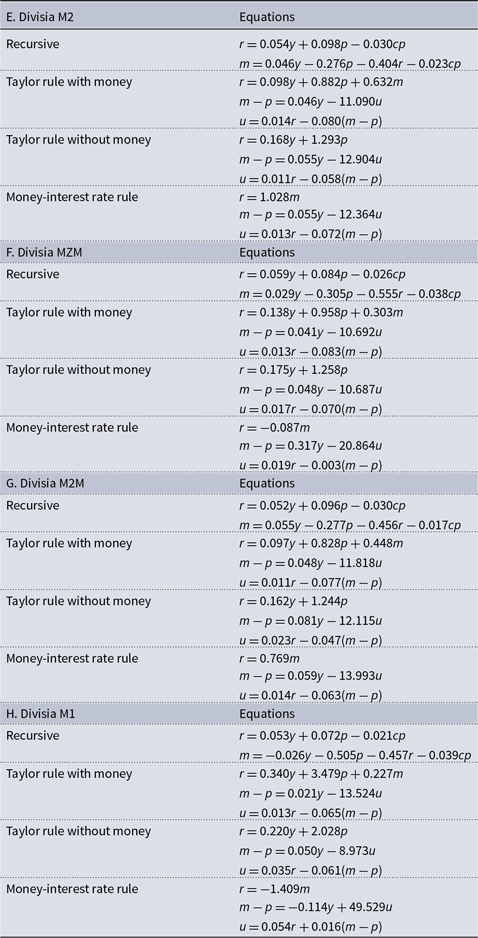
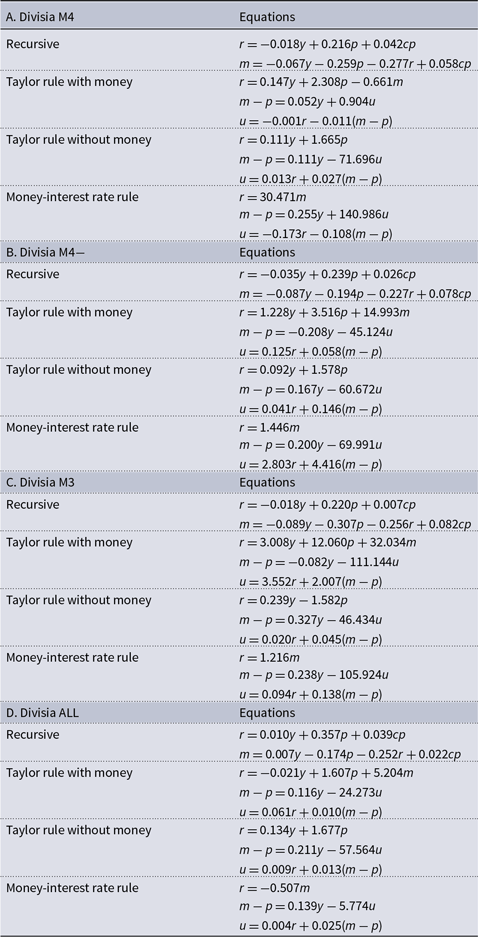
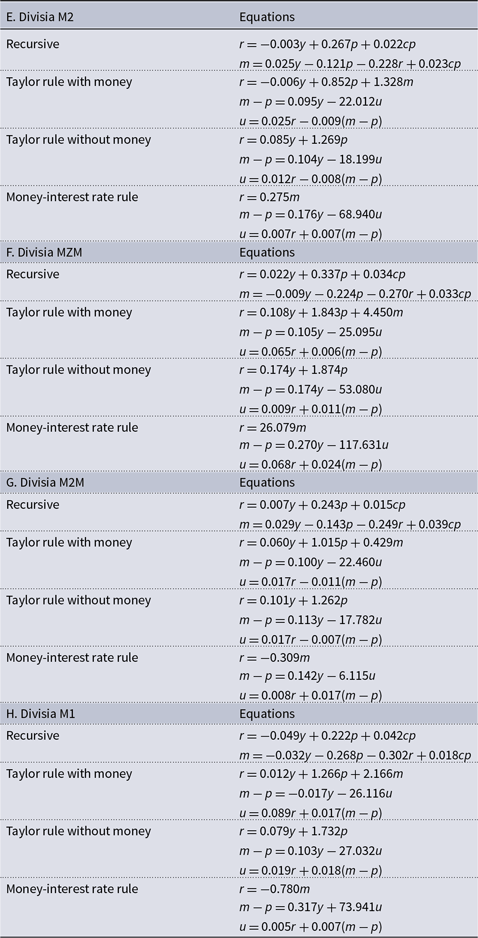
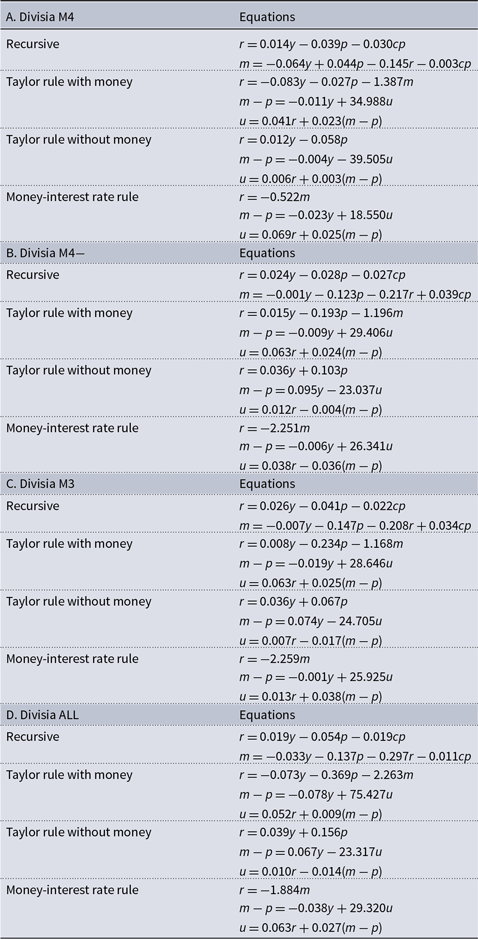
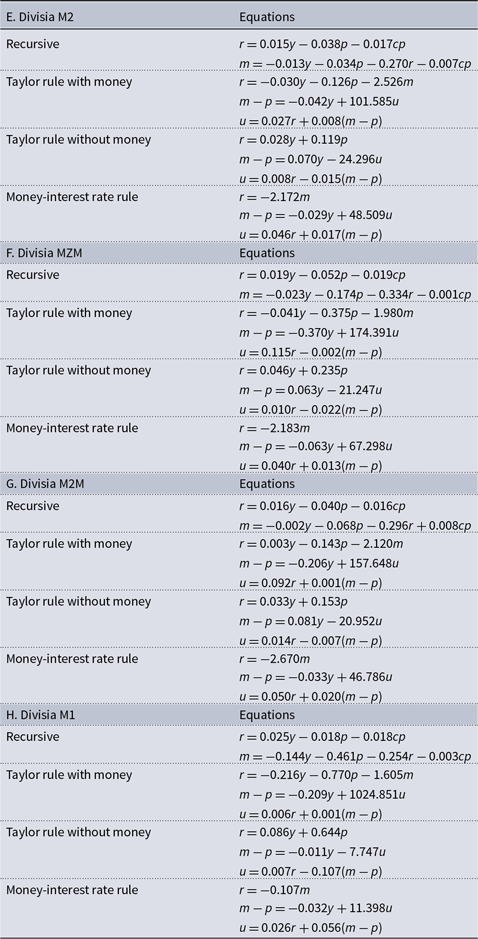
Tables 7 to 22 present estimates for the monetary policy, money demand, and monetary service equations across various scenarios. We conduct the following studies applying: the full range of both Divisia and credit-augmented Divisia; recursive and three non-recursive models; two distinct sample periods; and both the shadow federal funds rate and the effective federal funds rate. The diagonal elements of
 $\textbf {B}_{0}^{-1}$
are normalized to 1, which allows the model to isolate interest rate, real money service, and user cost to the left-hand side of the monetary policy, money demand, and monetary service equations, respectively. From these three equations, Belongia and Ireland (Reference Belongia and Ireland2015) confirm the following key findings: (1) in monetary policy equation, the policy rate has a positive relationship with both output and prices, (2) in money demand equation, real money has a positive relationship with output and negative relationship with user costs, and (3) in monetary service equation, user costs exhibit a positive relationship with both the policy rate and real money. Following this confirmation, we focus on the (
 $+$
), (
 $-$
) “signs” of the estimated coefficients in each equation across the Tables, in order to assess whether the results remain consistent with the benchmark findings. This section discusses the major findings, whereas additional results are provided in Appendix B. for completeness.
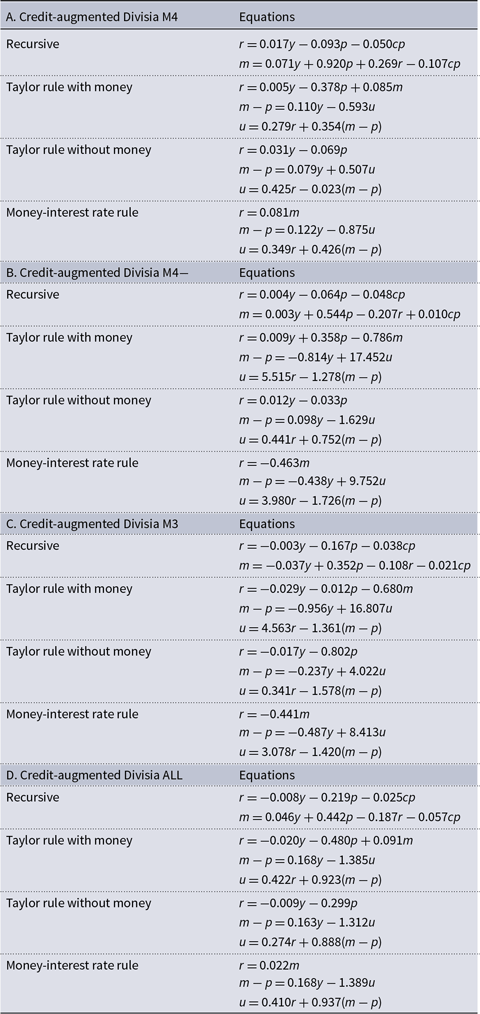
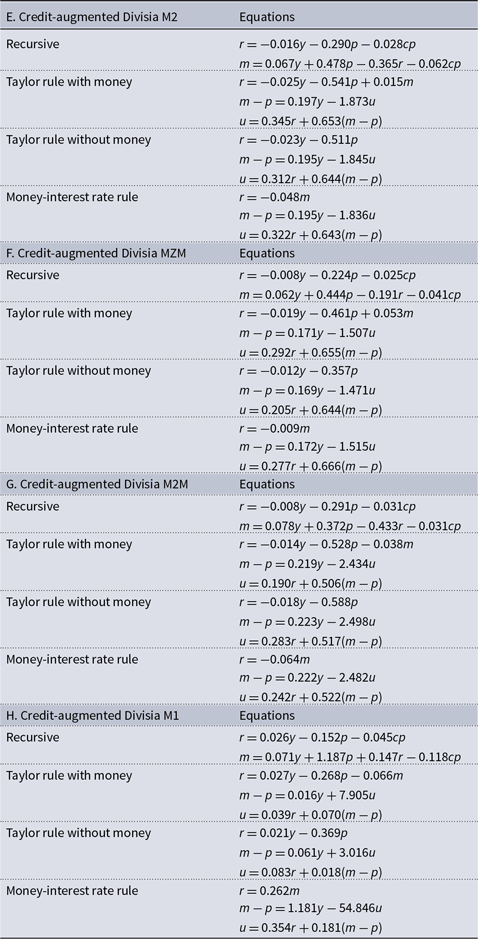
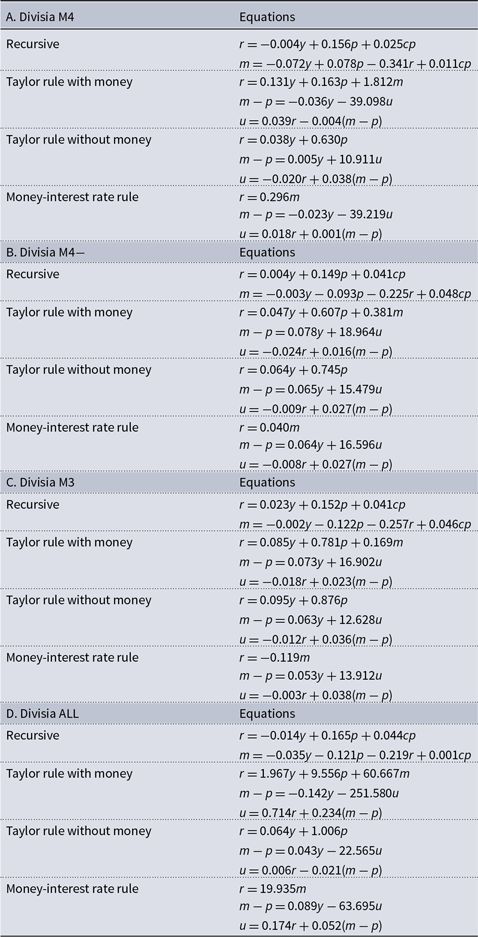
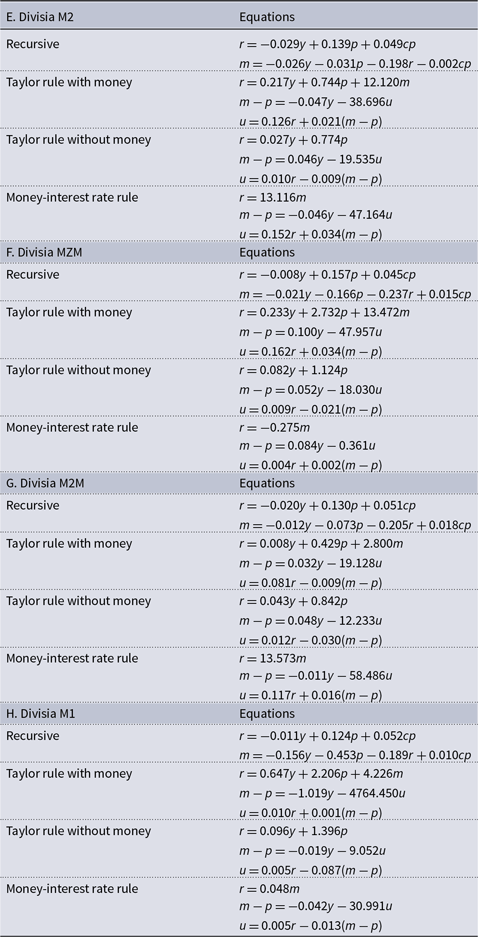
Tables 7 and 8 present the estimation results of the equations using all ranges of credit-augmented Divisia, the shadow federal funds rate, and the second sub-sample period. Neither the Taylor rule with money nor the Taylor rule without money reconfirms three key findings established in the benchmark study. By contrast, the Money-interest rate rule yields meaningful results that are precisely consistent with the benchmark across almost all ranges of monetary aggregates, outperforming the Taylor-type specifications. In line with the benchmark, the Money-interest rate rule indicates that real money is positively related to output and negatively related to user costs (second key finding), and user costs are positively related to both the policy rate and real money (third key finding). Owing to the nature of the Money-interest rate rule framework, we do not address the first key finding. The only exceptions are M3 and M4
 $-$
, which (as noted in Section 4) exhibit weak causal relationships with real economic variables. These exceptions could be explained by the same reasoning as discussed in Section 4. The overall structure of this model is analogous to the structure of causality tests presented in Section 4 (Tables 4 and 6), particularly with respect to data selection and sample period specification. Recalling that the Federal Reserve implemented unconventional monetary policy centered on money as a primary policy instrument during the second sub-sample period, it is therefore reasonable that the Money-interest rate rule produces meaningful results consistent with the confirmation of the benchmark findings.
Tables 17 and 18 present the estimation results of the equation using all ranges of Divisia, the effective federal funds rate, and the first sub-sample period. In comparison with Tables 7 and 8, Tables 17 and 18 adopt entirely different monetary data selection and sample period specifications. Considering the economic environment of the increasing recognition of the importance of credit and the adoption of unconventional monetary policy in recent periods, employing Divisia and the effective federal funds rate in the first sub-sample, and credit-augmented Divisia and the shadow federal funds rate in the second sub-sample, represents a methodologically sound strategy aimed at achieving analytical completeness. The key finding is that, across all ranges of monetary aggregates, at least one rule precisely replicates the benchmark results: 1) Taylor rule with money with Divisia MZM selection, 2) Taylor rule without money with Divisia M4, M4
 $-$
, ALL, MZM, and M1 selections, 3) Money-interest rate rule with Divisia M3, ALL, M2, MZM, and M2M selections reconfirm the benchmark’s key findings. While no single rule demonstrates consistent explanatory power across all ranges, at least one rule substantiates the usefulness of each specific monetary aggregate.
Since the causality tests in Tables 5 and 6 suggest that the broadest money could play a central role in recent economic analysis, we focus on the impulse response results using the credit-augmented Divisia M4. We exclude the use of Divisia since benchmark research has already conducted the analysis. The use of credit-augmented Divisia restricts the data period to July 2006 through December 2019, which includes the Great Recession, unconventional monetary policy implementations, and economic recovery. Therefore, we introduce the shadow federal funds rate as the appropriate policy rate. In Figure 2, each row presents the impulse response to a monetary policy shock for the following models: the recursive model, the Taylor rule with money, the Taylor rule without money, and the Money-interest rate rule. To assess the explanatory power of each model, we examine the presence (or absence) of puzzles and, if present, we estimate their duration. All models display a significant liquidity puzzle; however, the Money-interest rate rule exhibits a relatively smaller liquidity puzzle with a shorter duration (Figure 2, Last row). Consistent with the structures and results presented in Tables 7 and 8, this underlying Money-interest rate rule, centered on money as a primary policy device, demonstrates relatively robust outcomes.
Impulse responses to monetary policy shock; 1st row: Recursive, 2nd row: Taylor rule with money, 3rd row: Taylor rule without money, 4th row: Money-interest rate rule. The dotted red line stands for the 2-standard deviation confidence interval calculated by the delta-method bootstrapping.

Money-interest rate rule: Impulse responses to the monetary policy shock, the money demand shock, and the monetary service shock; Dotted red line stands for the 2-standard deviation confidence interval calculated by the delta-method bootstrapping.

Following the estimation of the Money-interest rate rule, Figure 3 presents the impulse responses of all endogenous variables. The first column illustrates the impulse response to the monetary policy shock. We observe decreases in price, output, and the quantity of money. An increase in the policy rate leads to a rise in the user cost price index. This effect can be explained by the monetary transmission mechanism, where the inflation tax effect resulting from the monetary policy shock is transmitted to output through the increase in the user cost price.
The second column describes the impulse responses to the money demand shock. We observe a decrease in output and an increase in the policy rate, which align with conventional economic theory and reaffirm the findings of Belongia and Ireland (Reference Belongia and Ireland2015). One important finding is that, while the decline in price in response to a money demand shock is also consistent with theory, this result was not captured in the benchmark study (Belongia and Ireland (Reference Belongia and Ireland2015)). As demonstrated, a positive money demand shock leads to an increase in the policy rate. This monetary policy channel, in turn, results in downward pressure on the price level.
The last column shows the impulse responses to a monetary system shock. The behavior of the private financial sector leads to a temporary decrease in output and a more persistent decline in price. It is evident that the continued drop in the nominal policy rate, in response to financial sector disturbances, causes an immediate decrease in the user cost price. However, it takes a significant amount of time for the quantity of money to recover and return to a positive level.
6. Conclusion
Since the Federal Reserve has been focusing on the federal funds rate instead of controlling the money supply directly to implement monetary policy, the monetary aggregate seems to have lost its status as a key variable in economic analysis. However, the monetary aggregate still plays an essential role in economic analysis. In particular, the monetary aggregates are indispensable for understanding the monetary policy transmission mechanism during the recent zero-lower bound era, a period in which the traditional federal funds rate was largely constrained in its effectiveness.
Numerous previous studies have suggested that Divisia and credit-augmented Divisia monetary aggregates, as published by CFS, are superior to the simple sum in tracking true liquidity service flow and in forecasting real economic variables. Building on the previous works discussed in the literature review section, our analysis focuses primarily on the broadest Divisia-type monetary aggregates to explore their economic implications. First, we find that the broadest Divisia-type monetary aggregates exhibit a strong causal relationship with various real economic variables. Second, the non-recursive VAR results offer empirical justification for the use of the underlying Money-interest rate rule. The impulse response analysis, focusing on the credit-augmented Divisia M4, appears to be optimized within the environment defined by the Money-interest rate rule. By exhibiting a relatively small liquidity puzzle, the findings once again confirm the empirical usefulness of M4.
An interesting direction for future research would be to extend the current single-equation framework to a multi-horizon analysis using local projections, which could reveal how the predictive power of monetary aggregates evolves over different forecast horizons.
We confirm that the broadest Divisia-type monetary aggregates can be used as a reliable instrument for detecting economic signals.
Supplementary material
The supplementary material for this article can be found at https://doi.org/10.1017/S1365100526100996.
Appendix A. Tables
Components of monetary aggregates

Source: Barnett et al. (Reference Barnett, Liu, Mattson and Noort2013).
Causality test results: Simple sum and federal funds

Note: Simple sum M3 is from OECD. Values in the table are marginal significance levels for the hypothesis that all lags of the monetary aggregates or the federal funds rate can be excluded from the equation (6).
Causality test results: Divisia, narrow money

Note: Values in the table are marginal significance levels for the hypothesis that all lags of the monetary aggregates or the federal funds rate can be excluded from the equation (6).
Causality test results: Divisia, broad money

Note: Values in the table are marginal significance levels for the hypothesis that all lags of the monetary aggregates or the federal funds rate can be excluded from the equation (6).
Causality test results: credit-augmented Divisia, narrow money

Note: Values in the table are marginal significance levels for the hypothesis that all lags of the monetary aggregates or the federal funds rate can be excluded from the equation (6).
Causality test results: credit-augmented Divisia, broad money

Note: Values in the table are marginal significance levels for the hypothesis that all lags of the monetary aggregates or the federal funds rate can be excluded from the equation (6).
GMM estimates of SVAR, broad money, shadow federal funds rate, sample period: Jul.06 – Dec.19

GMM estimates of SVAR, narrow money, shadow federal funds rate, sample period: Jul.06 – Dec.19

GMM estimates of SVAR, broad money, effective federal funds rate, sample period: Jul.06 – Dec.19

GMM estimates of SVAR, narrow money, effective federal funds rate, sample period: Jul.06 – Dec.19

GMM estimates of SVAR, broad money, shadow federal funds rate, sample period: Jul.06 – Dec.19

GMM estimates of SVAR, narrow money, shadow federal funds rate, sample period: Jul.06 – Dec.19

GMM estimates of SVAR, broad money, effective federal funds rate, sample period: Jul.06 – Dec.19

GMM estimates of SVAR, narrow money, effective federal funds rate, sample period: Jul.06 – Dec.19

GMM estimates of SVAR, broad money, shadow federal funds rate, sample period: Feb.92 – Jul.06

GMM estimates of SVAR, narrow money, shadow federal funds rate, sample period: Feb.92 - Jul.06

GMM estimates of SVAR, broad money, effective federal funds rate, sample period: Feb.92 – Jul.06

GMM estimates of SVAR, narrow money, effective federal funds rate, sample period: Feb.92 – Jul.06

GMM estimates of SVAR, broad money, shadow federal funds rate, sample period: Feb.92 – Dec.19

GMM estimates of SVAR, narrow money, shadow federal funds rate, sample period: Feb.92 – Dec.19

GMM estimates of SVAR, broad money, effective federal funds rate, sample period: Feb.92– Dec.19

GMM estimates of SVAR, narrow money, effective federal funds rate, sample period: Feb.92 – Dec.19

Data information for Causality test

Note: The fourth and fifth columns indicate the data availability for each time period. “Whole” refers to the full estimation period from Feb. 92 to Dec. 19, while “2nd period” corresponds to the estimation period from Jul. 06 to Dec. 19. The estimation for the 1st period (Feb. 92 to Jul. 06) is intentionally omitted, as it has already been conducted by Belongia and Ireland (Reference Belongia and Ireland2015).
Data information for VAR estimation

Note: The fourth to sixth columns indicate the data availability for each time period. “Whole” refers to the full estimation period from Feb. 92 to Dec. 19, “1st period” refers to the estimation period from Feb. 92 to Jul. 06., and “2nd period” corresponds to the estimation period from Jul. 06 to Dec 19.