Introduction
Many diseases are susceptible to being spread by movements between holdings, and past events such as foot-and-mouth disease in the United Kingdom (2001) or classical swine fever in the Netherlands (2003) have clearly shown that live animal movements represent a major risk for the transboundary spread of disease (Fèvre et al., Reference Fèvre, Bronsvoort, Hamilton and Cleaveland2006). European Union legislation requires identification and registration for cattle, pigs, sheep and goats. Since Regulation (EC) no. 1760/2000 of the European parliament, France, like most Member States, has considerably enhanced cattle industry traceability and extended this measure to all animal productions.
The mandatory system encompasses birth to retail with large amounts of data collected. Traceability becomes a tool that may be used to carry out surveillance, prevention or control of animal disease (Ammendrup and Barcos, Reference Ammendrup and Barcos2006). For example, national cattle trade data have been widely studied using network analysis methods (social network analysis (SNA)) for the characterization of trade organization and the detection of communities to qualify their vulnerability structure and to target surveillance (Christley et al., Reference Christley, Robinson, Lysons and French2005; Bigras-Poulin et al., Reference Bigras-Poulin, Thompson, Chriel, Mortensen and Greiner2006; Natale et al., Reference Natale, Giovannini, Savini, Palma, Possenti, Fiore and Calistri2009; Rautureau et al., Reference Rautureau, Dufour and Durand2011; Nöremark et al., Reference Nöremark, Hakansson, Lewerin, Lindberg and Jonsson2011). Fewer studies were dedicated to the pig trade network (Bigras-Poulin et al., Reference Bigras-Poulin, Barfod, Mortensen and Greiner2007; Martinez-Lopez et al., Reference Martinez-Lopez, Perez and Sanchez-Vizcaino2009a; Lentz et al., Reference Lentz, Konschake, Teske, Kasper, Rother, Carmanns, Petersen, Conraths and Selhorst2011; Nöremark et al., Reference Nöremark, Hakansson, Lewerin, Lindberg and Jonsson2011).
SNA based on the study of the relationships among social entities (Wasserman and Faust, Reference Wasserman and Faust1994) has developed indicators of centrality for nodes (units of interest) or for their relationship (called links) and methods for the identification of cohesive structures (groups or individual clusters). This approach has been introduced in veterinary epidemiological studies only recently (reviewed by Dube et al. (Reference Dube, Ribble, Kelton and McNab2009) or Martinez-Lopez et al. (Reference Martinez-Lopez, Perez and Sanchez-Vizcaino2009b)).
Livestock movements have been analysed thus in several studies to evaluate the potential transmission of an infectious disease through the contact network or to assess the impact of livestock movement regulations. The live animal trade can be represented by a network in which the holdings are represented by nodes and the animal movements between these holdings are represented by links (namely arcs as direction is taken account). Animal movements along the network links can be considered as paths for the diffusion of a disease.
Disease spread is therefore dependent on the structure of the network and network topology may reveal the existence of holdings or groups particularly exposed to infection, defined as ‘vulnerable’ entities (Bell et al., Reference Bell, Atkinson and Carlson1999). Within a network, the vulnerability would be a measure of the likelihood for an individual to become infected. By identifying individuals with high vulnerability, SNA can enhance targeted surveillance and prevention programmes.
This node-level definition may be generalized at the network level, considering that a trade network is vulnerable to the spread of infectious diseases if (i) live animal movements through this network may lead the disease to spread very fast inside a country (in particular before the identification of the first case) and (ii) human and material resources would quickly become insufficient to control the epidemic with the usual control measures. In this context, network connectedness determines how fast and widely an infection may spread, and the existence of large connected components (beyond a certain size) is the basis of network vulnerability.
Swine traceability records have recently become as systematic and detailed as cattle data. While cattle movement registration is individual, swine movement records are collective, for example, by epidemiological unit or animal batch. Moreover, swine husbandry differs from cattle husbandry. The pig industry has a pyramidal structure with movements predominantly going downward through the system; from nucleus herds to multiplier herds, from multiplier herds to production herds and then from breeding units to growing units and from growing to finishing units.
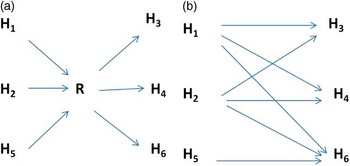
One question of interest is whether these structural differences between cattle and swine trade networks can be measured. We computed current network analysis parameters as a means of addressing this question. The network type commonly studied for network analysis is a one-mode network. A one-mode network is composed of a set of similar nodes (Figure 1); contacts between nodes (individuals) are considered equivalent and each node can have links to any other node. However, farm animal movements (especially swine movements) often occur by animal batches, moved from one holding to another one in a given truck. The truck may then play an epidemiological role and support the transmission of an infectious agent. The movements of animal batches performed by a single truck during a single day will be termed ‘round’. But, rounds must be considered as a different class of nodes than holdings. Such a network is called an affiliation or a two-mode network in which nodes are partitioned in two mutually exclusive sets such that there are no links between nodes within a given set (Figure 1). Two-mode networks are built with one set of nodes and one set of events such that the adjacency matrix is given by nodes × events, rather than nodes × nodes as for one-mode networks (Borgatti and Everett, Reference Borgatti and Everett1997).
Network types: (a) two-mode network: two sets of nodes (H = holdings and R = round) and (b) one-mode network: one set of nodes (H = holdings). Two mode-networks were transformed into one-mode networks by replacing movements involved in a round by direct movements between holdings. The figure indicates the chronology of truck collection.

The objective of the study was to evaluate the vulnerability of the French swine trade networks to infectious diseases using network analysis indicators. The methodology described above was applied to swine movements between French holdings by studying different networks and different time scales: 6-month, monthly and weekly movements. Two types of networks (two-mode and one-mode networks) were built and examined to compare them and ascertain which type provided the best information. Besides, the similarity to cattle trade networks was discussed.
Material and methods
Data source
French swine movement data were obtained from the National Swine Database of Identification (BDporc) recognized by the French Ministry of Agriculture and managed by swine industry professionals. Systematic recording of swine movements started in France in January 2010, and the data set corresponding to the first 6 months of 2010 was used. Movements of pigs, as well as information related to livestock holdings, are registered. The database contains the production type and approximate number of animals kept on each farm based on self-reporting by the farmer. One agricultural enterprise can have several units operating under a unique identification number.
Movements of pigs are reported at group level by animal batches and not at individual level.
Reporting for a specified shipment (incoming or outgoing) includes the date of the event, the number of the round and the holding of origin (or of destination). An animal shipment was defined as a batch of animals gathered or dispatched simultaneously by a given transport vehicle. Holdings with incoming shipments ‘receive’ pigs, whereas holdings with outgoing shipments ‘dispatch’ pigs. These operations of loading and unloading (outgoing and incoming shipments) by a given truck in a given day is termed ‘round’. Each round is identified by a unique numbering system. Only records of complete rounds with at least one outgoing shipment and one incoming shipment were included in the study.
Three kinds of holdings were distinguished: farms, dealers (trade operators) and slaughterhouses. Pig farms were classified as belonging to one of the following six categories: (1) breeding, (2) farrow-to-grow, (3) farrow-to-finish (4) growing, (5) grow-to-finish and (6) finishing herd.
Using the information on reported movements by type of animal, number of rounds and number of animals moved between the different holding types (farms, dealers and slaughterhouses) were compiled. The Euclidean distance between the origin and destination holdings was calculated. Zero distances indicated swine transferring between two units in the same holding.
Network analysis
Networks representing the swine trade were built that included each holding involved in any movement during the period. Imports and exports were not taken into account.
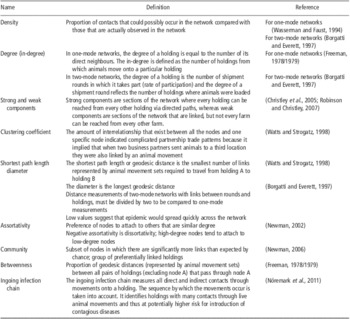
Two-mode-oriented and one-mode-oriented networks were constructed for three different time scales: the global period (6-month network), the month (6-month networks) and the week (26-week networks). All of the movements between two specific holdings during the time period were then condensed into a single arc. Initial analysis involved calculating several parameters to characterize networks and then identifying components or communities of nodes for different time scales (Table 1). Once subgroups had been identified within networks, they were extracted and described.
Network analysis glossary of terms interpreted in the context of livestock movement

Network constructions
Movements to slaughterhouses were not taken into account. Although these movements were numerous, it can be assumed that they represented little or no risk for the transmission of swine diseases to other swine. An affiliation network was built with one set of nodes (holdings) and one set of events (rounds; Borgatti and Everett, Reference Borgatti and Everett1997).
To build one-mode networks with a set of equal nodes (holdings), network data were altered (Figure 1). Outgoing and incoming shipment movements were ranked by date/h. Movements involved in a round were replaced by direct movements between holdings. We assumed that animals unloaded at a holding could have had contacts with all of the animals loaded previously during the round. Therefore, holdings where animals had been unloaded during a given round were linked to each of the holdings where animals had been loaded before, during the same round.
Network description
The networks were analysed separately and then compared. We first compiled descriptive parameters for all networks and then analysed them to detect significant connected components (Table 1).
First, several descriptive parameters (Wasserman and Faust, Reference Wasserman and Faust1994) were calculated for all networks: the size (number of nodes and links), the average degree (average number of nodes directly linked to a node), the average path length (the average number of links along the shortest paths – or geodesics – between all pairs of nodes) and the diameter (the longest geodesic).
For each global network, a power-law distribution using as P(k) ∼ k−γ was fitted from distribution of node degree (denoted k). Estimating the parameters of a power-law distribution is complex as, most of the time, only the tail of the observed distribution follows a power law. As large fluctuations occur in the tail of power-law distributions, it is difficult to identify the range over which power-law behaviour holds. We used the approach proposed by Clauset et al. (Reference Clauset, Shalizi and Newman2009) that combines a maximum-likelihood estimator of the scaling exponent (γ) with the Kolmogorov–Smirnov statistic for determining the threshold above which the power-law behaviour holds.
Some measurements have different meanings depending on network type and some have no meaning in two-mode networks (Table 1). Thus, the following indicators were calculated only for one-mode networks: the clustering coefficient (proportion of neighbours of a node that are linked to each other) and the assortativity (correlation between the degrees of linked nodes).
For the 6-month one-mode network, the distributions of the three main centrality measurements were computed for each holding type: degree, in-degree (number of different holdings from which a holding receives animals) and betweenness (the frequency at to which a node is on the shortest path between any pair of nodes; Freeman, Reference Freeman1978/1979). Moreover, a new measurement proposed by Nöremark et al. (Reference Nöremark, Hakansson, Lewerin, Lindberg and Jonsson2011) was calculated, the ingoing infection chain, which identifies the number of holdings that are connected to one holding taking into account the order of the movements (Nöremark et al., Reference Nöremark, Hakansson, Lewerin, Lindberg and Jonsson2011). The order in which contacts occur is important, as animals leaving a holding before introduction of infection do not constitute a risk for the spread of disease.
Finally, weakly and strongly connected components were studied in the one-mode and two-mode networks. Weakly connected components (WC) are subnetworks for which a path exists between any pair of nodes, whatever the link direction. These WCs can be interpreted as independent subnetworks, as, in a given network, no connection exists between two WCs. Strongly connected components (SCs) are subnetworks for which every node can be reached from every other node via one (or several) directed path(s). They can be interpreted as areas of a network where connectedness is particularly high. A disease introduced into any holding of an SC can potentially reach any other holding in that SC (Rautureau et al., Reference Rautureau, Dufour and Durand2011). Calculation of giant strong connected component (GSC) size in animal movement networks may then be used to estimate potential epidemic sizes (Robinson and Christley, Reference Robinson and Christley2007; Volkova et al., Reference Volkova, Howey, Savill and Woolhouse2010a and Reference Volkova, Howey, Savill and Woolhouse2010b). The number of WCs and SCs and the size of the two largest WCs and SCs were determined. Both sizes were compared to qualify the largest WCs (or the largest SCs) as ‘giant’ weak (or strong) components (GWCs or GSCs).
Network communities
Many networks can be divided into communities. A community (or module) is defined as a subset of nodes in which there are significantly more edges than expected by chance. Community detection is characterized by the modularity function Q introduced by Newman (Newman, Reference Newman2006), which scores the quality of a partition. The objective is to maximize the function Q, defined as Q = (number of edges within communities) – (expected number of those edges).
We used the ‘greedy algorithms’ method proposed by Newman (Clauset et al., Reference Clauset, Newman and Moore2004; Newman, Reference Newman2004), which can only be applied on one-mode networks. We, therefore, identified communities in the global one-mode network with and without movements to a slaughterhouse. The spatial extent of the largest communities and the composition of these communities by type of holdings (proportion of farm productions and dealers) were determined.
Network analyses were performed using the Igraph package (v 0.5.2, http://igraph.sourceforge.net) for R software (Anonymous, 2009).
Results
Swine trade data
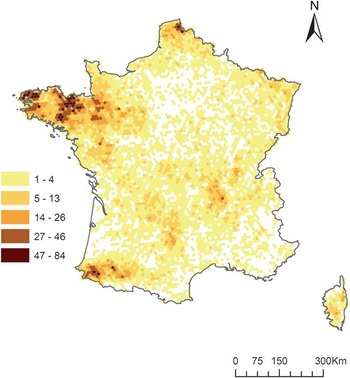
Available data comprised all French swine trade information with ∼23 084 pig holdings and their links in the pork production chain (breeders to slaughterhouses). Swine-holding density was clearly concentrated in the west of France: in Brittany, the primary region of French pork production; and in the southwest, near the Pyrenees (Figure 2).
Spatial density of swine farms, France, 2010. Density: number of holdings/10-km diameter hexagon.

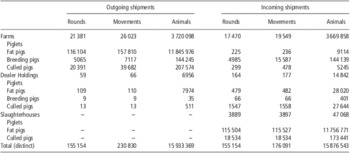
During the 6-month study period, 155 154 shipment round connections between 13 968 holdings (13 809 farms, 19 dealer holdings and 140 slaughterhouses) were recorded. Rounds could involve animals of several production types, as shown in Table 2, where movements are presented in detail. The network was shown to have many intense flows as seen from the ratio of number of pigs moved over number of movements (78.1 animals). 78.3% of incoming pig shipments (75.4% of animals) were movements to slaughterhouses. In all, 84% of rounds made by a truck consisted solely or partly of these movements. Differences of animal numbers between outgoing and incoming shipments for the transfers by dealer holdings correspond to export movements. Thus, dealer holdings were the primary gateway for export animals in comparison with animals which would leave farms directly.
Number of animal movements and of animals moving between French holdings from January to June 2010 according to outgoing and incoming shipments

Piglet = just weaned pig; fat pig = pig from fattening structure; breeding pig = sow and boar; culled pig = retired breeding pig.
Average distance of an animal movement was 82.5 km (median distance 55 km and range 0.1 to 793 km); to slaughterhouses it was 86.4 km (median distance 58.4 km and range 0.1 to 725 km), which was significantly higher than to holdings, 75.2 km (median distance 51 km and range 0.1 to 793 km; Wilcoxon test: P < 0.0001).
Network characteristics
Comparison between two-mode and one-mode networks
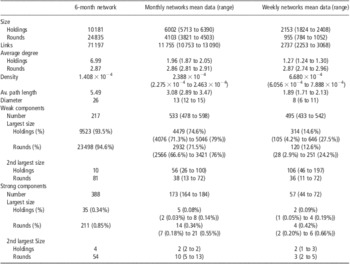
The two-mode global network contained 10 181 holdings linked by 24 835 rounds with 71 197 arcs. On average, 60% of holdings participated in the monthly (with 16.5% of rounds and arcs) and 21% in the weekly networks (with 3.8% of rounds and arcs; Table 3). A holding took part in approximately seven rounds (average degree of holdings) during the 6-month period study and between one and two rounds for monthly and weekly networks. Whatever the time scale, a round concerned on average 2.8 holdings (average degree of rounds).
Descriptive parameters for two-mode 6-month, monthly and weekly swine trade networks in France, 2010

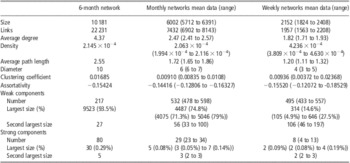
In the same way, the 10 181 holdings of the global one-mode network were linked by 22 231 arcs, whereas 60% of holdings participated in the monthly networks with 33% of the arcs and 21% also participated in the weekly networks with 8.8% of the arcs (Table 4). A holding had on average 4.4 different contact holdings (average degree) with which it exchanged animals during the 6-month period study and on average 2.47 and 1.82 contacts in monthly and weekly networks, respectively.
Descriptive parameters for one-mode 6-month, monthly and weekly swine trade networks in France, 2010

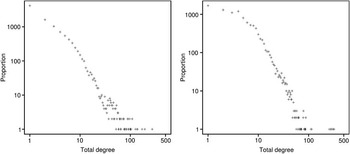
The degree distributions of holdings for global one-mode and two-mode networks had similar curves and the tail distribution seemed linear on a log–log scale with respectively a power-law exponent γ of 2.6 and 3.1 for the nodes with the degree above 7 and 8, respectively (Figure 3).
Distribution of holding degrees in the 6-month one-mode (left) and two-mode (right) networks of swine movements, France 2010 (log scale).

Irrespective of the network type, distance indicator measurements decreased with the time scale; a given pair of connected holdings was separated by approximately two animal movements (average path length), that is, there was one intermediary holding. In one-mode networks, there were from 2.55 arcs (in 6-month network) to 1.2 arcs (on average in weekly networks) between two holdings (Table 4) and in two-mode networks from 2.75 (i.e. 5.5/2) to 0.86 (i.e. 1.89/2) arcs (Table 3). The diameter (the longest geodesic between holdings) also decreased from 10 arcs (global network) to an average of 4 arcs (weekly networks) in one-mode networks (Table 4). In two-mode networks, the diameter varied from 13 (i.e. 26/2) arcs to an average of 4 (i.e. 8/2) arcs (Table 3).
Global and monthly networks were less fragmented, the largest WC including >70% of the nodes, whereas the weekly network fragmentation was higher, with the largest WC including only 14.6% of the holdings. On the other hand, no large strong components were observed, the size of strong components being in any case very low (∼30 holdings for global networks and fewer than five holdings on average for monthly and weekly networks).
Specific one-mode network characteristics (Table 4)
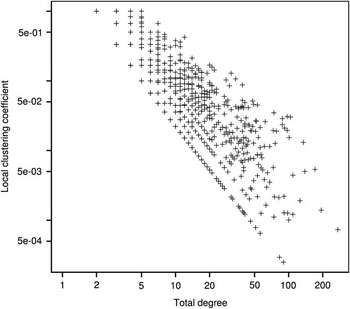
The global clustering coefficients in monthly and weekly one-mode networks were low and of the same order of magnitude as those for a random network (Newman, Reference Newman2005). A higher value was obtained for the 6-month network. In this latter case, the local clustering coefficient appeared inversely linked to the node degree (Figure 4). The assortativity of networks was negative indicating that networks were disassortative: nodes were more often linked to nodes with different degrees than to nodes with similar degrees.
Distribution of local clustering coefficients according to node degree in the 6-month one-mode network of swine movements, France 2010 (log scale).

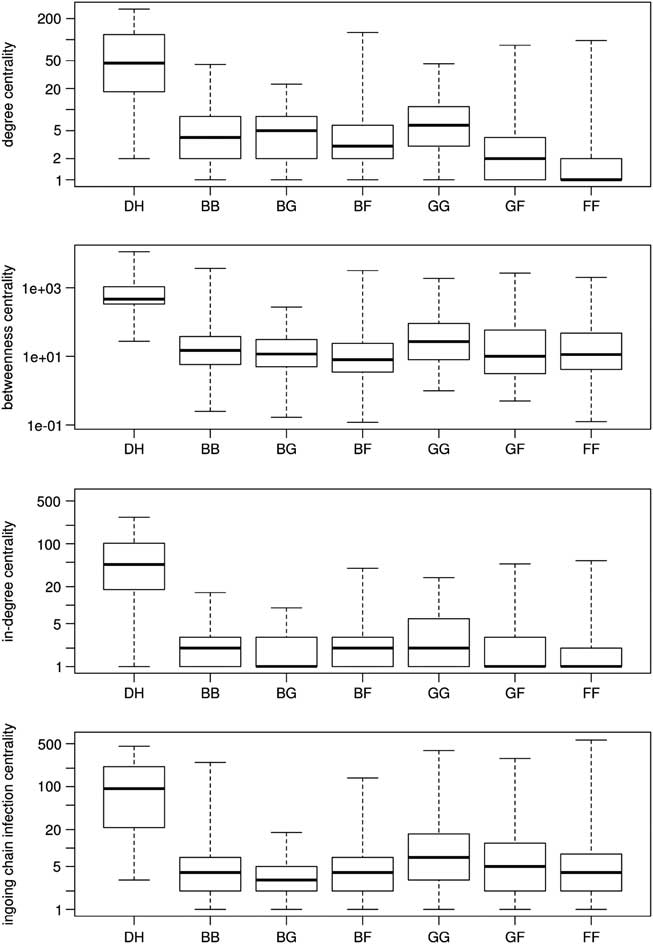
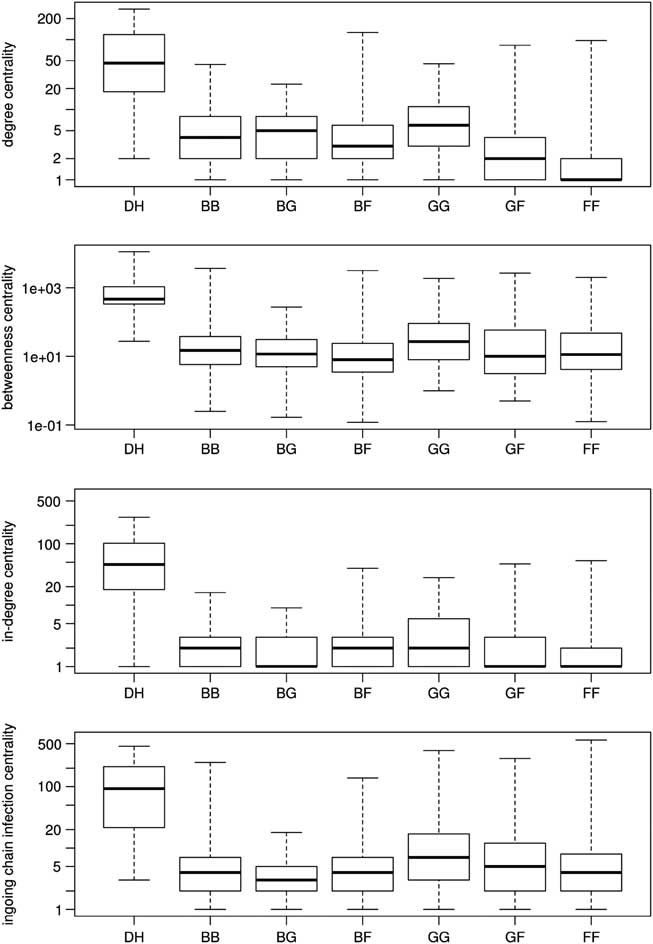
Centrality values (degree, betweenness, in-degree and ingoing infection chain) appeared significantly higher for dealer holdings than for farms (Figure 5; Wilcoxon test: P = 0.018 for betweenness centrality and P < 0.0001 for the other centrality values). There were also significant differences between types of swine unit (Kruskal–Wallis test: P < 0.0001); considerable heterogeneity was observed within types of holdings (Figure 5). For example, degree centrality for farrow-to-finish herds ranged from 1 to 126 (median: 3) and ingoing infection chain centrality for finishing herds ranged from 1 to 573 (median: 4). However, herds with growing units had higher values for degree and betweenness centrality, representing central positions for both spreading and receiving disease, whereas herds with finishing units had higher values for in-degree and ingoing infection chain centrality values, indicators of vulnerability.
Distribution of degree, betweenness, in-degree and ingoing infection chain centrality in holdings involved in the 6-month one-mode network of swine movements, France, 2010. (DH = dealer holdings; BB = breeding; BG = farrow-to-grow; BF = farrow-to-finish; GG = growing; GF = grow-to-finish; FF = finishing herd).
Modularity analysis
Networks including movements to slaughterhouses
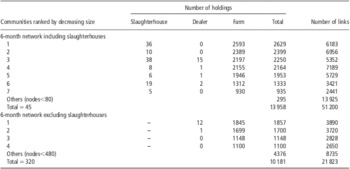
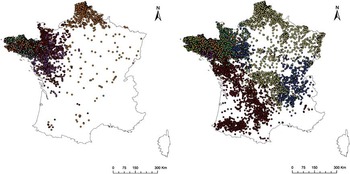
Forty-five communities were identified (Q max = 0.58). The number of holdings forming a community varied between 1 and 2629. Seven large communities contained about or more than 1000 holdings representing 98% of all holdings (Table 5). They were mostly spatially clustered. A number overlapped and shared their whole area as in Brittany (four out of seven), but communities could be located over several regions (Figure 6).
Number of holdings and trade connections within trade communities in 6-month networks, one including slaughterhouses and one excluding slaughterhouses (France, 2010)

Spatial distribution of the largest communities (>1000 holdings) of the 6-month swine trade network including slaughterhouses, France, 2010; seven large communities in networks including slaughterhouses (right) and four large communities in networks excluding slaughterhouses (left).

Network excluding movements to slaughterhouses
Three hundred and twenty communities were identified (Q max = 0.76). The number of holdings forming a community varied between 1 and 1857. Communities are described in detail in Table 5. Within these 320 communities, 57% of the holdings were part of the four largest communities (>1000 holdings). Although finishing herds and grow-to-finish herds mostly belonged to communities (on average 30% and 51% of holdings, respectively), holdings distribution by type was significantly different among communities (Pearson's χ 2 test: P < 0.0001). However, three communities were clearly spatially clustered in Brittany, the fourth being in the north of France (Figure 6).
Discussion
The swine industry forms a complex network spread heterogeneously across the country, with holdings being dynamically linked by animal movements. This network was studied at three different time scales to explore structural vulnerability to the spread of any disease.
One- and two-mode networks
The French swine trade was described first by links between two sets of nodes at different levels of analysis: actors (holdings) and events (rounds). Data such as these involve two levels of analysis (i.e. two modes). Two-mode data offer some very interesting analytic possibilities for gaining greater understanding. Thus, holdings involved in swine trade were concerned by approximately seven rounds during the 6-month period study. And a round connected each time on average from two to three holdings. Although rich in their data content, the two-mode networks are, however, difficult to interpret and little work has been done concerning animal trade movements with this approach (Robinson and Christley, Reference Robinson and Christley2007). A common strategy in such cases is to examine instead a one-mode ‘projection’ of the network onto either the holdings or the gathering rounds. For this purpose, we altered the two-mode network to a one-mode network keeping the same sequence of outgoing and incoming shipments. The results obtained were close to those from two-mode networks. We could thus continue the network analysis with a wider range of network methods and indicators.
Moreover, the data set used for this study reflects trade activity for only 6 months, as registration has only recently been made mandatory. The observation period and the lack of precision or error-rate due to self-reporting could introduce some bias in the analysis. The 6-month period was, however, compatible with a complete cycle of swine production.
Scale-free structure
The node degree distributions were evaluated and appeared heavy-tailed suggesting a scale-free structure. Moreover, the correlation between local clustering coefficients and node degrees confirmed as well as the disassortativity (assortativity <0), the scale-free structure and the presence of hubs. Theoretical studies have shown that the scale-free structure of networks can influence the speed and the extent of a disease that would spread via network links (Pastor-Satorras and Vespignani, Reference Pastor-Satorras and Vespignani2001; Kiss et al., Reference Kiss, Green and Kao2006a). Heterogeneity in the distribution of links within a network is a key factor and reveals the presence of central individuals (hubs) that are the most likely to spread a disease and that could be targeted by control measures.
The French swine trade network had the same topology as animal trade networks described elsewhere in Europe (Christley et al., Reference Christley, Robinson, Lysons and French2005; Bigras-Poulin et al., Reference Bigras-Poulin, Thompson, Chriel, Mortensen and Greiner2006; Kiss et al., Reference Kiss, Green and Kao2006b; Bigras-Poulin et al., Reference Bigras-Poulin, Barfod, Mortensen and Greiner2007; Natale et al., Reference Natale, Giovannini, Savini, Palma, Possenti, Fiore and Calistri2009; Volkova et al., Reference Volkova, Howey, Savill and Woolhouse2010a and Reference Volkova, Howey, Savill and Woolhouse2010b).
Vulnerability to disease spread
No vulnerable structures emerged as GSCs. However, GWCs were identified and the swine network was well connected. Unlike SCs, WCs are subnetworks for which a link exists between any pair of nodes, whatever the link direction. These WCs are considered as independent subnetworks and show that the swine network was well connected but in a rather hierarchical fashion. We, therefore, focussed our attention on the community structure of the networks and associated values such as modularity. Community structures in networks are natural divisions of network nodes into densely connected subgroups. Identification of communities in the swine trade network showed that holdings were preferentially linked. In the analysis of network data, many methods have been proposed for finding communities, but few have been proposed for determining whether the distribution breakdown found is statistically significant or a result of chance. With the method used here, the significance of community structure can be effectively quantified by measuring its robustness to small perturbations in network structure (Karrer et al., Reference Karrer, Levina and Newman2008), using the modularity Q. In principle, the maximum value of the modularity is Q max = 1 and such a network could be considered as highly modular. Nevertheless, it is lower for most real networks (Good et al., Reference Good, de Montjoye and Clauset2010) and modularity can be considered to be high from 0.5 (Clauset et al., Reference Clauset, Newman and Moore2004). Here, the modularity tended to 0.6 for networks including slaughterhouses (Q = 0.75 for networks excluding slaughterhouses). Most large communities (>1000 holdings) overlapped and shared their whole area namely Brittany (four out of seven). For the German trade network over a period of 2.5 years, modularity was found to be 0.717 and the nine largest communities (>660 holdings) were also spatially clustered but covered the entire country (Lentz et al., Reference Lentz, Konschake, Teske, Kasper, Rother, Carmanns, Petersen, Conraths and Selhorst2011). The groups of holdings represented by communities suggest groups in an integrated system or, for networks including slaughterhouses, the supply-pool of slaughterhouses. With another approach using a combination of SNA and cluster analysis, the holding pool representing pork industry activities has also been identified as made up of temporal–spatial clusters of holdings at risk for the introduction of disease by animal shipments in Spain (Martinez-Lopez et al., Reference Martinez-Lopez, Perez and Sanchez-Vizcaino2009a).
Farms with growing units (unit in the middle of the production chain) appeared more central (betweenness value) and herds with finishing units appeared more vulnerable (in-degree and ingoing infection chain values). Holdings were very close with only on average one intermediary holding between a given pair of connected holdings (deducted from the average path length). The low values suggest first that epidemic would spread quickly across the network. Second, this reflects the dynamic nature of the swine industry with downward movements through the pyramidal structure where all holdings could play a role in disease spread along the production process. The scale-free structure and holdings with high centrality values allow us to assume that these holdings may control flows in part of the network, maintain connectivity and promote dynamic dissemination. Here, dealers stood out as having high centrality values. However, centrality values for given types of farms were close to one another and considerable heterogeneity was observed. Thus, some holdings should certainly be targeted, as, for example, sow pool herds where sows are inseminated in a central unit and farrow in satellite herds or, inversely, finishing herds, which collect piglets from numerous breeding herds. But, because of the trend of French herds to integrate several production units, no production types could be suggested for targeting.
Comparison with the French ruminant trade network
Some characteristics of the network were remarkably different compared with cattle or sheep movement networks. In the French cattle, trade network was more disassortative (−0.18 v. −0.14 in monthly networks) and centrality measurements of dealer and market appeared markedly higher than those in the French swine trade network (Rautureau et al., Reference Rautureau, Dufour and Durand2011). Here, dealer holdings had higher centrality values than the other holdings but represented 0.19% of the population compared with 0.54% for the cattle population (Rautureau et al., Reference Rautureau, Dufour and Durand2011). Moreover, dealer holdings in the swine trade seem to be dedicated to animal export. Thus, dealers definitely play a role as hubs at the level of international trade but they do not take part in national movements in the same way as described in cattle and sheep networks (Robinson and Christley, Reference Robinson and Christley2007). Besides, no GSC was found out in swine networks. In the French cattle trade network, GSC emerged whatever the time scale, a large subset of holdings existed and were continually linked and widely spread all over the country. GSCs included, 45% of network nodes in the yearly network (i.e. 108 904 holdings), and on average, 8% in the monthly networks (10 277 holdings) and 4% weekly networks (2115 holdings; Rautureau et al., Reference Rautureau, Dufour and Durand2011). GSCs are considered as areas where connectedness is particularly high. Thus, a disease introduced into any holding in the subnetwork can potentially reach any other holding in the same subnetwork. Large detected communities in the swine trade network can also be interpreted as structural risk but they showed only that holdings were preferentially linked (holdings are not all linked).
For these reasons, the swine trade network thus appeared less structurally vulnerable than ruminant trade networks.
Comparison with other countries
In fact, the swine trade is a specific trade network and should be compared above all with other swine movement networks. The characteristics of the French monthly swine trade network are similar to those of the Swedish monthly swine trade network (Nöremark et al., Reference Nöremark, Hakansson, Lewerin, Lindberg and Jonsson2011; density, clustering coefficient and assortativity). The Danish swine industry network was described as being strongly heterogeneous within and between farms (Bigras-Poulin et al., Reference Bigras-Poulin, Barfod, Mortensen and Greiner2007). Nöremark et al. (Reference Nöremark, Hakansson, Lewerin, Lindberg and Jonsson2011) also found associations between in-degree or ingoing infection chain centrality and production type by classifying the herds according to production type ‘highest in the pyramid’.
Our study applied an alternative method defining and using general SNA indicators (i.e. model and disease independent) to characterize animal trade network vulnerability to disease spread and tested this approach in two different network types. To a certain extent, the observed communities can be considered as risk structures. However, because of this fragmentation, the swine trade network appeared less structurally vulnerable than ruminant trade networks. This fragmentation is explained by the hierarchical structure, which thus limits the structural vulnerability of the global trade network. However, within communities, the hierarchical structure of the swine production system would favour the spread of an infectious agent (especially if introduced in breeding unit herds).
Acknowledgements
The authors thank members of BDporc for making holdings and animal movement data available. They are also grateful to Maria Nöremark (National Veterinary Institute, Sweden) and Nina Håkansson (University of Skövde, Sweden) for providing computing support for calculation of the ingoing infection chain centrality.