1 Introduction
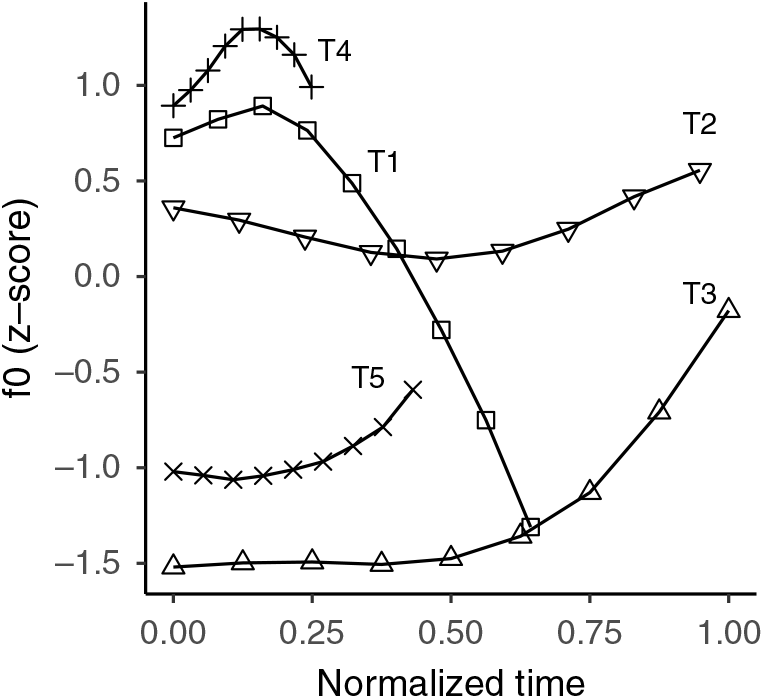
Shanghainese is a Chinese Wu dialect spoken in the urban area of Shanghai, one of the largest cities in China. Like other Wu dialects, the tonal system of Shanghainese has contrastive upper and lower registers (Yip Reference Yip1980, Duanmu Reference Duanmu1990, Bao Reference Bao1999), in addition to pitch contour contrasts. Figure 1 illustrates the f0 contours of the five tones (T1–T5) uttered in isolation by a female speaker (the first author) who was born in the 1990s. Ten different monosyllabic words were elicited for each tone. Each word was repeated three times. As illustrated in Table 1 and Figure 1, of the five tones, T1, T2 and T4 start within the relatively higher f0 range and belong to the upper register, while T3 and T5 start within the relatively lower f0 range and belong to the lower register. The tonal pairs which have contrastive registers (e.g. T2 and T3) have a similar contour shape but different pitch height (and phonation types; see the discussion in the following paragraph). T4 and T5, the so-called checked tones, are shorter in syllable duration and only occur in syllables closed by a glottal stop. Note that, strictly speaking, the transcriptions by Xu & Tang (Reference Xu and Tang1988) shown in Table 1 do not perfectly match the f0 contours plotted in Figure 1. In fact, researchers have varied greatly in the numerical values used in the transcriptions of Shanghainese tones (see Y. Chen & Gussenhoven Reference Chen and Gussenhoven2015 for a detailed review). As pointed out by Y. Chen & Gussenhoven (Reference Chen and Gussenhoven2015), the mismatches between the transcriptions and the f0 trajectories suggest that there is considerable variation in pronunciation within the speech community. Nonetheless, at a more abstract level, these transcriptions agree on the overall pitch height and contours of the tonal categories – T1 is high falling, T2 is high rising, T3 is low rising, T4 is high checked, and T5 is low checked.
Tone inventory of Shanghainese. The transcriptions in the parentheses are based on Xu & Tang (Reference Xu and Tang1988), a classic description of Shanghainese, which adopts the five-scale pitch system developed by Chao (Reference Chao1930). This system divides speakers’ pitch range into a five-point scale, with 5 indicating the highest end and 1 the lowest. Underline denotes checked tones.

f0 tracks (in z-score) of the five tones.

As noted by a number of previous studies (e.g. Chao Reference Chao1928, Cao & Maddieson Reference Cao and Maddieson1992, Y. Chen & Gussenhoven Reference Chen and Gussenhoven2015, to cite a few), the upper vs. lower register contrast is phonologically associated with the voicing contrast of the onset consonants, with phonologically voiced onsets associated with the lower register and phonologically voiceless onsets associated with the upper register. However, ‘true voicing’ (i.e. as indicated by negative Voice Onset Time (VOT)) is only realized in the intersonorant word-medial position (Cao & Maddieson Reference Cao and Maddieson1992, Z. Chen Reference Chen2010, Y. Chen Reference Chen2011, Gao & Hallé Reference Gao and Hallé2017), and the word-initial voiced obstruents of the lower register syllables are actually voiceless (Cao & Maddieson Reference Cao and Maddieson1992, Z. Chen Reference Chen2010, the exception of some fricatives was reported in Gao & Hallé Reference Gao and Hallé2017). The ‘voicing’ contrast for word-initial onsets is mainly realized by pitch and contrastive phonation on the following vowels. The upper register is produced with higher pitch and modal voice, and the lower register is produced with lower pitch and non-modal phonation. The phonetic nature of the register/voicing contrast in ChineseWu dialects is of great research importance, because it is related to the historical tonogenesis or tone split that widely happened among Chinese dialects and a number of East and Southeast Asian languages, by which the loss of voicing contrasts in syllable-initial consonants gave rise to tonal contrasts (Maspero Reference Maspero1912; Haudricourt Reference Haudricourt1954, Reference Haudricourt1961). The phonation-based register contrast is likely to be the intermediate stage or the ‘missing link’ of the tonogenesis process (Cao & Maddieson Reference Cao and Maddieson1992, Thurgood Reference Thurgood2002, Abramson, Luangthongkum & Nye Reference Abramson, Luangthongkum and Nye2004, Abramson, Nye & Luangthongkum Reference Abramson, Nye and Luangthongkum2007, Mazaudon & Michaud Reference Mazaudon and Michaud2008, Abramson & Luangthongkum Reference Abramson, Luangthongkum, Fant, Fujisaki and Shen2009).
The special phonetic characteristics of the registers were already reported in some very early documentation of Shanghainese. For example, Karlgren (Reference Karlgren1926) noted that the voiced stop onsets of Wu dialects were produced with a weak voiced aspiration (compared with Hindi), and Liu (Reference Liu1925) and Chao (Reference Chao1928) pointed out that the so-called voiced stops were actually voiceless, but that the following vowels were produced with ‘a voiced glide, usually quite aspirated, in the form of a voiced [h] ’.
Since the phonation contrast in Wu was acknowledged, much discussion has been devoted to the phonetic nature of this non-modal phonation. Among the Wu dialects, Shanghainese has received the most instrumental studies. Based on speakers born in the 1950s and 1960s, several studies showed that the word-initial syllables from upper and lower registers have contrastive phonation types. Acoustically, Cao & Maddieson (Reference Cao and Maddieson1992) and Ren (Reference Ren1992) found that measures that are correlated with relative glottal constriction – such as H1–H2 (the relative amplitude difference between the first two harmonics in the spectrum) and H1–A1 (the relative amplitude difference between the first harmonic and the most prominent harmonic around the first formant) – were higher when associated with non-modal phonation. Ladefoged & Maddieson (Reference Ladefoged and Maddieson1996) also found higher H1–A2 (the relative amplitude difference between the first harmonic and the most prominent harmonic around the second formant) for the non-modal phonation. In addition, they noted that the non-modal phonation has a greater noise component. Articulatorily, the non-modal phonation has a larger glottal opening and a later maximal glottal opening based on photoglottography data (Ren Reference Ren1988, Reference Ren1992; see also Gao et al. Reference Gao, Hallé, Honda, Maeda and Toda2011) and greater airflow (Cao & Maddieson Reference Cao and Maddieson1992, Ren Reference Ren1992). Both acoustic and articulatory evidence suggest that the non-modal phonation is relatively ‘breathier’, which is generally associated with a larger glottal aperture and less glottal constriction (Ladefoged Reference Ladefoged1971, Gordon & Ladefoged Reference Gordon and Ladefoged2001, Edmondson & Esling Reference Edmondson and Esling2006).
However, voice study tools were still under-developed at the time of these early studies, so they were inevitably subject to some limitations. For example, the earlier acoustic studies on Shanghainese phonation involved very few words or tokens (e.g. 18 isolated words, each read once in Cao & Maddieson Reference Cao and Maddieson1992; 5 words embedded in two short carrier sentences in Ren Reference Ren1992) and very few speakers (e.g. four speakers in Cao & Maddieson Reference Cao and Maddieson1992 and Ren Reference Ren1992). Moreover, since the spectral measures (e.g. H1–H2, H1–A1) used in the earlier studies were not corrected for the influence of formants, those values could not be used to compare the phonation properties across different vowels and speakers (Hanson Reference Hanson1997, Iseli, Shue & Alwan Reference Iseli, Shue and Alwan2007). Therefore, the syllables examined in the earlier studies had to be limited to low vowels (usually /a/), and cross-linguistic comparisons were not reliable. Because of these technical limitations, the phonetic properties of the non-modal phonation in Shanghainese were not comprehensively understood.
Our understanding of phonation contrasts, along with the tools for extensive voice analysis, have greatly advanced during the last decade. Recently, the phonetic properties of the Shanghainese register contrast have been revisited in several studies (Gao Reference Gao2016, Tian & Kuang Reference Tian, Kuang, DiCanio, Malins, Good, Michelson, Jaeger and Keily2016, Gao & Hallé Reference Gao and Hallé2017, J. Zhang & Yan Reference Zhang and Yan2018) with mostly younger speakers (born after 1980). Extensive acoustic and electroglottographic (EGG hereafter) measures were examined using computer programs such as VoiceSauce (Shue et al. Reference Shue, Keating, Vicenik and Yu2011) and EggWorks (Tehrani Reference Tehrani2010). However, all of these studies found that younger speakers no longer produce distinct phonation types for the register contrast, and that the two registers differ mainly in f0. This suggests that a sound change has happened in Shanghainese in the last 30 years. The sound change could be triggered by at least two factors. The first is related to the functional load. Given that the Shanghainese tonal inventory is relatively small (five tones) compared with other more conservative Wu varieties (seven or eight tones), phonation cues became somewhat redundant. The second factor relates to usage. Younger speakers tend to speak Mandarin more often, and Gao (Reference Gao2016) suggests that Shanghainese speakers who speak Mandarin more frequently and fluently tend to lose the phonation contrast. In any event, older speakers’ production should be examined in order to understand the phonetic properties of the Shanghainese phonation contrast.
Moreover, although existing studies of older speakers’ production (including the more recent Tian & Kuang Reference Tian, Kuang, DiCanio, Malins, Good, Michelson, Jaeger and Keily2016 and Gao & Hallé Reference Gao and Hallé2017) suggest that the non-modal phonation in Shanghainese is generally breathier (i.e. produced with relatively less glottal constriction), it remains unclear whether this breathier voice in Shanghainese is similar to or different from the breathier voices in other languages. As noted by previous studies, there is substantial cross-linguistic variation in the so-called ‘breathier voice’. Particularly, three major subtypes have been recognized, namely, slack/lax voice, breathy voice and whispery voice; distinct IPA symbols (Ball, Esling & Dickson Reference Ball, Esling and Craig Dickson2018) have been proposed to transcribe these three types of ‘breathier voice’. For example, the ‘breathier voice’ in Chong, Gujarati, Hindi, Sindhi, and Jalapa Mazatec were classified as ‘breathy voice’, and the ‘breathier voice’ in Jingpho, Javanese, Yi, Wa, and Mpi were classified as ‘slack/lax voice’ by Ladefoged & Maddieson (Reference Ladefoged and Maddieson1996) and Gordon & Ladefoged (Reference Gordon and Ladefoged2001). Whispery voice is relatively less documented among languages, but the ‘breathier voice’ in Tamang, Zhenhai, and Mon were considered to be whispery voice (Rose Reference Rose1989, Mazaudon & Michaud Reference Mazaudon and Michaud2008, Michaud Reference Michaud, Nau, Stolz and Stroh2012).
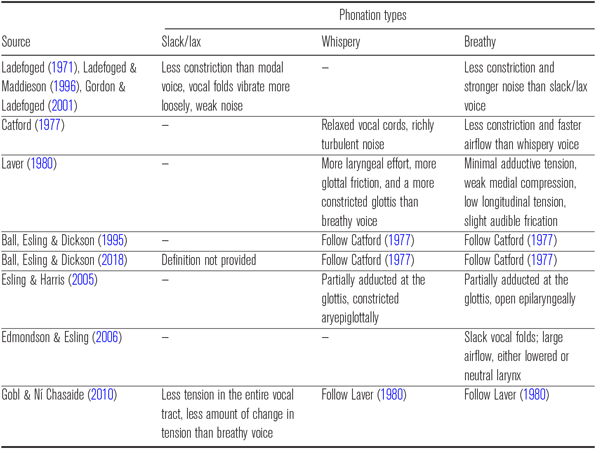
However, although studies generally agreed on the existence of different types of ‘breathier voice’ cross-linguistically, the categorization of the subtypes is highly controversial. As summarized in Table 2, it is not clear how many subtypes should be categorized, and the boundaries between the subcategories are not well defined. For example, Ladefoged (Reference Ladefoged1971) does not distinguish between whispery voice and breathy voice, and Catford (Reference Catford1977) does not distinguish between whispery voice and lax voice. Because of the ambiguity in categorization, studies usually just ignore the cross-linguistic variation and assume ‘breathier voice’ as a general category. As one of its goals, this study aims to provide some insight into the cross-linguistic variation in the phonetic realization of ‘breathier voice’.
A summary of the subtypes of ‘breathier voice’.

Generalizing across different studies (e.g. Ladefoged Reference Ladefoged1971, Catford Reference Catford1977, Laver Reference Laver1980, Ladefoged & Maddieson Reference Ladefoged and Maddieson1996, Esling & Harris Reference Esling, Harris, Hardcastle and Beck2005, Gobl & Ní Chasaide Reference Gobl, Chasaide, Hardcastle, Laver and Gibbon2010), the three subtypes can be defined as follows: (i) compared with modal voice, slack/lax voice is produced mainly with less medial compression tension in the vocal folds, and the arytenoid cartilages are not drawn apart as they are in breathy voice, so the turbulence noise from the glottis is relatively minor; (ii) breathy voice, by contrast, is produced with a considerable glottal aperture, as the arytenoid cartilages are drawn apart, and the noise component is relatively strong; and (iii) whispery voice differs from both breathy voice and slack/lax voice in that it is produced with a substantial amount of aperiodic noise while maintaining a high degree of medial compression (i.e. more constricted than breathy voice, but still less constricted than modal voice). Therefore, these different subtypes of ‘breathier voice’ essentially differ in the relative importance of glottal constriction and the noise component. This view also makes it possible to quantify the cross-linguistic phonetic variation of ‘breathier voice’.
As for the subtype of ‘breathier voice’ in Shanghainese, some tentative conclusions have been drawn based on qualitative inspections of the voice spectra, although the consensus is still lacking. For example, Ladefoged & Maddieson (Reference Ladefoged and Maddieson1996) suggested that the term ‘slack voice’ should be used to describe the non-modal phonation in Shanghainese because the noise component of the non-modal phonation did not seem to be very strong. However, Rose (Reference Rose1989, Reference Rose2015) suggested that ‘whispery voice’ was a more proper categorization for the non-modal phonation of the lower register in Zhenhai, a closely related Wu dialect. Acoustically, since the vocal folds are quite constricted for this non-modal phonation, the relative amplitude difference between the first harmonic and the first formant (H1–A1) was not necessarily greater, although there was a substantial amount of aperiodic noise. Rose (Reference Rose1989, Reference Rose2015) also reported that some speakers even used ‘harsh voice’, a phonation type with extreme glottal (and pharyngeal) constriction and substantial aperiodic noise.
Therefore, to better understand the phonetic properties of the non-modal phonation in Shanghainese, and to provide insight into the cross-linguistic variation of ‘breathier voice’, it is important to examine the phonetic correlates of both the degree of glottal constriction and the noise component. Most previous studies focused on the measurements related to glottal constriction (e.g. spectral tilt), but devoted less attention to the noise measures. However, the relative contribution of these two aspects is key to our understanding of which subtype the non-modal phonation in Shanghainese belongs to. Specifically, if the phonetic correlates related to glottal constriction such as spectral tilt are of great importance, but the contribution of noise is almost negligible, then the non-modal phonation should be categorized as slack/lax voice. If both measures of glottal constriction and noise play important roles, and measures of glottal constriction make a greater contribution, then the non-modal phonation should be categorized as breathy voice. Finally, whispery voice should be used to describe the non-modal phonation in Shanghainese if both measures of glottal constriction and noise are found to make important contributions, with noise components being more dominant. This question can be further settled by comparing the acoustic and articulatory characteristics of the non-modal phonation in Shanghainese with those in other languages, such as the typical ‘slack’ or ‘lax’ phonation in Yi languages (Kuang & Keating Reference Kuang and Keating2014), where the noise component does not play much of a role in distinguishing phonation contrasts, as well as languages with typical ‘breathy’ voice such as Gujarati (Khan Reference Khan2012) and White Hmong (Esposito Reference Esposito2012) where the noise component plays an important role in the distinction of the phonation contrast. Therefore, to fully understand the phonetic properties of the non-modal phonation in Shanghainese, it is necessary to compare Shanghainese with other languages with similar phonation types.
To summarize, this study aims to examine the acoustic and articulatory characteristics of the non-modal phonation associated with the lower register in Shanghainese based on the production of older speakers. This study is by far the largest on the phonetic properties of Shanghainese non-modal phonation. A relatively large number of speakers (52) were included in this study, and the age range of the speakers overlaps with both Cao & Maddieson (Reference Cao and Maddieson1992) and Ren (Reference Ren1992), with several speakers born in as early as the 1930s and 1940s. The phonetic properties of Shanghainese non-modal phonation were further compared with several languages with similar phonation types. We believe that our study will contribute to the existing knowledge of the non-modal phonation of Shanghainese in two ways: (i) by providing a better understanding of the contribution of glottal constriction and noise cues to the phonetic realization of the non-modal phonation in Shanghainese, and (ii) by evaluating whether Shanghainese non-modal phonation shows any special properties compared with similar phonation types in other languages.
2 Method
2.1 Speakers
Fifty-two native Shanghainese speakers born before 1980 were recruited in the city of Shanghai in the summer of 2016. Speakers born before 1980 were chosen because previous studies suggest they still produce the non-modal phonation (Tian & Kuang Reference Tian, Kuang, DiCanio, Malins, Good, Michelson, Jaeger and Keily2016). Speakers ranged from 38 to 80 years of age when the recordings were made. All speakers spoke Mandarin in addition to Shanghainese. Table 3 summarizes the birth year and gender of the speakers. Acoustic recordings were obtained from all speakers, but EGG signals were only obtained from some of the speakers. The numbers in the parentheses represent the number of speakers from whom both acoustic and EGG signals were collected.
Birth year and gender of speakers in the current study. The numbers in the parentheses represent the number of speakers from whom both acoustic and EGG signals were collected.

2.2 Speech materials
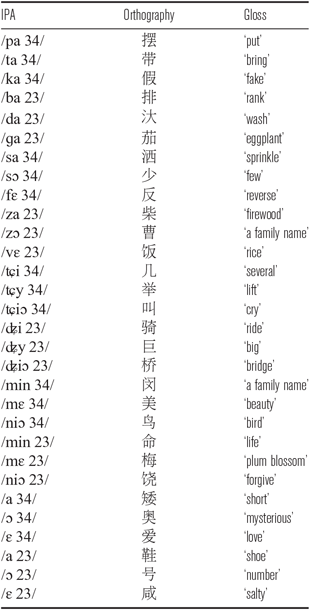
The wordlist used in this study includes fifteen minimal pairs of words that contain either T2 or T3, the tonal pairs with contrastive registers (see Table 1). All words were monosyllabic and contained onsets of one of five manners of articulation: stop, fricative, affricate, nasal, and zero (i.e. onsetless syllables). Aspirated consonant onsets were avoided because they do not co-occur with T3. Laterals were not included because they do not co-occur with T2. The wordlist is given in Table A1 in the appendix.
2.3 Procedure
Audio recordings were made for all 52 speakers. For 22 of them, simultaneous audio and EGG recordings were made. Recordings were made in a quiet room. Speakers were given a wordlist printed in Chinese characters on a piece of paper. Each speaker read the test materials in the order shown in Table A1. During the recording, speakers repeated the word whenever they made a mistake, as judged by the first author, a native speaker of Shanghainese. The sampling rate was 44.1 kHz. The audio signal, from a head-mounted Shure SM10A dynamic microphone, was the first channel of the recordings. The EGG signal, from a Glottal Enterprises two-channel electroglottograph (Model EG2), was the second channel. Since we noticed that speakers tended to apply tone sandhi to the repetition, speakers were asked to read each word only once.
2.4 Measures
The target vowel of each word was labeled in Praat (Boersma & Weenink Reference Boersma and Weenink2018). Acoustic and EGG measures were taken automatically using VoiceSauce (Shue et al. Reference Shue, Keating, Vicenik and Yu2011) and EggWorks (Tehrani Reference Tehrani2010), respectively, using the default settings. VoiceSauce computes harmonic magnitudes pitch-synchronously over a three-pitch period window.
As reviewed in the introduction, ‘breathy’ type phonation is related to the relative extent of glottal constriction and the presence of noise in the signal, so two sets of phonetic measures were included to examine both aspects. On the one hand, both EGG and acoustic measures were utilized to measure the relative extent of glottal constriction. Acoustically, the relatively less constricted glottis results in a glottal waveform with greater low-frequency and weaker high-frequency components, which can be quantified by various spectral tilt measures. H1–H2, H1–A1, H1–A2, H1–A3, the strength of the first harmonic relative to some higher frequency components (i.e. H2, the second harmonic, and A1, A2 and A3, the most prominent harmonic around the first three formants) were measured. These measures are thought to correlate with different aspects of glottal constriction. For example, it has been proposed that H1–H2 is physiologically related to how open the vocal folds are when they vibrate, as well as their medial thickness (Kreiman et al. Reference Kreiman, Iseli, Neubauer, Shue, Gerratt and Alwan2008, Samlan, Story & Bunton Reference Samlan, Story and Bunton2013, Z. Zhang Reference Zhang2016); H1–A1 is related to posterior glottal opening at the arytenoids (Hanson et al. Reference Hanson, Stevens, Kuo, Chen and Slifka2001); and H1–A2 and H1–A3 are correlated with the abruptness of vocal fold closure (Stevens Reference Stevens1977, Holmberg et al. Reference Holmberg, Hillman, Perkell, Guiod and Goldman1995, Hanson et al. Reference Hanson, Stevens, Kuo, Chen and Slifka2001, Cho, Jun & Ladefoged Reference Cho, Jun and Ladefoged2002). However, languages often use more than one of these measures to distinguish phonation contrasts. For example, Jalapa Mazatec (Blankenship Reference Blankenship2002, Garellek & Keating Reference Garellek and Keating2011), Chanthaburi Khmer (Wayland & Jongman Reference Wayland and Jongman2003), Southern Yi (Kuang & Keating Reference Kuang and Keating2014), White Hmong (Esposito Reference Esposito2012, Garellek Reference Garellek2012), Gujarati (Khan Reference Khan2012, Nara Reference Nara2017), Marathi (Berkson Reference Berkson2019), Mon (Abramson, Tiede & Luangthongkum Reference Abramson, Tiede and Luangthongkum2015), Madurese (Misnadin, Kirby & Remijsen Reference Misnadin and Remijsen2015), Cao Bằng (Pittayaporn & Kirby Reference Pittayaporn and Kirby2017) and Chichimeco (Kelterer Reference Kelterer2017). We also include other spectral tilt measures that are perceptually salient in the psychoacoustic experiments (Kreiman et al. Reference Kreiman, Gerratt, Garellek, Samlan and Zhang2014, Garellek et al. Reference Garellek, Samlan, Gerratt and Kreiman2016), as these measures are potentially important in production as well. These include H2–H4, the difference between the amplitude of the second harmonic and the fourth harmonic, H4–H2K, the difference between the amplitude of the fourth harmonic and the harmonic closest to 2000 Hz, and H2K–H5K, the difference between the amplitude of the harmonic closest to 2000 Hz and the one closest to 5000 Hz. All spectral measures were corrected for formant frequencies, using the correction algorithm in Iseli et al. (Reference Iseli, Shue and Alwan2007). Corrected measures are written with asterisks (e.g. H1*−H2*, H1*−A1*, etc.). These corrections make measurements on all vowels accurate and cross-linguistic comparisons possible.
Articulatorily, the relative glottal constriction can be captured by various EGG measures (Baken & Orlikoff Reference Baken and Orlikoff2000). The most important EGG measure is Contact Quotient (CQ), defined as the ratio of the duration of the contact phase to the period of the vibratory cycle (Rothenberg & Mashie Reference Rothenberg and Mashie1988). Greater CQ indicates greater glottal constriction. CQ is a reliable EGG measure for many languages (e.g. Guion, Post & Payne Reference Guion, Post and Payne2004 on Maa, Mazaudon & Michaud Reference Mazaudon and Michaud2008 on Tamang, DiCanio Reference DiCanio2009 on Takhian Thong Chong, Avelino Reference Avelino2010 on Yalálag Zapotec, Khan Reference Khan2012 on Gujarati, Esposito Reference Esposito2012 on White Hmong, Kuang & Keating Reference Kuang and Keating2014 on Yi, Abramson et al. Reference Abramson, Tiede and Luangthongkum2015 on Mon). The CQ_HT method in EggWorks was used for estimating CQ. This method uses the dEGG contacting peak to detect the contacting moment, and takes the y-value of the dEGG contacting peak as the decontacting event. This method was chosen because it more accurately distinguishes the different phonation types in both genders, especially for female speakers. Other methods, such as CQ_H (a hybrid method by Howard Reference Howard1995), CQ (a threshold method by Rothenberg & Mashie Reference Rothenberg and Mashie1988) and CQ_PM (a dEGG based method by Henrich et al. Reference Henrich, d’Alessandro, Doval and Castellengo2004), were less effective in distinguishing the contrastive phonation types for female speakers.
We also included another potentially important parameter of vocal fold vibration, Derivative-EGG Closure Peak Amplitude (DECPA), introduced by Michaud (Reference Michaud, Bel and Marlien2004). It is defined as the amplitude of the positive peak in the first derivative of the EGG signal. DECPA is also known as Peak Increase in Contact (PIC) in the literature (Keating et al. Reference Keating, Esposito, Garellek, Khan and Kuang2010, Kuang Reference Kuang2013, Kuang & Keating Reference Kuang and Keating2014). This measure successfully distinguishes contrastive phonation types in several languages (Esposito Reference Esposito2012, Kuang & Keating Reference Kuang and Keating2014), and the breathier phonation was found to have a higher PIC value. Finally, Speed Quotient (SQ; Holmberg, Hillman & Perkell Reference Holmberg, Hillman and Perkell1988, Dromey, Stathopoulos & Sapienza Reference Dromey, Stathopoulos and Sapienza1992), defined as the ratio between contacting and decontacting duration, was also included. SQ is a measure of the symmetry of the glottal pulses. Breathier phonation pulses, with similar contacting and decontacting durations, show a more symmetrical shape. The skewness of EGG signals was found to be a useful indicator of phonation types in several Yi languages (Kuang & Keating Reference Kuang and Keating2014). In this study, contacting duration and decontacting duration are measured at 10% and 90% thresholds. 10% above the minimum value of each cycle is used to decide the beginning of the contacting duration and the end of the decontacting duration, and 90% above the minimum value of each cycle is used to decide the end of the contacting duration and the beginning of the decontacting duration. SQ is computed as the ratio between these durations.
On the other hand, the less constricted glottis also increases the chance for glottal air turbulence, which can be quantified by different measures of vocal aperiodicity and spectral noise levels (see Buder Reference Buder, Kent and Ball2000 for a detailed review). Two noise measures, harmonics-to-noise ratio (HNR, de Krom Reference de Krom1993) and cepstral peak prominence (CPP, Hillenbrand, Cleveland & Erickson Reference Hillenbrand, Cleveland and Erickson1994) were included. The HNR measurements were found by liftering the pitch component of the cepstrum and comparing the energy of the harmonics with the noise floor. Cepstral Peak Prominence is thought to reflect the harmonics-to-noise ratio as well, but it differs in how the prominence of the cepstral peak is calculated, i.e. it is taken as the difference in amplitude of the cepstral peak and a regression line used to normalize for window size and overall energy.We included both measures in the current study because previous literature suggests that noise interacts with harmonic components in different frequency bands in distinct ways (Kreiman & Gerratt Reference Kreiman and Gerratt2012, Garellek et al. Reference Garellek, Samlan, Gerratt and Kreiman2016). By examining HNR calculated in four different frequency bands of the spectrum (0–500 Hz, 0–1500 Hz, 0–2500 Hz, and 0–3500 Hz) and CPP calculated in the entire frequency range, we are able to reveal a full picture of the noise component. Both measures are predicted to be lower in breathier phonation than in modal phonation. HNR and/or CPP are useful for distinguishing phonation contrasts in many languages, including Chong (Blankenship Reference Blankenship2002), Jalapa Mazatec (Blankenship Reference Blankenship2002, Garellek & Keating Reference Garellek and Keating2011), Ju|’hoansi (Miller Reference Miller2007), Southern Yi (Kuang Reference Kuang2011), White Hmong (Esposito Reference Esposito2012), Gujarati (Khan Reference Khan2012, Nara Reference Nara2017), Marathi (Berkson Reference Berkson2019), Mon (Abramson et al. Reference Abramson, Tiede and Luangthongkum2015), Chichimeco (Kelterer Reference Kelterer2017) and Semarang Javanese (Seyfarth, Vander Klok & Garellek Reference Seyfarth, Klok and Garellek2017).
VoiceSauce combined the acoustic and EGG measurements, averaged the results by thirds of the duration and output the values in a text file. Within-speaker z-score normalization based on each speaker’s mean value was performed on each measure. To exclude probable measurement errors, measurements that were greater than 3 standard deviations from each speaker’s mean were removed. In sum, a total of 1347 tokens were examined in the acoustic analysis. A total of 642 tokens were examined in the EGG analysis.
2.5 Statistical analysis
In order to examine which voice measures are able to successfully distinguish different phonation types, a series of linear mixed effects models with Satterthwaite approximation were fit for each measure, using the lmerTest package (Kuznetsova, Brockhoff & Christensen Reference Kuznetsova, Brockhoff and Christensen2017) in R (R Core Team 2018). The values from the time interval that best distinguishes the phonation types were used for the statistical analysis. More specifically, for spectral measures, the first third interval was used, while for the noise measures, the middle third interval was used (see Figure 2 and Figure 4 below). Forward stepwise model selection was conducted. The baseline model only contained a random intercept for speaker, or a random intercept for word, if the model that only contains a random intercept for speaker showed singular fit. The other random intercept, fixed effects (i.e. phonation, gender, and manner), and their interactions (i.e. phonation:gender, phonation:manner, gender:manner, and phonation:gender:manner) were added to the model in a stepwise manner and tested by comparing the log likelihood ratio to that of the simpler model. Only effects that significantly improved the model fit (p < .05) were retained. Random slopes were tested after the fixed effects were established. Each random slope (i.e. by-speaker random slopes for phonation and manner and a by-word random slope for gender) was added in a stepwise manner and tested for each of the significant fixed effects. Models that failed to converge or showed singular fit were excluded. Outputs of the best-fit models can be found in Tables A2 to A11 in the appendix. Here, we are primarily interested in the main effect of phonation and its interactions with other factors. We used the anova function in R to test the main effects (rather than simple effects) of the factors. This method is not affected by how factors are coded.
3 Results
3.1 Spectral measures
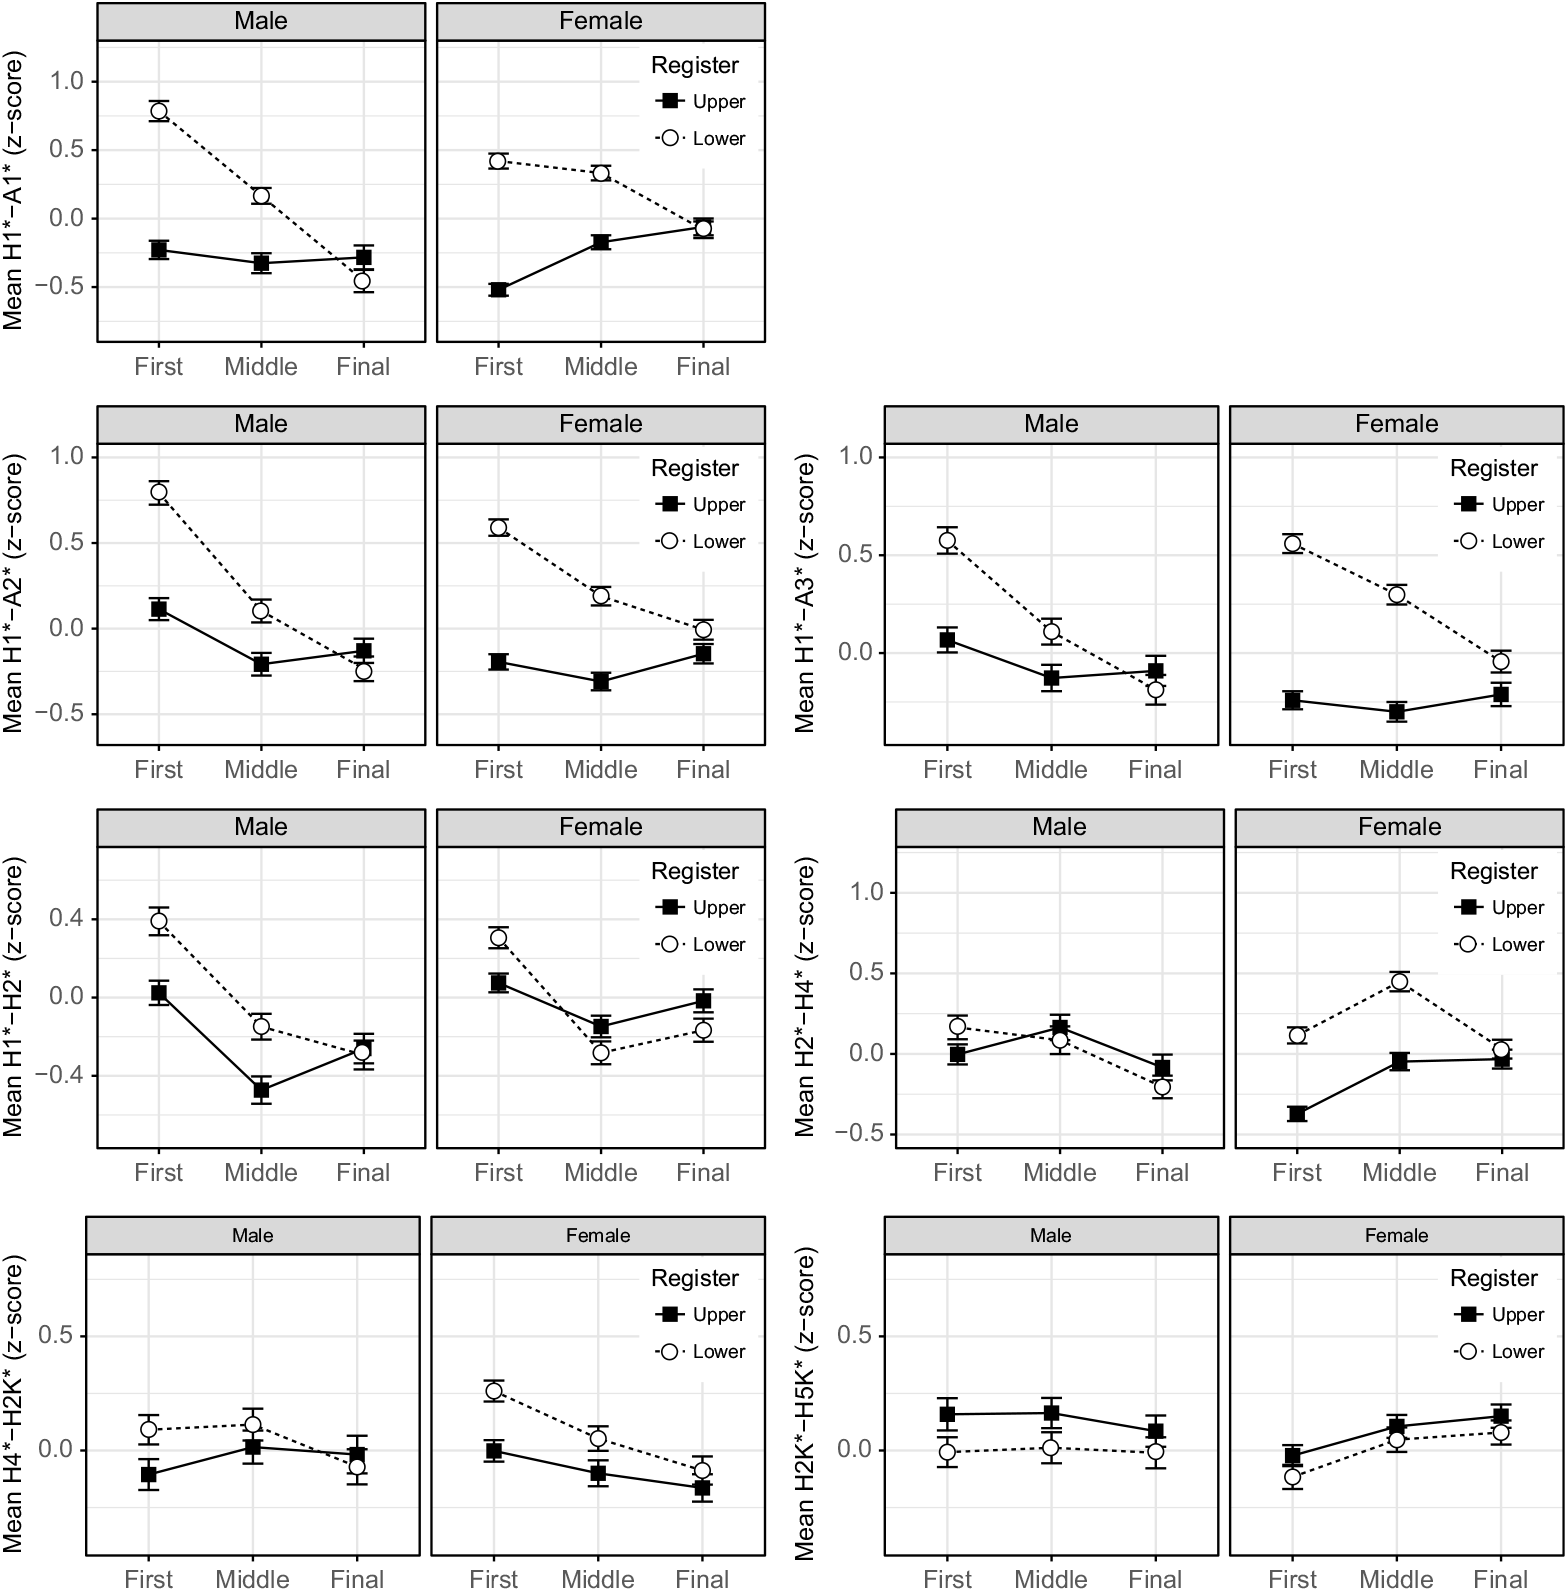
The relative amplitude differences between the fundamental frequency (first harmonic) and the most prominent harmonics around the first three formants (i.e. H1*−A1*, H1*−A2*, and H1*−A3*) are found to be reliable measures for the phonation contrast. As shown in Figure 2, a significant phonation effect is found for H1*−A1* (F(1,24) = 48.519, p <. 001), H1*−A2* (F(1,25) = 6.296, p < .05) and H1*−A3* (F(1,24) = 9.246, p < .05), with greater values in the non-modal phonation associated with the lower register. Moreover, the interactions of phonation with other fixed effects (i.e. phonation:gender, phonation:manner and phonation:gender:manner) are not significant (p > .05), suggesting that in general the effect of phonation on spectral tilt does not vary significantly across gender or manner.
Spectral measures by register and gender, in vowel thirds (error bars represent standard error of the mean). The non-modal phonation is associated with the lower register.

Although the spectral measures relative to the most prominent harmonics around formants successfully distinguish different phonation types, including phonation into the model does not improve model fit for other spectral measures (H1*−H2*: χ2 = 2.75, df = 1, p = .097; H2*−H4*: χ2 = 3.08, df = 1, p = .079; H4*−H2K*:, χ2 = 0.82, df = 1, p = .365; H2K*−H5K*: χ2 = 0.29, df = 1, p = .591). This indicates that these four measures are not reliable in distinguishing the phonation contrast. The H1*−H2* result is different from Cao & Maddieson (Reference Cao and Maddieson1992), Ren (Reference Ren1992) and Gao & Hallé (Reference Gao and Hallé2017), where H1−H2 was found to be a successful measure of the phonation contrast in Shanghainese. The possible reason will be addressed in the discussion section.
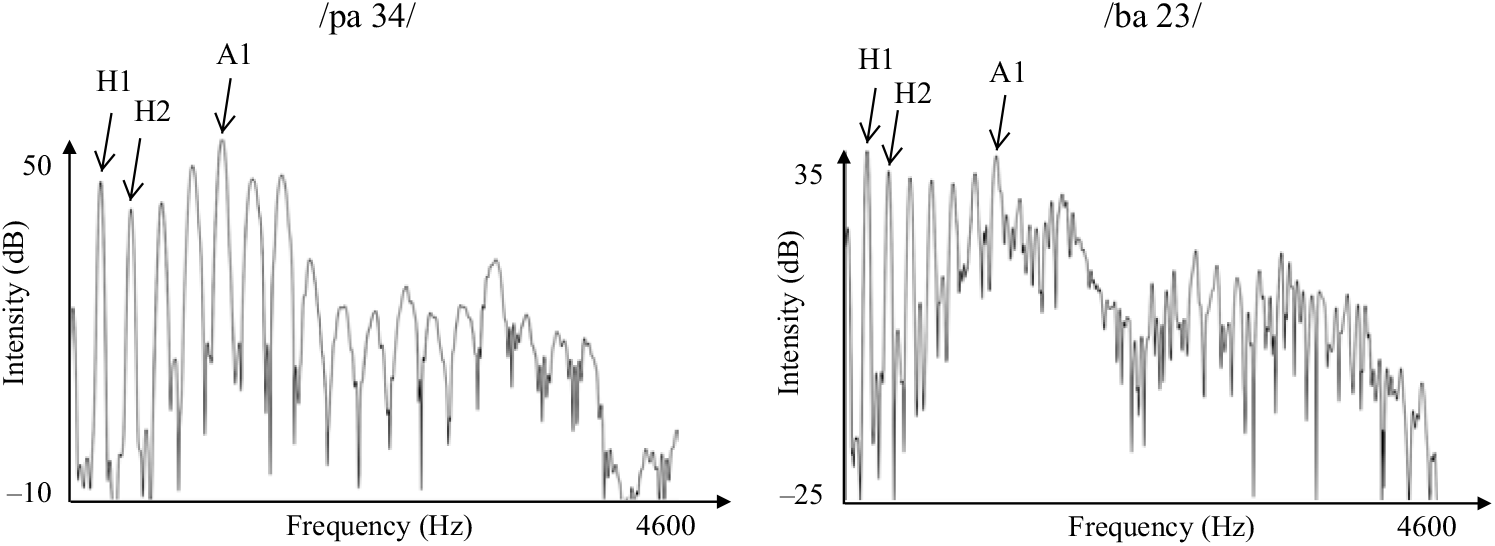
In summary, among all spectral measures, only those relative to the most prominent harmonics around formants (i.e. H1*−A1*, H1*−A2*, and H1*−A3*) are reliable measures for the phonation contrast. The spectral property of the phonation contrast can be understood in Figure 3, which shows the FFT spectra for a minimal pair produced by a female speaker born in 1971 (speaker 126), taken over the first one-third interval of the vowel. As shown in Figure 3, there is very little H1*−H2* difference between the two phonation types. However, the two phonation types were well distinguished by measures such as H1*−A1*. Audio files of these two words are provided as part of the supplementary materials.
FFT spectra of upper register /pa 34/ ‘put’ (left) and lower register /ba 23/ ‘rank’ (right) produced by a female speaker born in 1971 (speaker 126), showing that the amplitude difference between the first two harmonics (H1*−H2*) fails to distinguish between different phonation types, but the relative amplitude difference between the first harmonic and the most prominent harmonic around the first formant (H1*−A1*) successfully captures the difference. Audio files of these two words are provided as part of the supplementary materials.

3.2 Periodicity and noise measures (HNRs and CPP)
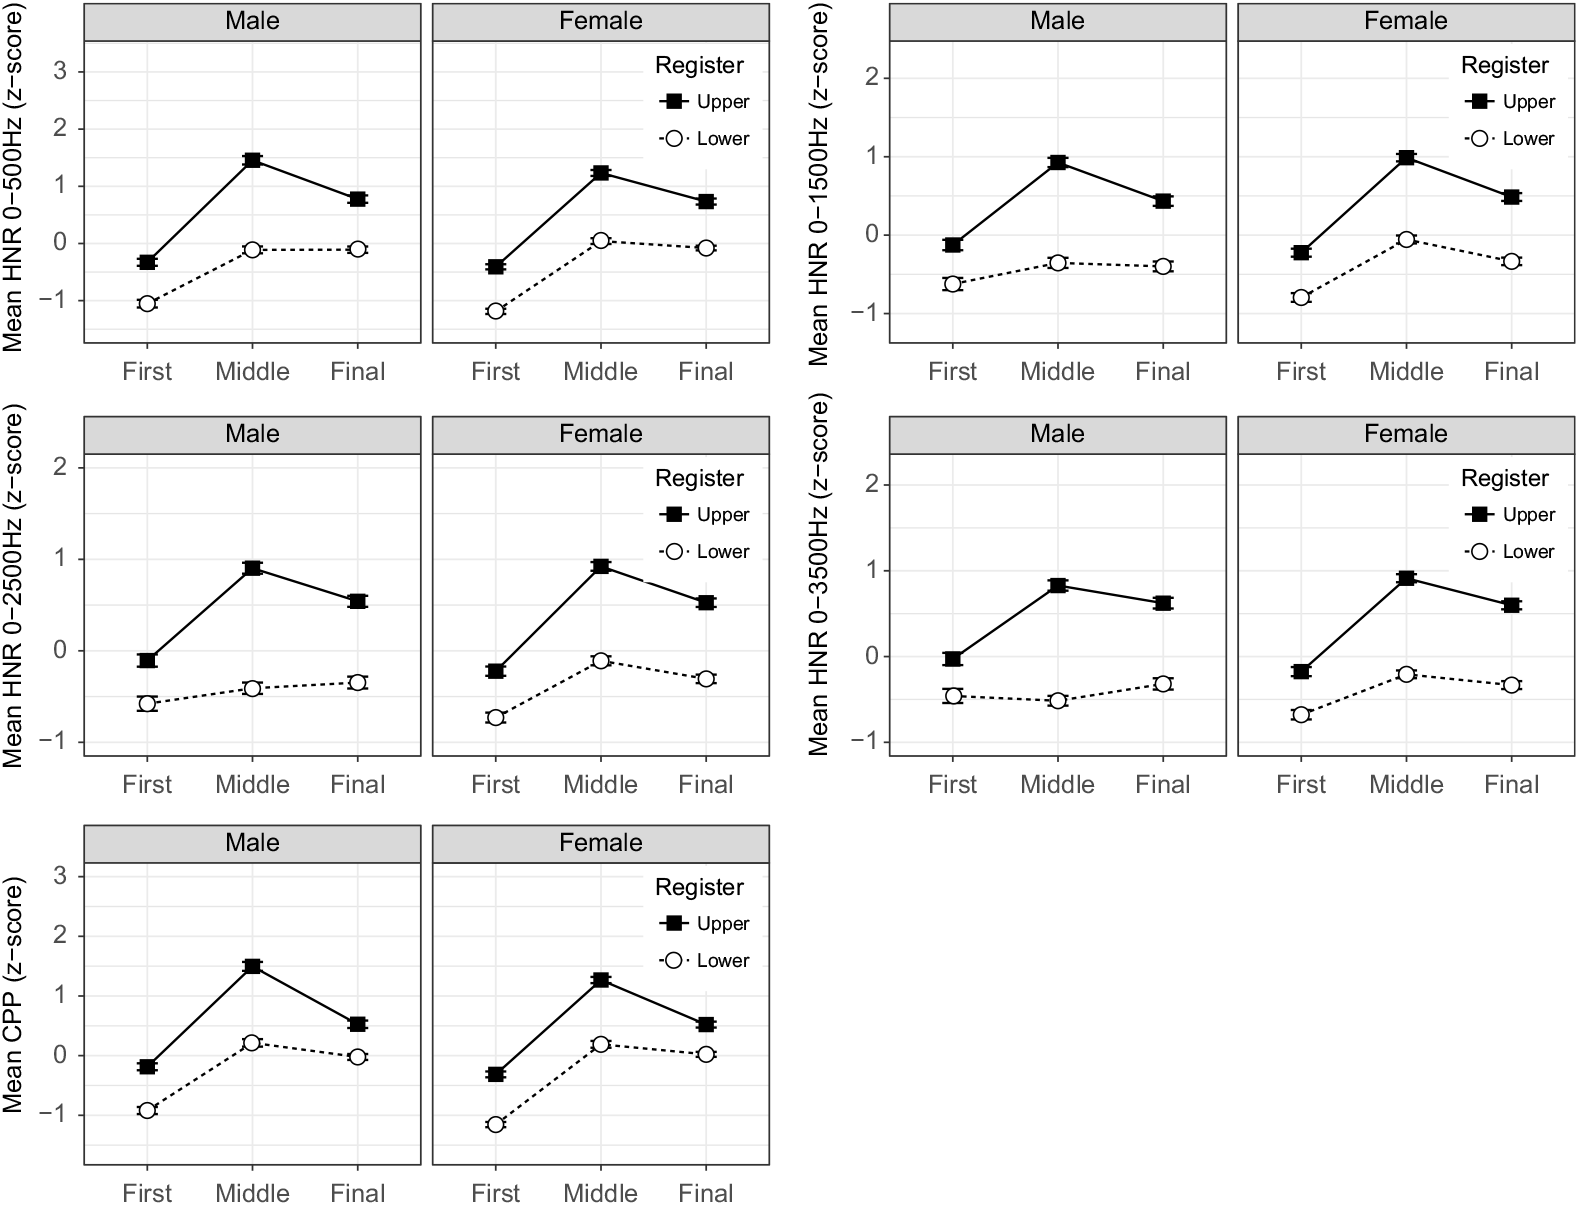
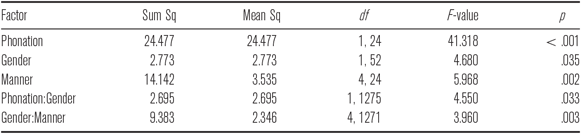
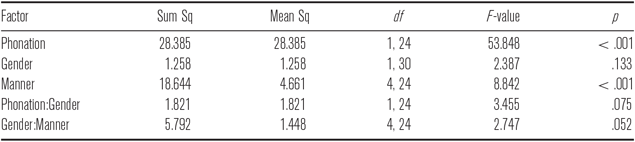
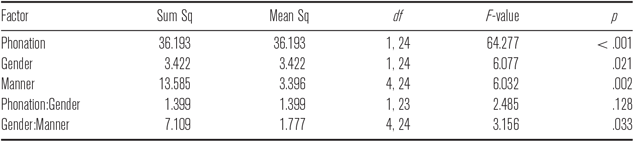
All periodicity and noise measures are found to be reliable measures for the phonation contrast. As shown in Figure 4, the two phonation types are well distinguished by HNR measured in four ranges (0−500 Hz, 0−1500 Hz, 0−2500 Hz, 0−3500 Hz) and CPP in all three intervals, with the middle third exhibiting the largest difference. As expected, the main effects of phonation were highly significant in all measures (HNR 0−500 Hz: F(1,32) = 73.334, p < .001; HNR 0−1500 Hz: F(1,24) = 41.318, p < .001; HNR 0−2500 Hz: F(1,24) = 53.848, p < .001; HNR 0–3500 Hz: F(1,24) = 64.277, p < .001; CPP: F(1,33) = 46.465, p < .001), and the non-modal phonation associated with the lower register shows lower values. Moreover, the interactions of phonation with other fixed effects are generally not significant (p > .05), and only a significant phonation by gender interaction is found for HNR under 1500 Hz (slightly larger difference for males, F(1,1275) = 4.55, p < .05), suggesting that in general the effect of phonation on periodicity and noise does not vary significantly across gender or manner.
Periodicity and noise measures by register and gender, in vowel thirds (error bars represent standard error of the mean). The non-modal phonation is associated with the lower register.

3.3 Articulatory measures
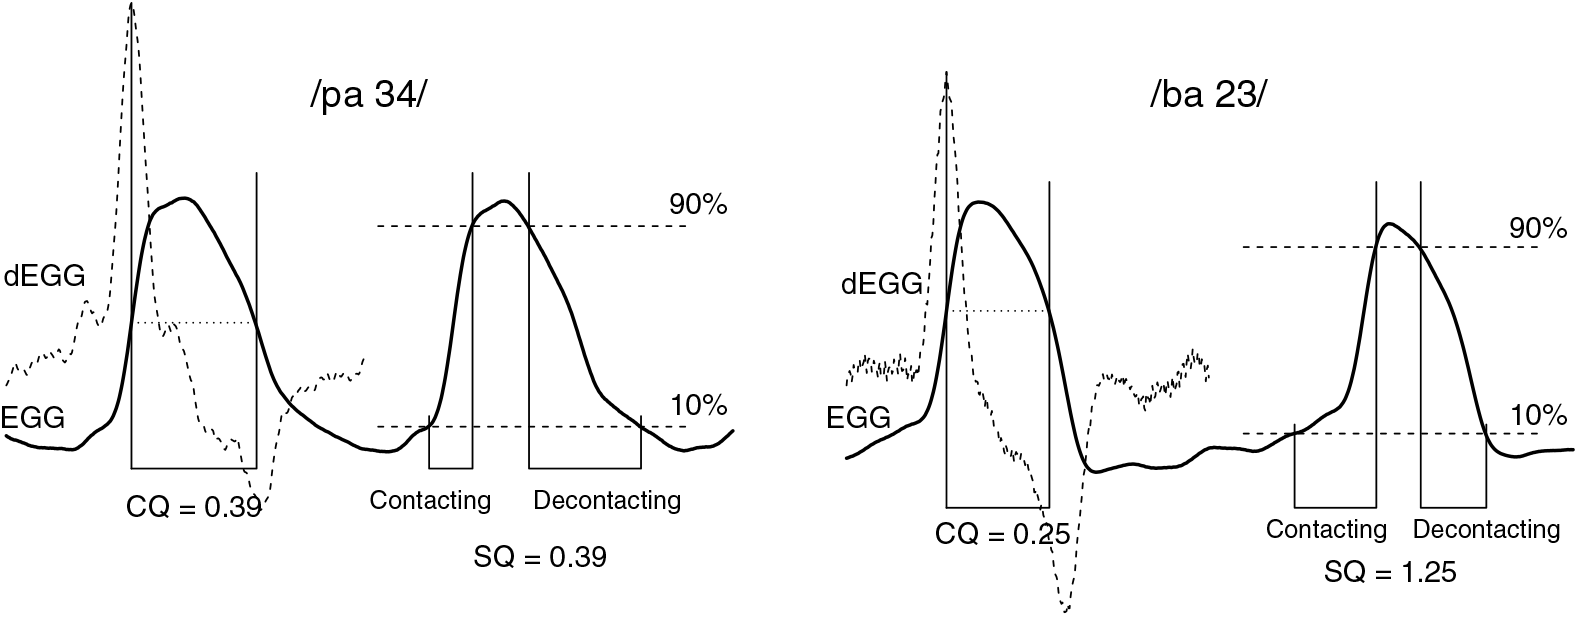
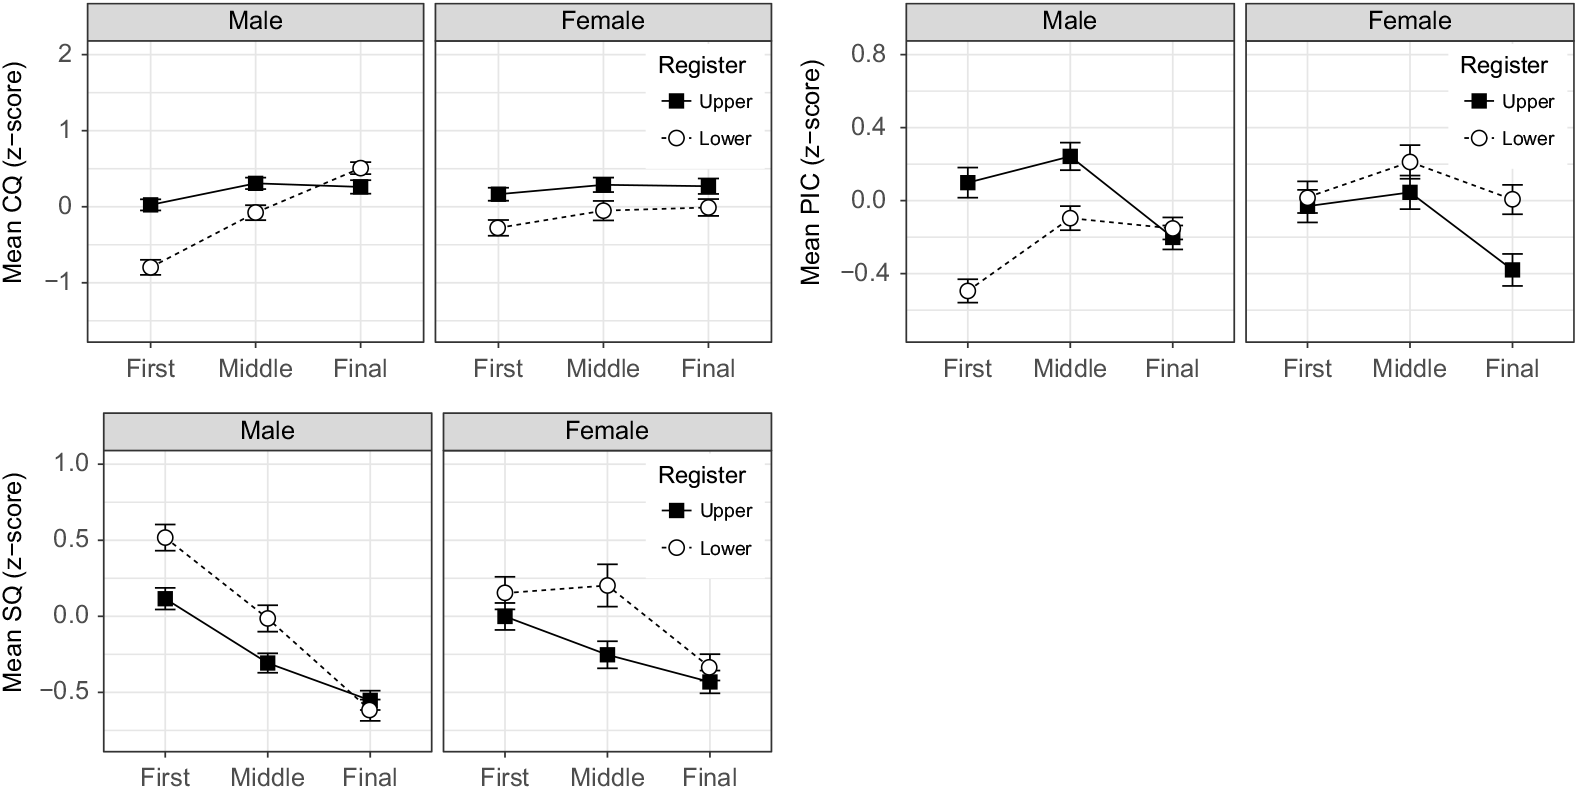
Figure 5 shows the EGG signals for upper register /pa 34/ ‘put’ and lower register /ba 23/ ‘rank’ produced by a male speaker born in 1948 (speaker 82). Audio and EGG files of these two words are provided as part of the supplementary materials. As shown in Figure 5, the two phonation types differ substantially in shape. The non-modal phonation associated with the lower register shows less contact phase and a more symmetrical shape, which can be characterized by CQ and SQ. Among the three articulatory measures, significant main effects of phonation are found for CQ (F(1,27) = 35.529, p < .001) and SQ (F(1,22) = 5.63, p < .05), but not for PIC (χ2 = 2.57, df = 1, p = .109). The non-modal phonation associated with the lower register has less glottal constriction (i.e. smaller CQ) and more symmetrical glottal pulses (i.e. greater SQ). There is a significant phonation by gender interaction for CQ (F(1,606) = 4.823, p < .05). As shown in Figure 6, female speakers show much smaller CQ differences compared with male speakers.
EGG signals for upper register /pa 34/ ‘put’ (left) and lower register /ba 23/ ‘rank’ (right), produced by a male speaker born in 1948 (speaker 82), showing less contact phase (lower CQ) and a more symmetrical EGG signal in the lower register. Audio and EGG files of these two words are provided as part of the supplementary materials.

EGG measures by register and gender, in vowel thirds (error bars represent standard error of the mean). The non-modal phonation is associated with the lower register.

3.4 Relative contributions of acoustic correlates
In previous sections, we confirmed that the non-modal phonation in Shanghainese is associated with a less constricted glottis and greater aperiodic noise. Therefore, the non-modal phonation in Shanghainese can be loosely categorized as ‘breathier’ voice. In this section, we determine which subtype of ‘breathier’ voice it is by testing the relative importance of spectral tilt and noise measures. Linear Discriminant Analysis (LDA), a procedure that determines the relative importance of different cues between two or more groups (Duda, Hart & Stork Reference Duda, Hart and Stork2001), was conducted in R using the lda function from the MASS package (Venables & Ripley Reference Venables and Ripley2002). This method was chosen because it works better than logistic regression when the predictors are highly correlated with each other (like in our case, where all the spectral tilt measures are highly correlated). This method has been found to be effective in evaluating the relative importance of different acoustic cues in various linguistic contrasts (e.g. Esposito Reference Esposito2010 and Garellek & Keating Reference Garellek and Keating2011 on Mazatec phonation contrast, Kang & Han Reference Kang and Han2013 on Korean tonogenesis, Garellek & White Reference Garellek and White2015 on Tongan stress, and Gao Reference Gao2016 on Shanghainese phonation contrast, to name a few).
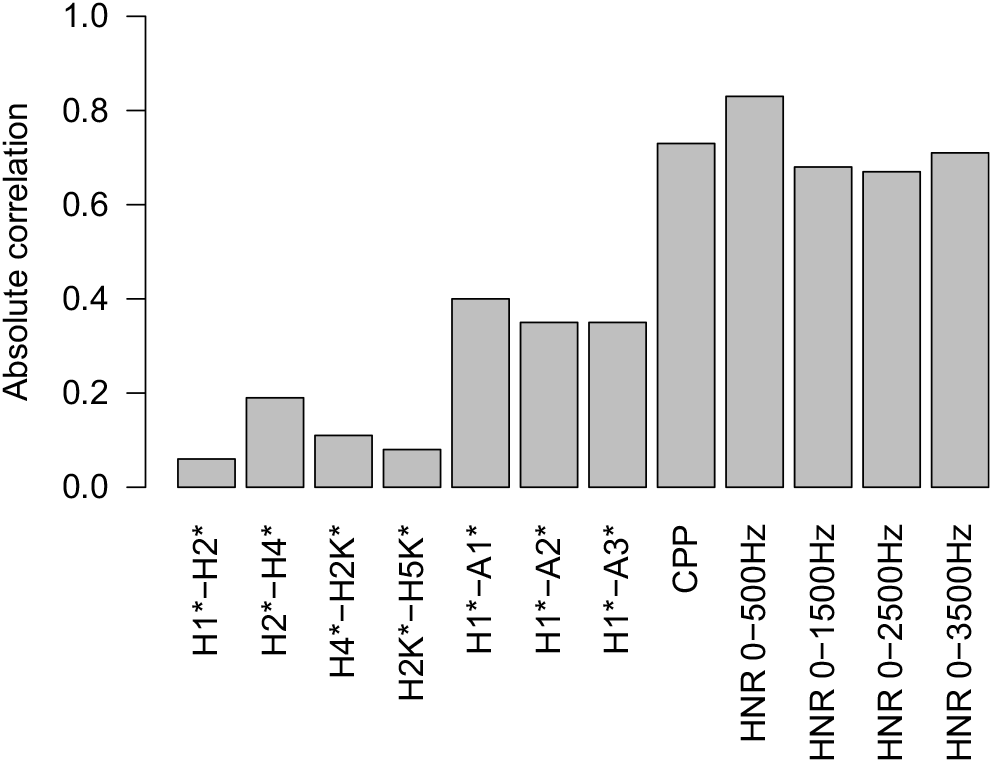
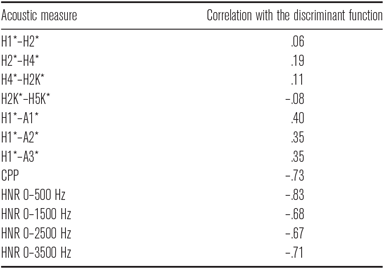
All acoustic parameters examined in the previous section were included, regardless of their significance in the linear regression models. Since spectral and noise measures show temporal differences (i.e. spectral measures best distinguish the contrast in the first third, while noise measures work best in the middle third), choosing either the first or the middle third would underestimate the contribution of one of the two aspects. Therefore, we opted to use mean values over the entire vowel in the LDA analysis. Given that there are two phonation types, LDA produced one discriminant function. The relative importance of each measure was estimated by the Pearson’s r correlation between the values generated by the discriminant function and the acoustic measure. A predictor with more importance should show a larger absolute correlation. The correlations between the discriminants and each of the acoustic measures can be found in Table A12 in the appendix. Results are visually represented in Figure 7.
Relative importance of different acoustic cues in the Shanghainese register contrast: Linear Discriminant Analysis. Larger absolute correlations indicate greater importance.

Figure 7 shows that among all acoustic measures, noise measures contribute the most to the phonation contrast in Shanghainese. Spectral measures contribute to the contrast as well, but their importance is weaker. Among the spectral measures, the relative difference between the fundamental and three formants are the most important. Therefore, for the non-modal voice in Shanghainese, aperiodic noise is the most important phonetic characteristic. This pattern is generally consistent with the definition of ‘whispery voice’ reviewed in the introduction.
3.5 Cross-linguistic comparisons of ‘breathier’ type phonation
The previous section has established that the aperiodic noise plays a more important role than spectral measures in producing the Shanghainese phonation contrast. In this section, we further compare Shanghainese with three other languages that involve some type of ‘breathier’ voice: Southern Yi, Gujarati and White Hmong. Similar to Shanghainese, Southern Yi is a tonal language that contrasts tense and lax phonation registers. Gujarati and White Hmong both contrast breathy and modal phonations, but White Hmong is tonal while Gujarati is not. Acoustic and EGG measurements of these languages are publicly available from the Production and Perception of Linguistic Voice Quality project at UCLA (http://www.phonetics.ucla.edu/voiceproject/voice.html). The recordings of these languages were collected with the same recording setup (e.g. Shure SM10A dynamic microphone and EG2 EGG model made by Glottal Enterprises) as our current Shanghainese recordings, and all the voice measurements were obtained using the same tools (i.e. VoiceSauce and EggWorks). Therefore, the results of the statistical modeling are comparable across the four languages.
Separate LDA was conducted for each language to evaluate the relative importance of different acoustic measures. Measures included were: H1*−H2*, H2*−H4*, H1*−A1*, H1*−A2*, H1*−A3*, CPP, and HNR in four regions of the spectrum (0−500 Hz, 0−1500 Hz, 0−2500 Hz, and 0−3500 Hz). Similar to Shanghainese, temporal differences between spectral and noise measures were also found in Southern Yi and White Hmong. Moreover, the one-third intervals showing the largest distinction vary from measure to measure and from language to language. For a fair comparison, analyses were based on the mean values of the entire vowel. Overall mean values may also better reflect the overall perception of the entire syllables. The Southern Yi model included all tense and lax syllables on the low tone and the mid tone, where there are contrastive phonations. A total of 929 tokens (isolated monosyllables) produced by 12 speakers were included in the Southern Yi model. The Gujarati model included all breathy and modal syllables in the dataset. A total of 3055 observations (target words embedded in a short sentence that the subject immediately thought of upon seeing the target words) from 10 speakers were included in the Gujarati model. The White Hmong model included syllables with modal falling (52) and breathy falling (42) tones. A total of 195 observations (monosyllables embedded in carrier sentences) from 11 speakers were included in the analysis.
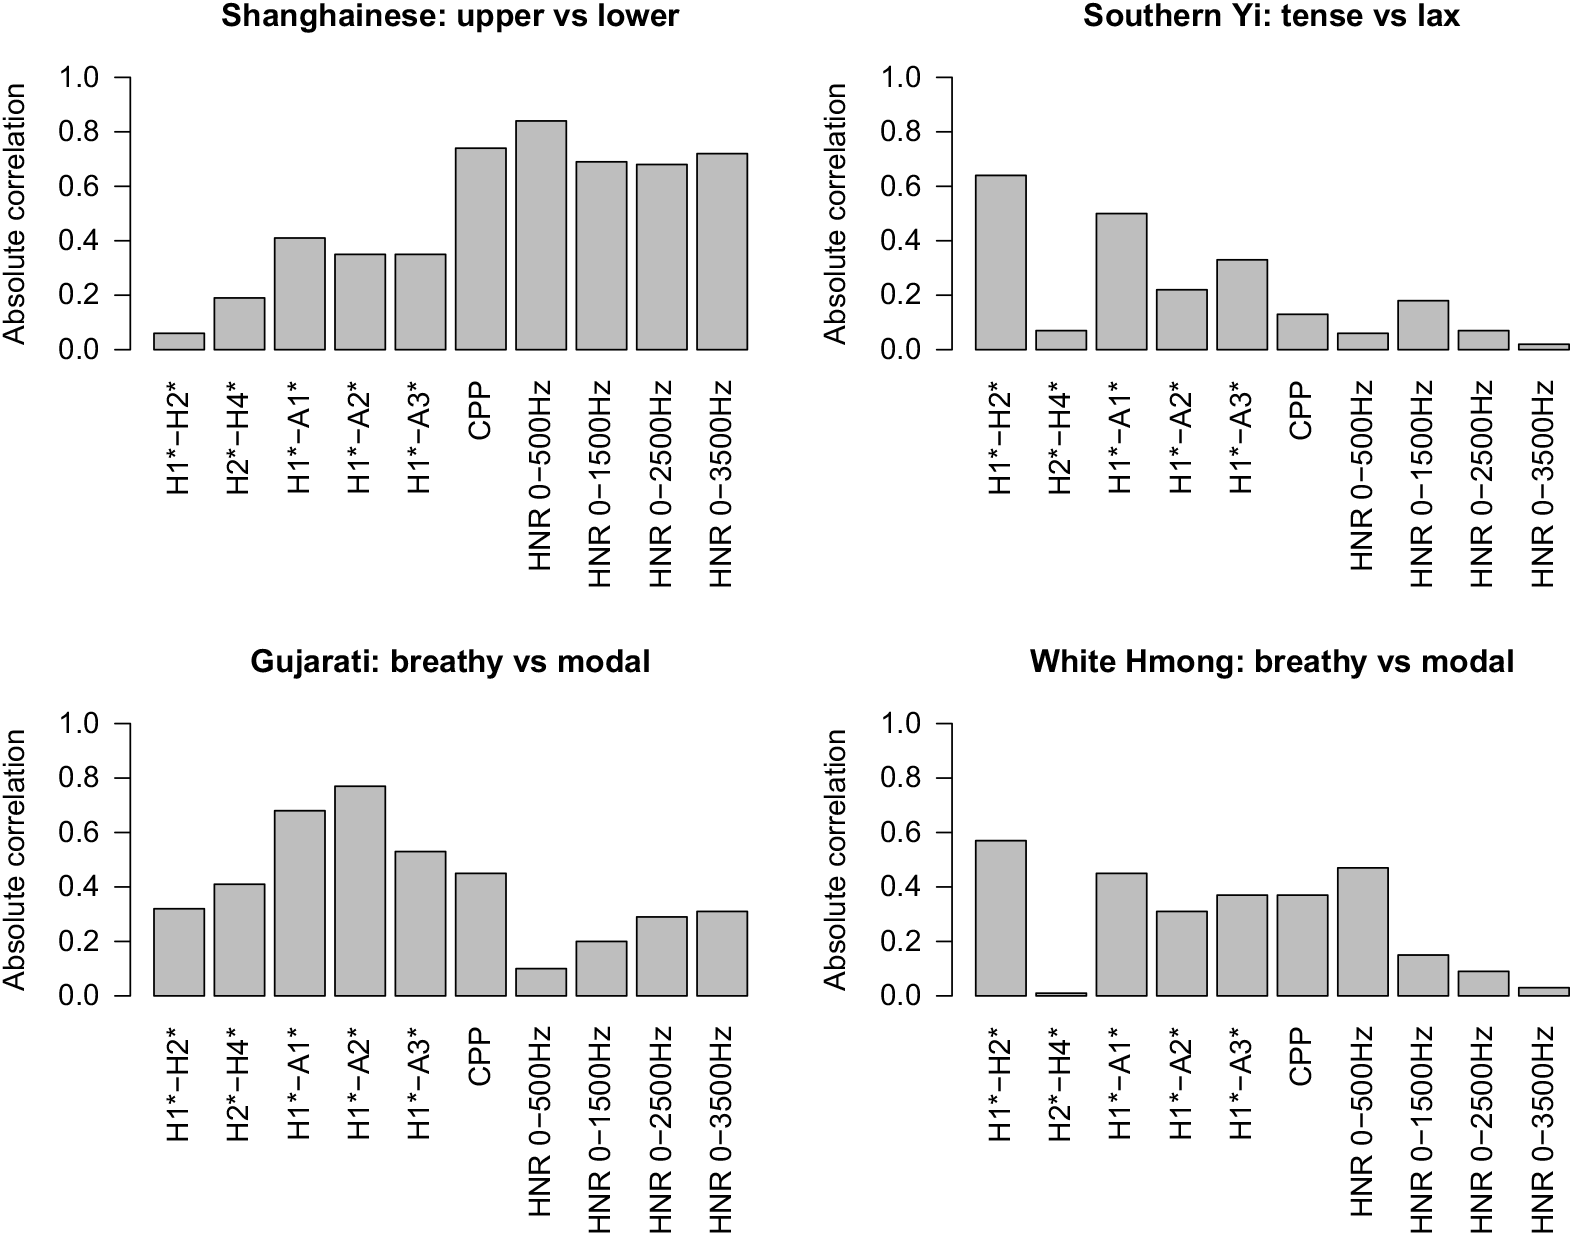
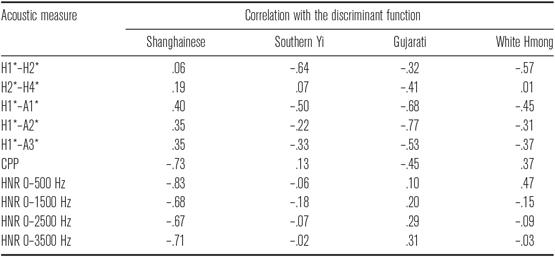
The correlations between the discriminants and each of the acoustic measures can be found in Table A13 in the appendix. The LDA results are visually represented in Figure 8. Measures with higher absolute correlation to the discriminant function (i.e. higher bars in Figure 8) are of greater importance. As shown in Figure 8, compared with the other three languages, CPP and HNRs make very little contribution to the phonation contrast in Southern Yi, and spectral cues (especially H1*−H2*) play the dominant role. This is well expected, since lax voice typically does not involve a posterior glottal gap, and thus there is usually no substantial turbulence noise (Laver Reference Laver1980, Ladefoged & Maddieson Reference Ladefoged and Maddieson1996). Given the important role noise measures play in Shanghainese, its non-modal phonation cannot be lax voice.
Relative importance of acoustic measures to the phonation contrast in Shanghainese (top left), Southern Yi (top right), Gujarati (bottom left) and White Hmong (bottom right): Linear Discriminant Analysis. Larger absolute correlation indicates greater importance.

For Gujarati and White Hmong, while both spectral and noise measures contribute greatly to the phonation contrast, spectral cues are more important. This is compatible with the definition of breathy phonation (Laver Reference Laver1980). In Shanghainese, in contrast with all three languages, noise measures are the dominant cues for the phonation contrast. These results suggest that the non-modal phonation in Shanghainese is not breathy phonation either.
4 General discussion
4.1 Relative glottal opening and the vibratory pattern of the vocal folds
Relative glottal constriction (see Ladefoged Reference Ladefoged1971) was examined by both EGG and acoustic measures. Consistent with previous studies (e.g. Cao & Maddieson Reference Cao and Maddieson1992), the non-modal phonation is produced with smaller CQ and greater spectral tilt, indicating that the non-modal phonation is generally produced with a less constricted glottis. Importantly, as suggested by the regression models reported in Section 3.1, among the spectral measures, the relative amplitude difference between the fundamental and the most prominent harmonics around formants (i.e. H1*−A1*, H1*−A2*, and H1*−A3*) were found to be reliable cues for the phonation contrast, while the low-frequency spectral measures (H1*−H2* and H2*−H4*) and the high-frequency spectral measures (H4*−H2K*, and H2K*−H5K) were not found to significantly distinguish the phonations. It is perhaps surprising that H1*−H2* is not a reliable measure, since this measure has been a successful indicator of phonation contrast in quite a few languages, including Jalapa Mazatec (Garellek & Keating Reference Garellek and Keating2011), Chanthaburi Khmer (Wayland & Jongman Reference Wayland and Jongman2003), Southern Yi (Kuang Reference Kuang2011), White Hmong (Esposito Reference Esposito2012, Garellek Reference Garellek2012, Garellek & Esposito Reference Garellek and Esposito2018), Gujarati (Khan Reference Khan2012), Marathi (Berkson Reference Berkson2019), Mon (Abramson et al. Reference Abramson, Tiede and Luangthongkum2015), Madurese (Misnadin et al. Reference Misnadin and Remijsen2015), and Cao Bằng (Pittayaporn & Kirby Reference Pittayaporn and Kirby2017). However, this result is consistent with the findings in recent studies on some other closely related Wu dialects, such as Jiashan Wu (Jiang & Kuang Reference Jiang, Kuang and Farrell2016). It is perhaps a common property shared by Northern Wu dialects. It is possible that the non-modal phonation in Shanghainese (and Northern Wu more broadly) involves some degree of posterior glottal opening, which is proposed to be more reflected in mid-frequency range spectral measures such as H1*−A1* (Hanson et al. Reference Hanson, Stevens, Kuo, Chen and Slifka2001). The fact that the fundamental frequency and formants are important landmarks in the voice spectrum suggests that there could be a perceptual motivation as well. As the fundamental frequency and the first three formants carry the essential information about tone and vowel contrasts, it is quite possible that their amplitudes as well as their frequency ranges can be especially salient perceptually. This hypothesis should be further validated with future perception experiments.
There were generally no gender or manner effects on acoustic measures, suggesting that the phonation contrast is equally well distinguished by both genders and all manners in similar ways. But it should be noted that we did find some weak gender differences in the EGG measures, with male speakers having stronger distinctions than female speakers. This could be due to the fact that the EGG signals obtained from the female speakers are usually less ideal than those obtained from the male speakers (Rothenberg Reference Rothenberg, Ludlow and Hart1979, Childer & Krishnamurthy Reference Childer and Krishnamurthy1985, Colton & Conture Reference Colton and Conture1990). This is because: (i) women have smaller vocal folds and therefore less current fluctuation in the EGG due to vocal fold vibration, (ii) the angle of the thyroid cartilage is slightly larger in women than in men, and (iii) women tend to have slightly more adipose tissue than men in the structures in the neck. As a result of less ideal signals, the phonation distinction based on EGG measures for female speakers is often smaller than that of the male speakers.
Nonetheless, CQ is still a reliable measure for the phonation contrast for both genders, though the differences between the two phonation types appear to be small. In addition to the CQ difference, as shown in Figure 5 above, the glottal pulses of the non-modal phonation generally exhibit a more symmetrical shape. This means that when producing the non-modal phonation, the contacting and decontacting of the vocal folds are smoother and more gradual. The findings from both CQ and SQ are generally consistent with the notion that the Shanghainese phonation contrast (perhaps other Wu dialects as well) does not differ substantially in glottal constriction (Rose Reference Rose1989, Ladefoged & Maddieson Reference Ladefoged and Maddieson1996). Moreover, it is worth noting that PIC is not a reliable measure. This result is consistent with the findings in Gujarati (Khan Reference Khan2012), in which PIC was not a reliable measure of breathy voice (note that this measure was called DECPA in Khan Reference Khan2012). PIC was originally thought to reflect the speed of the closing of the vocal folds (Keating et al. Reference Keating, Esposito, Garellek, Khan and Kuang2010), but consistent patterns were not found cross-linguistically (see Esposito Reference Esposito2012, Kuang & Keating Reference Kuang and Keating2014). The indication of this measure is therefore still unclear.
Overall, both acoustic and articulatory evidence confirms that the non-modal phonation in Shanghainese has less glottal constriction compared with the modal phonation.
4.2 Contribution of the noise measures
Another important finding of this study is that measures of noise, including CPP and HNRs, are especially important for the non-modal phonation in Shanghainese. CPP and HNRs were significantly lower in the lower register, indicating that the non-modal phonation is produced with more aperiodic noise. More importantly, the noise measures were found to be more important than the spectral measures, indicating that aperiodic noise is more important than glottal constriction. This finding suggests that Shanghainese non-modal phonation is generally consistent with the definition of ‘whispery’ voice, as it has salient aperiodic noise but only a small change in glottal constriction. The importance of the noise component of the non-modal phonation in Shanghainese is further confirmed by cross-linguistic comparison. Among the four examined languages, the noise measures are especially important for Shanghainese, while spectral measures play a much smaller role. By contrast, spectral measures are much more important than noise measures in Gujarati and White Hmong. And, as an extreme contrast, noise measures contribute little to the phonation contrast in Southern Yi. These differences indicate that the ‘breathier’ phonation types in Gujarati and Hmong are consistent with the definition of breathy voice, where the phonation is produced with a much larger glottal aperture and some turbulence noise, and that the breathier phonation in Yi languages is slack or lax, as the phonation contrast is mainly realized by relaxing the thyroarytenoid muscle without significantly drawing the arytenoid cartilages apart.
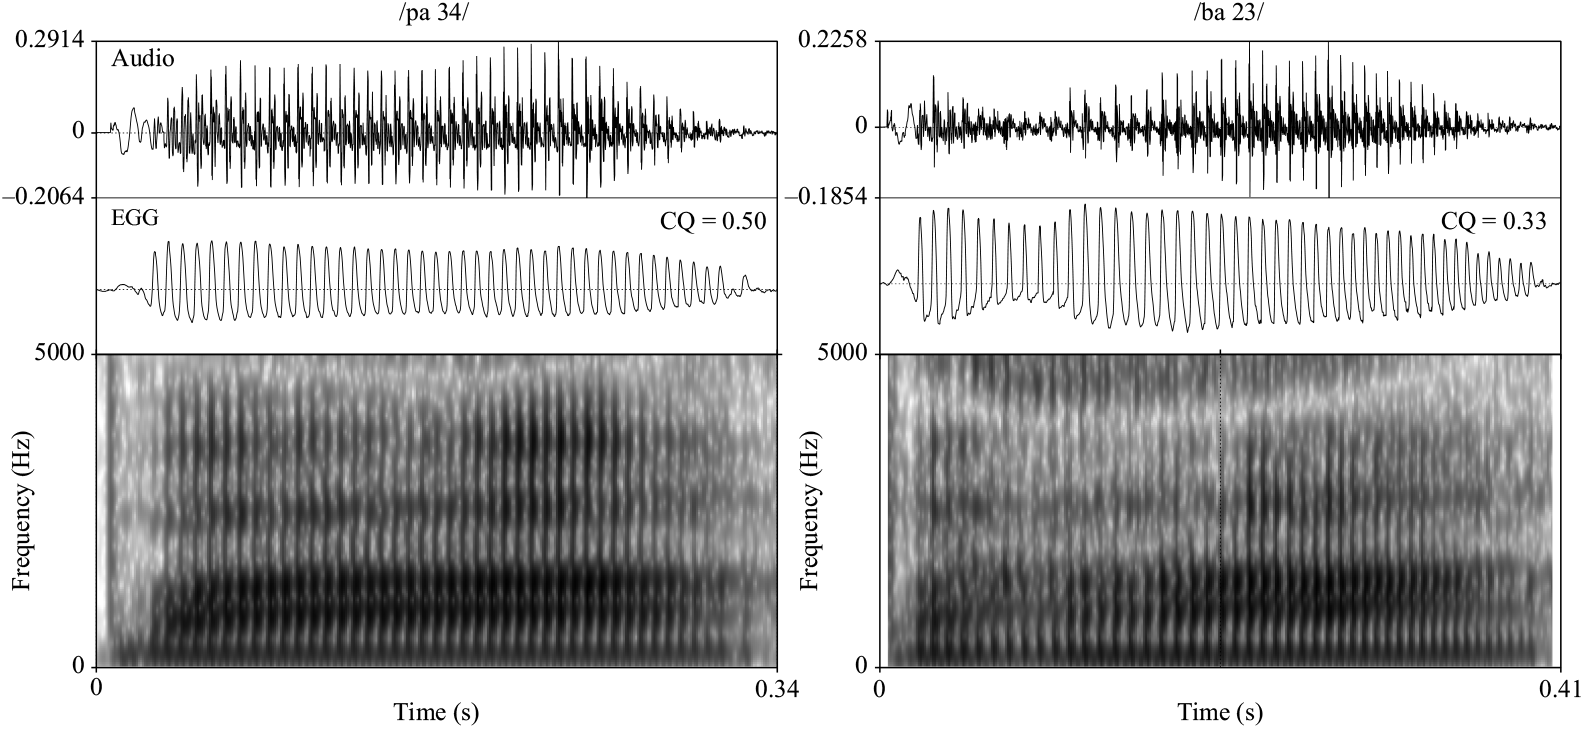
To better understand the contribution of the noise component, production of individual speakers was inspected manually. It appears that speakers use different strategies to produce the non-modal phonation. Figures 9 and 10 illustrate two common strategies speakers use to achieve the phonation contrast. Each figure shows the audio and EGG signals as well as the spectrograms of the pair /pa 34/ ‘put’ and /ba 23/ ‘rank’ produced by a speaker. Audio and EGG files of these two pairs are provided as part of the supplementary materials. The male speaker born in 1948 (speaker 82) in Figure 9 shows a smaller CQ for the lower register token (CQ = 0.50 for /pa 34/ and 0.33 for /ba 23/). The lower register token /ba 23/ also contains more noise, as shown in the audio waveforms and spectrograms.
Audio and EGG signals and spectrograms for upper register /pa 34/ ‘put’ (left) and lower register /ba 23/ ‘rank’ (right), produced by a male speaker born in 1948 (speaker 82), showing the more open glottis (smaller CQ) and the noise component for the non-modal phonation. The spectrograms correspond to audio signals in the first channel. Audio and EGG files of these two words are provided as part of the supplementary materials.

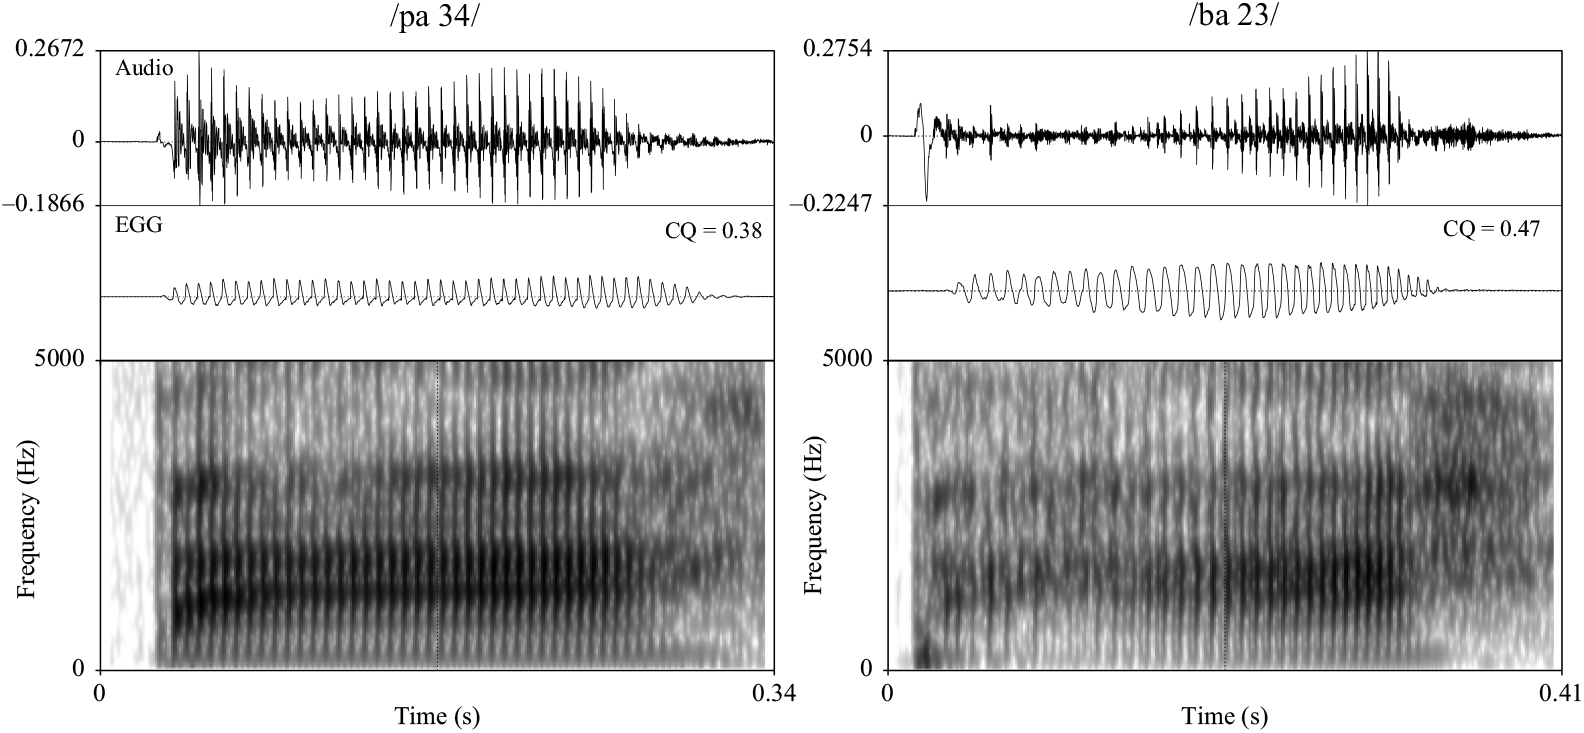
Figure 10 shows the same pair produced by a female speaker born in 1957 (speaker 58). The lower register /ba 23/ is produced with substantial aperiodic noise, and the formant structure is weakened in the first half of /ba 23/. However, the glottis appears to be more constricted for the lower register token, as CQ = 0.38 for the upper register /pa 34/ and 0.47 for the lower register /ba 23/. The vocal folds are drawn tightly together when producing the lower register /ba 23/, but there is still a substantial amount of glottal frication. Therefore, despite variation in the degree of glottal constriction among speakers, they are consistent in producing aperiodic noise for the non-modal phonation associated with the lower register. This finding can explain why aperiodic noise plays an especially important role in the Shanghainese phonation contrast.
Audio and EGG signals and spectrograms for upper register /pa 34/ ‘put’ (left) and lower register /ba 23/ ‘rank’ (right), produced by a female speaker born in 1957 (speaker 58), showing the absence of the smaller CQ in the non-modal phonation. The spectrograms correspond to audio signals in the first channel. Audio and EGG files of these two words are provided as part of the supplementary materials.

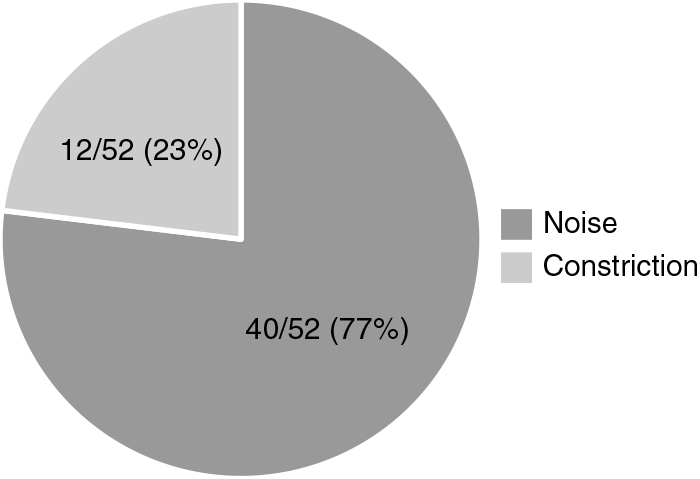
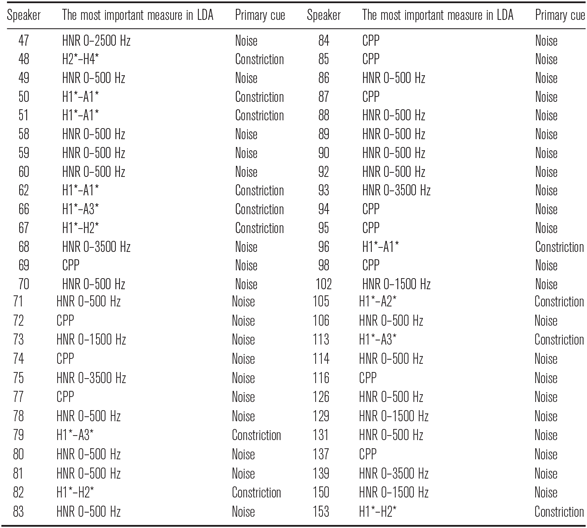
To examine individual variation more closely, separate LDA tests were conducted for each speaker. Mean values over the entire vowel were used. All spectral and noise measures examined in the current study were included. The primary strategy for each speaker is determined in the following way: if the most important measure turned out to be spectral, then glottal constriction was inferred as the primary strategy, whereas if the most important measure turned out to be a noise measure, then noise was inferred as the primary strategy. Results are visually represented in Figure 11. Results for each speaker can be found in Table A14 in the appendix. As shown in Figure 11, of the 52 speakers, a strong majority of speakers (77%) used noise as the primary cue, while only 23% of speakers used glottal constriction. This analysis further confirms our finding that aperiodic noise plays an especially important role in Shanghainese phonation.
Summary of the most important measure for each speaker.

It is worth mentioning that strong aperiodic noise has also been reported in several closely relatedWu dialects (Rose Reference Rose1989, Reference Rose2015), suggesting that this property may be consistent across Wu varieties. It is worth examining whether aperiodic noise is also a salient cue in perception, and if there is interaction between the noise component and the spectral measures in perception. This has been a topic of controversy in the Gujarati literature. While Fischer-Jørgensen (Reference Fischer-Jørgensen1967) found that Gujarati listeners perceived a vowel as breathy when H1 was higher than the rest of the spectrum and when there was audible noise, Bickley (Reference Bickley1982) reported that the four listeners in her study relied solely on spectral measures, with aspiration noise having no significant effect on perception.
5 Conclusions
To conclude, the current study examined the phonetic properties of the non-modal phonation in Shanghainese based on older speakers’ production. Both acoustic and articulatory data confirmed that the non-modal phonation in Shanghainese is produced with relatively less glottal constriction and more aperiodic noise compared with the modal phonation. More importantly, we found that when producing the non-modal phonation, the change in glottal constriction is relatively small and aperiodic noise plays a dominant role, suggesting that the non-modal phonation in Shanghainese is best characterized as ‘whispery voice’. By comparing it with languages with similar phonation types, we further showed that aperiodic noise is especially important for Shanghainese, and thus the non-modal phonation in Shanghainese is different from the ‘breathy voice’ or ‘slack/lax voice’ in other languages. All in all, this study confirms that there is cross-linguistic variation in the phonetic realization of the breathier phonation, and that examining the relative importance of aperiodic noise and glottal constriction is an effective way to tease apart the different subtypes of ‘breathier voice’.
We acknowledge the limitations of this study. First of all, this study focused on the non-modal phonation associated with the lower register, so aspirated stop onsets which are only associated with the higher register were purposely excluded from the test words. However, Y. Chen (Reference Chen2011) found that vowels preceded by aspirated stops in Shanghainese are also significantly breathier than vowels preceded by unaspirated stops. Thus, future work should compare the breathier voice in the lower register with the breathier voice associated with aspirated stops. Moreover, only monosyllabic words were examined in this study, which is an unrealistic setting for speech production. Future work should be done to examine connected and/or spontaneous speech.
Acknowledgments
This study was supported by the URF award of University of Pennsylvania to Jianjing Kuang. Questions and comments from the audiences at The Fifth International Symposium on Tonal Aspects of Languages (TAL 2016), The 24th annual conference of the International Association of Chinese Linguistics (IACL-24), and The Acoustical Society of America (ASA) 173rd Meeting are gratefully acknowledged. We would like to thank all the speakers for making the recordings possible. We also thank the editor Amalia Arvaniti and three anonymous reviewers for their thorough comments and extremely helpful suggestions.
Supplementary material
To view supplementary material for this article, please visit https://doi.org/10.1017/S0025100319000148.
Appendix A. Additional material
Wordlist
Wordlist.

Statistical models
The output of the best-fit linear mixed effects model for H1*−A1*. Formula: H1*−A1* ∼ Phonation + Gender * Manner + (1 | Speaker) + (1 | Word).

The output of the best-fit linear mixed effects model for H1*−A2*. Formula: H1*−A2* ∼ Phonation * Gender + Manner + (1 + Phonation | Speaker) + (1 | Word).

The output of the best-fit linear mixed effects model for H1*−A3*. Formula: H1*−A3* ∼ Phonation + Manner + (1 | Speaker) + (1 | Word).

The output of the best-fit linear mixed effects model for HNR 0−500 Hz. Formula: HNR 0−500 Hz ∼ Phonation + Manner + (1 + Phonation | Speaker) + (1 | Word).

The output of the best-fit linear mixed effects model for HNR 0−1500 Hz. Formula: HNR 0−1500 Hz ∼ Phonation * Gender + Manner + Gender:Manner + (1 | Speaker) + (1 | Word).

The output of the best-fit linear mixed effects model for HNR 0−2500 Hz. Formula: HNR 0−2500 Hz ∼ Phonation * Gender + Manner + Gender:Manner + (1 | Speaker) + (1 + Gender | Word).

The output of the best-fit linear mixed effects model for HNR 0–3500 Hz. Formula: HNR 0–3500 Hz ∼ Phonation * Gender + Manner + Gender:Manner + (1 + Gender | Word).

The output of the best-fit linear mixed effects model for CPP. Formula: CPP ∼ Phonation + Manner + (1 + Phonation | Speaker) + (1 | Word).

The output of the best-fit linear mixed effects model for CQ. Formula: CQ ∼ Phonation * Gender + (1 | Speaker) + (1 | Word).

The output of the best-fit linear mixed effects model for SQ. Formula: SQ ∼ Phonation + Gender + Manner + (1 + Phonation | Speaker) + (1 | Word).

Correlations between the LDA discriminant function and acoustic measures, for Shanghainese. Larger absolute correlations indicate more importance.

Correlations between the LDA discriminant function and acoustic measures, for Shanghainese, Southern Yi, Gujarati and White Hmong. Within each language, larger absolute correlations indicate more importance.

Primary cue used by individual speakers.

 [Studies in the modern Wu dialects]. Peking: Tsing Hua College Research Institute.
 [An acoustic study of voiceless onset followed by breathiness of Wu dialects: Based on the Shanghai dialect].
 [Studies in Languages and Linguistics]
 [A description of the urban Shanghai dialect]. Shanghai: Shanghai Educational Publishing House.