Introduction
In the past years, Raman spectroscopy has presented itself as a key tool to obtain information about structure and physical properties of 2D materials. It can provide better understanding of the electronic and vibrational properties in several types of 2D systems such as graphene [Reference Ferrari, Meyer, Scardaci, Casiraghi, Lazzeri, Mauri, Piscanec, Jiang, Novoselov, Roth and Geim1, Reference Malard, Pimenta, Dresselhaus and Dresselhaus2, Reference Ferrari and Basko3], black phosphorus [Reference Ribeiro, Pimenta and de Matos4], hexagonal boron nitride [Reference Reich, Ferrari, Arenal, Loiseau, Bello and Robertson5, Reference Cai, Scullion, Falin, Watanabe, Taniguchi, Chen, Santos and Li6, Reference Attaccalite, Wirtz, Marini and Rubio7], and transition metal dichalcogenides (TMDs) [Reference Pimenta, del Corro, Carvalho, Fantini and Malard8, Reference Saito, Tatsumi, Huang, Ling and Dresselhaus9]. The analysis of the Raman spectrum of TMDs, for instance, allows us to gather information about the interlayer interactions [Reference Lui, Ye, Ji, Chiu, Chou, Andersen, Means-Shively, Anderson, Wu, Kidd, Lee and He10], spin–orbit splitting [Reference Sun, Yan, Zhan, Liu, Hu, Li, Tay, Kuo, Huang, Hewak, Lee and Shen11], exciton–phonon interactions [Reference Carvalho, Malard, Alves, Fantini and Pimenta12, Reference del Corro, Botello-Méndez, Gillet, Elias, Terrones, Feng, Fantini, Rhodes, Pradhan, Balicas, Gonze, Charlier, Terrones and Pimenta13, Reference Soubelet, Bruchhausen, Fainstein, Nogajewski and Faugeras14], as well as dependence of the phonon frequencies with the number of layers [Reference Lee, Yan, Brus, Heinz, Hone and Ryu15, Reference Li, Zhang, Yap, Tay, Edwin, Olivier and Baillargeat16, Reference Zhang, Qiao, Shi, Wu, Jiang and Tan17, Reference Molina-Sánchez, Hummer and Wirtz18, Reference Puretzky, Liang, Li, Xiao, Wang, Mahjouri-Samani, Basile, Idrobo, Sumpter, Meunier and Geohegan19, Reference Kim, Lee, Nam and Cheong20, Reference Du, Liao, Tang, Zhang, Yu, Yang, Watanabe, Taniguchi, Shi, Zhang and Zhang21, Reference Bilgin, Raeliarijaona, Lucking, Hodge, Mohite, de Luna Bugallo, Terrones and Kar22], among many other relevant characteristics that are fundamental to unveil the underlying physics in these systems [Reference Lui, Ye, Ji, Chiu, Chou, Andersen, Means-Shively, Anderson, Wu, Kidd, Lee and He10, Reference Chiu, Li, Zhang, Hsu, Chang, Terrones, Terrones and Li23, Reference Shim, Yoo, Seo, Shin, Jung, Kang, Ahn, Cho and Choi24, Reference Gong, Lei, Ye, Li, He, Keyshar, Zhang, Wang, Lou, Liu, Vajtai, Zhou and Ajayan25, Reference Zhang, Zhang, Cheng, Li, Wang, Wei, Zhou, Yu, Sun, Wang, Zhang, Zeng, Wang, Hu, Fan, Shen, Chen, Duan, Chang and Dai26]. In addition, Raman spectroscopy can probe the intravalley and interlayer phonon interactions in twisted bilayer heterostructures, where new Raman bands arise due to periodic potentials of Moiré patterns that create allowed states in inner points of the Brillouin zone [Reference Eliel, Moutinho, Gadelha, Righi, Campos, Ribeiro, Chiu, Watanabe, Taniguchi, Puech, Paillet, Michel, Venezuela and Pimenta27, Reference Lin, Tan, Wu, Chen, Wang, Pan, Zhang, Cong, Zhang, Ji, Hu, Liu and Tan28].
Of special interest is the observation of second-order double resonance Raman bands in 2D materials. Double resonance bands have been used in the literature to obtain important information from III–V group semiconductors [Reference Miller, Kleinman and Gossard29, Reference Cerdeira, Anastassakis, Kauschke and Cardona30, Reference Alexandrou, Cardona and Ploog31], cadmium telluride alloy [Reference Gubarev, Ruf and Cardona32], graphite and graphene [Reference Malard, Pimenta, Dresselhaus and Dresselhaus2, Reference Ferrari and Basko3, Reference Kupčić33, Reference Yoon, Son and Cheong34, Reference Venezuela, Lazzeri and Mauri35, Reference Thomsen and Reich36, Reference Grüneis, Saito, Kimura, Cançado, Pimenta, Jorio, Souza Filho, Dresselhaus and Dresselhaus37, Reference Reich and Thomsen38, Reference Maultzsch, Reich and Thomsen39, Reference Cançado, Pimenta, Neves, Dantas and Jorio40, Reference Ferrari41, Reference Mafra, Samsonidze, Malard, Elias, Brant, Plentz, Alves and Pimenta42, Reference Cançado, Jorio, Ferreira, Stavale, Achete, Capaz, Moutinho, Lombardo, Kulmala and Ferrari43], and extensive studies from bulk to monolayer regimes of TMDs as well [Reference Sun, Yan, Zhan, Liu, Hu, Li, Tay, Kuo, Huang, Hewak, Lee and Shen11, Reference Soubelet, Bruchhausen, Fainstein, Nogajewski and Faugeras14, Reference Du, Liao, Tang, Zhang, Yu, Yang, Watanabe, Taniguchi, Shi, Zhang and Zhang21, Reference Bilgin, Raeliarijaona, Lucking, Hodge, Mohite, de Luna Bugallo, Terrones and Kar22, Reference Gołasa, Grzeszczyk, Korona, Bożek, Binder, Szczytko, Wysmołek and Babiński44, Reference Berkdemir, Gutiérrez, Botello-Méndez, Perea-López, Elías, Chia, Wang, Crespi, López-Urías, Charlier, Terrones and Terrones45, Reference Mitioglu, Plochocka, Deligeorgis, Anghel, Kulyuk and Maude46, Reference Liu, Guo, Yang, Zhang, Kumamoto, Shen, Hsu, Li, Saito and Kawata47, Reference Guo, Yang, Yamamoto, Zhou, Ishikawa, Ueno, Tsukagoshi, Zhang, Dresselhaus and Saito48, Reference Shi, Lin, Tan, Qiao, Zhang and Tan49, Reference Carvalho, Wang, Mignuzzi, Roy, Terrones, Fantini, Crespi, Malard and Pimenta50, Reference Qian, Zhang and Chen51, Reference Kutrowska-Girzycka, Jadczak and Bryja52, Reference Sekine, Uchinokura, Nakashizu, Matsuura and Yoshizaki53, Reference Stacy and Hodul54, Reference Sourisseau, Cruege, Fouassier and Alba55, Reference McDevitt, Zabinski, Donley and Bultman56, Reference Frey, Tenne, Matthews, Dresselhaus and Dresselhaus57, Reference Livneh and Sterer58]. The double resonance process arises from the intervalley or intravalley scattering where two phonons or one phonon and one defect participate in the scattering of the excited electron. The double resonance bands can help us characterize both electronic and vibrational properties of these materials. These contributions can aid in the understanding of changes in basic properties brought by defects, which could in turn allow the application of 2D materials to new relevant technologies [Reference Lin, Carvalho, Kahn, Lv, Rao, Terrones, Pimenta and Terrones59, Reference Hu, Wu, Han, He, Ni and Chen60].
The first-order Raman scattering only allows the observation of phonons at the Brillouin zone center (the Γ point). This is justified by the fact that the momentum carried by light is much smaller than the size of the Brillouin zone and, consequently, much smaller than the momentum required to reach phonons away from the Γ point. Therefore, the optical transitions can be regarded as strictly vertical [Reference Cardona and Merlin61]. The second requirement is that the irreducible representations must transform as quadratic base functions [Reference Malard, Pimenta, Dresselhaus and Dresselhaus2, Reference Pimenta, del Corro, Carvalho, Fantini and Malard8, Reference Saito, Tatsumi, Huang, Ling and Dresselhaus9]. Semiconducting monolayer TMDs such as MoS2, with trigonal prismatic symmetry, belong to the D 3h point group, which predicts two Raman active modes, A1′ and E′, in the backscattering configuration [Reference Saito, Tatsumi, Huang, Ling and Dresselhaus9]. Thus, only two peaks can be seen in their first-order Raman spectrum.
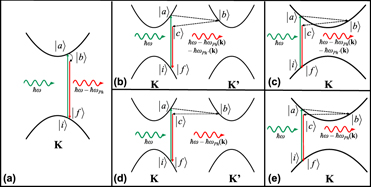
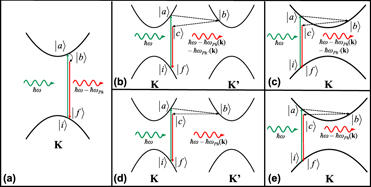
Figure 1(a) represents the Raman process (Stokes) when one phonon is participating in the inelastic scattering process of a photon in a parabolic band semiconductor (first-order process). Here, a photon with energy ħω impinging on the hypothetical material creates an electron–hole pair, promoting the electron from the initial state |i〉 to an excited state |a〉 through an electron–radiation interaction (H e–R). This is a similar process to light absorption. Then, the excited electron interacts with the crystal lattice (electron–phonon interaction, H e–Ph) and goes to the state |b〉 by emitting a phonon of energy ħωPh. Finally, the electron–hole pair recombines by emitting a photon with energy equal to ħω − ħωPh, going to the final state |f〉 through another electron–radiation interaction. The equation of the Raman process that describes the relation between incoming and outgoing photon energies and its intensity is given by [Reference Carvalho, Malard, Alves, Fantini and Pimenta12]
 $$I\left( {\hbar \omega } \right) = {\sum\limits_{a,b} {\left| {{{\left\langle f \right|{H_{{\rm{e}} - {\rm{R}}}}\left| b \right\rangle \left\langle b \right|{H_{{\rm{e}} - {\rm{Ph}}}}\left| a \right\rangle \left\langle a \right|{H_{{\rm{e}} - {\rm{R}}}}\left| i \right\rangle } \over {\left( {\hbar \omega - {E_{\rm{X}}} + i\gamma } \right)\left( {\hbar \omega - \hbar {\omega _{{\rm{Ph}}}} - {E_{\rm{X}}} + i\gamma } \right)}}} \right|} ^2}\quad ,$$
where E X is the optical transition energy of the material and γ is inversely proportional to the lifetime of the Raman process. If the incoming photon energy is equal to either E X or E X + ħωPh, the process is resonant and the intensities of the Raman modes are strongly enhanced. Therefore, Eq. (1) is essential to the study of all 2D materials, because it provides information on the electron–phonon interactions.
First-order and double resonance Raman scattering. (a) Schematic of the first-order resonant Raman scattering process in a parabolic band semiconductor. First, an electron is excited from the valence band (|i〉) to the conduction band (|a〉) by a photon with energy ħω. The interaction between electron and lattice emits a phonon close to the Γ point with energy ħωPh (|b〉). When the excited electron recombines with the hole in the valence band, a photon is emitted with energy ħω − ħωPh (|f〉). (b) Schematic of a two-phonon intervalley scattering. After the electron is excited to the conduction band (|a〉), a phonon with momentum k, represented by the dashed line, scatters the excited electron to the K′ valley band (|b〉). To conserve momentum, the electron is scattered back to K valley by another phonon with wavevector −k (|c〉). After the recombination of electron–hole pair, a photon is emitted with energy ħω − ħωPh(k) − ħωPh′(k). (c) Schematic of a two-phonon intravalley scattering. The same states from the intervalley scattering are observed, only now the scattering happens along the same valley. (d) Schematic of a phonon–defect intervalley scattering process, where a defect, represented by the dotted line, scatters the electron back to the K valley. (e) Schematic of a phonon–defect intravalley scattering. This is the representation of a hypothetical material intended for illustration purposes only. All scales have been exaggerated for clarity.

Meanwhile, two-phonon Raman bands obey different selection rules, which do not only consider vertical transitions but also the scattering of the excited electron throughout the entire reciprocal lattice as long as momentum conservation is achieved [Reference Ferrari, Meyer, Scardaci, Casiraghi, Lazzeri, Mauri, Piscanec, Jiang, Novoselov, Roth and Geim1, Reference Thomsen and Reich36, Reference Carvalho, Wang, Mignuzzi, Roy, Terrones, Fantini, Crespi, Malard and Pimenta50]. The intensity of the two-phonon bands can be described by the following equation:
 $$\eqalign{I\left( {\hbar \omega } \right) = \cr{\sum\limits_{a,b,c} {\left| {{{\left\langle f \right|{H_{{\rm{e}} - {\rm{R}}}}\left| c \right\rangle \left\langle c \right|{H_{{\rm{e}} - {\rm{Ph'}}}}\left| b \right\rangle \left\langle b \right|{H_{{\rm{e}} - {\rm{Ph}}}}\left| a \right\rangle \left\langle a \right|{H_{{\rm{e}} - {\rm{R}}}}\left| i \right\rangle } \over {\left( {\hbar \omega - {E_{\rm{X}}} + i\gamma } \right)\left( {\hbar \omega - \hbar {\omega _{{\rm{Ph}}}} - {E_{\rm{X}}} + i\gamma } \right)\left( {\hbar \omega - \hbar {\omega _{{\rm{Ph'}}}} - \hbar {\omega _{{\rm{Ph}}}} - {E_{\rm{X}}} + i\gamma } \right)}}} \right|} ^2}\quad .$$
Notice the presence of a second electron–phonon interaction and a third intermediate state, |c〉, due to the creation of a second phonon with energy ħωPh′, in contrast with Eq. (1). Figure 1(b) illustrates a two-phonon process. First, similar to the first-order process, the electron is promoted from the valence band (state |i〉) to the conduction band (state |a〉) and it interacts with the lattice to emit a phonon with energy ħωPh (state |b〉). However now, instead of a zone center phonon, the emitted phonon has enough momentum to scatter the electron from one point in the Brillouin zone to another (K to K′ in our example). To guarantee momentum conservation, the electron at K′ must emit another phonon with the same amount of momentum that the first phonon had and energy ħωPh′ (state |c〉). Finally, the excited electron–hole pair recombines and a photon with energy equal to ħω − ħωPh − ħωPh′ is emitted. Due to the scattering of the electron from one valley to the other, this process is frequently called intervalley scattering [Reference Carvalho, Wang, Mignuzzi, Roy, Terrones, Fantini, Crespi, Malard and Pimenta50]. Another example of two-phonon process could be the intravalley scattering, where instead of the electron being scattered from the K valley to the K′ valley, the electron is scattered in the same valley, following the same trajectory as Fig. 1(c). The same procedures from intervalley process can be applied, just the length of the wavevector changes.
One could ask the question of how would defects change the Raman process. Figures 1(d) and 1(e) present the defect-induced Raman process expected for a low-defective material (a material with a defect density low enough that its basic properties are not very affected by defects). In this case, the same process for intervalley and intravalley scatterings occur, but the transition from state |b〉 to state |c〉 is carried by a defect instead of a phonon. Then, the energy of the scattered photon will be ħω − ħωPh, like in the case of the first-order bands, but the phonon participating in the Raman process is not a zone-center phonon. The intensity of this process can be explained by means of Eq. (2) as well [Reference Venezuela, Lazzeri and Mauri35], after some minor changes to include the electron–defect interaction.
The processes illustrated in Figs. 1(b)–1(e) have only shown the scattering of the electron from one point to the other in the electronic structure. As a matter of fact, the electron is not the only entity that can be scattered, but the hole in the valence band can be scattered as well [Reference Sun, Yan, Zhan, Liu, Hu, Li, Tay, Kuo, Huang, Hewak, Lee and Shen11, Reference Mafra, Samsonidze, Malard, Elias, Brant, Plentz, Alves and Pimenta42]. For the case where the electron is the only entity scattered in an intervalley or intravalley process, we call it electron–electron scattering. If both electron and hole are scattered, we call it electron–hole scattering and the case where just the hole is scattered can be called hole–hole scattering.
Unfortunately, the two-phonon bands have very low probability of happening, such that their intensity is much smaller than that of first-order modes. Nevertheless, when the incoming laser energy reaches resonance with the electronic transition of the material, or when the defect density is high enough, the intensity becomes comparable or even higher than that of the first-order modes [Reference Cançado, Jorio, Ferreira, Stavale, Achete, Capaz, Moutinho, Lombardo, Kulmala and Ferrari43, Reference Carvalho, Wang, Mignuzzi, Roy, Terrones, Fantini, Crespi, Malard and Pimenta50, Reference Mignuzzi, Pollard, Bonini, Brennan, Gilmore, Pimenta, Richards and Roy62, Reference Liu, Siregar, Hasdeo, Kumamoto, Shen, Cheng, Li, Saito and Kawata63]. When it happens, the bands approach a resonant behavior like that of the first-order modes. But, since the choices are not limited to the zone-center phonons, other terms in the denominator of Eq. (2) can be null at the same time. That is why these bands are called double resonance bands or even triple resonance bands in some cases [Reference Carvalho, Wang, Mignuzzi, Roy, Terrones, Fantini, Crespi, Malard and Pimenta50, Reference Malard, Mafra, Guimarães, Mazzoni and Jorio64].
In this review, we present some of the recent advances on the double resonance Raman process in two dimensional materials. We also discuss some information that can be obtained from the analysis of the double resonance Raman bands and its applications, e.g., investigation of defects in 2D materials. We start by revising the double resonance process in graphene and follow up with the recent findings in TMDs, in particular for MoS2. Further, a perspective of possible future studies for other classes of 2D materials is presented.
Double resonance Raman process
The appearance of double resonance Raman bands can be originated by an intervalley scattering of the excited electron by a combination of two phonons of same wavevectors but with opposite signs. The process is resonant if at least one of the states accessed by the electron is a real electronic state. However, the double resonance process is characterized by two real states connecting each other [Reference Malard, Pimenta, Dresselhaus and Dresselhaus2, Reference Reich and Thomsen38]. It can be either a band state in the conduction band, such as in the case of graphene, or it can be an excitonic state, such as in the case of TMDs. The phonons that participate in the process will be limited to those with wavevectors that can connect states with similar energy of the excited electron [Reference Malard, Pimenta, Dresselhaus and Dresselhaus2, Reference Reich and Thomsen38]. Such is the case for the D and 2D bands in the Raman spectrum of graphene. These bands arise from the contributions of the TO branch around the K point [see Fig. 2(a)] [Reference Ferrari, Meyer, Scardaci, Casiraghi, Lazzeri, Mauri, Piscanec, Jiang, Novoselov, Roth and Geim1]. In the case of the MoS2, a semiconducting TMD, it has been recently demonstrated that the double resonance band in the material has contributions from the longitudinal acoustic (LA) and transversal acoustic (TA) phonon branches in the vicinities of the K and M points [see Fig. 2(b)] [Reference Pimenta, del Corro, Carvalho, Fantini and Malard8, Reference Shi, Lin, Tan, Qiao, Zhang and Tan49]. The aforementioned considerations help us to understand some rules regarding the double resonance process and, the information that it can provide, such as the electron or phonon velocity along a certain region in the electron or phonon dispersion [Reference Ferrari and Basko3]. In the next sections, we address some physical properties of graphene and TMDs focusing mainly on their electronic and vibrational properties, which are essential for understanding the observed double resonance bands in these materials [Reference Pimenta, del Corro, Carvalho, Fantini and Malard8, Reference Carvalho, Wang, Mignuzzi, Roy, Terrones, Fantini, Crespi, Malard and Pimenta50].
The two-phonon Raman bands. Comparison between the double resonance intervalley scattering in (a) graphene and (b) monolayer MoS2. Reprinted with permission from Ref. Reference Pimenta, del Corro, Carvalho, Fantini and Malard8.

Graphene
Graphene was the first isolated 2D material, and it is regarded as the strongest material due to its in-plane double sp 2 bonding [Reference Lee, Wei, Kysar and Hone65]. At the same time, it was one of the first 2D materials to have its Raman spectra measured [Reference Ferrari, Meyer, Scardaci, Casiraghi, Lazzeri, Mauri, Piscanec, Jiang, Novoselov, Roth and Geim1].
The electronic properties of graphene can be well described by the tight binding approach considering two p z orbitals [Reference Reich, Maultzsch, Thomsen and Ordejón66]. Thus, the one electron dispersion of graphene is characterized by the presence of Dirac cones near the K point in the Brillouin zone, where the valence and conduction bands touch each other, making graphene be considered a zero band gap semiconductor [Reference Wehling, Black-Schaffer and Balatsky67]. In a first approximation, the electronic band structure around the K point can be regarded as linear and, consequently, the dependence of the electronic density of states presents a linear behavior near the Fermi level [Reference Castro Neto, Guinea, Peres, Novoselov and Geim68]. The optical transitions in graphene are characterized by vertical transitions from valence band to the conduction band close to the K point, with constant light absorption in the near infrared (NIR) and visible spectral regions [Reference Mak, Ju, Wang and Heinz69]. As for the vibrational properties of graphene, there are six phonon branches at the Γ point, three acoustic and three optical phonon branches, named longitudinal acoustic (LA), transversal acoustic (TA), and out of plane transversal acoustic (ZA); out of plane transversal optic (ZO), longitudinal optic (LO), and transversal optic (TO). Among these phonon branches, only the LO and TO modes at the Γ point are Raman active and correspond to a degenerate E2g representation (the G band). Thus, the expected Raman spectrum should consist of a single first-order band.
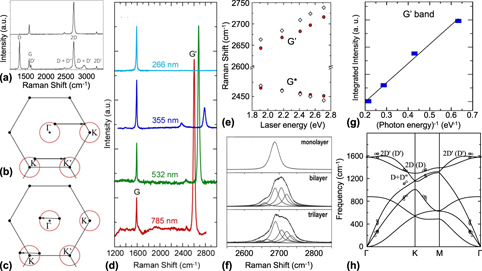
Nevertheless, the Raman spectrum of pristine graphene is characterized by the presence of mostly four bands, named as G, D + D″, 2D, and 2D′ in frequency order [Fig. 3(a)] [Reference Ferrari and Basko3]. In the presence of defects, new features arise in the Raman spectrum of graphene; thus, besides the four Raman bands observed in a pristine graphene, three other bands are also observed, named as D, D′, and D + D′ [see Fig. 3(a)].
The Raman scattering process in graphene. (a) Raman spectrum of pristine graphene (top) and defective graphene (bottom). Reprinted with permission from Ref. Reference Ferrari and Basko3. (b) Intervalley and (c) intravalley wave vector scattering processes. (d) Raman spectrum of graphene collected at different excitation wavelengths from NIR to UV. Reprinted with permission from Ref. Reference Liu, Siregar, Hasdeo, Kumamoto, Shen, Cheng, Li, Saito and Kawata63. (e) Frequencies of the 2D and D + D″ (G′ and G*) bands as a function of the laser energy. Reprinted with permission from Ref. Reference Mafra, Samsonidze, Malard, Elias, Brant, Plentz, Alves and Pimenta42. (f) Raman spectra of monolayer, bilayer, and trilayer graphene at the same laser energy showing the differences in the observed intervalley processes of the 2D band. Reprinted with permission from Ref. Reference Malard, Mafra, Guimarães, Mazzoni and Jorio64. (g) Intensity of the 2D band as a function of the inverse of the laser energy. Reprinted with permission from Ref. Reference Liu, Siregar, Hasdeo, Kumamoto, Shen, Cheng, Li, Saito and Kawata63. (h) Phonon dispersion of single layer graphene with the phonons that participate in the intervalley and intravalley bands, data from Ref. Reference Bernard, Whiteway, Yu, Austing and Hilke76.

The G band (the E2g mode) originates from a first-order Raman process, as shown in Fig. 1(a). As a first-order process, it will be present in the Raman spectrum of pristine and defective samples regardless of the excitation laser energy and number of layers [Reference Ferrari, Meyer, Scardaci, Casiraghi, Lazzeri, Mauri, Piscanec, Jiang, Novoselov, Roth and Geim1, Reference Malard, Pimenta, Dresselhaus and Dresselhaus2, Reference Cançado, Jorio, Ferreira, Stavale, Achete, Capaz, Moutinho, Lombardo, Kulmala and Ferrari43, Reference Lucchese, Stavale, Ferreira, Vilani, Moutinho, Capaz, Achete and Jorio70, Reference Martins Ferreira, Moutinho, Stavale, Lucchese, Capaz, Achete and Jorio71, Reference Eckmann, Felten, Mishchenko, Britnell, Krupke, Novoselov and Casiraghi72]. An interesting aspect of the G band is its classical behavior for the scattering process across the visible range, where its intensity is proportional to the fourth power of the laser frequency [Reference Liu, Siregar, Hasdeo, Kumamoto, Shen, Cheng, Li, Saito and Kawata63]. The other bands are related to a double or triple resonance process discussed before.
The bands that arise from double or triple resonance may be affected not only by excitation laser energy and defect density, but also by the number of layers as well, where an increasing number of layers will affect the number of allowed processes due to changes in the electronic structure [Reference Ferrari, Meyer, Scardaci, Casiraghi, Lazzeri, Mauri, Piscanec, Jiang, Novoselov, Roth and Geim1, Reference Malard, Pimenta, Dresselhaus and Dresselhaus2]. Although we name the double or triple resonance processes as intervalley and intravalley, we must remember that graphene presents Dirac cones in its electronic structure, not parabolic bands. For the sake of comparison between materials, though, we will stick with this name. The intervalley scattering process [see Fig. 3(b)] occurs when the excited electron is scattered from the conduction band near K point to the conduction band near K′ point, whereas the intravalley scattering process [see Fig. 3(c)] scatters the electron along the same valley. Once the excited electron is scattered, it can return to its original band through another phonon or a defect, and then it recombines with the hole in the valence band emitting a scattered photon.
The 2D (or G′) band in graphene, appearing between 2600 and 2800 cm−1 in Fig. 3(d), is an example of a band originated from the electron–hole intervalley scattering. This process is mediated by two TO phonons (one for the excited electron and one for the hole) around the K point in the phonon dispersion and the recombination happens around the K′ point [Reference Malard, Pimenta, Dresselhaus and Dresselhaus2, Reference Kupčić33, Reference Mafra, Samsonidze, Malard, Elias, Brant, Plentz, Alves and Pimenta42]. This association is made because the phonon wavevector is around the size of the distance between K and K′ points, corresponding to the approximate distance between the Γ and K points [see Fig. 3(b)], which can be mapped to the phonon dispersion. Additionally, the 2D band frequency presents a high dispersion as the excitation laser energy is tuned [around 100 cm−1/eV, see Figs. 3(d) and 3(e)]. The reason for this comes from both the linear electronic dispersion near K point of graphene, and the Kohn anomaly, which manifests as strongly dispersive LO branch in the vicinity of the Γ and K points [Reference Piscanec, Lazzeri, Mauri, Ferrari and Robertson73]. Thus, for laser energies close to the linear regime of the electronic dispersion, the intensity of the 2D band is greatly enhanced.
When a graphene sheet presents a significative defect density, a band with approximately half the frequency of the 2D band appears, and it is called D band [Reference Thomsen and Reich36]. The D band is a double resonance process, and its intensity is strongly bound to the defect density [Reference Cançado, Jorio, Ferreira, Stavale, Achete, Capaz, Moutinho, Lombardo, Kulmala and Ferrari43, Reference Lucchese, Stavale, Ferreira, Vilani, Moutinho, Capaz, Achete and Jorio70]. The 2D band, on the other hand, decreases in intensity for increasing defect density [Reference Cançado, Jorio, Ferreira, Stavale, Achete, Capaz, Moutinho, Lombardo, Kulmala and Ferrari43], which could be argued as a preference for the phonon–defect process instead of the phonon–phonon process of recombination. We mention that as the number of graphene layers increases, the number of intervalley processes increases as well, in accordance to the changes in the electronic structure [see Fig. 3(f)] [Reference Malard, Pimenta, Dresselhaus and Dresselhaus2, Reference Malard, Mafra, Guimarães, Mazzoni and Jorio64]. Also, as the excitation laser energy approaches the UV range, the 2D band intensity considerably decreases (with the first-order process prevailing) such that its intensity is inversely proportional to the excitation laser energy [see Figs. 3(d) and 3(g)] [Reference Liu, Siregar, Hasdeo, Kumamoto, Shen, Cheng, Li, Saito and Kawata63]. The D + D″ band, also known in the literature as G* band, is associated with an intervalley scattering involving phonons from TO (D) and LA (D″) branches. Contrarily to the 2D band, the D + D″ presents a negative dispersion due to the behavior of the LA phonon branch around the K point [Fig. 3(e)] [Reference Malard, Pimenta, Dresselhaus and Dresselhaus2, Reference Mafra, Samsonidze, Malard, Elias, Brant, Plentz, Alves and Pimenta42, Reference May, Lazzeri, Venezuela, Herziger, Callsen, Reparaz, Hoffmann, Mauri and Maultzsch74].
The 2D′ band is an example of a phonon–phonon intravalley scattering process [Reference Basko, Piscanec and Ferrari75]. The scattering of the excited electron happens along the K cone through the emission of two LO phonons close to the Γ point [Reference Basko, Piscanec and Ferrari75]. Analogously, one can also see a D′ band, which is a phonon–defect intravalley scattering [Reference Basko, Piscanec and Ferrari75]. Interestingly, the 2D′ band does not present a strong enhancement of its intensity, showing an intensity smaller than that of a first-order mode. This could be related to the strong interaction between electrons and LO phonons near the K point, such that the numerator is also an important factor. Therefore, the electron–phonon interaction is an important factor for the double (or triple) resonance process.
The D′ and 2D′ bands are not very dispersive, i.e., their frequency position does not change much when tuning the excitation laser energy, but they are related to phonon dispersion points where the LO phonon branches are maximum [Reference Bernard, Whiteway, Yu, Austing and Hilke76].
We comment that combinations of intravalley and intervalley scattering are also possible. For instance, the D + D′ band comes from the scattering of an electron to the K′ point mediated by a TO phonon close to the K point and then scattered back by a TO phonon close to the Γ point. Afterward, electron and hole recombine mediated by a defect [Reference Ferrari and Basko3, Reference Cançado, Jorio, Ferreira, Stavale, Achete, Capaz, Moutinho, Lombardo, Kulmala and Ferrari43].
Figure 3(h) shows the phonon dispersion of graphene depicting all the contributions from the double resonance Raman bands associated to their specific points [Reference Bernard, Whiteway, Yu, Austing and Hilke76]. In summary, the ability to probe phonons away from the Γ point in such way that they can be mapped out by their wavevectors is one of the most interesting features of the double Raman resonance bands in layered material.
Before going further, lets analyze all the information gathered so far from the Raman spectra of graphene. The most intense feature in the Raman spectra of monolayer graphene is the 2D band. From the process introduced before, we can infer that not only the triple resonance due to Eq. (2) is important, but also a strong interaction between electron and phonons can play a big role for the probability of the process. In fact, the electron–phonon interaction has been found to be twice as strong for LO phonons close to the K point than for phonons close to the Γ point [Reference Venezuela, Lazzeri and Mauri35]. This relatively small difference becomes rather strong when we remember that Eq. (2) has a product of two electron–phonon interaction terms that are squared. Thus, an intensity difference of at least eight times can be expected from the 2D and 2D′ bands [Reference Venezuela, Lazzeri and Mauri35]. Graphene can be considered a semimetal, meaning that it has electronic states available everywhere, except at E = 0. Looking at Eq. (2), we realize that there is a term for the electronic transition energy, which is 0 (zero) for graphene. This means that while the linear behavior of the electronic structure is satisfied, graphene is always in resonance. This is true for the NIR and visible spectral regions. This remotes to another important point in the characteristics of the double or triple resonance process, the fact that it is coupled with the position of the electron in the electronic band. Finally, the phonons that participate in the process must conserve momentum, as we have previously mentioned. But, as long as momentum is conserved, any combination of phonons is possible, although the final intensity varies due to the electron–phonon interaction.
Now, we use the guiding principles from graphene and apply them to the analysis of other materials, mostly MoS2-like TMDs. We emphasize that the knowledge obtained from the analysis of the graphene’s Raman spectrum can be extended to other 2D layered materials, although the field has not been thoroughly explored yet and the diverse properties of the material at hand must be considered as well.
TMDs
Few years after the isolation of graphene, semiconducting TMDs monolayers, such as MoS2 and WS2, were obtained through the mechanical exfoliation technique and their physical and chemical properties were characterized [Reference Novoselov, Jiang, Schedin, Booth, Khotkevich, Morozov and Geim77, Reference Mak, Lee, Hone, Shan and Heinz78, Reference Splendiani, Sun, Zhang, Li, Kim, Chim, Galli and Wang79, Reference Gutiérrez, Perea-López, Elías, Berkdemir, Wang, Lv, López-Urías, Crespi, Terrones and Terrones80, Reference Zhao, Ghorannevis, Chu, Toh, Kloc, Tan and Eda81, Reference Hill, Rigosi, Roquelet, Chernikov, Berkelbach, Reichman, Hybertsen, Brus and Heinz82, Reference Frisenda, Niu, Gant, Molina-Mendoza, Schmidt, Bratschitsch, Liu, Fu, Dumcenco, Kis, De Lara and Castellanos-Gomez83].
TMDs are layered materials composed by a sheet of transition metals (M) sandwiched between two sheets of chalcogens (X) presenting the general chemical formula MX 2. These materials are believed to lead future developments on electronic devices such as optoelectronics [Reference Mak and Shan84], valleytronics [Reference Mak, McGill, Park and McEuen85, Reference Mai, Barrette, Yu, Semenov, Kim, Cao and Gundogdu86], and wearables [Reference Baugher, Churchill, Yang and Jarillo-Herrero87] in a few years. A diversity of physical properties can be obtained depending on the combination of the transition metal and chalcogen. For instance, it can range from semiconducting (MoS2, WS2) to metallic (NbSe2, NbS2) [Reference Novoselov, Mishchenko, Carvalho and Castro Neto88, Reference Geim and Grigorieva89]. Besides, thousands of layered materials are yet to be found [Reference Mounet, Gibertini, Schwaller, Campi, Merkys, Marrazzo, Sohier, Castelli, Cepellotti, Pizzi and Marzari90], showing the great potential of the 2D systems. Despite this great diversity, the study of double resonance Raman scattering is still in progress in these materials. Therefore, in this review, we only focus our analysis on semiconducting MoS2-like TMDs, discussing the recent advances.
These materials present a characteristic indirect band gap ranging from 1.0 to 1.3 eV when in bulk form [Reference Gusakova, Wang, Shiau, Krivosheeva, Shaposhnikov, Borisenko, Gusakov and Tay91]. They present strong many-body interactions, such that their optical transitions are governed by excitons, and even at room temperature, their excitonic transition are observed in absorption experiments [Reference Wilson and Yoffe92]. Besides, a transition from indirect to direct band gap occurs upon the reduction from bulk to monolayer regime [Reference Qiu, da Jornada and Louie93]. Due to a strong spin–orbit coupling, a split in the valence band at the K point occurs and gives rise to the excitonic transitions named A and B, according to their energy values [Reference Wilson and Yoffe92, Reference Zibouche, Kuc, Musfeldt and Heine94]. Figure 4(a) shows the transition from indirect to direct band gap in the electronic dispersion of MoS2. The indirect band gap in bulk, which is the phonon-mediated optical transition from the Γ to the Q point (the midpoint of Γ–K path), becomes a direct band gap at the K point for a monolayer. The phonon dispersion of the MoS2 class of TMDs is characterized by the presence of nine phonon branches, three acoustic (LA, TA, and ZA) and six optical branches, of irreducible representations A2′, A1′, E′, and E″ at the Γ point. Therefore, the expected phonons to participate in the Raman spectrum should be the A1′, E′, and E″ phonons, the last of which is expected to be active only in a right angle configuration.
The Raman scattering process in MoS2 transition–metal dichalcogenide. (a) Electronic band structure with a close-up of the K, Q, and Γ points showing the indirect to direct band gap transitions from bulk to monolayer MoS2. The A and B excitons are highlighted by vertical arrows. (b) Raman spectra of monolayer MoS2 off-resonance (top) and on-resonance (bottom) with the excitonic transition. (c) The LA phonon branch dispersion close to the K and M points. Reprinted with permission from Ref. Reference Carvalho, Wang, Mignuzzi, Roy, Terrones, Fantini, Crespi, Malard and Pimenta50 (from supplementary information). Raman spectra of monolayer MoS2 off-resonance (top) and on-resonance (bottom) with the excitonic transition. (d) Raman spectra of monolayer MoS2 collected at different laser energies across the A and B excitons. (e) Frequencies of the LA + TA(∼K) band and the components of the 2LA band: singularity, 2LA(∼K) and 2LA(∼M) as a function of the laser energy. (c–e) Reprinted with permission from Ref. Reference Carvalho, Wang, Mignuzzi, Roy, Terrones, Fantini, Crespi, Malard and Pimenta50.

The nonresonant Raman spectrum of semiconducting TMDs, collected in the backscattering configuration, is mostly restricted to first-order modes, which are known in the literature as the out-of-plane A1′ (A1g for bulk) and the in-plane degenerate E′ (E2g for bulk) mode [Reference Pimenta, del Corro, Carvalho, Fantini and Malard8, Reference Saito, Tatsumi, Huang, Ling and Dresselhaus9] [see top of Fig. 4(b)]. On the other hand, when the incoming laser energy closely matches the A and B excitonic transitions, new contributions arise in the Raman spectrum of the material [see bottom of Fig. 4(b)]. These new features can be associated with the intervalley scattering mediated by acoustic phonons [Reference Sun, Yan, Zhan, Liu, Hu, Li, Tay, Kuo, Huang, Hewak, Lee and Shen11, Reference Liu, Guo, Yang, Zhang, Kumamoto, Shen, Hsu, Li, Saito and Kawata47, Reference Guo, Yang, Yamamoto, Zhou, Ishikawa, Ueno, Tsukagoshi, Zhang, Dresselhaus and Saito48, Reference Carvalho, Wang, Mignuzzi, Roy, Terrones, Fantini, Crespi, Malard and Pimenta50, Reference Kutrowska-Girzycka, Jadczak and Bryja52, Reference Sekine, Uchinokura, Nakashizu, Matsuura and Yoshizaki53, Reference Livneh and Sterer58, Reference Gaur, Sahoo, Scott and Katiyar95]. For instance, in MoS2, two bands are mainly observed in its resonant Raman spectrum: a band at approximately 420 cm−1 commonly known in the literature as “b” band [Reference Carvalho, Wang, Mignuzzi, Roy, Terrones, Fantini, Crespi, Malard and Pimenta50, Reference Kutrowska-Girzycka, Jadczak and Bryja52, Reference Sekine, Uchinokura, Nakashizu, Matsuura and Yoshizaki53], and a broad and asymmetric band at approximately 460 cm−1, which is related to two LA phonons [Fig. 4(c)] [Reference Gołasa, Grzeszczyk, Korona, Bożek, Binder, Szczytko, Wysmołek and Babiński44, Reference Carvalho, Wang, Mignuzzi, Roy, Terrones, Fantini, Crespi, Malard and Pimenta50, Reference Stacy and Hodul54, Reference Frey, Tenne, Matthews, Dresselhaus and Dresselhaus57, Reference Chen and Wang96, Reference Livneh and Spanier97]. A detailed discussion about the origin of these bands will be presented later on.
Before that, to understand the physical meaning of the double resonance bands involving the acoustic phonons, it is necessary to separate the simple second-order Raman process and double resonance process that overlap in a resonant Raman spectrum of TMDs.
Second-order bands are present in the Raman spectrum of several materials, and their main characteristic is the fact that they are the reflection of the phonon density of states of the material with double the original frequency. This means that their position does not change with the laser energy in contrast to double resonance bands. A recent theoretical work for silicon has shown that the Raman intensity of the second-order bands are highly affected by the many-body effects that come into play [Reference Gillet, Kontur, Giantomassi, Draxl and Gonze98]. Thus, the second-order bands are greatly enhanced when the laser energy matches the electronic transition of the material. The difference between second-order and double resonance bands, however, can be observed when several laser lines are used to measure the Raman spectra close to the electronic transition, revealing the pattern where the dispersion of the bands can be observed.
Several works have reported the study of the double resonance process in TMDs [Reference Liu, Guo, Yang, Zhang, Kumamoto, Shen, Hsu, Li, Saito and Kawata47, Reference Guo, Yang, Yamamoto, Zhou, Ishikawa, Ueno, Tsukagoshi, Zhang, Dresselhaus and Saito48, Reference Carvalho, Wang, Mignuzzi, Roy, Terrones, Fantini, Crespi, Malard and Pimenta50, Reference Liu, Siregar, Hasdeo, Kumamoto, Shen, Cheng, Li, Saito and Kawata63, Reference Gaur, Sahoo, Scott and Katiyar95, Reference Wang, Glazov, Robert, Amand, Marie and Urbaszek99, Reference Liu, Yang, Tatsumi, Zhang, Dong, Guo, Zhang, Kumamoto, Li, Li, Saito and Kawata100]. These reports show that the double resonance bands observed in TMDs are mostly due to intervalley scattering. As it can be seen in Fig. 4(b), the peak at around 460 cm−1 associated with a double resonance band is asymmetric and its shape strongly depends on the excitation laser energy and number of layers, thus more than one process may be participating in this band [Reference Ferrari and Basko3, Reference Venezuela, Lazzeri and Mauri35, Reference Cançado, Jorio, Ferreira, Stavale, Achete, Capaz, Moutinho, Lombardo, Kulmala and Ferrari43].
The first observation of a double resonance band in bulk MoS2 was reported by Sekine et al. in 1984, where the authors observed a dispersive Raman feature named as “b” band located at approximately 420 cm−1 [Reference Sekine, Uchinokura, Nakashizu, Matsuura and Yoshizaki53]. This feature presented a high dispersion with the laser energy close to the A and B excitons. To explain such high dispersion, the authors proposed a mechanism considering a two-phonon scattering of one quasiacoustic phonon and an optical phonon, parallel to the c axis of the crystal [Reference Sekine, Uchinokura, Nakashizu, Matsuura and Yoshizaki53]. Similar mechanism was later proposed for the “b” band by taking into account the explanation of the anti-Stokes process [Reference Livneh and Sterer58]. However, these models were not compatible with the observed resonant Raman spectrum of a monolayer MoS2, which had a similar band but lacked a quasiacoustic phonon branch. Additionally, Chen et al. and later Stacy et al. reported another band in the resonant Raman spectrum of bulk MoS2 located at 460 cm−1, the intensity and shape of which strongly change as the excitation energy is tuned [Reference Stacy and Hodul54, Reference Chen and Wang96]. This band has been attributed to a combination of two LA phonons at the M point. Henceforth, few other works have tried to associate this band to different combinations of phonons [Reference Livneh and Spanier97, Reference Gołasa, Grzeszczyk, Leszczyński, Faugeras, Nicolet, Wysmołek, Potemski and Babiński101], but none of these works presented a satisfactory explanation of the origin of this band.
Using what we saw for graphene, we can start to propose a better explanation based not only on the rules observed, but also on other known features of the TMDs, such as their phonon dispersion and electronic structure. Considering an electron–electron two-phonon intervalley scattering from K to K′ in the conduction band of MoS2, we can ask which phonons could participate in such process. Since, from graphene, the phonons must present strong interaction with the electron, we can suppose that the phonons involved in the intervalley scattering must be acoustic phonons, due to the strong correlation between the excitonic transitions in MoS2 and the acoustic phonons [Reference Zeng, Dai, Yao, Xiao and Cui102, Reference Mak, He, Shan and Heinz103, Reference Kioseoglou, Hanbicki, Currie, Friedman and Jonker104, Reference Dey, Paul, Wang, Stevens, Liu, Romero, Shan, Hilton and Karaiskaj105]. This is especially true since the phonon energy that we observe experimentally is very close to double the frequencies of the LA phonons in the K and M points [Fig. 4(c)]. This means that there could be a double resonance process occurring that actually involves those phonons.
Using the train of thought above, it was proposed in Ref. Reference Carvalho, Wang, Mignuzzi, Roy, Terrones, Fantini, Crespi, Malard and Pimenta50 a model based on theoretical and experimental results to explain the origin of both b and 2LA bands [see Figs. 4(d) and 4(e)] [Reference Carvalho, Wang, Mignuzzi, Roy, Terrones, Fantini, Crespi, Malard and Pimenta50]. The authors have performed resonant Raman measurements across the A and B excitons levels on monolayer and bulk MoS2. By tracking the behavior on frequency and intensity of the b and 2LA Raman bands and calculating the on-resonance electrons and phonons that participate in the scattering process, it was shown that the b band could be associated with a combination of phonons from the LA and TA phonon branches around the K point due to a double resonance electron–electron intervalley scattering process, i.e., LA + TA(∼K). This process is analogous to the D + D″ band in graphene, where two different phonons with the same wavevector participate in the electron scattering process.
As for the 2LA band, the authors deconvoluted this broad band by a set of Lorentzian peaks and showed that it is composed of at least three components that can be highlighted: two double resonance bands and one second-order band [see Fig. 4(d)]. The two double resonance features are associated with the electron scattering by two LA phonons at the proximities of the K and M points, which were assigned as 2LA(∼K) and 2LA(∼M) located around 460 cm−1 and 470 cm−1, respectively. The second-order mode is located at 452 cm−1 related to a singularity in the phonon density of states present due to a saddle point in the LA phonon branch between the K and M points. The above assignment was proposed due to the analysis of the observed difference in intensity band from bulk to monolayer, where the 2LA(∼M) phonon has higher contribution in few layers and bulk than in monolayer since this process is mediated by the indirect band gap [Reference Shi, Lin, Tan, Qiao, Zhang and Tan49, Reference McDevitt, Zabinski, Donley and Bultman56].
The frequency position of 2LA(∼K) and 2LA(∼M) decreases as the laser energy increases, this negative dispersive behavior is contrary to the observed for the 2D band of graphene but resembles the behavior of the D + D″ band. The negative dispersion is a result of the wavevectors that are accessed by the excited electron as it is scattered from K to K′ points. The frequency of the LA branch decreases for wavevectors further from the K or M points [Fig. 4(b)], which will both contribute to the double resonance bands, hence resulting in a negative dispersion. To this date, the dispersive behavior in TMDs has only been reported for semiconducting MoS2 [Reference Carvalho, Wang, Mignuzzi, Roy, Terrones, Fantini, Crespi, Malard and Pimenta50].
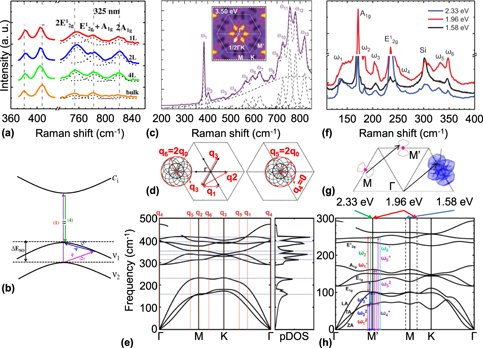
Some works have reported the study of the Raman spectrum of MoS2 in the UV range to gain further information about other high-order resonance processes. Sun et al. observed that the Raman spectrum of MoS2 in bulk, monolayer, bilayer and trilayer samples, collected with an excitation energy of 3.81 eV [see Fig. 5(a)], presents three strong bands in the 750 to 840 cm−1 spectral range, which were associated to combinations of E2g and A1g modes [Reference Sun, Yan, Zhan, Liu, Hu, Li, Tay, Kuo, Huang, Hewak, Lee and Shen11]. It was proposed that these bands are originated by a triply resonant hole–hole Raman scattering process, where the hole would be scattered from the bottom of the spin–orbit split at the valence band to the top valence band and later recombines with the electron [see Fig. 5(b)]. Liu et al. have observed the presence of several new peaks between 560 and 820 cm−1 spectral range in the Raman spectrum of monolayer MoS2 collected with a 3.50 eV laser energy [Reference Liu, Guo, Yang, Zhang, Kumamoto, Shen, Hsu, Li, Saito and Kawata47] [see Fig. 5(c)]. The observed bands were related to intervalley scatterings between points at half way from Γ to K, where the absorption of this laser energy is strongest according to the theoretical calculations reported [see inset of Figs. 5(c) and 5(d)]. The observed phonons were associated with their correct wavevectors in the phonon dispersion [see Fig. 5(e)] [Reference Liu, Guo, Yang, Zhang, Kumamoto, Shen, Hsu, Li, Saito and Kawata47]. A similar study has also been done recently for WS2 [Reference Liu, Yang, Tatsumi, Zhang, Dong, Guo, Zhang, Kumamoto, Li, Li, Saito and Kawata100].
Double resonance Raman bands above the excitonic transitions. (a) Raman spectrum of monolayer, bilayer, trilayer, and bulk MoS2 collected with a UV laser of 3.81 eV. (b) Proposed triple resonance process. (a) and (b) Reprinted with permission from Ref. Reference Sun, Yan, Zhan, Liu, Hu, Li, Tay, Kuo, Huang, Hewak, Lee and Shen11. (c) Raman spectrum of monolayer MoS2 collected with a UV laser of 3.50 eV. The inset shows the calculated absorption probability for this laser energy. (d) Proposed scattering process near the Γ point responsible for the observed Raman bands in (c). (e) Complete phonon dispersion of MoS2 with the different contributions of the double resonance bands in (c) and (d) ascribed to their respective points in the Brillouin zone. (c–e) Reprinted with permission from Ref. Reference Liu, Guo, Yang, Zhang, Kumamoto, Shen, Hsu, Li, Saito and Kawata47. (f) Raman spectra of monolayer MoTe2 collected for three laser energies. (g) Proposed electron scattering near the M points for a laser energy of 1.96 eV. (h) Phonon dispersion of MoTe2 with observed contributions to the Raman spectra from the three laser energies ascribed to their respective points in the Brillouin zone. (f–h) Reprinted with permission from Ref. Reference Guo, Yang, Yamamoto, Zhou, Ishikawa, Ueno, Tsukagoshi, Zhang, Dresselhaus and Saito48.

Guo et al. have investigated the Raman spectra of MoTe2 using three laser lines of energy 1.58, 1.96, and 2.33 eV [Reference Guo, Yang, Yamamoto, Zhou, Ishikawa, Ueno, Tsukagoshi, Zhang, Dresselhaus and Saito48] [see Fig. 5(f)]. A set of new Raman bands was observed and associated with intervalley scattering between the proximities of M point [see Fig. 5(g)]. The contribution of each laser energy to the observed bands was calculated and connected to their correct wavevectors [see Fig. 5(h)]. Although these works are promising, they are still in infancy because further probe by tuning the excitation laser energy and number of layers (that helps to unveil the Raman scattering process) needs to the performed for the 2D family.
Most of the works in the literature investigate the Raman spectrum of TMDs by tuning the excitation laser energy to probe the resonance effects. However, a closer inspection at the Raman intensity equations [see Eqs. (1) and (2)] can provide more insightful thoughts regarding the Raman scattering process. The intensity can be tuned not only by changing the excitation laser energy, but also by changes in the excitonic transition energy itself. Such changes in the excitonic transition energy can be achieved, for example, by in situ variation of the sample’s temperature or pressure. For instance, tuning the exciton energy for bulk MoS2, either by temperature or pressure changes, affects the double resonance processes just like if the excitation laser energy is being tuned [Reference Livneh and Sterer58]. Recent works on monolayer MoS2 have shown that under temperature variation the frequency position of the double resonance LA + TA(∼K) band (i.e., the b band) disperses by a rate of (Δω/ΔT)b = 0.035 cm−1/K, while the first-order A′1 mode disperses  ${\left( {{{\Delta \omega } / {\Delta T}}} \right)_{{{{\rm{A'}}}_{\rm{1}}}}}$ = 0.008 cm−1/K [Reference Kutrowska-Girzycka, Jadczak and Bryja52]. This represents a dispersive rate ratio of around 4.4 times between the double resonance and first-order bands, which is a good indicative of changes in the excitonic effects leading to the strongly dispersive behavior of the b band.
We end this section reminding that the strong enhancement of the double resonance Raman bands in MoS2-like TMDs comes from the resonance with the excitonic transitions. Therefore, out of resonance, the Raman bands should show little intensity, and would barely be observable, which is the case shown in Fig. 4(b), where we compare the spectra of monolayer MoS2 at a laser far from resonance (2.41 eV) and a laser very close to resonance with the A exciton (1.96 eV). These are important considerations because in the next section we will discuss defects in 2D systems, and resonance with the electronic levels of the material is fundamental to measure the contributions of defect-induced bands to the Raman spectra.
Probing defects in 2D systems
Controlling defects in materials is of utmost importance for the development of technology due to its role on tuning the doping concentration or carrier types, reducing contact resistance in electronic devices, and improving the responsivity, speed, and operation wavelength of photodetectors in novel optoelectronic devices, such as photodetectors and LEDs [Reference Hu, Wu, Han, He, Ni and Chen60]. Therefore, a quantitative way to control the density of defects in 2D materials is a key ingredient to the development of 2D materials technology. In this aspect, Raman spectroscopy is a simple and nondestructive tool that allows the characterization and quantification of defects in 2D materials.
Defects can be generated either during (in situ defects) or after (ex situ defects) the synthesis process [Reference Lin, Carvalho, Kahn, Lv, Rao, Terrones, Pimenta and Terrones59], where the latter is extended to exfoliated samples. Several kinds of in situ defects can be generated such as vacancies of chalcogens and metals (usually accompanied with their bonds) in TMDs, antisites, grain boundaries, edges, and line defects [Reference Zhou, Zou, Najmaei, Liu, Shi, Kong, Lou, Ajayan, Yakobson and Idrobo106]. These in situ defects are not controllable. However, ex situ defects can be created in a controllable way due to the improvement of the defect engineering in 2D materials. For example, electron beam irradiation [Reference Wu, Luo, Shen, Zhao, Wang, Nan, Guo, Sun, Wang, You and Ni107, Reference Parkin, Balan, Liang, Das, Lamparski, Naylor, Rodríguez-Manzo, Johnson, Meunier and Drndić108] and ion (Mn+ and Ar+) bombardment [Reference Mignuzzi, Pollard, Bonini, Brennan, Gilmore, Pimenta, Richards and Roy62, Reference Wu, Zhao, Jiang, Zheng, You, Lu and Ni109] have been used to create chalcogen vacancies in TMDs, where the distance among vacancies can be controlled by the beam dosage. The same approach can also be used to create MoS2 nanocrystallites [Reference Shi, Zhang, Li, Qiao, Wu, Zhang and Tan110]. Additionally, the introduction of vacancies by electron irradiation can be followed by doping [Reference Komsa, Kotakoski, Kurasch, Lehtinen, Kaiser and Krasheninnikov111]. Indeed, oxygen substitution of chalcogenides may occur in normal ambient conditions despite the slow rate of the reaction and difficulties to be controlled [Reference Lu, Carvalho, Chan, Liu, Liu, Tok, Loh, Castro Neto and Sow112]. However, oxygen passivation of chalcogen vacancies using laser annealing has been performed in WSe2 as an alternative, improving its conductivity and photoconductivity [Reference Lu, Carvalho, Chan, Liu, Liu, Tok, Loh, Castro Neto and Sow112]. Besides, doping by potassium [Reference Fang, Tosun, Seol, Chang, Takei, Guo and Javey113] was achieved before theoretical studies for alkali metals (Li, K, and Cs) doping in TMDs [Reference Dolui, Rungger, Das Pemmaraju and Sanvito114] while lithium doping has been recently done [Reference Saigal, Wielert, Čapeta, Vujičić, V Senkovskiy, Hell, Kralj and Grüneis115]. All this shortly highlights the importance to probe defects in 2D materials. Hence, in the following, we briefly comment the study of defects in graphene and semiconducting TMDs by Raman spectroscopy, which allows to probe and understand the defects scattering in 2D systems.
Defects in graphene
Defects allow the appearance of new features in the Raman spectrum of graphene considering that the defect density increases up to a certain threshold, as shown in Fig. 6(a). The defect density is related to the fluence of ions into the samples (in order of 1011 to 1014) [Reference Asari, Kamioka, Nakamura, Kawabe, Lewis and Kitajima116], but most works in the literature quantify the amounts of defects by the average defect distance (L D), given by  ${L_{\rm{D}}} = {1 / {\sqrt \eta }}$, where η is the defect density [Reference Ferrari and Basko3, Reference Venezuela, Lazzeri and Mauri35, Reference Cançado, Jorio, Ferreira, Stavale, Achete, Capaz, Moutinho, Lombardo, Kulmala and Ferrari43, Reference Mignuzzi, Pollard, Bonini, Brennan, Gilmore, Pimenta, Richards and Roy62, Reference Lucchese, Stavale, Ferreira, Vilani, Moutinho, Capaz, Achete and Jorio70, Reference Martins Ferreira, Moutinho, Stavale, Lucchese, Capaz, Achete and Jorio71, Reference Eckmann, Felten, Mishchenko, Britnell, Krupke, Novoselov and Casiraghi72]. The reason for this choice is because it provides a direct correlation between defects and their effects on the Raman spectrum. The Raman spectrum of a defective graphene sample presents three new features assigned as D, D′, and D + D′ bands, as it is shown in [see Fig. 6(a)] [Reference Cançado, Jorio, Ferreira, Stavale, Achete, Capaz, Moutinho, Lombardo, Kulmala and Ferrari43]. These new Raman bands are the result of intervalley, intravalley, and combination of both processes where the conservation of momentum is preserved by the presence of a defect.
One-phonon defect Raman spectrum of a defective graphene. (a) Raman spectrum of monolayer graphene for different values of interdefect distance (L D) collected with a 2.41 eV laser. (b) Intensity ratio of D to G band multiplied by the fourth power of the laser energy as a function of interdefect distance. Reprinted with permission from Ref. Reference Cançado, Jorio, Ferreira, Stavale, Achete, Capaz, Moutinho, Lombardo, Kulmala and Ferrari43.

In Fig. 6(a), we can notice that the D band is the most intense one of the defective Raman features in graphene. It has half the frequency of the 2D band and shows a dispersive behavior as the excitation laser energy is tuned [Reference Cançado, Jorio, Ferreira, Stavale, Achete, Capaz, Moutinho, Lombardo, Kulmala and Ferrari43]. Additionally, the D band also depends on the average defect distance, L D, because its intensity increases as the L D value decreases [see Fig. 6(a)]. Notice that D band intensity can even surpass the G band intensity. The intensity ratio of both bands (I D/I G) provide a route to characterize the sample quality [see Fig. 6(a)] [Reference Cançado, Jorio, Ferreira, Stavale, Achete, Capaz, Moutinho, Lombardo, Kulmala and Ferrari43]. The relationship between of the I D/I G intensity ratio can be expressed as a function of L D given by [Reference Cançado, Jorio, Ferreira, Stavale, Achete, Capaz, Moutinho, Lombardo, Kulmala and Ferrari43, Reference Lucchese, Stavale, Ferreira, Vilani, Moutinho, Capaz, Achete and Jorio70]
 $${{{I_{\rm{D}}}} \over {{I_{\rm{G}}}}} = {C_{\rm{A}}}{{\left( {r_{\rm{A}}^2 - r_{\rm{S}}^2} \right)} \over {\left( {r_{\rm{A}}^2 - 2r_{\rm{S}}^2} \right)}}\left[ {\exp \left( { - \pi {{r_{\rm{S}}^2} \over {{L_{\rm{D}}}}}} \right) - \exp \left( { - \pi {{r_{\rm{A}}^2} \over {{L_{\rm{D}}}}} + \pi {{r_{\rm{S}}^2} \over {{L_{\rm{D}}}}}} \right)} \right]\quad ,$$
where r A and r S are length scales related to either the regions that contribute to the scattering of the electron to form the D band or to the disorder caused by defect formation. C A is a weight parameter that depends on the laser energy. By Eq. (3), it is possible to observe the behavior of the intensity of the D band as a function of both laser energy and defect length. A laser-independent relationship can also be obtained by multiplying the left side of Eq. (3) by E L4, as it is shown in Fig. 6(b) [Reference Cançado, Jorio, Ferreira, Stavale, Achete, Capaz, Moutinho, Lombardo, Kulmala and Ferrari43]. This new expression allows to monitor and control the defect density in graphene for its applications, independently of the laser line used.
It is worthy of note that after the threshold of the defect amounts is reached, i.e., the L D is considerably small, there is a change in the crystallinity of the sample becoming increasingly rich in sp 3 amorphous carbon [Reference Ferrari and Basko3, Reference Cançado, Jorio, Ferreira, Stavale, Achete, Capaz, Moutinho, Lombardo, Kulmala and Ferrari43]. At this point, several changes in the Raman spectrum are observed, including broadening and asymmetry of the bands, shifts in frequency of the first-order modes, among others [Reference Ferrari and Basko3, Reference Cançado, Jorio, Ferreira, Stavale, Achete, Capaz, Moutinho, Lombardo, Kulmala and Ferrari43, Reference Lucchese, Stavale, Ferreira, Vilani, Moutinho, Capaz, Achete and Jorio70, Reference Martins Ferreira, Moutinho, Stavale, Lucchese, Capaz, Achete and Jorio71].
Defects in TMDs
As in graphene, the presence of defects can also impact the Raman spectrum of TMDs. However, the impact in TMDs is far less sensitive than those observed for graphene. For graphene, the D band can be directly observed in the Raman spectrum with L D up to 25 nm [Reference Cançado, Jorio, Ferreira, Stavale, Achete, Capaz, Moutinho, Lombardo, Kulmala and Ferrari43, Reference Lucchese, Stavale, Ferreira, Vilani, Moutinho, Capaz, Achete and Jorio70]. Graphene is always in resonance on the NIR and most of the visible range; thus, most of the double resonance processes involving defects are fairly strong, in special when the L D is low enough that we can expect a big enhancement of the defect-induced bands. For semiconducting TMDs, unless the sample is resonantly excited [Reference Shi, Lin, Tan, Qiao, Zhang and Tan49, Reference Carvalho, Wang, Mignuzzi, Roy, Terrones, Fantini, Crespi, Malard and Pimenta50] across the excitonic transitions, the disorder-induced bands can be barely observed. These bands are associated to the acoustic branches and can only be observed when a small L D is reached, meaning a high defect density [Reference Shi, Lin, Tan, Qiao, Zhang and Tan49, Reference Mignuzzi, Pollard, Bonini, Brennan, Gilmore, Pimenta, Richards and Roy62, Reference Shi, Zhang, Li, Qiao, Wu, Zhang and Tan110].
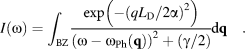
As the size of the analyzed crystal decreases, the selection rule for zone center phonons can be dropped. Therefore, a new domain size where L D needs to be accounted for must be considered for confinement effects. The uncertainty principle states that the momentum uncertainty of the electron will be proportional to (L D)−1, which will involve phonons away from the Γ point. As a result, the shape of the Raman bands changes from a regular Lorentzian, related to a forced, damped harmonic oscillator, to a broader and asymmetric shape. This new shape can be described by a weighted sum over all the phonons in the Brillouin zone within a Gaussian distribution related to the mean defect distance [Reference Mignuzzi, Pollard, Bonini, Brennan, Gilmore, Pimenta, Richards and Roy62, Reference Shi, Zhang, Li, Qiao, Wu, Zhang and Tan110],
 $$I\left( \omega \right) = \int_{{\rm{BZ}}} {{{\exp \left( { - {{\left( {{{q{L_{\rm{D}}}} / {2\alpha }}} \right)}^2}} \right)} \over {{{\left( {\omega - {\omega _{{\rm{Ph}}}}\left( {\bf{q}} \right)} \right)}^2} + \left( {{\gamma / 2}} \right)}}} {\rm{d}}{\bf{q}}\quad .$$
The α parameter is a constant that relates the mean defect distance to the phonon confinement length by defects or microcrystalline size, ωPh (q) is the phonon branch frequency, and γ is a broadening factor that increases as the defect mean distance decreases. Notice that as L D increases to infinity (for pristine samples), the usual Raman line shape of a Lorentzian is recovered. This model can be used to describe the disorder in several systems other than TMDs, as it has already been used for graphene and graphite [Reference Martins Ferreira, Moutinho, Stavale, Lucchese, Capaz, Achete and Jorio71, Reference Asari, Kamioka, Nakamura, Kawabe, Lewis and Kitajima116], silicon [Reference Richter, Wang and Ley117, Reference Campbell and Fauchet118], and GaAs [Reference Ishioka, Nakamura and Kitajima119].
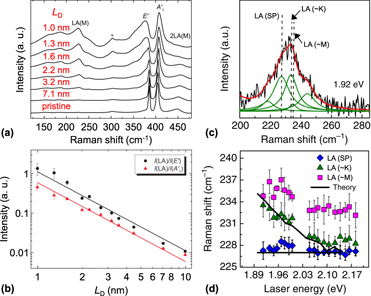
The first-order bands are also affected by increasing the disorder density. The effects observed are frequency shifts and an increased broadening in contrast to pristine samples. Figure 7(a) shows the nonresonant Raman spectrum of semiconducting MoS2 monolayers with different L D. We can clearly observe how the first-order E′ and A1′ modes are altered. A new peak associated with the defect-induced LA mode is also observed [Reference McDevitt, Zabinski, Donley and Bultman56, Reference Frey, Tenne, Matthews, Dresselhaus and Dresselhaus57]. This defect-induced peak is located at around 230 cm−1, half the frequency of the 2LA band [Reference McDevitt, Zabinski, Donley and Bultman56, Reference Frey, Tenne, Matthews, Dresselhaus and Dresselhaus57].
Phonon–defect Raman spectrum of monolayer MoS2. (a) Raman spectrum of monolayer MoS2 for different values of interdefect distances collected with a 2.41 eV laser. (b) Intensity ratio between LA band and the A1′ and E′ bands. The observed line is a fit with a curve proportional to (L D)−2. Reprinted with permission from Ref. Reference Mignuzzi, Pollard, Bonini, Brennan, Gilmore, Pimenta, Richards and Roy62. (c) Deconvolution of the defective LA band in monolayer MoS2. (d) Frequencies of the LA band components in (c) as a function of the laser energy. Reprinted with permission from Ref. Reference Carvalho, Wang, Mignuzzi, Roy, Terrones, Fantini, Crespi, Malard and Pimenta50.

The shift and increased broadening observed in the Raman spectrum of MoS2 are related to a smaller phonon correlation length L C, which is a measure of the phonon confinement by defects or microcrystallite size and it is proportional to the L D parameter. Similar to graphene, the intensity ratio of the disorder-induced LA band and the first-order modes A1′ and E′, i.e., I LA/I A1′ and I LA/I E′, can provide a way to quantify the amounts of defects [see Fig. 7(b)] [Reference Mignuzzi, Pollard, Bonini, Brennan, Gilmore, Pimenta, Richards and Roy62]. This has also been observed by Li-doped MoS2 monolayer samples, where the LA band is rapidly intensified for increasing lithium exposure time [Reference Saigal, Wielert, Čapeta, Vujičić, V Senkovskiy, Hell, Kralj and Grüneis115].
One important remark is that the disorder-induced LA band is composed by at least three components: LA(∼K), LA(∼M), and a band associated to a singularity from the phonon density of states [Fig. 7(c)]. The peak position of these Raman bands presents half the frequency of the bands composing the 2LA band. Therefore, the LA(∼K) and LA(∼M) modes also present a dispersive behavior with the excitation laser energy, following a similar trend as the dispersive two-phonon features composing the 2LA band [Reference Carvalho, Wang, Mignuzzi, Roy, Terrones, Fantini, Crespi, Malard and Pimenta50]. The observation of these three components in the defect-induced LA band, and the fact that these components present half of the calculated dispersion of the 2LA(∼K) and 2LA(∼M) bands, further strengthens the intervalley double resonance scattering model claim proposed in Ref. [Reference Carvalho, Wang, Mignuzzi, Roy, Terrones, Fantini, Crespi, Malard and Pimenta50] for semiconducting MoS2 [see Fig. 7(d)].
To our knowledge, such detailed analysis of the double resonance process in defective TMDs sample was only explored for the MoS2. Recently, however, it was reported the presence of two new bands in the tip-enhanced Raman spectrum of a defective WS2 sample, called D and D′ [Reference Lee, Jeong, Yun, Lee, Lee and Jeong120]. The appearance of these new bands was related to an increased number of sulfur vacancies, and the D band was associated with the A1’ phonon branch. The D′ band was associated with the infrared-active A2″ [Reference Lee, Jeong, Yun, Lee, Lee and Jeong120]. This study, however, was a single laser line study of the Raman spectrum of WS2 and the only one so far about this material where defect-induced bands appear.
There are a few other works that have measured the contribution of the defect-induced bands in the Raman spectrum of semiconducting TMDs [Reference Shi, Lin, Tan, Qiao, Zhang and Tan49, Reference Mignuzzi, Pollard, Bonini, Brennan, Gilmore, Pimenta, Richards and Roy62, Reference Shi, Zhang, Li, Qiao, Wu, Zhang and Tan110]. These works reported changes to the observed spectra related to different wavevectors accessed by the high density of defects present in the samples. More importantly, they have observed mainly changes around the first-order modes, which means that the main contributions are related to optical phonons.
Conclusion and perspectives
In this review, we have discussed the double resonance Raman bands in 2D materials. We have focused on the state-of-the-art 2D materials: graphene and semiconducting MoS2. We have explained the most pronounced bands that arise from the electron–electron, electron–hole, and hole–hole intravalley and intervalley scattering process. These scattering processes allow phonons at the Brillouin zone edge to participate in the scattering where the momentum conversation is preserved by a two-phonon or one-phonon defect process. Such processes allow the observation of the D, D′, D + D″, 2D, and 2D′ Raman bands of graphene mediated by phonons at the vicinity of the K and Γ points, whereas the electron–electron intervalley scattering allows the observation of the LA, b, and 2LA Raman bands in MoS2 mediated by phonons near the K and M Brillouin zone edge points.
There are other few works on the study of the double resonance Raman bands in other TMDs providing insights on the scattering process. However, up to this date, the detailed analysis of the double resonance Raman process has been described only for the semiconducting MoS2. The latter has shown that a more in-depth resonant Raman study for the other materials is still needed to properly observe the possible double resonance contributions in the Raman spectrum of the other TMDs. In particular, the study of other classes of TMDs is lacking, especially those with high anisotropic optical properties such as ReS2 and ReSe2 [Reference McCreary, Simpson, Wang, Rhodes, Fujisawa, Balicas, Dubey, Crespi, Terrones and Hight Walker121, Reference Wolverson, Crampin, Kazemi, Ilie and Bending122]. It could be very interesting to observe the possible behavior of double resonance bands of these materials, even though their optical transitions are very far from the most common lasers used in the collection of the Raman spectrum at 1.3–1.5 eV [Reference McCreary, Simpson, Wang, Rhodes, Fujisawa, Balicas, Dubey, Crespi, Terrones and Hight Walker121, Reference Wolverson, Crampin, Kazemi, Ilie and Bending122].
A recent study of bulk black phosphorous has observed the presence of several small intensity bands, which were ascribed to two-phonon bands [Reference Wang, Mao, Luo, Kitadai and Ling123]. The intensity of these bands reaches a maximum close to a laser energy of 2.4 eV, indicating a presence of an electronic transition [Reference Wang, Mao, Luo, Kitadai and Ling123]. It remains to be seen whether the same effect will be visible in single layer or even few layers samples. One study has observed the presence of new bands in defective monolayer and few layers of black phosphorus, which were assigned to phonon–defect intravalley processes [Reference Favron, Goudreault, Gosselin, Groulx, Côté, Leonelli, Germain, Phaneuf-L’Heureux, Francoeur and Martel124]. Although, in comparison with graphene, more works should be done to assess some other possible effects that could be present.
The emerging of new 2D materials shows that the field on double resonant Raman process is still in progress and more work needs to be done for a deeper understanding of the underlying physics of the double resonance process in other materials. The double resonance Raman mechanism provides important information for the understanding of the photophysics of 2D materials, the quantification of defects, and to describe the intervalley and intravalley scattering of electrons essential for the development of the spintronics and valleytronics.
Acknowledgments
The authors acknowledge the final support from the Instituto Nacional de Ciência e Tecnologia (INCT) em Nanomateriais de Carbono (Federative Republic of Brazil), Coordenação de Aperfeiçoamento de Pessoal de Nível Superior (CAPES, Federative Republic of Brazil), Conselho Nacional de Desenvolvimento Científico e Tecnológico (CNPq, Federative Republic of Brazil), and Fundação de Amparo à Pesquisa do Estado de Minas Gerais (FAPEMIG, Federative Republic of Brazil).