Introduction
Precision viticulture (PV) frequently aims at establishing within-vineyard differential management, in order to meet the real needs of each area (Arnó et al., Reference Arnó, Martinez-Casasnovas, Ribes-Dasi and Rosell2009). Vineyards are generally characterized by high heterogeneity due to structural (or static) factors mediated by topography and soil characteristics, and to non-structural (or dynamic) factors, mediated by crop practices. Adjusting management to spatial variability is always relevant, as it increases input efficiency. However, in wine grapes, this adjustment provides an additional benefit, as it allows obtaining more homogeneous grape batches at harvest, which constitutes by itself a quality factor (Urretavizcaya et al., Reference Urretavizcaya, Santesteban, Tisseyre, Guillaume, Miranda and Royo2014; Kontoudakis et al., Reference Kontoudakis, Esteruelas, Fort, Canals, De Freitas and Zamora2011). As a consequence, a great effort has been made lately to better understand this variability, and recent technological developments and tools have been tested to monitor many aspects of vineyard performance.
Remote sensing technologies have been successfully used for vineyard monitoring, and several experiments have shown that vegetation indices could be useful to characterize variability within vineyards (Johnson, Reference Johnson2003; Bramley et al., Reference Bramley, Ouzman and Boss2011; Santesteban et al., Reference Santesteban, Guillaume, Royo and Tisseyre2013). Unmanned Aerial Vehicles (UAV) have been recently used to remote sensing of vineyards, as they provide high flexibility of use, low operational costs and very high spatial resolution (Matese et al., Reference Matese, Toscano, Di Gennaro, Genesio, Vaccari, Primicerio, Belli, Zaldei, Bianconi and Gioli2015).
Similarly, as traditional remote sensing technologies based on satellite platforms are improving in terms of spatial and temporal resolution, they are becoming more suitable for PV applications. For instance, Sentinel-2 MSI (12 January 2016, orbit R051) can be a very useful tool as it can map large areas at the same time, but it still may have a too low resolution for PV, and may suffer from cloud cover and from constraints in relating imagery timing to specific growth stages because of the fixed-timing acquisitions. Sentinel-2 has already been used successfully for vegetation classification (Immitzer et al., Reference Immitzer, Vuolo and Atzberger2016), burn severity discrimination (Fernández-Manso et al., Reference Fernández-Manso, Fernández-Manso and Quintano2016), water body mapping (Du et al., Reference Du, Zhang, Ling, Wang, Li and Li2016) and agronomic practice detection (Novelli et al., Reference Novelli, Aguilar, Nemmaoui, Aguilar and Tarantino2016).
In this context, it is very relevant to explore to which extent image resolution may limit the use of applications based on satellite imagery (vs. UAV). Due to their high resolution, images acquired from UAVs allow pure canopy pixel filtering, and can therefore allow the extraction of vine row pixel information, with nearly no soil interference, which is impossible when using satellite images. The aim of this work was to evaluate different source of images and processing methodologies to describe spatial variability of spectral-based and canopy-based vegetation indices within a vineyard, and their relationship with productive and qualitative vine parameters.
Materials and methods
Experimental site and agronomic characterization
The study was conducted during 2015 season in a mature 7.5 ha cv. ‘Tempranillo’ vineyard located in Traibuenas, Navarra, Spain (42°22’20.1“N 1°37’34.2”W, WGS84, Altitude: 328 m). Plants are trained to a bilateral cordon, vertical-shoot positioned, plant spacing is 3 m between rows and 1 m within the row, and bud load is fixed to six 2-bud spurs per plant.
The agronomical characterization was based on a sampling grid, comprised of 92 sampling points (SP), with a mean distance of 25×25 m between SP. At each SP, 10 vines were marked, and characterized agronomically, determining annual vegetative growth as the total shoot cross sectional area (SCSA) per vine, bunch number (BN), yield (Y), berry weight (BW) and total soluble solids (TSS). Details on measurement procedures can be found in Santesteban et al. (Reference Santesteban, Di Gennaro, Herrero-Langreo, Miranda, Royo and Matese2016).
Remote sensing data
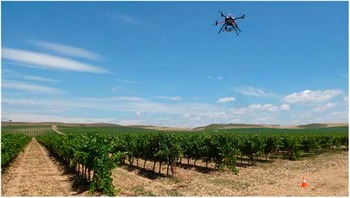
The information obtained with a UAV campaign and that provided by Sentinel-2 were compared. With regards to the UAV platform (Figure 1), it was a modified multi-rotor Mikrokopter OktoXL (HiSystems GmbH, Moomerland, Germany) described in detail in Santesteban et al. (Reference Santesteban, Di Gennaro, Herrero-Langreo, Miranda, Royo and Matese2016). The camera used to acquire multispectral images was the Tetracam ADC-Snap, described in Matese et al. (Reference Matese, Di Gennaro and Berton2016). The site was flown at 70 m above ground level at solar noon (28th July 2015), providing 5 cm/pixel ground image resolution. Camera settings were set to a fixed exposure with automatic trigger at 2s frequency. The waypoint route was generated to obtain 80% overlap both between images (forward overlap) and between flight lines (lateral overlap), in order to achieve the highest accuracy in the mosaicking step. The images were acquired during homogeneous and stable radiation conditions, under clear sky conditions and with no wind. Multispectral acquisition by the UAV was made between 13:00 to 14:30 h by means of five consecutive flights of 15 min each. A vicarious calibration based on the absolute radiance method was chosen, considering that digital number (DN) value for each pixel has a direct relationship (linear model) with the radiance detected by the sensor (Kelcey and Lucieer, Reference Kelcey and Lucieer2012). For this radiometric calibration processes, images from three OptoPolymer (OptoPolymer - Werner Sanftenberg, Munich, Germany) homogeneous and Lambertian surfaces panels, with 95%, 50% and 5% reflectance respectively, are acquired for each flight.
UAV (Unmanned Aerial Vehicle) system in flight.

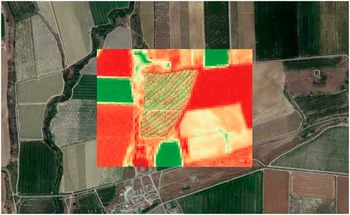
Sentinel-2 images were freely downloaded from the Copernicus Scientific Data Hub web site as a Level 1C (L1C) product. Sentinel-2 L1C product is characterized by Top of Atmosphere (TOA) reflectance values of 150 km2 orthoimages in UTM/WGS84 projection. The selected study area is comprised within the T30TXM granule (Figure 2). The date of image acquisition was 29th July 2015 at 11:00 a.m.
Superimposed layers of UAV, Sentinel-2 and Google EarthTM.

Data processing
Multispectral images acquired by UAV were mosaicked using Agisoft Photoscan Professional Edition 1.1.6 (Agisoft LLC, St. Petersburg, Russia) and then processed to characterize the field in terms of one vegetation index (NDVI) and of three canopy geometry variables: canopy width (CW), height (CH) and a volume index (VI). The steps included for image processing were as follows:
-
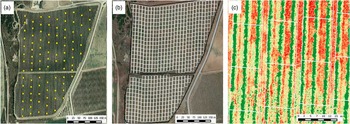
∙ Canopy geometry variables: first, a DEM (Digital Elevation Model) was generated using the procedure detailed in Matese et al. (Reference Matese, Di Gennaro and Berton2016) and then a rectangular 15×10 m polygon grid was defined. Polygons were defined in a way that guaranteed that they all included the same portion of three rows (Figure 3). For each polygon, average CW was calculated considering the number of pixels classified as canopy in the row extraction procedure, CH as the average value of DEM minus the minimum quote of DEM, and VI calculated as CW x CH.
-
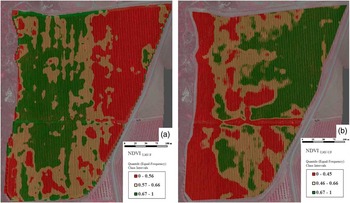
∙ A NDVI map was obtained directly from the original data without pure canopy pixel filtering, unfiltered (UF), using a 2×2 m block moving average, RED (630–690 nm) and NIR (Near Infrared; 760–900 nm) bands of Tetracam camera were used. This variable was labelled as NDVIUAV-UF, and the map obtained can be found in Figure 4a.
-
∙ Another NDVI map was obtained following the same moving average approach but using images once filtered (pure canopy pixel filtering) to the extract information corresponding to the rows. Filtering was done using the algorithm detailed in Santesteban et al. (Reference Santesteban, Di Gennaro, Herrero-Langreo, Miranda, Royo and Matese2016). This variable was labelled as NDVIUAV-F, and the map obtained is represented in Figure 4b.
Experimental vineyard: (a) Sampling points (b) Rectangular 15×10 m polygon grid (c) Part of the polygon grid in a higher scale.

Maps of NDVIUAV-F (a) and NDVIUAV-UF (b).

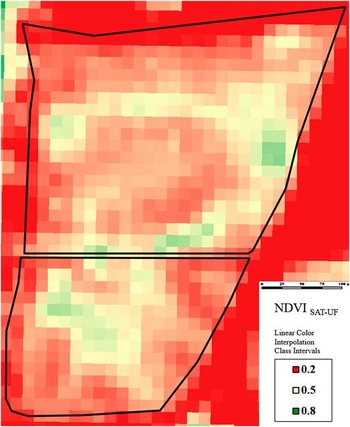
With regards to Sentinel-2 information, the Sen2Cor algorithm (Muller-Wilm, 2016) was used to obtain a Level 2 A (L2A) MSI product characterized by atmospherically corrected Bottom of Atmosphere (BOA) reflectance values (Figure 2). NDVI was calculated using NIR B8 band (842 nm) and RED B4 band (665 nm), obtained a 10-m spatial resolution map (Figure 5) for a this variable, labelled as NDVISAT-UF.
NDVI map derived from Sentinel2 (NDVISAT-UF).

Last, agronomic data were interpolated onto a 3×3 m grid using block kriging performed with VESPER software (Minasny, McBratney, and Whelen 2002). In our work, all variables were fitted to exponential models, taking as kriging parameters maximum distance=100 m, 30 lags and 50% of lag tolerance. In all cases, maps were represented grouping data in three classes defined using the terciles of each variable. The maps obtained after UAV, satellite and agronomic data analysis were compared visually in order to evaluate their degree of agreement.
Results and discussion
When the spatial distribution of the three NDVI variants considered in this work were compared, high resemblance could be observed for NDVISAT-UF and NDVIUAV-UF, whereas NDVIUAV-F showed a remarkably different pattern (Figures 4–5). Moreover, and quite surprisingly, patterns were often opposite, and low NDVI areas for the former corresponded to high NDVI areas for the latter.
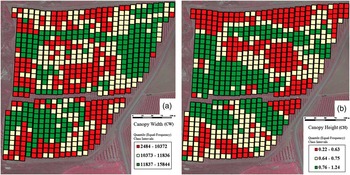
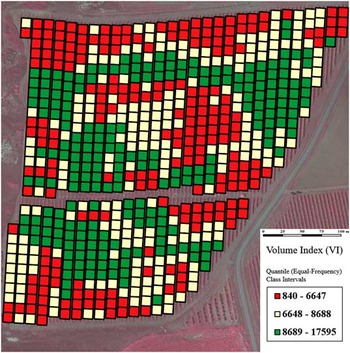
The spatial distribution pattern for the three canopy geometry variables derived from UAV imagery (CW, CH and VI) was similar (Figures 6–7). When compared to the spatial patterns of NDVI, canopy geometry variables showed similarity with NDVISAT-UF and NDVIUAV-UF, but not with NDVIUAV-F (Figures 6–7). The results above are a consequence of the fact that NDVI values extracted from low resolution or unfiltered image in row-structured discontinuous canopies, such as grape vines, mix in a single pixel information coming from both vegetation and soil. As a consequence, they are integrating two different, characteristics of the canopy: percent vegetation cover (related to canopy geometry and planting density) and canopy reflectance for R and NIR bands, intrinsically related to the physiological status of the leaves or to their greenness (Matese et al., Reference Matese, Toscano, Di Gennaro, Genesio, Vaccari, Primicerio, Belli, Zaldei, Bianconi and Gioli2015). According to our results, in this vineyard, the geometrical component appears to play a preponderant role to determine NDVI in the unfiltered maps (NDVIUAV-UF and NDVISAT-UF), as their patterns clearly resembled to those of canopy geometry variables, and differed from the filtered, intrinsic, NDVI value (NDVIUAV-F).
Maps of canopy width (CW) (a) and canopy height (CH) (b).

Map of Volume Index (VI).

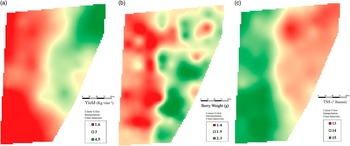
When pixels include soil and plant information, some information is lost, as the two components included in a mixed pixel (canopy occupation of the space and canopy physiological status) are not necessarily related. For instance, in mixed pixels, it is possible to have relatively high NDVI values in plants with wide canopies but with relatively damaged leaves, or to observe relatively high NDVI values in narrower canopies but with more active and undamaged leaves. The relevance of this loss of information needs therefore to be evaluated To do so, in preliminary way, the two spatial patterns obtained for image-derived variables were compared to the spatial distribution of agronomic variables (Figure 8). From visual comparison of the maps, it can be seen that the areas with higher NDVIUAV-F tended to show lower yield and BW and higher TSS, whereas for unfiltered NDVI variants and of geometry variables, the behavior was in general the opposite, although patterns were not as coincident.
Spatial distribution of agronomic variables: a) yield, b) BW and c) TSS.

The results obtained are a direct consequence of the fact, already highlighted, that when in discontinuous, row-structured canopies no filtering to extract the rows is done, it is not possible to discriminate the NDVI component related to canopy geometry from that more intrinsic, derived directly from leaf reflectance. In this particular vineyard, as already described in Santesteban et al. (Reference Santesteban, Di Gennaro, Herrero-Langreo, Miranda, Royo and Matese2016) where water status dynamics in this field were analyzed in detail, some areas such as that in the top-right, develop a bigger canopy in spring and, therefore, agree to the higher values observed therein for unfiltered NDVI and canopy geometry variables. However, as the season continues, that part of the field, having greater water needs (linked to higher leaf area and to a higher fruit load), suffers earlier and more intense water deficit. This fact is not reflected in the unfiltered NDVI values, as its value was proved to be more related to canopy geometry, but it was clearly observed in NDVIUAV-F, as lower NDVIUAV-F values were found in parts of the field where plants were suffering greater water stress. From an agronomical point of view, this resulted in lower TSS in those areas, a consequence of higher fruit load and water deficit.
Our results also highlight that using UAV imagery to obtain only filtered NDVI maps in discontinuous row-structured crops can also lead to information loss and even to misinterpretations. Thus, this approach only would provide information with regards to the physiological status of the leaves, and would miss valuable data related to canopy size and geometry, very relevant from the agronomic point of view.
Conclusion
The UAV system developed is a low-cost solution, open source and fully customizable and can meet the needs of precision viticulture in terms of remote sensing. These results may shed some light on how the mixed-pixel (soil and rows) information provided by lower resolution images cannot discriminate if a low vegetation index is a consequence of low vigour, low photosynthetic performance, or of a combination of both. Moreover, higher resolution (UAV) images allow calculation of new non-spectral indices based on canopy architecture that provide additional and useful information to the growers with regards to within-vineyard management zone delineation.
Acknowledgements
This research was supported by the Industry Department of the Government of Navarre (VITICS, Ref: IIM14244.RI1, co-funded by the EU as part of the ERDF program), and by the Italian MIUR (Progetto Premiale AQUA to CNR). The authors are grateful to the owners and technical staff in Bodegas Ochoa, who kindly offered their vineyards and valuable help to perform this field experiment.