





1. Introduction
Diffusive processes in multiphase flows with discrete phases in the nano- or picolitre volume range can yield very surprising phenomena like dissolution or growth of microbubbles (Shim et al. Reference Shim, Wan, Hilgenfeldt, Panchal and Stone2014; Volk et al. Reference Volk, Rossi, Kähler, Hilgenfeldt and Marin2015), the spontaneous nucleation of nano-sized droplets in ternary systems (Lohse & Zhang Reference Lohse and Zhang2015) or, as will be considered in this work, the vanishing of a droplet in sparsely miscible media. Such systems with well-controlled interfacial properties (Stone, Stroock & Ajdari Reference Stone, Stroock and Ajdari2004) are found in a large variety of systems such as solvent extraction applications (Rydberg Reference Rydberg2004; Rezaee et al. Reference Rezaee, Assadi, Hosseini, Aghaee, Ahmadi and Berijani2006; Rezaee, Yamini & Faraji Reference Rezaee, Yamini and Faraji2010; Jain & Verma Reference Jain and Verma2011; Lohse & Zhang Reference Lohse and Zhang2015), emulsion-based DNA sequencing (Margulies et al. Reference Margulies2005), single-molecule analysis (Diehl et al. Reference Diehl, Li, He, Kinzler, Vogelstein and Dressman2006), designed microemulsions (Shah et al. Reference Shah2008) and even molecular gastronomy (This Reference This2002, Reference This2005). Such emulsions can become unstable by phase separation induced by coalescence, ripening or sedimentation.
Emulsions can be brought out of equilibrium when the discrete phase evaporates (to a neighbouring gas phase) or dissolves into the continuous liquid phase. In some systems this is not an issue since the discrete liquid phase is forced into a phase change in order to preserve its content (Takeuchi et al. Reference Takeuchi, Garstecki, Weibel and Whitesides2005), or it is directly extracted to be further processed. However, in many other cases, the dispersed phase needs to be stable for longer times, either to allow for mixing within the droplets (Song, Tice & Ismagilov Reference Song, Tice and Ismagilov2003), to let the solvent evaporate/dissolve or, in the case of bubbles, to allow their gases to dissolve in the surrounding liquid (Shim et al. Reference Shim, Wan, Hilgenfeldt, Panchal and Stone2014). In many of these cases, the volume loss of the dispersed phase into the host medium can be quite harmful. Nonetheless, in other cases the dissolution of the discrete liquid phase microdroplets is actually required. This is the case of drying of colloidal suspensions in microchannels (Yi et al. Reference Yi, Thorsen, Manoharan, Hwang, Jeon, Pine, Quake and Yang2003; Wang et al. Reference Wang, Jin, Gong, Li, Wu, Zhang, Zhou, Shui, Eijkel and van den Berg2017), microparticle aggregate synthesis (Velev, Lenhoff & Kaler Reference Velev, Lenhoff and Kaler2000; Manoharan, Elsesser & Pine Reference Manoharan, Elsesser and Pine2003; Brugarolas, Tu & Lee Reference Brugarolas, Tu and Lee2013), protein crystallization in emulsions (Zheng, Roach & Ismagilov Reference Zheng, Roach and Ismagilov2003; Yu et al. Reference Yu, Wang, Oberthuer, Meyer, Perbandt, Duan and Kang2012) and the generation of microcapsules (Zhang et al. Reference Zhang, Coulston, Jones, Geng, Scherman and Abell2012). In all these examples the rate of dissolution of the dispersed phase into the continuous phase plays a crucial role in the way the solute contained in the droplet aggregates, be it with polymeric solutions (Ré Reference Ré1998), with solid particles aggregating in the bulk (Wang et al. Reference Wang, Mbah, Przybilla, Zubiri, Spiecker, Engel and Vogel2018) or at a droplet's interface (Lauga & Brenner Reference Lauga and Brenner2004).
The case of a gas bubble dissolving in an infinite liquid environment at rest was analytically solved in a classical paper by Epstein & Plesset (Reference Epstein and Plesset1950), which was later extended to liquid droplets immersed in the bulk of a partially miscible liquid phase by Duncan & Needham (Reference Duncan and Needham2006). There has been considerable recent progress in the understanding of systems of dissolving bubbles or droplets in complex scenarios. In a recent paper, Michelin, Guérin & Lauga (Reference Michelin, Guérin and Lauga2018) studied theoretically a system of diffusively dissolving microbubbles experiencing collective effects in different distributions in two- and three-dimensional geometries, giving a broad overview of the different phenomena that can be observed. Three-dimensional collective effects between dissolving bubbles have been recently studied experimentally in micro-gravity conditions and compared with simulations by Vega-Martínez, Rodríguez-Rodríguez & van der Meer (Reference Vega-Martínez, Rodríguez-Rodríguez and van der Meer2020). The phenomenology changes dramatically when convective flow is present, this is the case of interacting sessile droplets in a channel immersed in a fluid in motion (Laghezza et al. Reference Laghezza, Dietrich, Yeomans, Ledesma-Aguilar, Kooij, Zandvliet and Lohse2016; Chong et al. Reference Chong, Li, Ng, Verzicco and Lohse2020) or in the dissolution of confined interacting trains of bubbles flowing in a cylindrically shaped channel (Rivero-Rodriguez & Scheid Reference Rivero-Rodriguez and Scheid2019). Collective effects such as coarsening and competitive growth have also been shown to take place among nanobubbles (Zhu et al. Reference Zhu, Verzicco, Zhang and Lohse2018) in semi-confined conditions.
Micro-confined conditions can yield a higher degree of control of droplet dissolution (Stone et al. Reference Stone, Stroock and Ajdari2004; Zhu & Wang Reference Zhu and Wang2017). However, the presence of confining boundaries clearly has an impact in the way the dissolution takes place, either to enhance the process or to hinder it. Polydimethilsiloxane, widely known as PDMS, is the most widely used material for constructing microfluidics chips using soft lithography (Xia & Whitesides Reference Xia and Whitesides1998). Before its use in microfluidics, this material had been actually used as membrane for its excellent permeability to vapour and other gases (Robb Reference Robb1968). Such a feature was soon exploited in early microfluidic research to promote fluid motion in microfluidic channels (Randall & Doyle Reference Randall and Doyle2005), concentrate colloids (Verneuil, Buguin & Silberzan Reference Verneuil, Buguin and Silberzan2004) or to crystallize salts (Leng et al. Reference Leng, Lonetti, Tabeling, Joanicot and Ajdari2006). More recently, PDMS has been used to emulate the vapour transport in leaves (Noblin et al. Reference Noblin, Mahadevan, Coomaraswamy, Weitz, Holbrook and Zwieniecki2008; Wheeler & Stroock Reference Wheeler and Stroock2008; Dollet et al. Reference Dollet, Louf, Alonzo, Jensen and Marmottant2019) and to explore evaporation-induced cavitation in droplets inside permeable viscoelastic gels (Vincent et al. Reference Vincent, Marmottant, Quinto-Su and Ohl2012; Bruning et al. Reference Bruning, Costalonga, Snoeijer and Marin2019). In the present work we take advantage of microfluidic droplet generators to experimentally study the dissolution of both isolated and groups of picolitre droplets in a sparsely miscible medium, confined by rigid but water-permeable walls, as is customary in microfluidic systems. To do so, we study the shrinkage of water droplets of different sizes in silicone oil inside microfluidic channels made of PDMS. The experimental data are compared with analytical solutions of the Epstein–Plesset equation (Epstein & Plesset Reference Epstein and Plesset1950), which assumes an infinite and unconfined external medium.
This assumption only applies for droplets small enough to ignore the presence of the confining walls. For larger droplets, we proceed to compute numerical solutions of the diffusion equation using an immersed boundary method, which yields results that compare well to the experiments. Remarkably, the evaporative flux of water vapour through the permeable PDMS wall turns out to be crucial to obtaining good agreement with the experimental data. This point is key for microfluidic long-term processes carried out in PDMS-based devices.
The paper is organized as follows: first, we describe the experimental set-up and results in § 2. In § 3 we compare the experimental results with those of the Epstein–Plesset equation. It will be shown that the analytical solution of the Epstein–Plesset equation is insufficient to describe all experimental results. Therefore, numerical solutions are required, which will be shown and discussed in § 4. The paper ends with an outlook and conclusions in § 5.
2. Experiments
2.1. Experimental set-up
Figure 1 shows sketches of our PDMS microfluidic device to study the dissolution of microdroplets. The sketches’ purpose is only illustrative and therefore the proportions are not realistic in the figure. The microfluidic chip was fabricated using soft-lithography techniques (Xia & Whitesides Reference Xia and Whitesides1998), with a mixing ratio of Sylgard 184 base and curing agent of 10 : 1. A thin film of PDMS was also spin coated onto the bottom glass slide to ensure the hydrophobicity of the channel. Figure 1(a) shows the chip design and figure 1(b) shows a close-up of the microfluidic flow-focusing structure: the dispersed phase (deionized water) is forced downstream of the 4-way junction through the constriction by the continuous phase (20 cSt silicone oil, Sigma-Aldrich). As a consequence, the water meniscus breaks into highly monodisperse water microdroplets (figure 1b). Once the downstream serpentine channel is filled with the dispersed phase, the flow is completely stopped and the shrinkage measurements begins. By tuning the flow rate ratio of the two phases, different sizes of microdroplets and the spacing between microdroplets can be achieved. In this case, we worked with microdroplets with radii in the range  $4 \text {--}40\ \mathrm {\mu }\textrm {m}$, covering three orders of magnitude in volume: from picolitre up to nanolitre droplets. Three-way valves were used in the water and in the oil supply path. For generating microdroplets, two syringe pumps (Harvard high-precision syringe pumps) supplied fluids through the valves into the chip. When the desired number of microdroplets were generated, the three-way valves were switched to cut off the fluid supply and immediately opened to expose the main channel to atmospheric pressure. In such a way, the pressure in all inlets was swiftly switched to atmospheric pressure and all pressure gradients within the channel quickly died out. Following this procedure, a number of microdroplets can be fully stopped in the serpentine channel for dissolution experiments. It is important to note that, although surfactants are typically used in these systems to stabilize the emulsion and prevent droplet coalescence, the use of the tiniest amount of surfactant can have crucial consequences in the process. Since we want to focus on the dissolution/shrinkage process only, no surfactants were used in any of our experiments. This will have consequences for the range of data accessible experimentally and will be discussed below.
Schematics of the set-up employed to study water microdroplet shrinkage within silicone oil in microchannels: (a) microfluidic chip design; (b) close-up view of the droplet generation junction (flow focusing); (c) view of the PDMS chip and glass slide. The inner dimensions of the main channel used in the experiments are  $h = 85\ \mathrm {\mu }\textrm {m}$,
 $w = 40\text {--}104\ \mathrm {\mu }\textrm {m}$ and
 $l = 10\ \textrm {mm}$.

The microfluidic chip was placed on an inverted optical microscope using  $10\times$ and
 $60\times$ objectives (Nikon). A CCD camera (Ximea) was used to record the microdroplets’ shrinkage. The optical system yielded a final resolution of
 $0.12\ \mathrm {\mu }\textrm {m}\ \textrm {pixel}^{-1}$. Image analysis and measurements were performed using in-house Matlab codes. All experiments were conducted at room temperature of
 $22\,^{\circ }\textrm {C}$ and between 30 % and 40 % relative humidity.
2.2. Experimental conditions and assumptions
Experimental conditions need to be defined in order to understand how the experiments were performed. Both the silicone oil and the PDMS chip were degassed prior to the experiments to ensure that no water vapour was pre-absorbed prior to the experiments. We will therefore assume that the initial vapour concentration in oil and within the PDMS walls is zero.
Given the density difference between the two phases involved, we should consider the possibility of buoyancy effects within the continuous phase during the droplet shrinkage. This can be evaluated by computing the ratio between the viscous time scale and the convective time scale induced by buoyancy, i.e. the Grashof number  $Gr={g\Delta \rho R^{3}}/{(\rho \nu ^{2} )}$, with
 $g$ the gravitational acceleration,
 $\Delta \rho$ the maximum density difference between the liquid phases,
 $\rho$ the density of the continuous medium (
 $\rho = 950\ \textrm {kg}\ \textrm {m}^{-3}$) and
 $\nu$ its kinematic viscosity (20 cSt). In our case
 $Gr$ takes values in the range from
 $10^{-7}$ for the smallest droplets to
 $10^{-4}$ for the largest, and therefore we will neglect buoyancy effects in the main discussion of the paper.
The experimental results are organized according to the degree of confinement of the droplets in the channel. In table 1 we summarize three series of experiments performed, classified by the confinement ratio which is defined as  $c=R_{0}/R_{B}$, where
 $R_{B}$ is the half-width of the channel and
 $R_{0}$ is the initial microdroplet radius. Note that the droplet is fully surrounded by silicone oil and there is no contact between the microdroplet and any of the channel walls. Both the height and width of the channel are larger than the initial microdroplet size, so only spherically shaped droplets are considered in this study. Consequently, only droplets with a (projected) diameter smaller than the channel height (
 $h=85\ \mathrm {\mu }\textrm {m}$) were considered. The distinction between weak and strong confinement is chosen according to the amount of water that can be dissolved by the oil phase in our geometry. Considering an isolated water droplet (density
 $\rho _w$) in a channel of length
 $10^{4} \ \mathrm {\mu }\textrm {m}$, width
 $2R_B=100\ \mathrm {\mu }\textrm {m}$ and depth
 $85 \ \mathrm {\mu }\textrm {m}$ filled with oil (
 $V_{oil}$), and the saturation density of water in oil (
 $\rho ^{o}_{w} =0.2 \ \mathrm {kg}\ \mathrm {m}^{-3}$, taken from Garbay et al. (Reference Garbay, Grob, Casanovas and Crine1984), see discussion below), we obtain that the maximum amount of water that can be dissolved by such a volume of silicone oil is
 $V_{c} = V_{oil}\times \rho ^{o}_{w}/\rho _{w}=17$ pl, which corresponds to a water droplet of radius
 $R_c= 16\ \mathrm {\mu }\textrm {m}$. We can define then a critical confinement ratio
 $R_c/R_B = 0.32$. Consequently, all droplets with
 $R_0 < R_c$ (
 $c<0.3$) are considered weakly confined and those with
 $R_0>R_c$(
 $c>0.3$) strongly confined (table 1).
Classification of experiments according to different initial microdroplet sizes and channel dimensions, cast into the confinement ratio  $c$, defined as the ratio between the initial droplet radius
 $R_0$ and the half-channel smallest dimension (typically width)
 $R_B$.

Our current study focuses mostly on isolated droplets and therefore our confinement ratio depends only on the distance of the droplet surface to the channel walls. However, since droplets are not generated individually and in isolation in typical operating situations with microfluidic devices, groups of droplets have also been analysed. The cases with multiple droplets have been performed with 5 to 7 droplets, keeping the droplet distance constant, with an error of less than one particle radius. A different confinement parameter should be defined for studies analysing the role of the droplet separation and number, which must play crucial roles. Note also that, since no surfactants have been used in our experiments, coalescence is an issue in our current set-up, which limits the lower range of droplet separation achievable.
An additional comment deserves to be stated before showing the results regarding the position of the droplets within the channel. Due to the density difference between both liquid phases, an initially centrally positioned droplet would in principle experience some displacement due to gravity while it dissolves, depending on its size. A simple calculation can show that droplets smaller than approximately  $7\ \mathrm {\mu }\textrm {m}$ are displaced a negligible amount during their lifetime. Obviously, larger droplets would experience larger displacements, but since these droplets are anyway strongly confined, the displacement is typically a small fraction (
 ${<}15\,\%$) of the droplet radius. Therefore, we do not expect that displacements from the centre of the channel to have a substantial effect on the dissolution process.
2.3. Experimental results
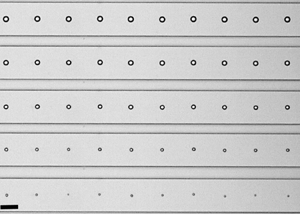
A sequence of images showing typical shrinkage experiments can be found in figure 2, corresponding to (a) a droplet in weak confinement and (b) a droplet in strong confinement. We define a droplet as isolated when the closest droplet is at a distance of at least 15 diameters. The origin of this particular reference value for the droplet distance will be developed in § 4. Figure 2(c) shows a group of droplets in weak confinement. In a typical experiment, hundreds or thousands of droplets are generated per second and they fill the whole device (Yi et al. Reference Yi, Thorsen, Manoharan, Hwang, Jeon, Pine, Quake and Yang2003; Takeuchi et al. Reference Takeuchi, Garstecki, Weibel and Whitesides2005; Shah et al. Reference Shah2008; Shim et al. Reference Shim, Wan, Hilgenfeldt, Panchal and Stone2014; Wang et al. Reference Wang, Jin, Gong, Li, Wu, Zhang, Zhou, Shui, Eijkel and van den Berg2017). Unfortunately, droplet size and spacing are strongly correlated, which does not allow us to modify such parameters independently. The case shown in figure 2(c) shows the dissolution of a group under weak confinement ( $c=0.17$) with an almost constant spacing (
 $5\times \text {droplet size}$), in which they all remarkably shrink at the same pace.
Sequence of snapshots of the shrinkage process of microdroplets in a microchannel (a) isolated under low confinement ( $R_0=5\ \mathrm {\mu }\textrm {m}$,
 $c=0.1$), (b) isolated under high confinement (
 $R_0= 31.5\ \mathrm {\mu }\textrm {m}$,
 $c=0.60$) and (c) group of droplets under low confinement (
 $R_0= 3.5\ \mathrm {\mu }\textrm {m}$,
 $c=0.17$).

Figure 3 shows measurements for a wide range of droplet radii and conditions (weakly and strongly confined, single and grouped). Dissolution times range from a few dozens of seconds in the case of single weakly confined droplets ( $c<0.3$, as in figure 2a), to more than 1000 s for the single strongly confined droplets (
 $c>0.3$, as in figure 2b). As can be seen in figure 3, most droplets vanish following
 $R_0^{2}-R^{2} \propto t$, from which we can infer that the process is entirely diffusive. Consequently, in the following section we will employ the Epstein–Plesset equation to capture the diffusive shrinkage of single weakly confined droplets and compare the results with the experimental data.
Data from all experiments of this study, plotted as  $R_0^{2}-R^{2}$ against time, including single droplets dissolving in weak confinement (i.e. their initial diameter is below 30 % of the total channel width
 $c<0.3$), single droplets in strong confinement
 $c>0.3$ and group droplets in both situations. The data are compared with the linear law
 $R_0^{2} -R^{2} \propto t$, typically found in diffusive processes.

3. Epstein–Plesset model for droplet dissolution
The Epstein–Plesset (EP) equation (Epstein & Plesset Reference Epstein and Plesset1950) was originally developed to describe the dissolution of a single and isolated spherical gas bubble in an infinite liquid medium and it was later successfully applied to describe also the dissolution of droplets immersed in the bulk of partially miscible liquids by Duncan & Needham (Reference Duncan and Needham2004) (for more details and recent developments, such as the extension to sessile droplets and bubbles, see Lohse & Zhang Reference Lohse and Zhang2015).
In the geometry considered here, the concentration of the dispersed phase in the far-field liquid phase  $C_{\infty }$ is considered to be undersaturated at
 $t=t_0$ (
 $C_{\infty } < C_S$), and the concentration of the dispersed liquid at the droplet surface is considered to be at saturation
 $C_{S}$. Unfortunately, data on the saturation concentration of water in silicone oil in the literature are scarce. Garbay et al. (Reference Garbay, Grob, Casanovas and Crine1984) directly measured the amount of water absorbed by silicone oil at different humidities. Since we are interested in the maximum amount of water in the close vicinity of the droplet in the oil phase, we use their value obtained at 100 % relative humidity, and identify this value with the saturation concentration of water in oil
 $C_{S}=0.2\ \textrm {kg}\ \textrm {m}^{-3}$. Regarding the diffusion coefficient
 $D_{o}$ of water in silicone oil, some studies in the literature (Hilder & van den Tempe Reference Hilder and van den Tempe1971; Cussler Reference Cussler2009) have reported values of water diffusivity in various different solvents, with values of the order of
 $10^{-9}\ \textrm {m}^{2}\ \textrm {s}^{-1}$. However, since the conditions of such experiments are not identical to ours, we choose to use the water diffusivity in oil
 $D_{o}$ as the single fitting parameter in our study, keeping the values reported in the literature for other solvents as a reference. Under these conditions, the steady-state dissolution rate
 $\textrm {d}R/\textrm {d}t$ of a liquid droplet can be approximately expressed as
 \begin{equation} \frac{\textrm{d}R}{\textrm{d}t}={-}\frac{D_{o}(C_{S}-C_{\infty})}{\rho}\frac{1}{R}, \end{equation}
where  $R$ is the droplet radius and
 $\rho$ is the density of the dispersed phase. Unlike the case of Duncan & Needham (Reference Duncan and Needham2004), steady state is reached in our process since the typical dissolution time
 $t$ is much larger than the diffusive time scale, i.e.
 $t\gg R^{2}\rho /(\Delta C D_{o})$ (Lohse & Zhang Reference Lohse and Zhang2015), where
 $\Delta C =C_s-C_\infty$. The solution of (3.1) can be written as
 \begin{equation} \left(\frac{R}{R_0}\right)^{2}=1-\frac{t}{t_f}, \end{equation}
where  $t_f$ is a good approximation for the droplet lifetime that takes the form
 $t_f=\rho R_0^{2}/(2D_{o} \Delta C)$. The Laplacian pressure slightly increases the dissolution rate for small-sized droplets. However, the typical droplet size at which the Laplace pressure becomes relevant is of the order of
 $R \sim 1\ \mathrm {\mu }\textrm {m}$, which is much smaller that the droplet size range covered in our study.
Figure 4(a) shows experimental data of the dissolution of droplets in low confinement conditions. The results clearly show that all experiments with single droplets under weak confinement follow very closely the analytical solution of the EP model in (3.2).
Experimental data of dissolution of droplets with different initial radius and different weak confinements. The data are presented in dimensionless form. The continuous black line in both plots corresponds to the analytical solution of (3.1), i.e. the EP model. (a) Experiments with droplets under weak confinement  $c<0.3$, including group droplets. The grey area surrounding the EP line corresponds to errors of 10 % in the determination of the diffusion constant
 $D_{o}$. (b) Experiments with droplets under strong confinement
 $c>0.3$.

Using the data of the weakly confined droplets, we obtain the best-fit value for  $D_{o}$, namely
 $D_{o}=0.94\times 10^{-9} \ \textrm {m}^{2}\ \textrm {s}^{-1}$. Figure 4(a) also shows how the theoretical prediction varies when the diffusivity value changes within a 10 % margin, which is a reasonable precision for the value of
 $D_{o}$ found. Measurements of liquid–liquid diffusivities are non-trivial, specially for sparsely miscible liquids such as those we are dealing with. Nonetheless, well-controlled dissolution processes based on microfluidics provide a very reliable environment in which the EP equation can be used to obtain liquid–liquid diffusivities. Small volume droplets (in the range of pl) can be fully dissolved in another sparsely miscible liquid and their final dissolution time can be measured accurately. Actually, the reliability of the measurements suggest that, if the solubility of the phases is known a priori, this could be a robust method to measure the liquid–liquid diffusivity, especially for such a low degree of miscibility among the two phases for which other methods usually fail.
Also strongly confined droplets are shown in figure 4(b). As can be seen, the EP model systematically underestimates the dissolution rate for those droplets under strong confinement, which are the cases that deviate the most from the EP model. Since strongly confined droplets are closer to the PDMS walls, this result clearly shows the important role of the wall permeability to water in the process.
The results so far concerned single and isolated droplets. We now turn our attention to those droplets found in groups. Droplets laying close to each other are also expected to influence each other's vanishing process. The data in figure 4(a) also show grouped droplets in low confinement. This is the same case shown in the image sequence in figure 2, which shows a remarkably homogeneous shrinkage rate for all droplets, with all vanishing practically at the same rate. Despite the homogeneity in the group of weakly confined droplets, the results shown in figure 4(a,b) deviate strongly from the EP model, which overestimates their diffusion rate, regardless of their degree of confinement. In contrast, as discussed above, the EP model underestimates the dissolution rate of highly confined single droplets.
Both results, the enhanced dissolution by confinement and the delayed dissolution due to collective effects, evidence the need for a more detailed model in which more realistic boundary conditions can be applied. Indeed, the disagreement of the EP model with the cases of (i) strongly confined droplets and (ii) grouped droplets clearly shows that the hypothesis of dissolution in an infinite medium fails since (i) the proximity of the channel walls has a significant influence on the enhancement of the dissolution and since (ii) neighbouring droplets clearly influence each other, delaying their overall dissolution. To account for the shrinkage of droplets in confinement, we need numerical solutions of the diffusion equation that account for droplet interactions and for water flux across boundaries.
4. Numerical solution of the diffusion equation for confined and grouped droplets
Numerical solutions are obtained using an immersed boundary method (IBM), a method that has been successfully applied to other systems in the same context. Details of the implementation of this particular numerical scheme can be found in Zhu et al. (Reference Zhu, Verzicco, Zhang and Lohse2018) and in Chong et al. (Reference Chong, Li, Ng, Verzicco and Lohse2020). We will obtain numerical solutions of the diffusion equation for the water/vapour concentration  $C$. The applied boundary conditions in the different channel walls are shown figure 5. The numerical solutions are obtained in the different environments surrounding the droplet: oil and PDMS, with coefficients of diffusion
 $D_{o}$ and
 $D_{{PDMS}}$.
 \begin{equation} \frac{\partial C}{\partial t}= D_{\alpha}\nabla ^{2}C, \end{equation}
where  $\alpha$ refers to either the oil phase or the PDMS phase. At the droplet's surface
 $r=R$, the concentration can be assumed to be saturated
 \begin{equation} C (r=R) = C_S. \end{equation}
The droplet is surrounded by 4 walls, where the bottom wall is a glass substrate, impermeable to water/vapour, such that a no-flux condition needs to be satisfied
 \begin{equation} \frac{\partial C}{\partial {\boldsymbol{n}}}=0. \end{equation}
Schematic of the numerical domain and boundary conditions for a single droplet.

For the case of the dissolution of a single droplet, the channel length considered in the simulation along the channel's axis is chosen as 20 initial droplet diameters ( $40\times R_0$), which ensures that the far-field boundary condition is satisfied. The channel width is varied depending on the confinement ratio and the channel height for all simulations is
 $h=85\ \mathrm {\mu }\textrm {m}$, mimicking the experimental conditions. The grid size for the strong confinement case is set as 1 and
 $1/3\ \mathrm {\mu }\textrm {m}$ for weak confinement (since these are typically smaller droplets).
In addition to the dissolution in silicone oil, and in order to impose realistic boundary conditions at the channel wall, we need to solve the water vapour transport through the PDMS network. The experiments were performed either with ‘freshly baked’ PDMS chips, degassed or recycled ones, through which we forced dry air prior to the experiments. Consequently, in every experiment the PDMS slab is initially completely dry and therefore the initial condition for vapour concentration within the slab can be safely taken as  $C_{{PDMS}}=0$ at
 $t=0$. For simplicity, we will consider that the external finite humidity has no influence in the process (the experiments are run under a typical relative humidity between 30 % and 40 %, which corresponds to a vapour concentration in the air of
 $C_{air} \leqslant 0.007\ \textrm {kg}\ \mathrm {m}^{-3}$), and thus in our numerical model we will consider the PDMS slab as a vapour sink, keeping
 $C_{{PDMS}}=0$ at
 $y=L_{{{PDMS}}}$. Note that using a finite value of humidity at the end of the PDMS slab also requires a detailed numerical model of the PDMS device, which is quite computationally demanding, as we will discuss below.
Numerically solving the diffusion of vapour through a fully realistic model of the chip requires high computational costs. Therefore, since most of the volume is taken by the PDMS slab, it would be desirable to solve numerically for a smaller PDMS slab, maintaining the same behaviour as in the experiments. In order to test the dependency on the slab size, we have performed tests with a cylindrical PDMS slab geometry, with walls of different thickness to confirm that, when the PDMS wall reaches a certain thickness, the total diffusion time does not change significantly. These results are shown in figure 6, in which one can see that the error made by considering a PDMS thickness above  $500\ \mathrm {\mu }\textrm {m}$ is small (below 3 %) in terms of the total diffusion time. Thus, the thickness
 $L_{{PDMS}}$ is set at
 $500\ \mathrm {\mu }\textrm {m}$ for the simulations with a rectangular cross-section.
Influence of the wall thickness  $L_{{PDMS}}$ on the total dissolution time in the IBM simulations. These simulations are performed assuming a cylindrical PDMS slab to reduce computational time. The plot shows that the total shrinkage time for a group of weakly confined droplets (
 $c=0.17$) at different PDMS thicknesses
 $L_{{PDMS}}$ hardly changes beyond 1 mm. The shrinkage time is normalized using the dissolution time
 $t_f$ expected by the EP equation (3.1). The colour code in the sketch shown in the inset represents the water concentration in the oil phase (lower part) and in the PDMS (upper part).

Additionally, although the diffusion constant  $D_{p}$ of water in polymeric materials similar to PDMS has been reported in the literature (Blume et al. Reference Blume, Schwering, Mulder and Smolders1991; Watson & Baron Reference Watson and Baron1996; de Jong, Lammertink & Wessling Reference de Jong, Lammertink and Wessling2006), the conditions, procedures, materials and the proportions of curing agents might vary. Consequently, we choose to take
 $D_{p}$ as a fitting parameter, which yields a best-fit value of
 $D_{p} = 2\times 10^{-9}\ \textrm {m}^{2}\ \textrm {s}^{-1}$, similar to values in the literature for similar materials (Blume et al. Reference Blume, Schwering, Mulder and Smolders1991; Watson & Baron Reference Watson and Baron1996; de Jong et al. Reference de Jong, Lammertink and Wessling2006). Interestingly, this value also agrees with those reported in PDMS-based ‘microevaporators’, which make use of the permeation of water through PDMS to induce liquid flows (Randall & Doyle Reference Randall and Doyle2005), concentrate colloids (Verneuil et al. Reference Verneuil, Buguin and Silberzan2004) or to crystallize salts (Leng et al. Reference Leng, Lonetti, Tabeling, Joanicot and Ajdari2006). Since the liquid flow rate obtained in these systems depends linearly on
 $D_{p}$, one can obtain an indirect measurement of the diffusion coefficient of water in PDMS by simply measuring the liquid flow.
The similar value of the diffusion coefficient for water in PDMS and silicone could be exploited to simplify numerical simulations and replace the PDMS/oil interface by a single medium with an effective diffusion constant. This similarity in the coefficient values might be an additional reason why the relative position of the droplets with respect to the PDMS wall does not seem to play an important role.
The comparison of the numerical results with the experimental data is shown in figure 7. For simplicity, we have chosen one typical case of a single droplet under very strong confinement ( $c=0.6$) and a typical case of homogeneous dissolution of a group of droplets under weak confinement (
 $c=0.17$). In the case of a single strongly confined droplet, we can see an excellent agreement of the experimental data with the numerical results with only some minor deviations in the last instants of the shrinkage process.
Comparison of experimental with numerical results. Single droplet under strong confinement with  $R_0 = 22.6\ \mathrm {\mu }\textrm {m}$ and
 $c = 0.6$ and group of droplets with low confinement
 $R_0=8.5\ \mathrm {\mu }\textrm {m}$ and
 $c=0.17$. Continuous lines correspond to simulations and discrete points to experimental data. The black continuous line corresponds to (3.2), i.e. the analytical solution of the EP equation (3.1).

Grouped droplets are modelled assuming periodic boundary conditions with a no-flux condition ( $\partial C/\partial n = 0$) at the mid-plane separating each pair. Such a numerical model assumes that all droplets in a group will shrink at the same rate, which is an approximation consistent with the experimental observations since the droplets in a group have shown negligible differences in shrinkage rate (see figure 2c). The results of the analytical solution and the numerical one are shown in figure 7 for a group of droplets with an initial weak confinement ratio
 $c=0.17$. Although the numerical results approach the experimental data closer than the analytical EP model, there is a systematic overestimation of the dissolution rate at intermediate times which we do not capture with the numerical solution. This deviation has been observed systematically for all experiments with a group of droplets and unfortunately we do not have a clear explanation for it. Interestingly, the experimental curve turns towards the numerical one at the later stages of the process. Our main hypothesis to explain this disagreement is that the precise geometry of the PDMS device, which is not captured by our numerical model, becomes more relevant in grouped droplets than for isolated ones. In any case, the numerical solution compares significantly better with experiments than (3.2) and similar results have been obtained for a wide range of droplet separations and sizes. Unfortunately, droplet size and separation are strongly correlated in microfluidic flow focusing devices and therefore a systematic experimental study on this effect is not straightforward. Nonetheless, this result shows the crucial importance of vapour transport through the PDMS when a significant number of droplets are dissolved simultaneously in a vapour-leaky channel. Note that the vanishing of groups of droplets in a channel with a non-permeable wall would be limited solely to the amount of water capable of being dissolved in the oil phase, which can even lead to an equilibrium with finite droplet sizes at
 $t\rightarrow \infty$, as
 $\Delta C \rightarrow 0$ for full saturation and
 $t_f \propto 1/\Delta C$.
Groups of dissolving droplets can show a variety of collective effects. In our case, the droplet dissolution is slowed down significantly due to the presence of neighbouring droplets. Our results raise a natural question: How close do they need to be to show such a collective effect? To answer this question, we consider a group of weakly confined droplets, which would follow the analytical unconfined EP model when they are isolated. The initial droplet size chosen is  $d=2\ \mathrm {\mu }\textrm {m}$, confined in a cylindrically shaped channel of diameter
 $86\ \mathrm {\mu }\textrm {m}$ (same as the width of the channel used in the experiments). The distance between the droplets is varied from one diameter (
 $L/d=1$) up to 20 diameters (
 $L/d=20$), and the total diffusion time
 $t_{end}$ is normalized by the time taken by a single droplet to completely dissolve under the same conditions. The normalized shrinkage times for different droplet separation lengths – normalized by the droplet size – are shown in figure 8. As can be seen, the screening effect of the neighbouring droplets can be ignored when the drop spacing is approximately 10 times the drop size. Note that, without the presence of a permeable wall, the water vapour emanating from the droplets would concentrate within the continuous liquid phase and the collective effects would greatly delay the droplet dissolution.
Total dissolution time  $t_{end}$ for a group of droplets of initial size
 $d$, separated by a distance
 $L$. Time is normalized by the total lifetime of a single droplet dissolving under the same conditions.

5. Conclusions and outlook
In the present study, a PDMS-based microfluidic device enables us to systematically study the shrinkage of single and multiple droplets with volumes ranging from picolitre to nanolitre, in a confined and sparsely miscible liquid medium. Our results show that the shrinkage occurs by the dissolution of water in the sparsely miscible oil phase, which is then diffusively transported through the water-permeable PDMS. Consequently, the process strongly depends on how much the droplets are confined within the channel. In the weak confinement case ( $c<0.3$), the presence of the walls has little effect and the droplet dissolves completely within the oil phase, with no influence from the PDMS matrix. In the strong confinement case (
 $c>0.3$), the presence of the walls cannot be neglected. To account for the complex geometry, the diffusion equation is solved using IBM, which yields a better prediction of the faster dissolution of droplets in strong confinement, due to the vapour leakage through the permeable wall. Finally, our numerical results reveal an expected slower dissolution for grouped droplets, but fail to capture the detailed dissolution process. Given the larger amount of water being transported through the PDMS device in the case of groups of droplets, a more precise geometry of the PDMS device would need to be simulated to have a better prediction. Our results reveal the crucial importance of water transport through the PDMS device in these processes.
In conclusion, in this work we have employed experimental, analytical and numerical tools to analyse the dissolution of water droplets in silicone oil, contained in PDMS-based microfluidic devices. Our results reveal the crucial role of the permeability of PDMS to water vapour in the shrinkage of picolitre droplets. Understanding this phenomenon is crucial for microfluidic long-term processes such as droplet-based polymerase chain reaction assays (Prakash et al. Reference Prakash, Adamia, Sieben, Pilarski, Pilarski and Backhouse2006) or the cultivation of micro-organisms (Dewan et al. Reference Dewan, Kim, McLean, Vanapalli and Karim2012).
Acknowledgements
J.M. and Y.C. acknowledge fruitful discussions with Y. Li. The authors specially acknowledge the use of the IBM code developed by R. Verzicco and S. Chong and their assistance.
Funding
The authors acknowledge the financial support from the European Research Council via the Starting Grant ERC-2015-STG 678573 and the Advanced Grant ERC-2016-ADG 740479.
Declaration of interests
The authors report no conflict of interest.


 Open access

