I. INTRODUCTION
ZnO is a widely used semiconductor material in various aspects of solar energy utilization due to its thermal stability, low cost, nontoxicity, and easily controlled morphology. Reference Tian, Voigt, Liu, McKenzie, McDermott, Rodriguez, Konishi and Xu1–Reference Jang, Jang, Lee, Kim, Kumagai, Lee, Minegishi, Kubota, Domen and Lee4 ZnO has a bandgap of 3.3 eV, which means only ultraviolet (UV) light can be harvested.
Many attempts have been carried out to extend the light-absorption range, such as doping with alien metal cations and/or nonmetal ions, Reference Zou, Ye, Sayama and Arakawa5–Reference Shi, Ye, Zhou, Li and Guo7 or sensitizing with organic dyes Reference Sunahara, Furube, Katoh, Mori, Griffith, Wallace, Wagner, Officer and Mozer8,Reference Ziółek, Martín, Cohen, Garcia and Douhal9 or with narrower-bandgap semiconductor quantum dots. Reference Senevirathna, Pitigala and Tennakone10–Reference Hagfeldt, Boschloo, Sun, Kloo and Pettersson12 Moreover, lots of work has been done to enhance the transfer of photogenerated charge carriers so as to reduce the consumption in radiative combination. Reference Banerjee, Mohapatra, Das and Misra13,Reference Sung, Kang, Jang, Myung, Jung, Kim, Jung, Cho, Park and Lee14 It has been proved to be a promising way to expand the light response and meanwhile to strengthen the separation of photogenerated electron–hole pairs by sensitizing wide-bandgap semiconductor with narrower-bandgap semiconductor. Reference Leschkies, Divakar, Basu, Enache-Pommer, Boercker, Carter, Kortshagen, Norris and Aydil15–Reference Wang, Jiang, Liu, Shi and Guo17 Aligned one-dimensional semiconductor photoelectrodes were also demonstrated to be very beneficial to the transfer of photogenerated charge carriers due to the direct pathway without resistance of crystal boundary. Reference Chung, Myoung, Oh and Lim18–Reference Cho, Chen, Forman, Kim, Rao, Jaramillo and Zheng20
PbO, as a heavy oxide, is comprehensively investigated as an additive in glass material to change the electronic and nonlinear optical properties. Reference Vithal, Nachimuthu, Banu and Jagannathan21,Reference Ekuma, Esabunor and Osarolube22 Iwaszuk et al. presented a first-principles density functional theory (DFT) investigation on TiO2 modified with PbO and PbO2 nanoclusters, which strongly were adsorbed on all TiO2 surfaces to create new Pb–O and Ti–O interfacial bonds. Reference Iwaszuk and Nolan23 PbO modified TiO2 introduced new states above the valence band (VB) of TiO2 and therefore resulted in a shift of the band onset into the visible-light region, while PbO2 modified TiO2 resulted in visible-light-driven photocatalysis via new states just below the conduction band (CB) of TiO2. Bhachu et al. reported PbO clusters modified TiO2 thin films and proved its ability of visible-light-driven photocatalysis. Reference Bhachu, Sathasivam, Carmalt and Parkin24
Herein, a series of PbO sensitized one-dimensional ZnO nanorod-array film were prepared by a two-step hydrothermal process. The photoelectrochemical (PEC) performance for water splitting was evaluated under visible-light irradiation. The mechanism of PEC activity improvement by Pb component were comprehensively investigated.
II. EXPERIMENTAL
A. Material preparation
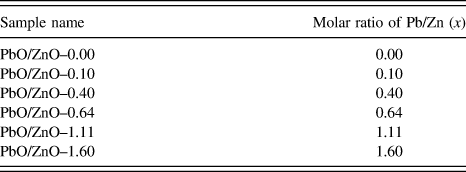
All chemicals are of analytical grade and used as received from Sinopharm Chemical Reagent Co., Ltd. ZnO nanorod arrays (PbO/ZnO–0.00) were prepared via a hydrothermal method as described in previous reports. Reference Guo, Jiang, Shen and Guo25 After dried in oven, ZnO nanorod-array film was put into a 100 mL glass bottle containing a mixed aqueous solution (60 mL) of zinc nitrate hexahydrate [Zn(NO3)2·6H2O] (0.1 M), hexamethylenetetramine (C6H12N4) (0.1 M), and an appropriate amount of lead nitrate [Pb(NO3)2]. The molar ratio of C6H12N4 and Zn(NO3)2·6H2O was fixed at 1.0, while the molar ratio of Pb/Zn was expressed as x. The glass bottle was then sealed and treated at 75 °C for 12 h. Afterwards, the hydrothermally treated film was annealed at 450 °C for 1 h to obtain the final product designated as PbO/ZnO–x, which with different molar ratio of Pb/Zn (x) was listed in Table I.
Names and the corresponding preparation conditions of samples.

B. Characterization
Crystal structures were measured on an x-ray diffractometer (XRD) with Cu Kα radiation (X'pert PRO MPD, PANalytical, Netherlands). Morphologies and dimensions were observed by a field-emission scanning electron microscope (SEM) (JSM-7800F, JEOL, Japan). Microstructures were observed on a high-resolution transmission electron microscope (HRTEM) (Tecnai G2 F30, FEI Company, Hillsboro, Oregon) after scratching the film from fluorine-doped tin oxide (FTO). Optical properties were measured by a UV-Visible (UV-Vis) spectrophotometer (U-4100, Hitachi, Japan) under transmittance mode with BaSO4 as the reference, and by a steady-state fluorescence spectrophotometer (QuantaMaster 40, PTI, Edison, New Jersey). Core levels were obtained by an x-ray photoelectron spectrometer (XPS) (AXIS Ultra DLD, Shimadzu/Kratos, Tokyo, Japan) with monochromatic Al Kα radiation after etching the film for 60 s by an Ar+ gun with a 4 keV high voltage to clean the surface. Charge calibration was carried out by setting C 1s line of adventitious carbon to 284.8 eV.
C. PEC test
PEC test was conducted in a three-electrode system with an electrochemical workstation (CHI 760D, CH Instruments, Austin, Texas) using Na2SO4 aqueous solution (0.5 M) as the electrolyte. The as-prepared film mounted onto an electrode holder was used as the work electrode, the surface area of which exposed to electrolyte was fixed at 0.785 cm2. An Ag/AgCl electrode was used as the reference electrode, and a Pt plate was used as the counter electrode. A 500 W Xe lamp (100 mW cm−2) with a UV cut-off filter (λ > 420 nm) was used as the light source.
III. RESULTS AND DISCUSSION
A. Structures and morphologies
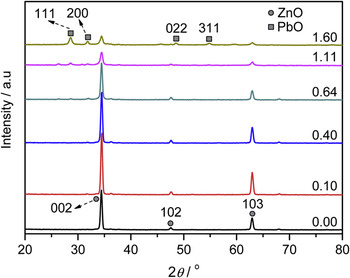
Figure 1 shows XRD patterns of PbO/ZnO–x samples. Three peaks at 34.5°, 47.7°, and 63.0° existed in all samples and could be assigned to the diffractions of (002), (102), and (103) planes of hexagonal wurtzite ZnO (JCPDS No. 01-075-0576), respectively. It was noted that, with the increase of x, the aforementioned three characteristic diffraction peaks of hexagonal ZnO gradually decreased along with the appearance and gradual increase of another four peaks at 28.6°, 31.8°, 48.5°, and 54.7°, which could be indexed to (111), (200), (022), and (311) planes of orthorhombic PbO (JCPDS No. 01-078-1666). It was reported that PbO in a yellow orthorhombic form is stable above 760 K, Reference Hill26 which was consistent with the annealing temperature of our samples at 450 °C. No other peaks associated with an impurity phase were observed. It was proved by the above XRD results that ZnO (PbO/ZnO–0.00) and PbO sentitized ZnO (PbO/ZnO–x) materials were successfully prepared. Besides, compared with the standard diffraction pattern (JCPDS No. 01-075-0576), all PbO/ZnO–x samples showed the strongest (002) peaks along with the disappearance of (100) peaks, thus indicating the preferred growth orientation of [002] direction.
XRD patterns of PbO/ZnO–x samples with x equal to 0.00, 0.10, 0.40, 0.64, 1.11, and 1.60, respectively.

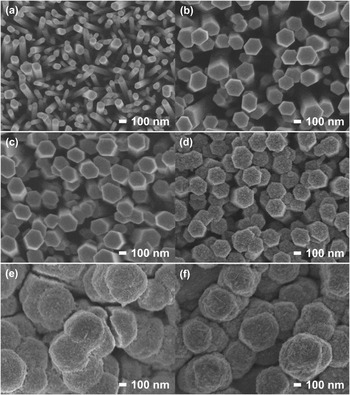
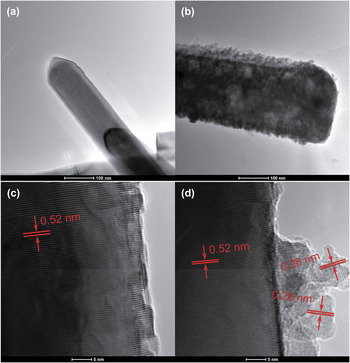
Figures 2 and 3 shows SEM images of PbO/ZnO–x samples with top view and sectional view, respectively, and Fig. 4 shows TEM and HRTEM images of PbO/ZnO–0.00 and PbO/ZnO–0.64 samples. PbO/ZnO–0.00, which was obtained by the hydrothermal process in the first step, was composed of hexagonal nanorod arrays with clean surfaces and with diameters ranging from 100 to 200 nm [Figs. 2(a), 3(a), and 4(a)]. The clear lattice fringes on the nanorods were perpendicular to the length direction and had a d-spacing of approximately 0.52 nm corresponding to (001) planes of hexagonal ZnO [Fig. 4(c)]. It was thus further confirmed that ZnO nanorods had the [001] preferred growth orientation, which was in accordance with the XRD results. When x was not higher than 0.40, the as-prepared materials of PbO/ZnO–0.10 and PbO/ZnO–0.40 consisted of hexagonal nanorod arrays with clean surfaces similar to those of PbO/ZnO–0.00 except for the larger diameter sizes [Figs. 2(b), 2(c), 3(b), and 3(c)]. When x increased to 0.64, the obtained material of PbO/ZnO–0.64 [Figs. 2(d) and 3(d)] was also composed of hexagonal nanorod arrays with the diameter sizes close to those of PbO/ZnO–0.10 and PbO/ZnO–0.40, but it was noted that irregular nanoparticles were well distributed outside nanorods [Figs. 2(d), 3(d), 4(b), and 4(d)]. The irregular nanoparticles covering on the nanorods showed lattice fringes with a d-spacing of approximately 0.28 nm and hence corresponded to the (200) planes of orthorhombic PbO. It was therefore demonstrated that PbO sensitized ZnO nanorod arrays were successfully prepared by a two-step hydrothermal process. With the further increase of x to obtain the materials of PbO/ZnO–1.11 and PbO/ZnO–1.60, plenty of PbO filled up the space among the ZnO nanorods and thickly covered the tops of ZnO nanorods [Figs. 2(e), 2(f), 3(e), and 3(f)]. Besides, it was interesting that when Zn source was not introduced and Pb source with a series of concentrations equal to those of PbO/ZnO–x was added during the hydrothermal process in the second step, all the obtained samples showed morphologies similar to that of PbO/ZnO–0.00, i.e., clean surfaces without observable PbO nanoparticles and small diameter sizes without further axial growth (figures not shown here). It was thus deduced from the above results that, during hydrothermal process in the second step, the introduction of Zn source promoted further growth of ZnO nanorods along the radial direction, and at the same time, facilitated the adsorption of Pb source to enable the growth of PbO nanoparticles on the surfaces of ZnO nanorods. Moreover, the concentration of Pb source affected the formation, content, and distribution of PbO on ZnO nanorod arrays.
SEM images (top view) of PbO/ZnO–x samples with x equal to (a) 0.00, (b) 0.10, (c) 0.40, (d) 0.64, (e) 1.11, and (f) 1.60, respectively (scale bar: 100 nm).

SEM images (cross-sectional view) of PbO/ZnO–x samples with x equal to (a) 0.00, (b) 0.10, (c) 0.40, (d) 0.64, (e) 1.11, and (f) 1.60, respectively (scale bar: 1 μm).

(a and b) TEM (scale bar: 100 nm) and (c and d) HRTEM (scale bar: 5 nm) images of (a and c) PbO/ZnO–0.00 and (b and d) PbO/ZnO–0.64 samples.

B. Chemical components and states
XPS analysis was used to investigate the chemical components and states of samples.
As for the survey-scan XPS spectra, only peaks corresponding to Zn, O, and adventitious C elements were observed on PbO/ZnO–0.00 [Figs. 5(a) and S1a]. In contrast, new peaks corresponding to Pb element appeared in all other samples [i.e., PbO/ZnO–0.64 in Figs. 5(b) and S1d; PbO/ZnO–0.10, PbO/ZnO–0.40, PbO/ZnO–1.11 and PbO/ZnO–1.60 in Figs. S1b, S1c, S1e, and S1f, respectively].
(a and b) Survey-scan XPS spectra of (a) PbO/ZnO–0.00 and (b) PbO/ZnO–0.64 samples, (c) high-resolution XPS spectrum of Pb 4f levels for PbO/ZnO–0.64 sample, and (d) XPS depth profiling on PbO/ZnO–0.64 sample.

As for the high-resolution XPS spectra, the Pb 4f spectra for all Pb-containing samples were recorded. It was noted that the fitting of Pb 4f levels were based on Pb 4f 5/2 level without the interference of levels from other elements, rather than Pb 4f 7/2 level partially overlapped with Zn 3s level. According to the rule of spin–orbital splitting, during the fitting of 4f levels, the area ratio and full width at half-maximum (FWHM) ratio of 4f 5/2 level to 4f 7/2 level were fixed at 0.75 and 1.00, respectively. As shown in Fig. 5(c), PbO/ZnO–0.64 comprised a simple spin–orbit doublet with a distance (spin–orbit splitting) of 4.7 eV. Only one pair of Pb 4f split orbits, with binding energies of 138.3 eV (Pb 4f 7/2) and 143.0 eV (Pb 4f 5/2) and with a FWHM of 1.8 eV, could be coherently fitted, thus indicating that Pb species had only one chemical state, which was assigned to Pb2+. Reference Thomas and Tricker27 Pb 4f 5/2 level of all other Pb-containing samples (figures not shown here) showed characteristics analogous to those of PbO/ZnO–0.64, except that the intensity varied due to the different content of Pb component introduced in samples. The above results confirmed the successful introduction of Pb2+ species into ZnO nanorods for all the PbO/ZnO–x samples with x values from 0.10 to 1.60, although only PbO nanocrystals were detected on PbO/ZnO–x samples with x values not lower than 0.64 (PbO/ZnO–0.64, PbO/ZnO–1.11, and PbO/ZnO–1.60). It was further speculated that Pb2+ species in PbO/ZnO–x samples with x values not higher than 0.40 (PbO/ZnO–0.10 and PbO/ZnO–0.40) existed on the surfaces of ZnO nanorods in the form of Pb2+ chemically (bonded) adsorbed or PbO clusters highly dispersed, Reference Bhachu, Sathasivam, Carmalt and Parkin24 or in the lattices of ZnO nanorods. Besides, it could be found from Fig. S1 that, with the increase of x, the relative intensities of Pb 4f/Zn 2p levels gradually increased, which confirmed the gradual increase of Pb contents in samples and agreed with the increase of relative intensities of PbO (111)/ZnO (002) diffraction peaks in the XRD patterns.
XPS depth profiling on PbO/ZnO–x samples was carried out to obtain Pb component distribution on ZnO nanorods. The atomic ratio of Pb/Zn as a function of etching time was acquired by a series of XPS measurements during the controlled Ar+ etching. The etching rate was about 12 nm min−1 compared to a standard sample of Ta3N5. As for PbO/ZnO–0.64, the atomic ratio of Pb/Zn sharply decreased from 0 to 20 s and then started to slowly decrease [Fig. 5(d)]. This result announced that only a thin layer, with a few nanometers, of PbO nanoparticles covered the surfaces of ZnO nanorods, which was also observed in the TEM image [Fig. 4(b)].
C. Band structure and optical properties
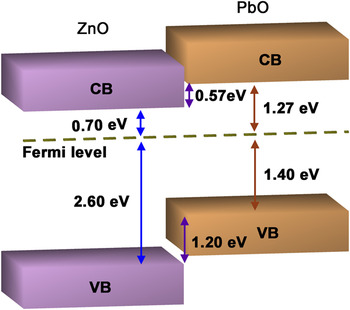
It was reported that orthorhombic PbO has a band gap of 2.67 eV (Ref. Reference Keezer, Bowman and Becker28) and a Fermi level above VB at binding energy of 1.40 eV. Reference Terpstra, de Groot and Haas29 ZnO has a band gap of 3.30 eV and a Fermi level above VB at 2.60 eV. Reference Guo, Jiang, Shen and Guo25 According to the above results, the band structures of PbO/ZnO composite are schematically illustrated in Fig. 6. It could be found that a type II band alignment could be formed in PbO/ZnO composite materials, in which the CB of PbO was a little higher than that of ZnO and the VB of PbO was a little lower than that of ZnO, and therefore the photogenerated electrons from the CB of ZnO could not transfer to the CB of PbO.
Schematic band structures of PbO/ZnO composite. CB represented conduction band, and VB represented valence band. The values in figure were referred to literature. Reference Keezer, Bowman and Becker28,Reference Terpstra, de Groot and Haas29

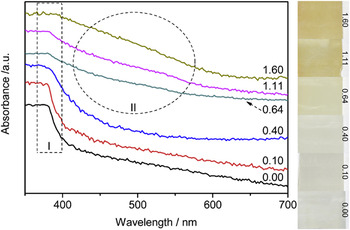
Figure 7 presents the UV-Vis spectra of PbO/ZnO–x samples. For all samples, a sharp decrease of absorbance was observed at around 380 nm (labeled as region I), which was in accordance with the absorption edge of the band-to-band transition. Moreover, for samples with x not lower than 0.64 (PbO/ZnO–0.64, PbO/ZnO–1.11 and PbO/ZnO–1.60), a new absorption hump appeared at around 470 nm (labeled as region II) and gradually increased with the increase of x. Combined with the XRD, SEM, TEM, and HRTEM results, it could be deduced that this new absorption band was ascribed to the band-to-band absorption of PbO, thus confirming the role of PbO as a visible-light-response sensitizer on UV-only-response ZnO host to construct PbO/ZnO composites. Besides, on the one hand, weak absorption in the range from 380 to 600 nm was displayed in all samples and was attributed to the defect level located between VB and CB of ZnO. Reference Djurišić, Leung, Tam, Ding, Ge, Chen and Gwo30,Reference Zhang, Qin, Xue, Yu, Zhang, Wang and Liu31 On the other hand, with the increase of x, absorption tail with wave length longer than 600 nm appeared and gradually enhanced, and could be ascribed to surface states and impurity levels caused by the introduction of Pb species. Reference Kudo, Omori and Kato32,Reference Shi, Ye, Li, Zhou, Tong, Xi and Guo33
UV-Vis spectra (right side: photographs) of PbO/ZnO–x samples with x equal to 0.00, 0.10, 0.40, 0.64, 1.11, and 1.60, respectively.

Figure 8 displays the photoluminescence (PL) spectra of PbO/ZnO–x samples. PbO/ZnO–0.00 showed two emission peaks at around 380 and 600 nm. The one UV emission peak near 380 nm was caused by radiative recombination of exciton pairs, i.e., photogenerated electrons and holes, and the other one visible-light emission peak near 600 nm originated from the defect level located between VB and CB of ZnO. Reference Djurišić, Leung, Tam, Ding, Ge, Chen and Gwo30,Reference Zhang, Qin, Xue, Yu, Zhang, Wang and Liu31 The above results were in accordance with those from UV-Vis spectra. Compared with PbO/ZnO–0.00, both the materials of PbO/ZnO–0.10 and PbO/ZnO–0.40 showed the above two emission peaks with greatly enhanced intensities. It could be inferred from the above results that, the introduction of Pb2+ increased the defects in the lattices or on the surfaces of ZnO nanorods, although PbO could not be detected by XRD, SEM, TEM, and HRTEM. Combined with the XPS results, it could be further speculated that the defects were generated by the bonding of Pb2+ or PbO clusters on the surfaces of ZnO nanorods or by the incorporation of Pb2+ in the lattices of ZnO nanorods. Reference Bhachu, Sathasivam, Carmalt and Parkin24 Nevertheless, both the above two emission peaks disappeared for all the materials of PbO/ZnO–0.64, PbO/ZnO–1.11, and PbO/ZnO–1.60. It could be deduced that, when PbO nanoparticles formed on and covered the surfaces of ZnO nanorods, owing to the narrower band gap of PbO compared with ZnO, the light incident on PbO/ZnO composites would be mainly absorbed by PbO rather than ZnO to hinder the photoexitation and subsequent photoemission on ZnO.
PL spectra of PbO/ZnO–x samples with x equal to 0.00, 0.10, 0.40, 0.64, 1.11, and 1.60, respectively.

D. PEC performance
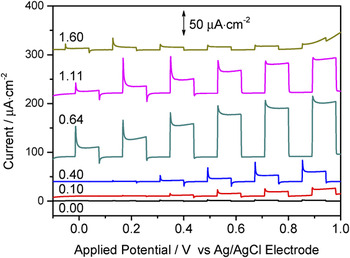
PEC performance of PbO/ZnO–x samples were measured by recording the current–potential (I–V) curves (Fig. 9) to evaluate the activities for water splitting under visible-light irradiation (λ > 420 nm). PbO/ZnO–0.00 showed negligible PEC response, with a photocurrent density of only 0.9 μA cm−2 under an applied potential of 0.8 V (versus Ag/AgCl electrode). This result was consistent with the UV-Vis result that ZnO displayed UV-only photoresponse and thus was incapable of harvesting visible light. Compared with PbO/ZnO–0.00, all Pb-containing samples showed obvious PEC activities. PbO/ZnO–0.10, PbO/ZnO–0.40, PbO/ZnO–0.64, PbO/ZnO–1.11, and PbO/ZnO–1.60 showed photocurrent densities of 14, 17, 94, 70, and 9 μA cm−2, respectively, under an applied potential of 0.8 V (versus Ag/AgCl electrode). It could be found that, with the increase of x, PEC activities of PbO/ZnO–x samples firstly increased and then decreased. PbO/ZnO–0.64 achieved the highest activity. The above results demonstrated that the introduction of Pb2+ component, no matter which kind of form it existed, improved the visible-light-driven PEC activity of ZnO nanorod arrays.
Current–potential curves of PbO/ZnO–x samples with x equal to 0.00, 0.10, 0.40, 0.64, 1.11, and 1.60, respectively. The curves were shifted up by 0, 10, 40, 90, 220, and 310 μA cm−2, respectively.

Combined with the comprehensive characterization and analysis of samples, the mechanism of activity improvement by Pb2+ component could be explained as follows. As for PbO/ZnO–0.10, PbO/ZnO–0.40, Pb2+ component existed on the surfaces of ZnO nanorod arrays in the form of chemically bonded Pb2+ or PbO clusters, or in the lattices of ZnO nanorods, hence leading to increased defects, Reference Bhachu, Sathasivam, Carmalt and Parkin24 which enabled ZnO to utilize visible light for PEC water splitting. Reference Bhachu, Sathasivam, Carmalt and Parkin24,Reference Zhang, Qin, Xue, Yu, Zhang, Wang and Liu31 With regard to PbO/ZnO–0.64, PbO/ZnO–1.11, and PbO/ZnO–1.60, PbO was coupled with ZnO to form PbO/ZnO composites with a type II band alignment. PbO as sensitizer absorbed visible light to excite the band-to-band transition and hence to obtain photoexcited charge carriers, of which electrons in the CB of PbO would transfer to the CB of ZnO, therefore ensuring the efficient separation of charge carriers to restrain their recombination. On the one hand, the above process resulted in the effective extraction of electrons onto ZnO nanorod arrays, along the length direction of which the collected electrons would further fast transported to FTO and finally arrived at the Pt counter electrode to take part in reduction reaction. On the other hand, the above process led to the remaining of holes in the VB of PbO to participate in oxidation reaction. In a word, PbO in PbO/ZnO–0.64, PbO/ZnO–1.11, and PbO/ZnO–1.60 enabled the visible-light absorption to generate charge carriers, and helped to construct PbO/ZnO composite with a type II band alignment and thus to accelerate the separation and transportation of charge carriers to generate photocurrent, finally enhancing the PEC activity of ZnO nanorod arrays. Moreover, the loading amount of PbO on ZnO nanorod arrays played a key role in optimizing the PEC activity. As for PbO/ZnO–0.64, only a thin layer of PbO nanoparticles evenly covered the surfaces of ZnO nanorods, guaranteeing the PbO to exert the advantages as discussed above and thus reached the highest activity. In contrast, with regard to PbO/ZnO–1.11 and PbO/ZnO–1.60, excess amounts of PbO filled up the space among the ZnO nanorods and thickly covered the tops of ZnO nanorods, giving rise to the massive aggregation of PbO particles, only a small proportion of which could contact with ZnO to form junction with a type II band alignment and contact with aqueous solution to form interfaces. In other words, with the increase of x, the gaps between ZnO nanorods were filled with an increasing number of PbO, thus resulting in the gradual decrease of effective surface areas of films, which were finally reduced to two dimensions. The massive aggregation of PbO particles restricted the movement of photogenerated charge carriers onto the surfaces for participating in the next step (i.e., oxidation reaction for holes, and transfer to ZnO for electrons) and thus promoted the recombination of photogenerated charge carriers in the bulk, eventually leading to the deterioration of PEC performance. Besides, the transient photocurrents were observed in all samples and were attributed to the defect level located between VB and CB of ZnO as evidenced by UV-Vis and PL spectra. Reference Yang and Luca34
IV. CONCLUSION
PbO sensitized ZnO nanorod-array films were synthesized by a two-step hydrothermal process. It was found that the amount of Pb source used during the hydrothermal process in the second step determined the forms of Pb2+ component existing on ZnO and thus affected the structures of PbO/ZnO nanorod arrays, and therefore played a key role in optimizing the PEC performance of samples under visible-light irradiation. With a molar ratio of 0.64 for Pb/Zn sources, only a thin layer of PbO nanoparticles evenly covered the surfaces of ZnO nanorods, guaranteeing the favorable excitation, separation and transfer of charge carriers to generate photocurrent and thus reached the highest activity of 94 μA cm−2 at 0.8 V (versus Ag/AgCl electrode).
Supplementary Material
To view supplementary material for this article, please visit http://dx.doi.org/10.1557/jmr.2016.150.
ACKNOWLEDGMENTS
This work is supported by the National Natural Science Foundation of China (Nos. 51302212 and 51323011), the China Postdoctoral Science Foundation (Nos. 2014T70915 and 2013M540745), the Natural Science Basic Research Plan in Shaanxi Province of China (No. 2014JQ2-5022), and the Postdoctoral Science Foundation in Shaanxi Province of China, and the Fundamental Research Funds for the Central Universities (2013jdhz20). Shi JW thanks Huang ZX for taking photographs of samples.