I
Adaptation to the consequences of climate change has recently developed into a growing field of concern in the insurance business community. Although the insurance industry was one of the earliest sectors to consider climate-related risks and develop models to underwrite natural hazard risks, the expected increase in climate-related risks has triggered a discussion on how to assure risk for natural hazards in the future (Mills Reference Mills2005). In the UK, for example, where the insurance market has been largely privatised since the 1950s following a ‘gentlemen's agreement’ with the state, extensive floods in 2000 drew attention to the problems inherent in this arrangement, which is currently due to result in a new public–private distribution of authority through an agreement reached in 2013. In Germany, similarly, widespread flooding such as that in Dresden around 2000 also resulted in renewed discussion on the responsibilities of insurance companies (Keskitalo et al. Reference Keskitalo, Vulturius and Scholten2014). Recent developments have raised the question of which insurance models to develop, and how to avoid uninsurability (or leaving risks to self-insurance) in the debate on climate adaptation (Duus-Otterström and Jagers Reference Duus-Otterström and Jagers2011).
Climate-related risks (natural hazards due to drought, flood, storms) are not, however, an entirely new concern in the insurance business. In order to deal with the changing structure of such risks, a large number of insurance organisational choices and strategies have been employed to mitigate the financial impact of extreme events and uncertainties associated with natural hazards. In the corporate insurance sector, reinsurance has traditionally been a method for dealing with relatively large, highly volatile and/or unpredictable risks (Pearson Reference Pearson1995; James et al. 2014). Less unpredictable risks have been absorbed by direct insurers using measures such as risk limitation, premium adjustments, tariffs and reserves to balance risk (Nasreen Reference Nasreen2009; Porrini and Schwarze Reference Porrini and Schwarze2014). In less-developed markets or where risk-induced demand for insurance has not matched the price of corporate insurance, self-insurance strategies or pooling risks mutually have been the more important risk assessment strategies adopted. In areas of national interest, where risks have been too high or difficult to underwrite in the corporate sector, or when the consequences of natural hazards have been considered catastrophic, public insurance programmes and or government aid/subsidies have been applied (Botzen et al. Reference Botzen, van der Bergh and Bouwer2010; Mahul and Stutley Reference Mahul and Stutley2010).
This article focuses on the mechanisms behind the development of insurance models employed to assure climate-related risks over time. In order to address this issue, we focus on the insurance models used to assure forests from the beginning of the twentieth century to the present day. This focus on forest capital stock (sum of standing and growing forest) is motivated for three reasons. Firstly, forest capital is vulnerable to changes in environmental conditions, making it subject to climate-related risks such as drought and storms. Secondly, forest capital is a major asset in the capital stock in a large set of countries supplying forest products, making it a concern for national risk management assessment. Thirdly, as the national trajectories of assuring forest capital witness, the underwriting of forest capital has been subject to a number of changes that help illustrate the underlying mechanisms in applying different models and strategies to mitigate climate-related risks (Brunette et al. Reference Brunette, Holecy, Sedliak, Tucek and Hanewinkel2015).
This study focuses on Sweden – a nation where forest capital has been a vital asset in the development of the national economy (Schön Reference Schön2012). Being one of the countries that abound in forest (FAO 2015), a study of Sweden may be of wider concern to other countries in their development of forest insurance. By consolidating a wide set of experiences and responses to hazardous events, adaptive behaviour in Swedish forest insurance can contribute to a wider understanding of insuring climate risks.
Based on the case of forest capital in Sweden, this study argues that climate-related risks have generally increased over time. In response to increasing climate risks, private forest owners have demanded insurance products that mitigate short-term income losses and costs associated with reforestation. When reliable methods for supplying forest insurance became available, risk-induced demand led to the long-term expansion of corporate insurance coverage. The expansion of corporate insurance, however, came to a halt when risk-induced demand could not be met at reasonable price levels. Raised premiums and tighter terms following historically extreme weather events in the twenty-first century made private forest owners hesitant to purchase full corporate insurance cover, putting pressure on government to provide natural disaster compensation systems to avoid national economic losses.
The remainder of the article is structured as follows. Section ii outlines the mechanisms behind risk distribution between different institutional sectors. In Section iii, we explain the methodological approach applied in the article. Section iv describes the forest capital stock and occurrence and magnitude of natural hazard events. Section v outlines the characteristics of the early self-insurance model, while Section vi describes the corporate insurance model. Concluding remarks are provided in Section vii.
II
Literature on societal adaptation to climate change in particular discusses adaptations in terms of the actions that are possible within any given adaptive capacity. Here, adaptive capacity is dependent on the socio-economic context in particular, that is the resources, knowledge, institutions and other capacities at the disposal of the adapting agent (ranging from individual to region or even higher-level units, depending on unit of analysis) (Smit and Wandel Reference Smit and Wandel2006). In order to understand adaptive capacity or adaptation in context, it is thus crucial to take real-life situations into account: to view adaptations or shorter-term coping mechanisms as they are undertaken in the present or have been undertaken in the past, and the factors that give these an advantage or a disadvantage in different cases (Keskitalo Reference Keskitalo2008).
Insurance has often been regarded as an important sector for adaptation to climate change (Mills Reference Mills2005), and responsibilities have often been distributed so that households and companies cover smaller losses while insurance covers medium-sized losses and the state acts as the ‘insurer of last resort’ (e.g. Botzen et al. Reference Botzen, van der Bergh and Bouwer2010). In turn, when the anticipated risk is low and the price of assuring an asset is high, households and companies are expected to employ self-insurance strategies. The self-insurance model will, however, seem less attractive when the anticipated risk rises, making demand for risk transfer though corporate action more attractive (see Mills Reference Mills2009).
The structure of insurance may be a mix of different layers (see Table 1). Great variation exists in the types of models or roles of the different layers that different states apply. There are also examples where states require specific public or compulsory insurance against natural hazards, or mandate that these are part of private home insurance. So far, housing protection in particular in relation to flooding has been emphasised strongly in relation to the role of insurance in adaptation (Botzen et al. Reference Botzen, van der Bergh and Bouwer2010; Keskitalo et al. Reference Keskitalo, Vulturius and Scholten2014). Examples of distributions of insurance models here range from, for example, primarily governmental responsibility for flooding in the Netherlands to a previously entirely market-based system in the UK (which is, however, currently in the process of changing to a mixed private and public system; Keskitalo et al. Reference Keskitalo, Vulturius and Scholten2014). One reason for the focus on flood risk so far in relation to insurance in adaptation has been that many areas that are already well developed are located on flood plains and will be at risk of flooding due to increasing climate change (Defra 2011; Surminski Reference Surminski2009). Such areas can be found in many countries, as habitations have traditionally been situated at the mouth of rivers, which are sources of fresh water, fish and transport. Flood plains have also constituted relatively fertile soil, suitable for agriculture. Large risk areas may consequently exist in several countries. Correct pricing of insurance – pricing related to risk – would make insurance for many such areas more costly and even have an impact on availability. In the UK case, it has been suggested that such price-related adaptations within the industry could be undertaken by area through regular price quotation services (e.g. insurance quote websites). However, novel features could also be developed to assure that correct risk assessments are made and to reward insurance policy holders in risk areas who nevertheless take measures to protect their property. Such measures, known as developing resilience (for example, door-or-floor infrastructure support), would, however, require correct on-site assessments of the types of resilience necessary for each property, and also require more detailed online or other tools in order to offer correct price quotes. To do this, cross-subsidies where e.g. homes are given the same price quote based on region rather than on specific risk would have to be removed (sometimes resulting in price increases without any change for the consumers as prices are adjusted to actual levels). New development in such areas could be discouraged (also benefiting flood risk) by requiring and strongly enforcing insurance, including flood insurance, in order to be granted a mortgage (Keskitalo et al. Reference Keskitalo, Vulturius and Scholten2014).Footnote 1
A multi-layered insurance structure

Source: Botzen et al. Reference Botzen, van der Bergh and Bouwer2010.
In the case of insurance in relation to properties other than housing, however, potential for protection may depend on other factors. While, for example, forest protection policies may be fewer in number, making it easier to develop pricing related to risk, forest protection may impose higher levels of demand on policy holders (Brunette et al. Reference Brunette, Holecy, Sedliak, Tucek and Hanewinkel2015). While housing property insurance today has a high coverage in developed states, a forest insurance holder would need to first assess themselves as having sufficient risk or size of holding for insurance to be necessary. Secondly, forest insurance in relation to event risk may be split into several different insurance categories, such as storm/wind insurance, fire insurance or other. This means that insurance companies would need to be able to judge risk accurately in order to price insurance accurately, and the potential number of policy holders suffering these risks would need to be viable for the company to provide specialised insurance. In addition, any state policies to mitigate disasters would need to not constitute moral hazard, that is disincentives to those at risk from natural disasters to undertake preventative measures (see Botzen and van der Bergh Reference Botzen and van der Bergh2008).
Thus, in the longer term, climate change risks may also make insurers potentially unwilling to set premiums for climate change-related risks at levels consumers are willing to pay (Hecht Reference Hecht2008; Schwarze et al. Reference Schwarze, Schwindt, Weck-Hannemann, Raschky, Zahn and Wagner2011). For example, even large surplus insurers withdrew from the pollution insurance market in 1984. They assessed underwriting environmental liability insurance at marketable rates as untenable. Similar problems occurred in the reinsurance market after the insurance industry grossly underestimated potential losses from Hurricane Andrew in 1992. Historically, the reinsurance market has also faced problems of catastrophic loss coverage, e.g. after the Northridge earthquake: ‘limitations on reinsurance capacity have limited the catastrophic insurance market’ (Hecht Reference Hecht2008, p. 1584).Footnote 2 The questions of which insurance models to develop and how to avoid uninsurability (or leaving risks up to self-insurance) have been a concern in forest insurance for a long time.
III
Forest is a relevant area for insurance given that trees planted or seeded today will often stand, in boreal areas, for at least some 70–90 years. Consequently, forest will be exposed to a long period of potential climate change, including potential risks for increasingly extreme events such as storms or forest fires. Given the variation in how different countries approach insurance, it may also be relevant to review whether and to what extent adaptive capacities and methods of adapting in particular can be learned from historical cases and real examples of coping with hazards. Historical analogues are cases ‘whereby past and present experience and response to climatic variability, change and extremes are examined to uncover knowledge about vulnerabilities and adaptive behaviours' (Ford and Furgal Reference Ford and Furgal2009, p. 381). Utilising historical analogues, a comparison is thus made in terms of adaptation strategies, not in terms of severity of event (as severity of events is likely to increase in the future, changing the baseline of extreme weather incidence; see Phelan Reference Phelan2011). Our approach is thus mainly to review different types of insurance models and how they have been discussed – and supported or not – historically within the specific national context.
This article provides a historical case study of Swedish forest insurance. The focus is on Sweden from the early twentieth century up to the present day. Sweden is one of the countries where hazardous events (e.g. storms) have had devastating effects on growing forest in recent years and historically (Blennow Reference Blennow2008; Holmberg Reference Holmberg2005). Forest resources are renewable and thereby sensitive to climate change and require adaptive behaviour. Renewing forest is a long-term assignment given the long tree-growth cycles; it demands a strategy that accounts for how events far into the future will affect assessment of risk.
In order to trace how insurance industry adaptation strategy has changed over time, historical experience of mitigating climate risk is compared within the forest sector. This article describes the historical evolution of forest insurance and identifies key responses to climate variability and change in order to compare adaptation strategies. Insuring forest resources implies insuring the natural growth of assets, i.e. assets that accumulate value over long periods of time. To protect against losses of such assets, response to changes in climate and extremes is a key issue. Whereas crop insurance, which developed early in the nineteenth century, mitigates short-term (annual or seasonal) effects of natural hazards (storms, flood, frost, drought, hail etc.), forest insurance or tree crop insurance has historically faced difficulties in developing strategies to adapt to changes in risk and value of assets over the long term. Especially in cases where long tree-growth cycles predominate, the necessity of adjustment to climate variability is expected to be strong (see Keskitalo Reference Keskitalo2008). The research comprises a combination of archival documents and reviews of trade journals, reports and communications from government compiled by the forest sector, insurance industry and government.
IV
The Swedish forest sector developed into an independent and commercial sector in the late nineteenth century. Demand primarily for sawn timber from industrialised countries in Western Europe initiated an intense harvest of timber resources. The timber frontier moved from Norway to Sweden and later Finland and Russia from the mid nineteenth to the early twentieth century (Björklund Reference Björklund1984; Östlund Reference Östlund1993). Private forest owners, but primarily forest companies, harvested timber intensively, making forestry management a part of the public debate in the early twentieth century (Arpi Reference Arpi1959). The long-term sustainable management of forestry was first regulated nationally by the Swedish Forestry Act passed in 1903. At that time 50 per cent of the productive forest was owned by individuals, 25 per cent by joint-stock companies and 25 per cent by the state and church. The Forestry Act was aimed at informing forest owners of the necessity of managing forest, supporting forest owners with consultancy services and providing training and education for private owners. The Forestry Act appears more to inform than command forest owners in the management of forest resources. Regional forest agencies were put into place by government to train forest owners in management.
Although the regulators supported self-reliance, a strong element of scientific management developed early on in the Swedish forest sector. Törnquist (Reference Törnquist1995) shows how scientific results were used to essentially identify one ‘right way’ of conducting forestry. An economic growth-oriented perspective was developed to maximise forest growth by the optimal use of the growing capacity of the soil. Such a growth perspective was regarded as the key to turning forest owners into contributors to the national economy. Forest owners were persuaded to fulfil societal goals by creating a sense of duty with regard to forest management. Also forest organisations such as the Forest Society and the forest owners' association shared the same management view. The silvicultural system adopted was based on even-aged forest stands where harvest was achieved by clear-felling (Enander Reference Enander2000). Such a system was developed in the interwar period and became almost fully dominant in Swedish forestry from the 1950s.
The economic growth paradigm of forest management contributed to an upward shift in timber supply. The Swedish forests had, due to intensive harvesting in the late nineteenth and early twentieth century, caused timber to be in short supply by the 1920s and 1930s. Active forest management measures, reinforced by the Forestry Acts of 1918, 1923 and 1948, were one of the factors behind increasing forest supplies in the post-1930 period. The forest supply for use (
 $\emptyset \gt \,$
15 cm) increased from 1,200 million cubic metres (m3) in 1928 to 1,800 million m3 in 1968 (Skogsstyrelsen [Swedish Forestry Agency] 1950, 1970). Postwar forest management was guided by detailed regulation on measures to maximise the supply of standing timber. The 1979 Forestry Act authorised the most detailed and production-oriented Swedish forest policy, placing focus squarely on harvesting by clear-felling with exceptions only for shelter wood or seed trees. Harvest was even enforced by law on low-productive forests (Stjernquist Reference Stjernquist, Ekelund and Hamilton2001).
The tight supply regulation measure was, however, relaxed by the 1993 Forestry Act in which forest owners' influence on forest management was strengthened. The former single focus on the forestry production goal was also supplemented by a biodiversity goal, inserting environmental concerns into forest management (Siiskonen Reference Siiskonen2013). As with the 1903 Act, self-responsibility and training of forest owners were put forward as the key measures for achieving national forestry goals. Although alternative forestry methods to clean-felling became possible, only minor changes appear to have been made in forest management. The supply of forest for use has continued to expand even after this regulatory shift in 1993.
Figures from the Swedish Forest Agency show that standing timber for use (
 $\emptyset \gt\,$
15 cm increased from 2,100 million m3 in 1993 to 2,600 million m3 in 2010 (Skogsstyrelsen 1993, 2010). Due to active, production-oriented management and expansion of forests areas, the capital inherent in growing forest has expanded for most of the last 100 years. Financial contributions to such management have been shared 50/25/25 between individual owners, joint stock companies and the state respectively over the last 100 years. However, this output-maximising silvicultural system also generated increased risk of losses due to natural hazards (Nilsson et al. Reference Nilsson, Stjernquist, Bärring, Schlyter, Jönsson and Samuelsson2004).
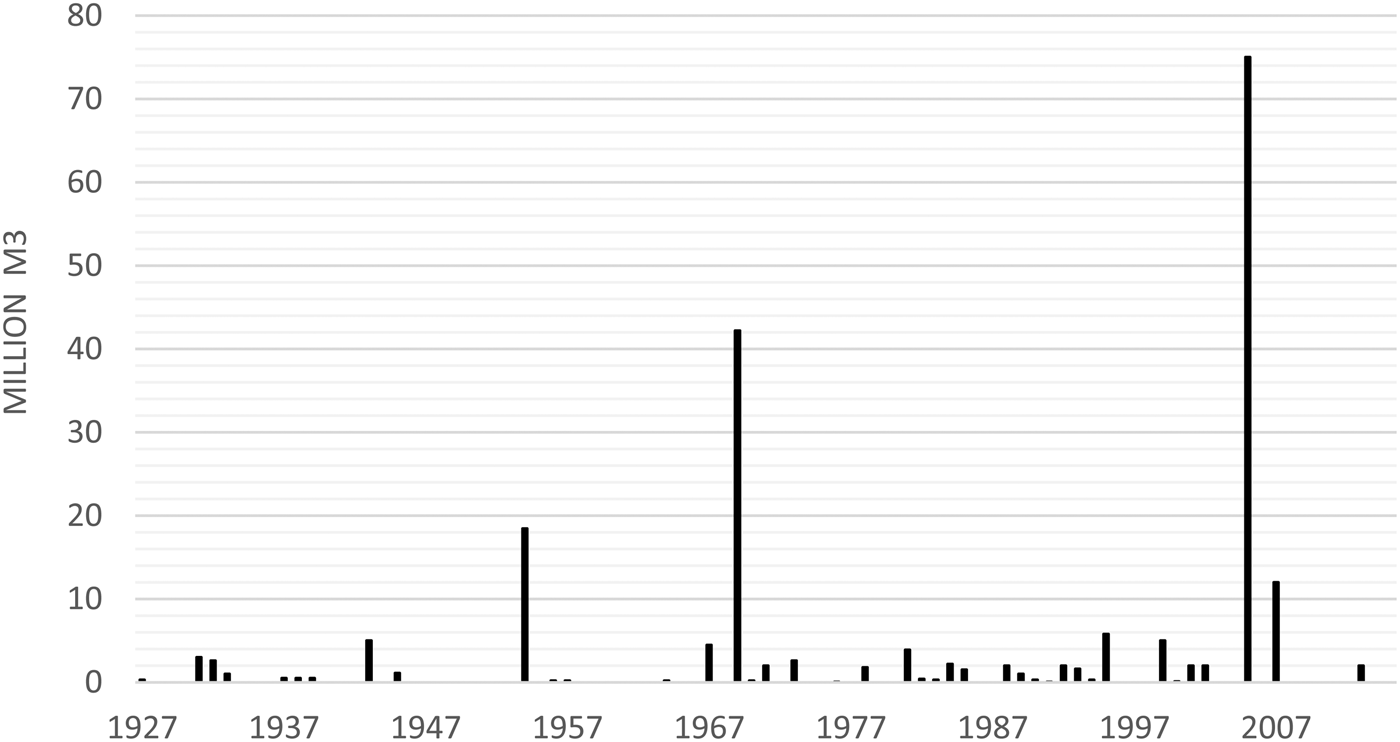
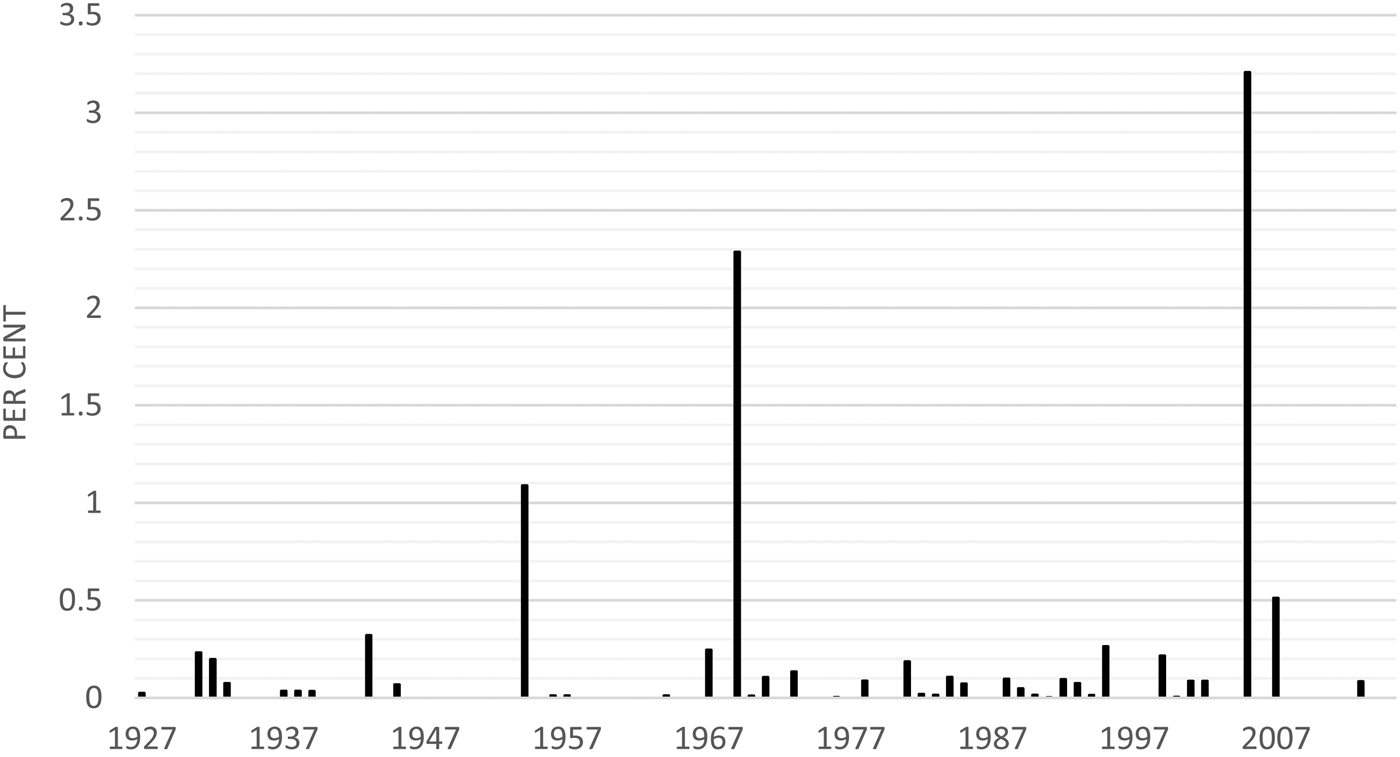
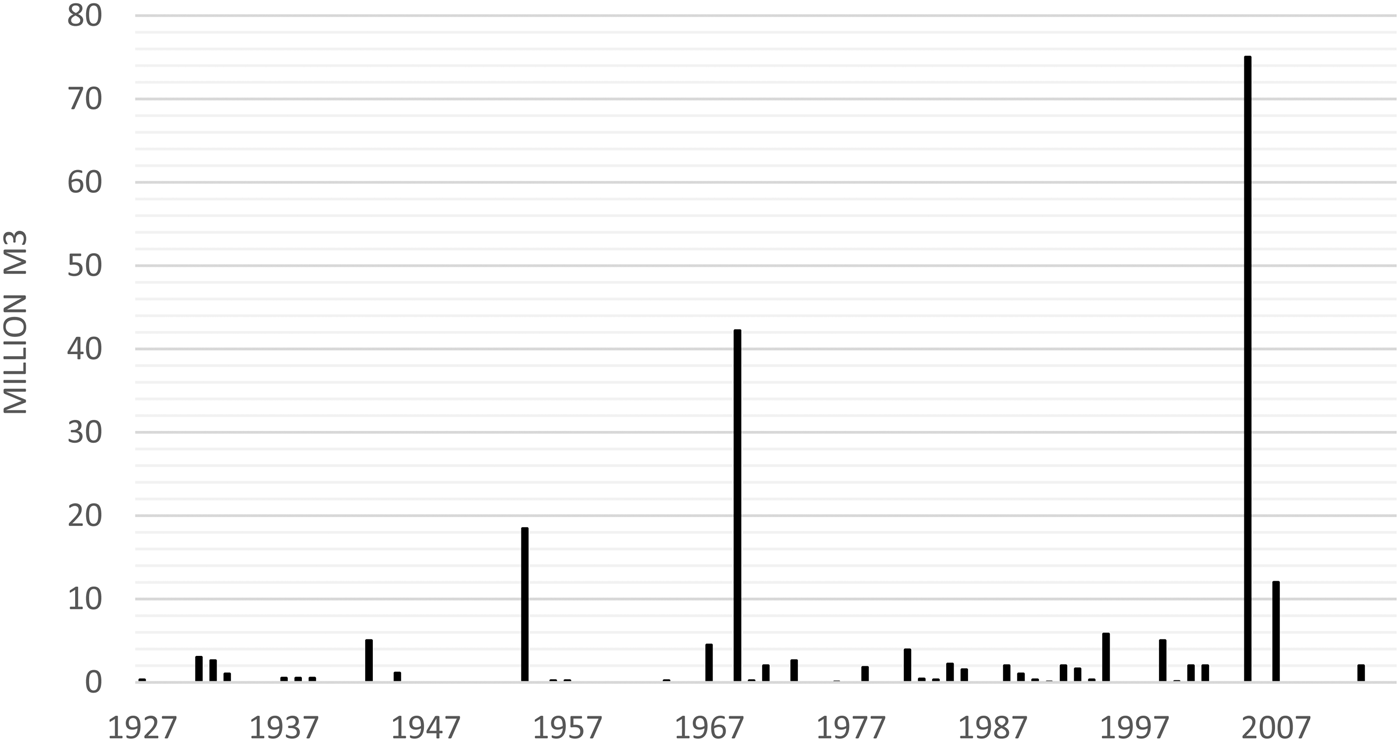
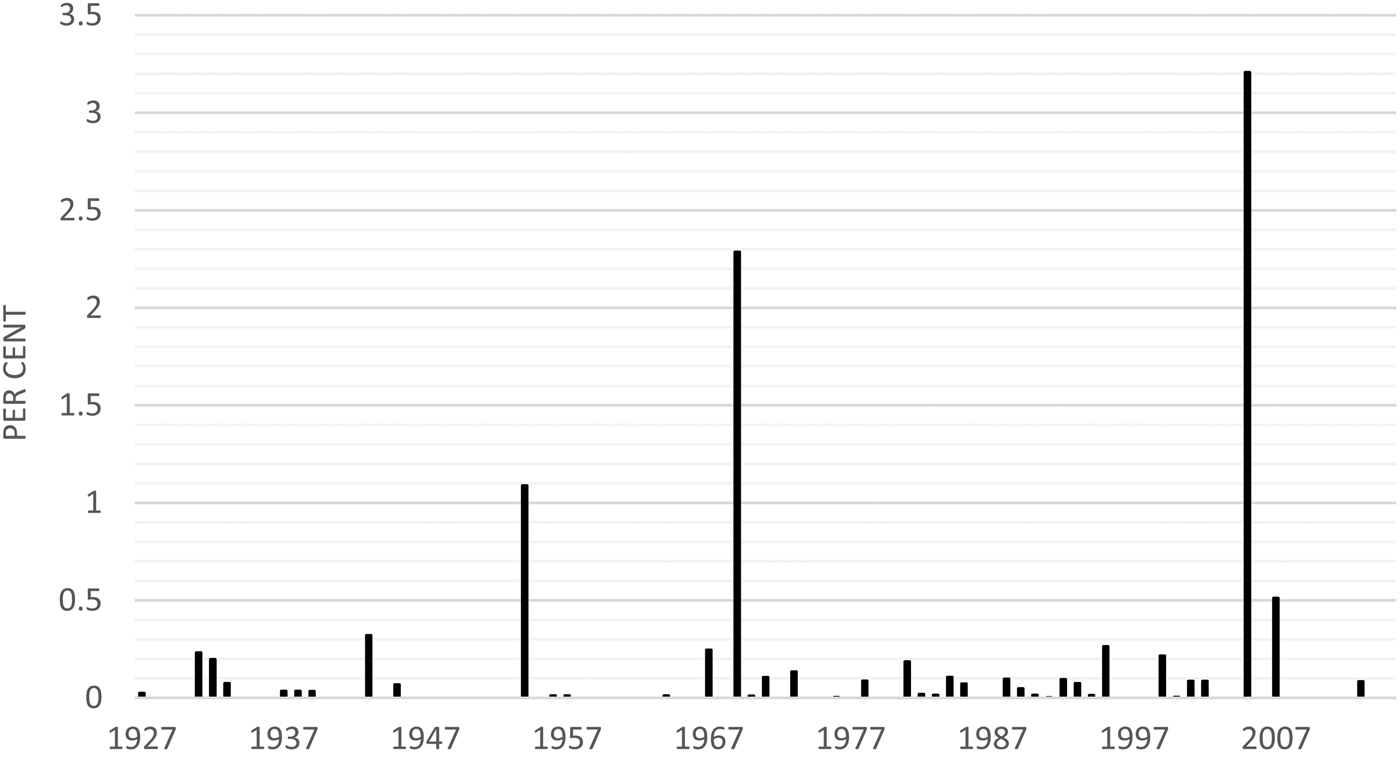
The growth and value of timber have repeatedly been damaged by severe natural hazards. Sweden currently has a largely market (corporate insurance) based natural hazard insurance system where there is no compulsory insurance at individual level against natural hazards or public insurance (Vulturius and Keskitalo Reference Vulturius and Keskitalo2016). Since the early twentieth century, severe storm damage has, a number of times, caused extensive destruction of forest capital. In an overview of storm damage in Swedish forest between 1901 and 2000, Nilsson et al. (Reference Nilsson, Stjernquist, Bärring, Schlyter, Jönsson and Samuelsson2004) recorded 77 major storm-damage events. These storm events were not equally dispersed over the 100-year period. In the early part of the twentieth century, the data show that storms were less frequent. In the period 1900 to 1930, five major storm events were identified (7 per cent of all storms). In the period 1931 to 1960 the number of storms increased substantially (18 events), and in the following two decades between 1961 and 1981, 36 storm-damage events occurred. Storm frequency decreased for the period 1982 to 2000 in which 18 events occurred. In total, the volume of storm-damaged forest during the century was estimated at 110.7 million m3. Most of the damage took place during the 1950s and 1960s (1954 and 1969 were peak years), representing half of total damage for the period 1901–2000. On these two occasions 1.1 and 2.3 per cent respectively of the total stock of standing timber for use was damaged by high winds.
During the twenty-first century a number of devastating hurricanes caused major damage. Hurricane Gudrun in 2005 laid waste 75 million m3 of wind-damaged forests. Financial losses were estimated at SEK 15,000 million (Svensson et al. Reference Svensson, Bohlin, Bäcke, Hultåker, Ingemarson, Karlsson and Malmhäll2011). In some areas more than half of all forest was damaged, causing substantial financial losses. This hurricane damaged the equivalent of three years of timber harvest in southern Sweden. More than 3 per cent of the total stock of standing timber for use was damaged by the same hurricane. In 2007 Hurricane Per caused losses equal to 12 million m3 of wind-damaged forests and in 2013 storm Simone resulted in 1.5 to 2 million m3 of wind-damaged forests (financial losses were preliminary estimated at SEK 800 million; SR 2013). Figures 1 and 2 give an overview of the magnitude of wind damage in million m3 and as a percentage of the standing stock of timber for use.
Wind damage (million m3) to forest in Sweden, 1927–2013
Wind damage as share (%) of total stock of standing timber for use in Sweden, 1927–2013
In addition to wind damage, fires have caused recurrent damage to Swedish forest supply. Fire hazards are largely related to weather conditions with a positive link to factors such as temperature, lack of precipitation and wind. The human factor also has an impact on fire. The presence of ignition sources is very closely related to fire hazards. In fact, most of the fire damage to European forests is related to the human factor (Schelhaas Reference Schelhaas2008). Although human activity has generally increased due to changes in forestry, tourism and other activities, long-term records of fire events based on wood samples show a decline in fire events over the last millennia. The more intensive use of forest related to industrial demand, in combination with firefighting measures, may be some of the reasons behind the decline in fire frequency in the twentieth century compared to previous centuries (Niklasson and Granström Reference Niklasson and Granström2000; Niklasson and Drakenberg Reference Niklasson and Drakenberg2001).
Systematic reporting of fire events was included in the official statistics on forestry from the 1940s (Skogsstyrelsen 1942). Historical records compiled by the Forestry Agency also provide five-year averages back to 1915 (Skogsstyrelsen 1950). Pre-1915 fire reports are also available, but only for state-owned forest since the 1870s (Gjallarhornet, 1914–15). The post-1915 data source is based on firefighting reports, limiting the sample to fires that were identified and fought (Statens brandinspektion, later Myndigheten för samhällsskydd och beredskap) (Skogsstyrelsen 1950). Statistics on fire events include the number and the size of the fire events. The scope of fire events is measured by hectare of damaged productive forest. The data are aggregated to the county level (24 administrative areas in Sweden). The statistics show that all counties have repeatedly been exposed to fire hazards since the 1940s.
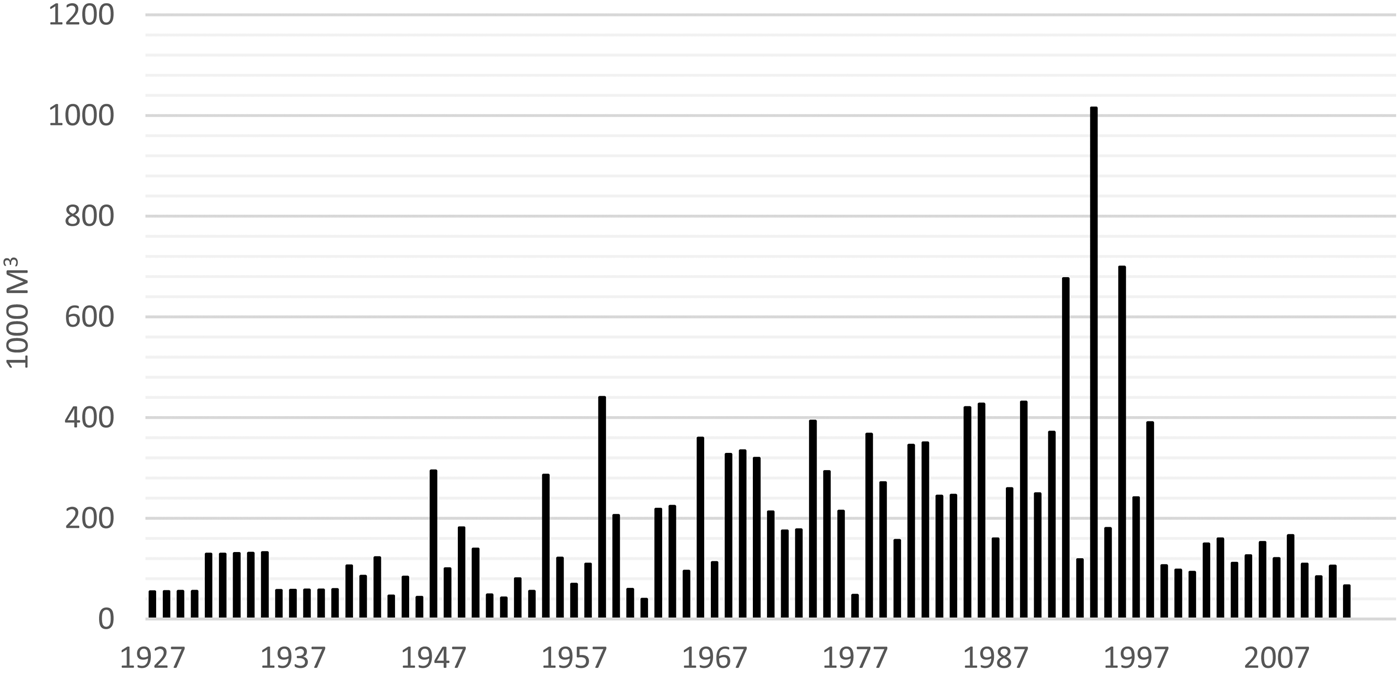
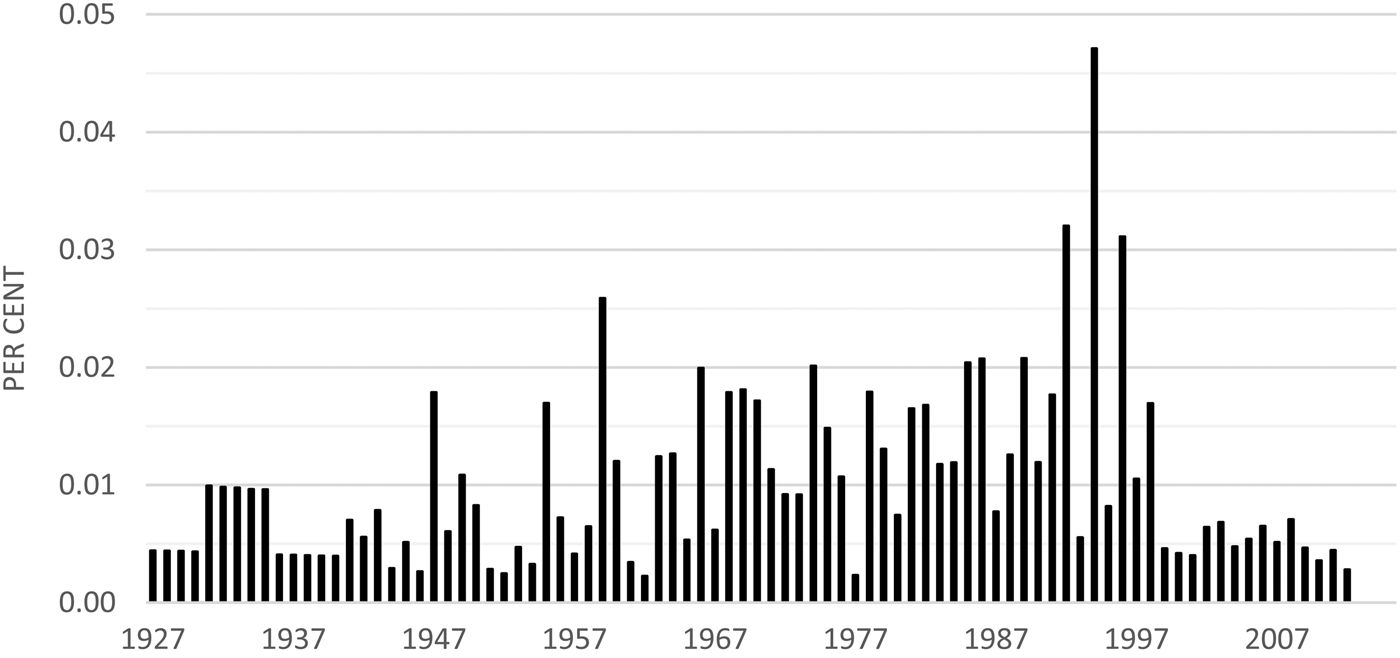
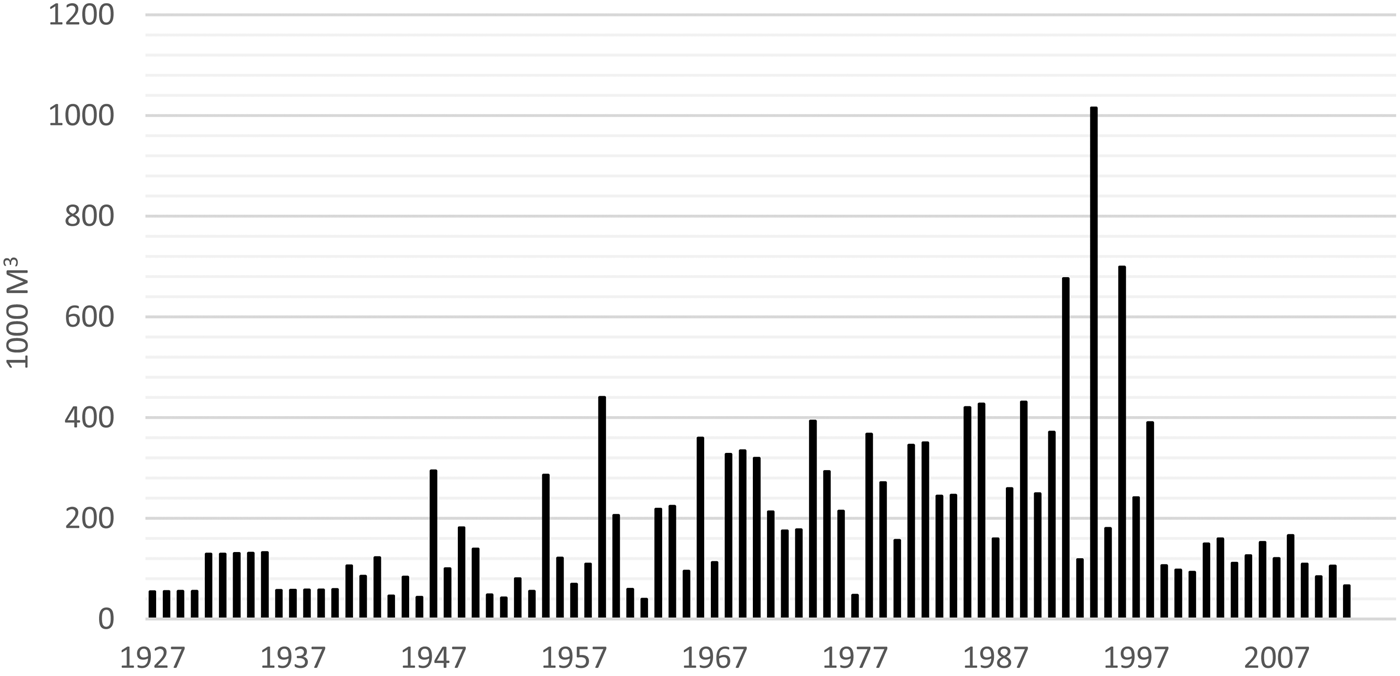
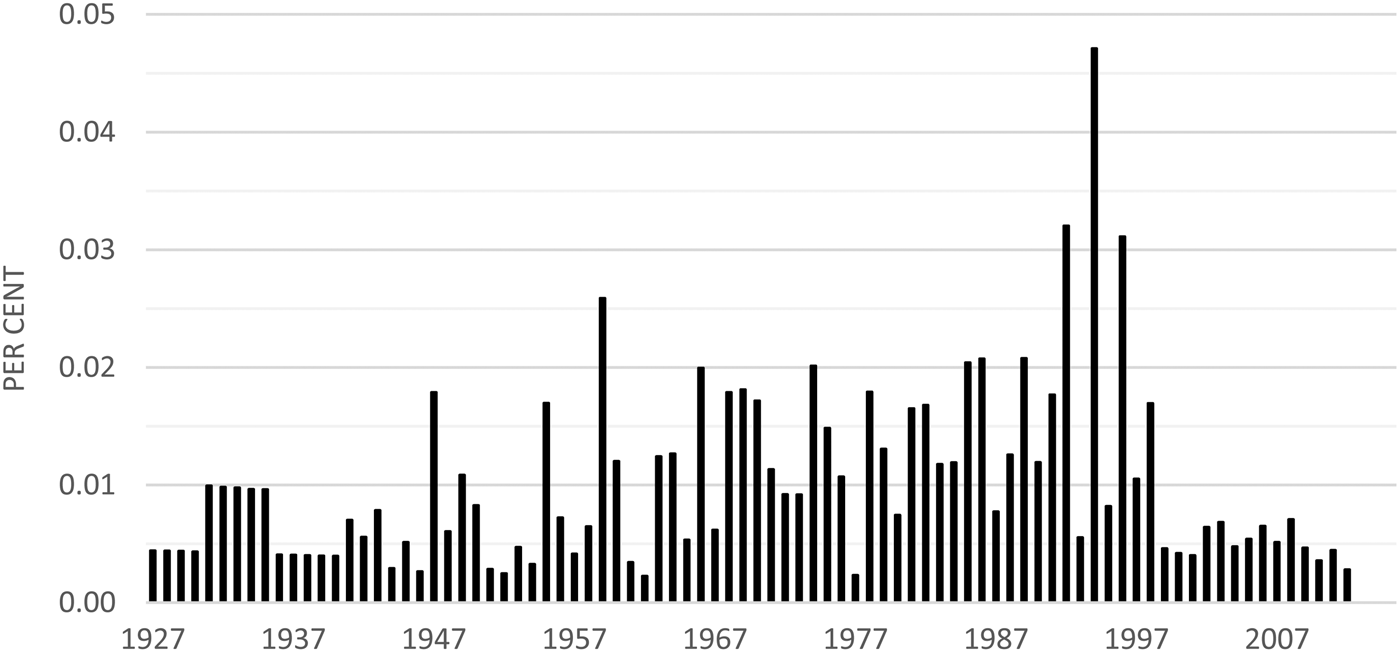
Assuming a random sampling of fire areas in the forest population, fire damage measured by hectare can be converted into volume of fire-damaged timber. In Figures 3 and 4, the fire damage in forest is reported in cubic metres (1,000 m3) and as a percentage of the stock of standing timber for use in Sweden during the period 1927 to 2012. The figures demonstrate that fire events have, on average, damaged 194,000 m3 of timber annually since the late 1920s. The distribution of events is not equal in all years. The scope of fire damage was kept low before World War I (
 $\bar X =$
84,000 cubic metres) according to the fire reports. Post 1942, when annual reports are provided, fire damage appears to have increased to a continuously higher level (
 $\bar X =$
220,000 cubic metres; 1942–90) up until the 1980s. A number of major fire events in the 1990s led to substantial damage to standing timber. Since the late 1990s, the scope of fire damage to standing timber has decreased to the historical average. The share of the standing timber for use affected by fire was, on average, 0.01 per cent. At most 0.05 per cent of the stock of timber was damaged by fire.
Fire damage (1,000 m3) in forest in Sweden, 1927–2013
Fire damage as share (%) of total stock of standing timber for use in Sweden, 1927–2013
A comparison between fire and storm hazards shows that the volume of standing timber damaged by storms was 12 times greater than the volume of timber damaged by fire events during the period 1927 to 2013. The volume figures on damage may not, however, be equal to the figures on financial losses. Pricing of risk derived from one of the larger insurance companies shows that anticipated loss is expected to be approximately nine times higher for wind damage as compared to fire damage at present (calculation based on a price example derived from Länsförsäkringar 2013).
V
The forest sector became a concern for corporate insurance in the late nineteenth century. At that time, the corporate insurance industry supplied insurance for both the household and business sectors. Corporate property insurance covered a large proportion of private buildings, equipment and machinery (Adams et al. Reference Adams, Lindmark and Andersson2006). Also losses due to storm, hail and flood were mitigated by an increasing supply of insurance covering growing crops on agricultural land. In the forestry sector, buildings, machinery and stock were largely covered by corporate insurance. However, growing forest carried much less insurance against physical hazards. Although attempts to introduce forest insurance were made in the late nineteenth century, this particular part of the insurance business developed poorly.
One of the first attempts to introduce forest insurance was made in the late 1870s. At that time, fire was conceived as the main hazard to insure against, while storms were considered of minor importance. However, the first forest insurance company, headed by the director of Royal Swedish Forest Institute, attracted only a few forest owners (Försäkringsföreningens tidskrift, 1878–83), which made it difficult to start up a purely forest insurance company. An attempt to introduce a mutual company in 1911, based on forest owners' interests, also suffered from lack of interest among private forest owners (Gjallarhornet, 1912).
Moreover, forest insurance was not developed within the small mutual fire insurance pools present in the countryside at the time. Given the role mutual insurance pools played in underwriting fire risk for buildings and moveable property in rural areas, as noted by Adams et al. (Reference Adams, Andersson, Lindmark and Veprauskaite2012), the integration of forest into the portfolio may seem unexpected. However, the dispersed structure of countryside populations following nineteenth-century land reforms, meant the trees in the forest represented an accumulated risk. If a fire broke out in the forest, it is likely that more than one tree would burn down, and in dry, windy conditions the total loss may be great and affect everyone within the insurance pool. The accumulation of risk made pricing difficult, and consequently placed constraints on the development of forest insurance in general.
Due to the failed attempts to introduce full-scale insurance covering all types of forest, the only forest insurance available was limited to ordinary fire insurance. In such lines of insurance, forest was treated as inventory and insurance coverage was limited to fully grown forest close to final felling age (Försäkringsföreningens tidskrift, 1912). The limited scope of insurance left the Swedish forest largely uninsured by the corporate insurance sector. Since private forest owners were not covered by public insurance nor by other supportive measures to mitigate losses due to fire or wind, forest owners relied largely on a model based on self-insurance. Self-insurance meant that forest owners had to take on all losses themselves.
The predominance of such a self-insurance model might seem surprising – given the requirement to insure large values of growing timber against anticipated risk of fires damage – unless the difficulties of underwriting the risk are taken into account. Underwriting of risk by insurance companies was complicated by the lack of records. Fire records were kept for state-owned forest in the northern part of Sweden only. The records indicated that the average share of forest damaged by fire equalled ¾ ‰ (annual hectare damaged by fire divided by total forest area), but disputes about ‘true’ risk probability and volatility seem to have complicated underwriting at competitive premium rates.
Early forest insurance companies were unable to incorporate the forest life cycle into their underwriting. Insurance companies had not yet developed methods for assessing current value of growing forest, neither could they balance changes in present value with changes in loss-ratio over the life cycle (older trees usually suffer less fire damage). Therefore it could be argued that uncertainty on average risk and risk distribution together with undeveloped methods of calculating insurance values were the primary reasons for the lack of progress in forest insurance. Contemporary explanations for the lack of progress further state that the lack of demand could be due to the limitation in insurance coverage (growing forest exempted) and the high deductible rates (25 per cent of losses). Based on early German experiences, the Swedish Insurance Inspectorate also recognised the difficulties of running the forest insurance business profitably if competitive premiums were offered on forest of all ages (Försäkringsföreningens tidskrift, 1914–15).
VI
In the summer of 1914, Swedish forests were affected by devastating fire events (Gjallarhornet, 1914–15). Approximately 25,000 hectares of forest was damaged, making up 1 million to 1.5 million m3 of fire-damaged forest (Försäkringsföreningens tidskrift, 1927). These large-scale fire events called for action from forest owners, insurers and the government. A lively discussion followed on models of how to mitigate the financial consequences of forest fires. The main dividing line among the actors was the institutional arrangement: whether insurance should be voluntary and supplied by a voluntary joint corporate and mutual fire insurance model or whether it should be compulsory and supplied by the state as a compulsory public insurance model.
Representatives of forest owners argued for a mutual fire insurance model. A mutual fire insurance model would have the advantages of binding their collective interest in fire insurance together among forest owners in a non-profit organisation. Forest owners would function both as policy holders and owners of the insurance pool. In late 1914, a start-up proposal was submitted to the Insurance Inspectorate (Gjallarhornet, 1914–15). According to this proposal, fire insurance would be supplied to all privately owned productive forest of all ages at a fairly low (1¼‰) average premium rate (annual premium payments divided by sum insured). To secure against the volatility of fire events, an ex-post premium clause was attached to the proposal, stating that three times the annual premium payments could be charged in the event of a major fire (Försäkringsföreningens tidskrift, 1914–15). To contribute the required guarantee capital according to 1903 insurance legislation, an affiliated joint-stock company would own the mutual company in its first year of operation. Equity holders in the affiliated company were guaranteed a high return on investment (Gjallarhornet, 1914–15).
The Insurance Inspectorate decided to reject the proposed mutual fire insurance model. Objections were raised concerning the solvency of the company, due to underestimation of risk probability (and therefore premiums too low) and lack of reserves to handle the volatility of risk. The Insurance Inspectorate argued that higher premiums and larger guarantee capital would not tackle the basic problems of private forest insurance – the trade-off between the solvency of the insurer and insurance coverage. Higher premiums would reduce insurance coverage, leaving most of the forests uninsured. Lower premiums in turn would generate reserves too small to cover the financial consequences of hazardous fire events.
The Swedish Insurance Inspectorate proposed a compulsory public insurance model, organised as a state-governed company. Such a compulsory public insurance model was considered as advantageous in order to smooth out the risk distribution over the forest life cycle and to keep down premiums for young forests (that inherited the largest risks). The high premium considered as a necessary mark-up for the high risk of young forest in private insurance would, according to the Insurance Inspectorate, hamper demand for insurance. Lack of insurance coverage for young forest could discourage forest-owner investment in reforestation and maintenance of growing forest, and thereby reduce the value of forest for future generations (Försäkringsföreningens tidskrift, 1915–16).
The Swedish Parliament, however, rejected the compulsory public insurance model proposed by the Insurance inspectorate. The government accepted the mutual fire insurance model proposed by representatives of forest owners (Sveriges Riksdag 1916). However, the mutual fire insurance model turned out to enjoy rather weak support among forest owners. Uncertainty over the solvency and governance of such a mutual fire insurance model reduced interest in signing up for insurance. Supporters of the model argued that the Insurance Inspectorate had disparaged the mutual fire insurance model to the extent that credibility was lost among private forest owners. Lack of demand for forest insurance as such was not considered the main difficulty among forest owners (Gjallarhornet, 1916–17).
The traditional self-insurance model was later, in the 1920s, challenged by a corporate fire insurance model. As early as in 1911, the Tariff Association initiated a committee to examine a forest insurance that promised to encompass forests over their full life cycle. Expertise on forestry was engaged to model the value of growing forest. One of the achievements was to calculate the current value of growing forests at different ages so a distinction could be made between current values of future growth in forest not matured for final felling and the current value of cutting forest. As fire events are generally believed to mainly damage forests not matured for felling, while a larger part of forests matured for felling can be retained, the design of insurance on that basis would price the risk more accurately. Premium calculations over the life cycle would thereby give a higher premium rate for a young forest compared to an old forest, unless premiums were evened out across the life cycle. The proposal was made in 1912, but it was not accepted until 1919 by the companies that were members of the Tariff Association (Försäkringsföreningens tidskrift, 1927, 1937).
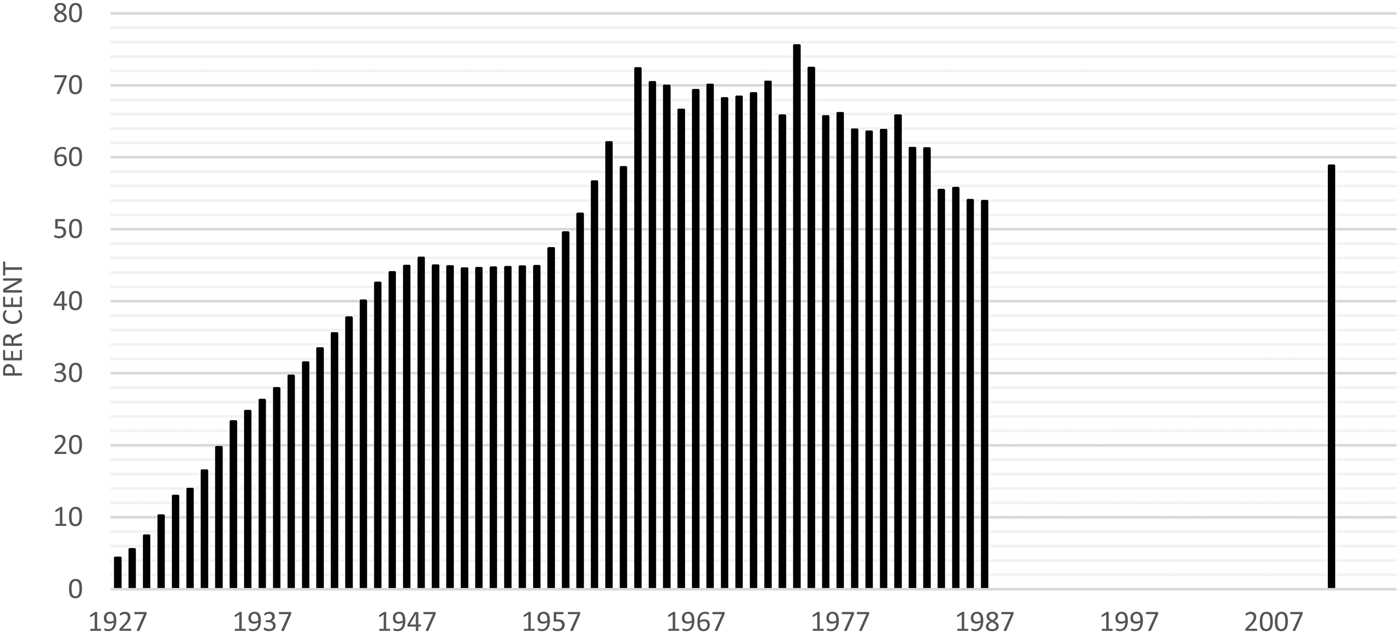
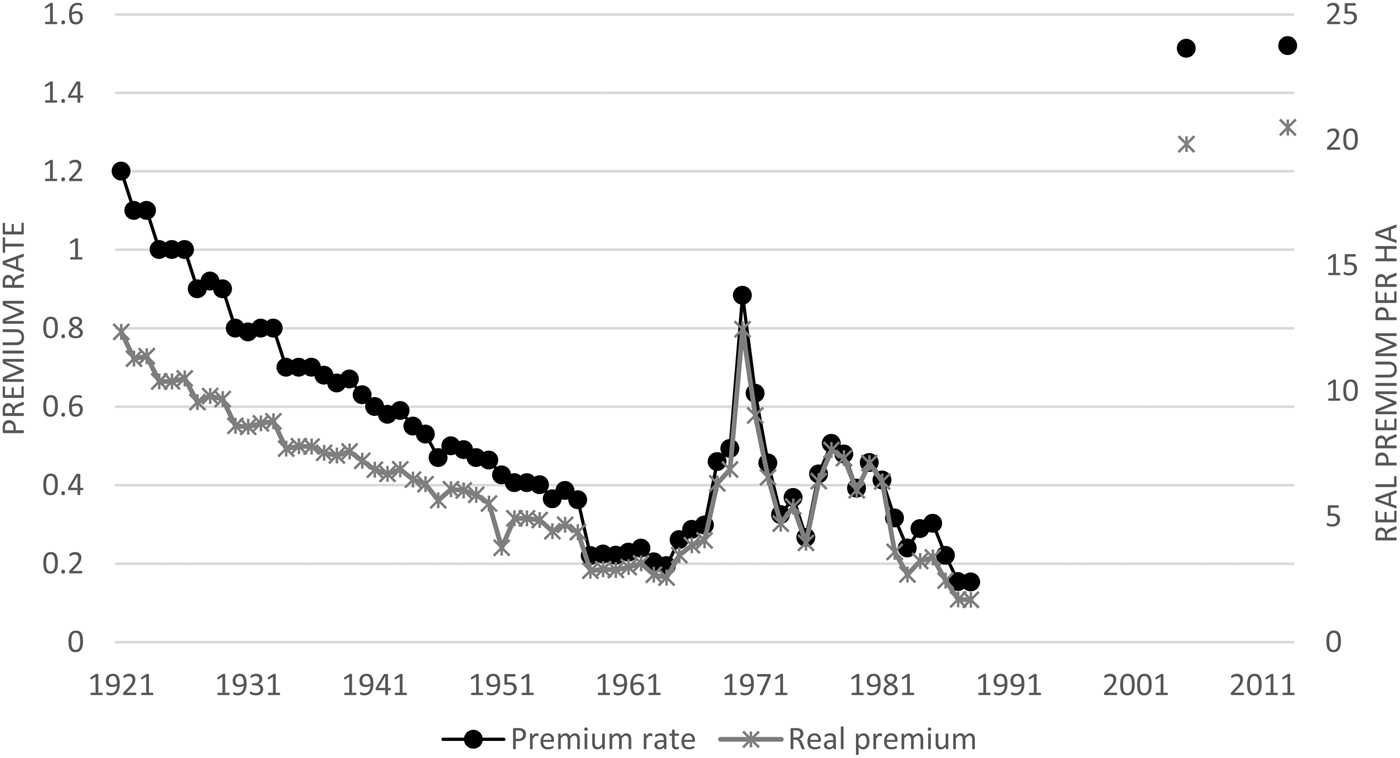
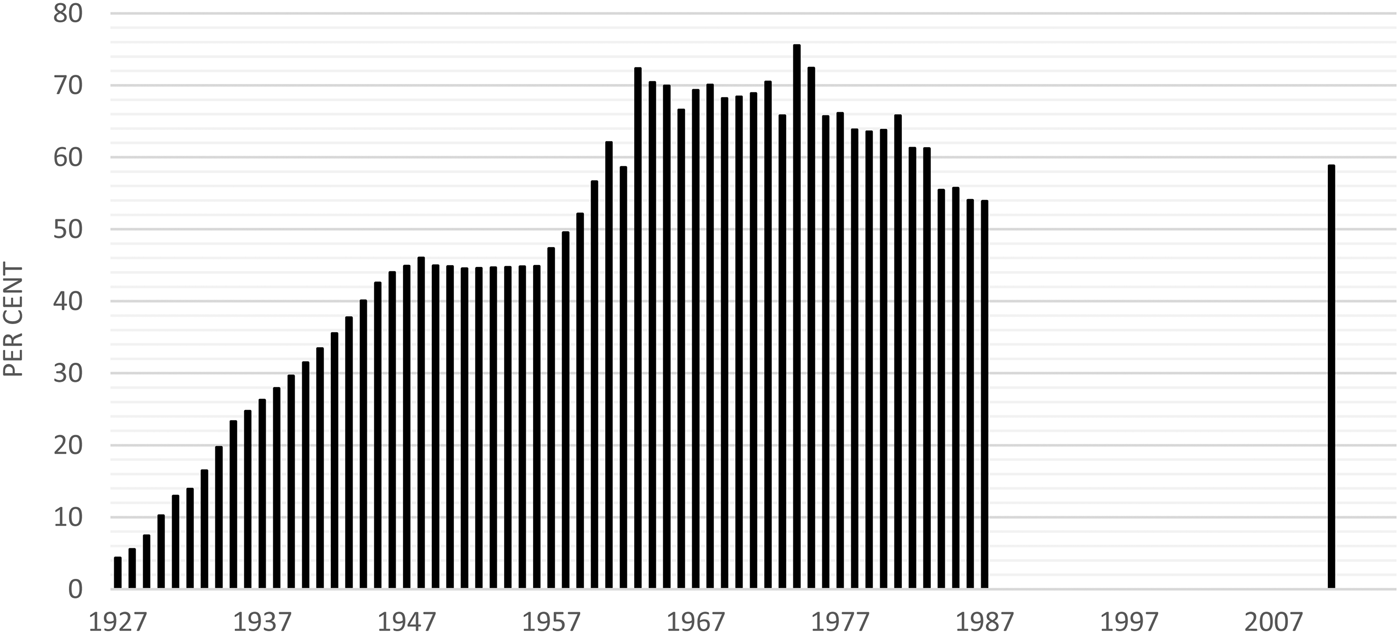
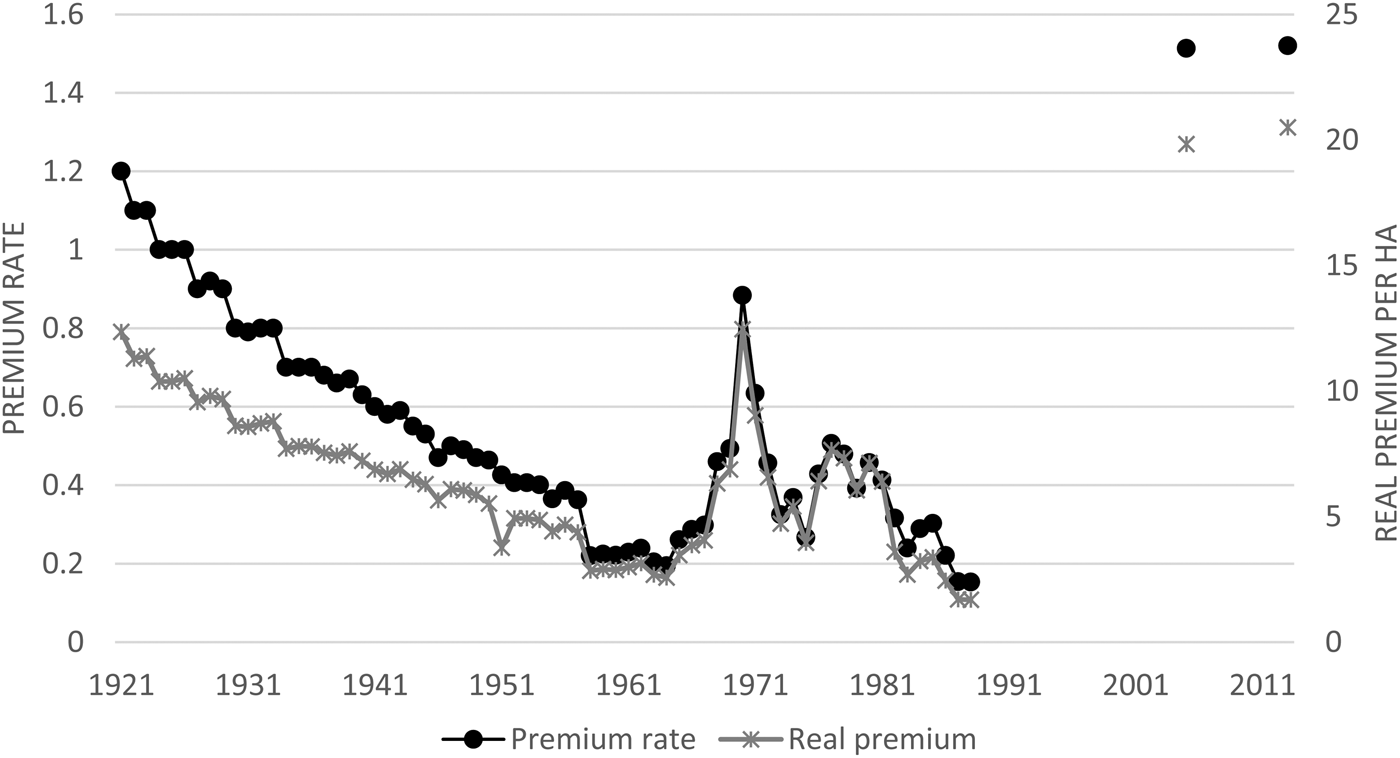
Premium rates (ratio between premium and sum insured) among the stock insured (in the pre-1919 period this was 5‰ and covered only mature forest) were reduced by such an insurance model to only 1.2‰ on average. By covering the full life cycle at a lower cost, forest insurance became attractive for an increasing number of forest owners. Although many of the Tariff Association member companies were sceptical about forest insurance on the proposed terms, pioneering companies progressed rapidly by supplying forest insurance which was in great demand. The diffusion of insurance and few major fires affecting the companies reduced the premium to 0.68‰ by the mid 1930s. At that time forest insurance covered 110,000 forest owners, holding more than 30 per cent of all privately owned forest in Sweden (Försäkringsföreningens tidskrift, 1937). State-owned forest (25 per cent of productive forest) was self-insured by government. Insurance coverage increased in the late 1930s and, after some years of stagnation during World War II, most forest owners signed insurance contracts in the postwar period. More than 70 per cent of all private forest owned by individuals and companies was covered by forest insurance in the late 1950s.
The diffusion of insurance in combination with the low frequency of fire events shown in Figures 5 and 6 lowered the premium rate. By the early 1940s the average premium rate was 0.63‰ and in the early 1950s it declined further to 0.42‰, making the corporate fire insurance model extremely competitive. The previous self-insurance model became less attractive. Mainly small private forest owners abandoned the self-insurance model, while large private forest owners, joint-stock companies and state-owned forest remained self-insured.
Insurance coverage (%) in private forest in Sweden, 1921–2005
Premium rate and real premium per hectare in Swedish forest insurance, 1921–2013
The corporate fire insurance model was largely governed by joint-stock companies which were members of the Tariff Association. From a company perspective, forest insurance was one kind of risk that was included in a larger portfolio of risks. All tariff companies underwriting forest insurance shared the risk within a larger pool of other risks attributed to buildings, equipment, machinery etc. Compared to the other lines of property insurance, forest insurance was only a minor part, making up only a small percentage of total premium incomes for forest-insuring companies. However, this mixed joint-stock model of forest insurance was challenged by a single-line joint-stock model outside the Tariff Association. The single-line forest insurance company, Skogsförsäkringar AB, was established in the late 1920s.
The underwriting of forest risk exclusively largely reduced the potential for risk sharing within the company (Skogsförsäkringar AB). Financial data from the company show that a large proportion of premium income was ceded to reinsurers. By sharing the risk with reinsurers, the company managed to expand its business in the first decades of operation. In the late 1920s the company controlled 30 per cent of the market, a position that was maintained until the late 1950s. Over time, the reinsurance share increased, making up 50 per cent of gross premium income in the early 1950s (Svenska Försäkringsföreningen 1927–55). One reason for reinsurance protection could be proactive measures due to substantial losses. Since the loss ratio (incurred losses in relation to premium earned) declined over time, the strong reinsurance growth may rather be considered as a measure to expand underwriting capacity rather than reduce risk further.
If such a company aimed only at balance changes in loss ratio between years, a close substitute to reinsurance would be to accumulate capital to cover future losses. Applying such a strategy, the company would cede a fixed proportion of each policy written to premium reserves on the balance sheet. Accumulation of premium reserves was quite slow in the first years of operation, but after the first decade, the share of premiums used to build reserves (savings) gradually increased. In the early 1950s, savings made up almost 20 per cent of premium income. The company had lowered its leverage position (net premium divided by equity and reserves) from 50 per cent in the 1930s to 2 per cent in the 1950s (Svenska Försäkringsföreningen 1927–55).
One advantage of focusing on a single line is the ability to specialise products and acquire detailed, unique information on and experience of the business. One disadvantage of the single-line model in relation to the mixed model is the loss of economies of scale and the lack of diversity for risk diffusion. A larger company can lower overhead costs by sharing the cost of a large and spatially diffused organisation over a larger volume. The mixed companies also lowered the cost of reinsurance as changes to loss ratio for individual lines could be smoothed out at company level. Comparing the pricing between the two forms, it can be seen that mixed joint-stock companies maintained a lower average premium rate of (53‰) compared to the singe joint-stock company (67‰) during the 1940s, providing a more competitive offering to forest owners.
Higher overhead and reinsurance costs may be some of the reasons for the decline in the single-line company model following more intensive competition in the market after the World War II. Shrinking market shares in the 1950s and 1960s impaired the competitive edge of the company, ultimately forcing it to liquidate in the mid 1960s (Försäkringsinspektionen 1964). The existing stock of policy holders was taken over by a mutual company, Hansa-Sak, which became the largest mutual company underwriting forest insurance. Within the company, forest insurance was only a small line in the portfolio, making up only 0.4 per cent of total business. Although Hansa-Sak was a mutual company, it was not based on a mutual structure of forest owners as the early attempts at forest insurance were. The mutual company was governed by directors within a large group of other mutual companies (Svenska Aktiebolag 1964; Försäkringsinspektionen 1964).
The corporate forest insurance model emerging in the interwar period became a mature business in the first half of the postwar period. The tariffs were highly standardised according to the Tariff Association and only a few companies supplied most of the forest insurance. A benchmark from 1965 shows that forest insurance was dominated by four, joint-stock companies, underwriting 82 per cent of all forest risks. All companies supplying forest insurance based their business on a mixed model, where the forest insurance share was a small part of total business (Försäkringsinspektionen 1965).
The emerging modern forest insurance industry, as well as forest owners, identified fire as the primary hazard to insure against. Wind-damage became a concern among forest owners in the early 1930s. The devastating winter storm of December 1931 caused major wind damage to private forests especially in the counties of Stockholm, Uppsala and Gotland. Contemporary estimates show that some to 2 million m3 of forest was damaged (Skogen, 1931). To cover these losses a public subsidy model was put in place. Forest owners, county representatives and also the Swedish Forest Agency urged for support from the government to cover the financial losses caused by the storm. Measures to compensate against over-supply and reduced prices were called for and there was a demand for subsidies in terms of interest-free loans to buyers of storm-damaged timber. Managing the storm-damaged forest also incurred additional costs for which forest owners demanded compensation. The Swedish Agency for Public Management that administrated the state disaster relief fund accepted that public financial support should be used to mitigate the financial consequences for forest owners (Sveriges Riksdag 1932).
Government stressed the need to dispose of the wind-damaged timber directly. Government also shared the concerns as regards financial losses due to additional costs for felling and low prices on the market due to over-supply. Poor market opportunities due to the Great Depression were also stressed in the argument for compensation for lower prices. According to the bill, government accepted that financial compensation would be paid for forest industries purchasing wind-damaged forest at ordinary market prices (subsidies to indemnify the gap between ordinary market prices and the lower prices of wind-damaged timber). Government argued that large-scale wind damage should be regarded as equal to other large-scale natural disasters such as failed crops, failed fishing or floods (Sveriges Riksdag 1932). In addition to the price subsidies, public works also subsidised some of the additional cost of harvesting the storm-damaged forest. Poor labour market conditions due to the Great Depression appear to have played a part in motivating the public subsidy model (Sveriges Riksdag 1933).
Extensions to the corporate fire insurance model were not considered as a measure to mitigate the financial consequences of wind damage in the 1930s. The view that natural hazards such as wind damage would be compensated for by public funds in cases of major events was generally accepted among forest owners and government at that time. Storms were a natural hazard not subject to moral hazard, fraud or other abuse by humans and therefore not the sole responsibility of the forest owners. However, the idea that losses due to storm damage were a private and not a public concern entered the scene in the 1950s.
Due to the lack of public support for minor wind damage, a number of insurance companies extended forest insurance to cover additional costs for reforestation of wind-damaged forests. Most companies also offered a specific wind-damage insurance as an addition to ordinary forest insurance in the 1950s. The coverage of the latter insurance was, however, low (4–5 per cent of all forest policies) up to the late 1960s (Jo 1969), making most of the financial losses for smaller-scale wind damage self-insured. The pressure to further abandon the public subsidy model increased in the aftermath of the 1954 storm.
Principles concerning the fact that insurable property was a private and not a public concern gradually replaced the previous view of state subsidies for major natural hazards (Jo 1969). One important factor for this change was the proposal by the Insurance Company Committee that wind damage should be included in all insurance policies. In the general agreement on forest insurance accepted in 1968, all corporations supplying forest insurance agreed to cover wind damage and the corporate wind and fire-damage insurance model became predominant. According to the 1968 agreement ‘Skogsförsäkring 1968’ forest insurance provided for losses due to impaired quality of timber and losses due to premature felling. Insurance against storm damage was a compulsory component of all forest insurance policies (Försäkringsföreningen 1969).
One of the consequences of the 1968 agreement was higher insurance premiums. The premium rate increased from 0.3‰ in 1967 to 0.5‰ in 1968. The higher premium rate was not initially sufficient to cover the additional losses that wind insurance incurred. Most insurance companies suffered major losses during the period 1968 to 1972. For the insurance industry as a whole, incurred losses were on average three times the size of the premium income between 1968 and 1972. Forest insurance companies raised premium rates to some extent, but most of the losses were not covered by the higher premiums, making forest insurance unprofitable. Financial statements for the postwar period clearly show that the introduction of wind insurance resulted in less profitable forest insurance business. For the period 1950 to 1967, the loss ratio (losses incurred in relation to premium earned) was on average 0.3. Loss ratio during the period 1968 to 1982 was equal to 1.3 (Försäkringsinspektionen 1940–83).
The companies could survive such a strategy due to the minor nature of forest insurance in relation to their total business. Losses were evened out across a large business portfolio. The strategy to keep premiums low in relation to losses could be motivated if wind damage was a rare and unique event, while the cost of losing policy holders due to high premiums was considered major and long term. Short-term losses due to wind damage could be covered by premium income in years when wind damage did not occur. Such an assumption seems to have been accepted by the insurance industry when the 1968 insurance agreement was put in place. Making wind insurance compulsory, but not fully covering losses in the short term, supported such an argument. Also the developments between 1982 and 2004 gave reason to believe that storm damage was a very unusual event.
The premium rate declined substantially after its peak in 1969/70. In the mid 1970s, the premium rate declined to the late 1950s premium rates. After a brief jump in the late 1970s and early 1980, premium rates decreased further in the late 1980s. In 1988/90, premium rates were equal to 0.15‰. As shown in Figures 2, 4 and 6, the reduction in premiums occurred in a period without major fire or wind damage. Insurers appear to have expected a return to pre-1967 hazard intensity.
The wind damage to forest in the twenty-first century changed the perception of wind-damage insurance in the Swedish insurance industry. Premium rates were increased substantially to cover losses. After Hurricane Gudrun in 2005, the premium for wind insurance exclusively was raised to an average of SEK 10 to SEK 18 per hectare in 2013 after storms Per and Simone (Skogen, 2007; Länsförsäkringar 2013). Figures from 2014 show that premium rates (including both fire and wind) have increased further, making up some SEK 30 per hectare on average (LRF 2014). Such high premium adjustment exert a great impact on the average premium rate (premium to insurance sum). As shown in Figure 6, the premium rate (premium income divided by insurance value) and the real premium per hectare (premium income deflated by timber price and divided by hectare) have increased rapidly over the last decade.
VII
Current pricing of forest insurance is the highest since the emergence of corporate forest insurance in the early 1920s. Both the real premium per hectare and premium rate are higher than in the 1920s. Such a rise in premium rates shows that insurance companies have adopted a new regime for underwriting forest risk. Wind damage is no longer anticipated as a rare and unique event, but as a recurrent loss which premium income is to cover. This adaptation among insurers to the current situation of major storm events also indicates that anticipated losses are larger than historical experience indicates.
Following Hurricane Gudrun, the model of governmental ad hoc relief, for example, providing funds for replanting, has been criticised as it may increase unpredictability and moral hazard (Vulturius and Keskitalo Reference Vulturius and Keskitalo2016). For this event, EU aid was also applied for. Consequently, suggestions for national natural disaster compensation systems were submitted in 2007 and Reference Keskitalo2010 (Försvarsdepartementet 2007; MSB 2010) and the role of international support has been examined (Statens offentliga utredningar 2012). However, proposals for national disaster compensation schemes have been opposed with regard to, for example, their implications for municipalities. Insurance companies have changed conditions of coverage with regard to forest by lowering the area for which damage losses will be covered and by extending the types of costs that can be covered (e.g. also replanting and damage to dikes), while at the same time reducing the maximum compensation level (Vulturius and Keskitalo Reference Vulturius and Keskitalo2016).
As changing insurance conditions and public ad hoc support have introduced uncertainty into the division of damage costs between government, insurance and self-insurance, finding a new model or combination of solutions to cover increasing stresses presents challenges. In our review of the historical experience of ways to adapt to hazards, a number of key issues in the design of a new insurance model have arisen. One historical analogue is the importance of self-insurance as a means of adapting to uncertain hazard structures. Is seems clear from the historical review that self-insurance becomes predominant when pricing of risk is difficult or extremely uncertain, making the alternative cost of self-insurance high. At times when the alternative cost of self-insurance rises due to increasing premium rates, historical experience also demonstrates that self-insurance becomes more important. However, in an increasingly uncertain future, the predominance of self-insurance could also limit interest in owning and managing forest, a trend which may potentially be supported by the current development in which fewer forest owners actually live on their land (Nordlund and Westin Reference Nordlund and Westin2011).
Corporate insurance has here been shown to be a well-developed model; the insurance industry recognised as early as in the 1920s that the high price elasticity of corporate insurance among forest owners and the reduction of premium rates played an important role in expanding their business. Historically low figures on fire-hazard events in the interwar period paved the way for a low-price strategy, making the corporate insurance model predominant. We also find that the low-price strategy was maintained when wind-damage insurance was introduced. However, when the hazard structure changed in the early twenty-first century, the low-price strategy became more difficult to maintain. In order to downplay the seemingly high price-elasticity, a variety of measures have been applied. One strategy has been to reduce coverage and/or increase deductibles in order to keep premium rates down (and increase the share of self-insurance in the contract). Another strategy is to differentiate premiums more extensively across space on the basis of underlying risk. Given a higher willingness to insure in high-risk areas, the higher price would not reduce insurance demand. Such a strategy could also be motivated if measures to reduce risk were at hand. Premiums would thereby form incentives to reduce risk levels (see Schwarze et al. Reference Schwarze, Schwindt, Weck-Hannemann, Raschky, Zahn and Wagner2011).
A number of means could be applied to incentivise forest owners to reduce risk. Models have been proposed such as diversifying forest insurance premiums further, for example, depending on site or risk, as has been the case with regard to flooding in the UK (Keskitalo et al. Reference Keskitalo, Vulturius and Scholten2014). However, such a shift would, as in the UK, generate requirements for improved risk assessment. The potential for individual risk assessment would, however, probably not only be limited to site visits, but could also necessitate detailed information on stands and forest management as well as localisation in relation to risk assessment and other infrastructure, for example, with regard to storm risk in different areas and whether the site is situated at a forest edge or not. For example, maintaining even-aged forest and planting storm-sensitive, shallow-rooted spruce, which is common in Swedish forest management, could be regarded as increasing storm risk (see e.g. Skogsstyrelsen [Swedish Forestry Agency] 2006). While the Swedish Forestry Agency notes that such assessments and advice to forest owners must still be assessed, forest could thus potentially in the future be assessed for how forest damage risks are mitigated, given, for example, planting and broader forest management strategies (Skogsstyrelsen 2006). A key issue here may, however, be how far forest owners – like other property owners – are prepared to go in order to ‘risk proof’ or ‘add resilience’ to their holdings. Also, how much would they be willing to pay for insurance with somewhat lower maximum coverage cost levels than previously?
Another disadvantage of highly differentiated premiums is also that these play down the basic concept of insurance, i.e. to pool individual loss in a larger pool of risks. Offering combined insurance products for policy holders with a larger portfolio of assets (buildings, machinery, equipment) has historically been used to reduce lapse rate; currently also home insurance sectors in Scandinavia note the benefits of such a generalised insurance system in light of increased risks due to climate change (e.g. Glaas et al. Reference Glaas, Hjerpe and Keskitalo2016).
The historical review demonstrates that the trade-off between solvency and historical coverage is not an entirely new issue. Such a trade-off was already a concern at the formation of the corporate insurance model in the 1920s. At that time, the alternative was a compulsory public insurance model. The advantage was that such a model could put a unit price on risk by distributing the damage costs across all forest owners equally. Such a model would lower the average price by including both private and corporate forest owners. This compulsory measure also brought the advantage of removing the risk of adverse selection as all forest owners were included. The disadvantage of such a model would be the potentially higher risk of moral hazard. Another potential disadvantage would be the reduced financial incentive for precautionary measures. To sum up, in relation to the relevant models in this particular case (see Botzen et al. Reference Botzen, van der Bergh and Bouwer2010), the argument for a compulsory insurance model seems attractive given that the disadvantages of moral hazard and precautionary incentives are less strong than the advantages of lower premium rates and the removal of adverse selection. However, this model has historically received less support than the less theoretically attractive (ad hoc) public subsidy model. The main reason appears to be that public (tax-based) subsidies become a more attractive measure from a policy point of view; compensating some of the forest owners for devastating losses is not challenged by the majority of non-forest owners.
While the efficiency of the new strategy in keeping up the historically high insurance coverage is too early to assess, the historical experience of price elasticity indicates that self-insurance may rise in the future as a result of a combination of lapsing, reduced coverage and higher levels of deductibles.