
Introduction
The helium ion microscope (HeIM) as a ground-breaking focused ion beam microscope
As early as 1948 an ion microscope mass-spectrometer for the in-situ observation of chemical processes at very low magnifications was proposed[Reference Sasaki1] and the vast potential for helium (He) ions for the generation of patterns with high aspect ratio was reported in 1979.[Reference Komuro, Atoda and Kawakatsu2] In spite of demand from the characterization and patterning communities, the first commercial HeIM with a high brightness source and high-resolution imaging became available to the scientific community only in 2006. This may be surprisingly late considering that charged particle guns and lenses can be considered mature technologies with decades of application in scanning electron microscope (SEM) and focused ion beam (FIB) instruments among others. While the gas field ionization source (GFIS) and liquid metal ionization source (LMIS) were both pioneered around the mid-1970s,[Reference Krohn and Ringo3–Reference Swanson6] the LMIS enabled the development of microscopes with ion-milling and microscale machining capabilities, which rather quickly found application within the semiconductor industry and was subsequently developed as a commercial technology. The prevalence of SEMs and FIBs utilizing LMISs meant that there was initially little benefit in developing GFIS microscopes, as they were inferior to SEMs in resolution and microanalysis tools and had no obvious advantage for micromachining due to the low sputter yield of lighter noble gas ions compared with the commonly used Ga+ FIBs.
An exciting new chapter in the development and use of ion microscopes began with the availability of a new type of HeIM GFIS, which is sometimes called ALIS after the corporation which initially developed it. It is the key innovation which enables imaging resolution and nano-engineering precision superior to SEM and FIB microscopes. In a process proprietary to Carl Zeiss a metal tip used to ionize the surrounding He gas can be shaped in situ into a sharp three-atom tip, reducing the number of He+ beams arising from the tip to three and greatly increasing brightness compared with a spherical tip. One of the three He+ beams is selected to result in a bright He+ beam with an origin confined to the angstrom scale, resulting in a very low convergence angle, low energy spread, and sub-nanometre lateral resolution.[Reference Ward, Notte and Economou7] As in FIBs, the different signals arising from beam–sample interactions allow scanning HeIM imaging, and while there is potential for sub-nanometre resolution, the need to limit dose effects such as sample modification by the He+ beam may in some cases be the resolution limiting factor. The beam current can be readily controlled by the feed gas pressure. More recently, the feed gas can be exchanged from He to Ne to produce a focused Ne+ beam for nanoscale fabrication and imaging in the same instrument,[Reference Livengood, Tan, Hallstein, Notte, McVey and Faridur Rahman8, Reference Rahman, McVey, Farkas, Notte, Tan and Livengood9] allowing more versatile nanofabrication.
Nanofabrication capabilities
He+ and Ne+ milling
With the HeIM currently offering the most highly focused scanning ion beam, nanomanipulation experiments with ever higher resolution and nanoscale control have been trialed. Nanoscale milling has been successful especially for thinned and 2D materials: It has been shown that high incidence angle He+ polishing of Ga+ FIB prepared transmission electron microscopy (TEM) lamella leads to a reduction of the surface roughness and a decrease in the Ga+ contamination while keeping the Si crystal structure intact, which is promising for applications in which the Ga+ implantation would pose a problem.[Reference Fox, Chen, Faulkner and Zhang10] Furthermore, nanoscale milling has been successful for graphene[Reference Zhou, Maguire, Jadwiszczak, Muruganathan, Mizuta and Zhang11–Reference Bell, Lemme, Stern, Williams and Marcus13] and molybdenum sulfide (MoS2).[Reference Fox, Zhou, Maguire, O'Neill, Ó’Coileáin, Gatensby, Glushenkov, Tao, Duesberg and Shvets14] In studies where a bulk material or a substrate is present, Ne+ is usually the ion of choice due to its higher sputtering yield and smaller implantation depth.[Reference Philipp, Rzeznik and Wirtz15] It has successfully been used in the milling of soft[Reference Joens, Huynh, Kasuboski, Ferranti, Sigal, Zeitvogel, Obst, Burkhardt, Curran and Chalasani16] and semiconductor materials.[Reference Tan, Livengood, Hack, Hallstein, Shima, Notte and McVey17] While Rzeznik et al. point out that polymers, and therefore presumably other soft materials, have a density small enough for implanted He, Ne or Ar to escape, preferential sputtering of certain atoms can lead to a change in the surface chemistry if beam exposures are too high.[Reference Rzeznik, Fleming, Wirtz and Philipp18] Hence, a chemical analysis tool could monitor surface chemistry in-situ to allow control over undesired modifications that could be detrimental to the final application.
Sample modification and defect engineering
While there are limitations to the milling ability of He+ ions, the high lateral resolution opens new opportunities for other beam-controlled manipulations of a sample: The control over defects in 2D materials holds great promise in tuning the properties of such materials. Maguire et al. have probed defect sizes arising in 2D materials after He+ and Ne+ impact and found that the presence of a substrate greatly influences defect sizes.[Reference Maguire, Fox, Zhou, Wang, O'Brien, Jadwiszczak, McManus, McEvoy, Duesberg and Zhang19] This suggests that the available volume for ion–sample interaction should be considered as an important factor not only for defect generation but other beam-sample processes as well. It has been shown that the ion beam can modify resistivity behavior of MoS2, although the resistivity measurement had to be performed ex-situ.[Reference Fox, Zhou, Maguire, O'Neill, Ó’Coileáin, Gatensby, Glushenkov, Tao, Duesberg and Shvets14] The ability to monitor local electric properties in-situ could ensure precise control or automated feedback loops for such processes, essential for high throughput applications such as patterning.
Resist patterning and editing of nanocircuitry
The benefits of gas ion beams for resist patterning were identified decades ago.[Reference Komuro, Atoda and Kawakatsu2, Reference Melngailis20] A large number of secondary electrons (SEs) emitted from polymers as a result of keV gas ion impact allowed for very fast exposure times. In addition, a much-reduced pattern proximity effect compared with electron beam lithography was found,[Reference Melngailis20] enabling high-density patterning with lines below 10 nm.[Reference Shi, Prewett, Huq, Bagnall, Robinson and Boden21] Likewise, helium ion beams can be used for nanocircuitry editing as the fabrication of low resistivity 10 nm lines by HeIM has been demonstrated.[Reference Wu, Stern, Xia, Ferranti, Thompson, Klein, Gonzalez and Rack22]
Outlook for nanofabrication
Nanofabrication using He+ and Ne+ ions is a very active field and only a handful of examples can be mentioned within the scope of this review. Comprehensive reviews of the potential of gas ion beams for nano-engineering can be found elsewhere.[Reference Stanford, Lewis, Mahady, Fowlkes and Rack23, Reference Belianinov, Burch, Kim, Tan, Hlawacek and Ovchinnikova24] The potential for nano-engineered deposited structures for plasmonics, magnetics, and sensor applications has been demonstrated in the SEM,[Reference Huth, Porrati, Schwalb, Winhold, Sachser, Dukic, Adams and Fantner25] although challenges remain in dedicated precursor design, avoidance of undesired deposits and slow deposit growth rates. A solution to the latter two challenges could be the replacement of the electron beam by gas ion beams, which would likewise benefit from the development of dedicated precursors. In-situ imaging of local chemical reactions could aid in the surveying of precursors with regards to deposition mechanisms and rates of favorable and unfavouable processes.
Imaging and microanalysis capabilities
The high precision of the He+ beam has opened doors not only for nanofabrication applications but also for imaging and microanalysis at ever smaller lateral resolution.
The potential of the HeIM as a microanalysis tool was summarized excellently in 2011 by Joy and Griffin.[Reference Joy and Griffin26] Compared with FIBs and SEMs, the HeIM has some limitations: energy dispersive x-ray spectroscopy (EDX) cannot be performed in the HeIM, due to the increased mass of He+ compared with electrons. The He+ beam voltage would have to be more than three orders of magnitude larger than that required from an electron beam to excite a certain x-ray line for x-ray spectroscopy, which is out of the question for existing HeIM instruments. Furthermore, ion-induced SE (iSE) emission total yields cannot quantifiably be assigned to specific elements due to scatter in the relationship between atomic number and total iSE yield.[Reference Ramachandra, Griffin and Joy27] Finally, the increase in lateral resolution achievable for iSEs is not available for the backscattered He (BSHe) signal due to its larger lateral spread in the interaction volume.[Reference Scipioni, Sanford, Notte, Thompson and McVey28] While the analysis of BSHe within Rutherford backscatter spectroscopy (RBS) offers energy and angular resolution in some HeIM instruments suitable for elemental mapping,[Reference Sijbrandij, Thompson, Notte, Ward and Economou29, Reference Klingner, Heller, Hlawacek, von Borany, Notte, Huang and Facsko30] it does not serve to exploit the benefit in lateral resolution given by the superbly focused He+ beam.
These limitations have spurred on efforts to explore and develop other microanalysis tools in the HeIM. One advantage of BSHe over backscattered electrons (BSE) is their sensitivity to the ion channeling effect within crystalline samples. Veligura et al. have demonstrated that the ion channeling effect visible in both iSE and BSHe imaging within the HeIM can be used in polycrystalline samples to map crystal orientation as a method in direct competition with electron backscatter diffraction, without the need for complex mathematics to interpret the signal.[Reference Veligura, Hlawacek, van Gastel, Zandvliet and Poelsema31]
When considering how to further develop microanalysis tools in the HeIM, secondary ion mass spectrometry (SIMS) must be considered. The mass analysis of secondary ions generated from ion impact is developed as a microscopic technique with very high sensitivity, depth resolution, and the opportunity to map secondary ion species, while simultaneously sputtering the surface to extract 3D information.[Reference Wirtz, Philipp, Audinot, Dowsett and Eswara32] SIMS detects secondary ion fragments by their mass to charge ratio and can thus be used for mapping of elements and chemical species if characteristic fragment ions are known. The development of the GFIS used in the HeIM holds the promise of higher lateral resolution for SIMS microscopy due to the smaller ion spot size.[Reference Wirtz, Vanhove, Pillatsch, Dowsett, Sijbrandij and Notte33] HeIM-SIMS capable instruments are currently realized by extracting the secondary ions from the chamber through a transfer tube into the mass spectrometer using a 500 V extraction field.[Reference Dowsett and Wirtz34] Ideally, a SIMS mass analyzer within a HeIM would allow iSE, RBS, and SIMS measurements from the same area to allow correlative spectroscopy and gain the maximum data volume from a HeIM experiment. At present, sequential acquisition of iSEs and secondary ions is possible, yielding elemental SIMS maps overlaid on iSE images with significantly higher resolution than EDX elemental maps obtainable in the SEM.[Reference Dowsett and Wirtz34, Reference Vollnhals, Audinot, Wirtz, Mercier-Bonin, Fourquaux, Schroeppel, Kraushaar, Lev-Ram, Ellisman and Eswara35] The imaging mode can be changed rapidly to switch between iSE and SIMS imaging, however, optimal resolution SIMS-iSE maps are only possible when exchanging the feed gas, which takes significantly longer. This is because on one hand, SIMS favors the higher secondary ion yield associated with Ne+ bombardment and on the other hand, higher resolution iSE images can be achieved with the He+ beam. Simulations by Wirtz et al. suggest working parameters based on sputter yields for He+ and Ne+ SIMS experiments and propose that Ne+ ions may be used for depth profiling to gain access to 3D SIMS maps while using the extreme surface sensitivity of SIMS to an advantage.[Reference Philipp, Rzeznik and Wirtz15, Reference Wirtz, Vanhove, Pillatsch, Dowsett, Sijbrandij and Notte33] While the elemental mapping of inorganic species has been realized,[Reference Gratia, Grancini, Audinot, Jeanbourquin, Mosconi, Zimmermann, Dowsett, Lee, Grätzel and De Angelis36, Reference Gratia, Zimmermann, Schouwink, Yum, Audinot, Sivula, Wirtz and Nazeeruddin37] the mapping of local chemistry on the nanoscale for materials of complex shapes and structures has yet to be demonstrated and may be ultimately limited by the relatively low secondary ion yields, or the need for reactive gases such as oxygen to increase yields.
SEs in the HeIM
SE emission in the HeIM is the signal with the highest yield and spatial resolution. The detection is routinely performed using an Everhart-Thornley detector (ETD), which has decades of application in SEMs.[Reference Everhart and Thornley38]
Long before the emergence of the HeIM as a precision tool, ion-induced SE emissions were studied from the 1970s with applications of ion-beam milling and SIMS imaging in mind.[Reference Lai, Brown, Vickerman and Briggs39] A comprehensive review by Lai et al. summarizes the theoretical models developed up to 1986.[Reference Lai, Brown, Vickerman and Briggs39] While Parilis and Kishinevskii suggested that SE emission occurred through kinetic excitation of the substrate with subsequent relaxation through Auger electron emission, Baragiola et al. contested the theory with experimental evidence and suggested a direct excitation of valence electrons arising from the impact of the incident ions.[Reference Baragiola, Alonso, Ferron and Oliva-Florio40, Reference Ferron, Alonso, Baragiola and Oliva-Florio41] While the semi-empirical SE emission theories summarized by Liu are still in use today, more modern approaches commonly use Monte-Carlo simulations to extract spatial information about the emitted SEs.[Reference Ramachandra, Griffin and Joy27]
Ramachandra et al. point out that the stopping power dependence on particle incident velocity is very similar when comparing electrons and He+ ions. However, while He+ ions and electrons have equal and opposite charge, they have a significantly different mass which means that the stopping power of a 30 keV He+ beam is significantly larger than that of a 1 keV electron beam (ca. 20 and 7 eV Å−1, respectively).[Reference Ramachandra, Griffin and Joy27] This is at the base of the high SE yields (SEYs) achievable in the HeIM compared with the SEM. SEMs are usually operated above the maximum stopping power voltage of 0.1 keV and thus reducing accelerating voltage increases stopping power and SEY—a principle utilized in LV-SEM. Conversely, HeIM ion energies lie below the maximum stopping power of about 900 keV and so even higher SEYs can be expected as higher energy He+ beams become available to the community.[Reference Ramachandra, Griffin and Joy27]
In efforts to benchmark the HeIM against the SEM with regard to their SE signal, various materials have been studied to assess whether known limitations of current systems can be overcome in the HeIM.
Lateral resolution
With the HeIM's potential to produce He+ spot sizes as small as 0.25 nm,[Reference Hill and Rahman42] the spatial origin of the iSE signal has been investigated in more recent studies. Notte et al. use Monte-Carlo simulations to compare the interaction volume geometries of Ga+, He+, and electron beams.[Reference Notte, Ward, Economou, Hill, Percival, Farkas and McVey43] In comparison, the He+ beam stays more confined while traveling further into the sample. Most remarkably, the interaction volume is highly localized within the SE escape depth. The favorable geometry of the interaction volume of He+ ions is due to the absence of strong electron–electron scattering events which lead to fraying of the electron beam interaction volume close to the surface.[Reference Notte, Ward, Economou, Hill, Percival, Farkas and McVey43]
The increase in lateral resolution compared with the SEM is exciting especially for uncoated insulators. In studies of mammalian cells, it was shown that metal coatings obscure important surface detail both in the HeIM and SEM, while HeIM of uncoated samples at 25–35 kV offers superior lateral resolution without charge build-up and artifacts which prohibit high-resolution SEM imaging of such materials.[Reference Joens, Huynh, Kasuboski, Ferranti, Sigal, Zeitvogel, Obst, Burkhardt, Curran and Chalasani16, Reference Rodenburg, Viswanathan, Jepson, Liu and Battaglia44–Reference Bazou, Behan, Reid, Boland and Zhang48] The absence of a conductive coating for the imaging of insulators reveals previously unobservable surface structure[Reference Rice, Van Hoek, Păunescu, Huynh, Goetze, Singh, Scipioni, Stern and Brown47] and contrast[Reference Rodenburg, Viswanathan, Jepson, Liu and Battaglia44] which allows further insight into the nanostructure of complex materials through high-resolution imaging. Additionally, the absence of a conductive coating unlocks access to the real sample surface and may lead to new systematic investigations of such materials if suitable in-situ chemical analysis tools are available.
Depth resolution
Like SEM, HeIM must be considered a surface sensitive technique due to the small escape depth of SEs. However, this can also be used to an advantage: HeIM SE imaging has shown improvements in the interpretation of image data collected from carbon-chromium nanocomposite due to a higher depth resolution of 4.8 nm compared with a scanning TEM (STEM) depth resolution of about 13 nm.[Reference Rodenburg, Liu, Jepson, Zhou, Rainforth and Rodenburg49] In this case, the higher lateral resolution available in the HeIM allows it to compete with high-resolution bulk probing techniques, such as STEM or TEM.
Charging behavior
Sample charging behavior of insulators under charged particle beams can be rather complex. Not only the current of the beam determines sample charge build-up, but also the charge dissipation mechanisms into the ground, as well as the total yield of charged secondary particles emitted into a vacuum, i.e., SE or ion yields. Depending on the incident beam energy, negative as well as positive charging can be observed in the SEM.[Reference Joy and Joy50, Reference Joy51] In an effort to manage charging, crossover primary beam energies are sought in which positive and negative charging are in balance. However, charging is not always homogenous over the field of view and a dynamic charge balance may be unattainable resulting in degradation of image quality. In the HeIM the low secondary ion yield of the beam means that charging of insulating samples is generally positive.[Reference Wirtz, Vanhove, Pillatsch, Dowsett, Sijbrandij and Notte33] HeIMs are fitted with an electron flood gun, which provides a charge compensation mechanism without introducing any additional chemical species during imaging. The electron flood gun is used in imaging of uncoated insulating samples,[Reference Bazou, Behan, Reid, Boland and Zhang48] and has also been shown to counteract gradual positive charge build-up in doped silicon samples.[Reference Jepson, Inkson, Rodenburg and Bell52, Reference Rodenburg, Jepson, Inkson and Liu53] This is important as a positive charge build-up will otherwise reduce the SE yield and counteract the favorable high SE signal output in the HeIM. While unfavorable for iSE imaging, this iSE signal reduction with increased positive charge build-up was exploited by Iberi et al. to assess the magnitude of charge compensation possible through HeIM machined nanoscale contacts, and thus their conductivity.[Reference Iberi, Vlassiouk, Zhang, Matola, Linn, Joy and Rondinone54]
SE energy distribution
While much attention has been paid to the high total iSE yield, the iSE energy distribution has been investigated relatively little. In separate studies Petrov et al. and Ohya et al. have compared the iSE spectra of metals in the HeIM and SEM and noted a difference in the position and width of the most intense peak.[Reference Petrov, Vyvenko and Bondarenko55–Reference Ohya, Yamanaka, Inai and Ishitani58] This difference is attributed to a different material response to the impinging He+ ions compared with electrons, as external environmental factors, specifically pressure, are comparable between HeIMs and SEMs. In a study of different metals within an Ar+ beam microscope, it was shown that the iSE energy distribution of different metals are distinct and repeatable,[Reference Suzuki, Sakai and Ichinokawa59] making the mapping of pure elements and also mixed phases possible in certain energy windows if reference spectra are known, as previously demonstrated in the SEM.[Reference Kumar, Schmidt, Schileo, Masters, Wong-Stringer, Sinclair, Reaney, Lidzey and Rodenburg60]
In-situ SE spectroscopy (SES): experimental considerations
Electron spectroscopy is widely performed to obtain compositional and electronic information about a sample. Most techniques, such as Auger spectroscopy (AS), electron energy loss spectroscopy (EELS), photoelectron spectroscopy, and low electron energy spectroscopy are available as microscopic techniques with varying lateral and energy resolution. The idea of SES within charged particle microscopes is as old as the microscopes themselves, however, it was recognized very early that contamination layers greatly influence the SE energy distribution and complicate any qualitative or quantitative evaluation of the spectra.[Reference Bruining61] Nevertheless, its potential usefulness to materials science was demonstrated by linking spectral features to the degree of order in carbon fibers to modulus and treatment regime.[Reference Willis, Fitton and Skinner62] Furthermore, Joy et al. demonstrated that the effects of contamination in SE spectra could be managed in an Auger microprobe under SEM conditions on a wide range of inorganic materials.[Reference Joy, Prasad and Meyer63] The study also demonstrated that there is a fine structure in the SE spectra which is not accurately modeled by the Chung and Everhart model for SE emission of metals,[Reference Chung and Everhart64] and could have potential in SEM microanalysis. Another promising application of SE spectroscopy was found in the enhancement of dopant contrast of doped silicon. In experiments directly relevant to the semiconductor industry the use of secondary electron hyperspectral imaging (SEHI) has shown to enhance the dopant contrast to an extent where the dopant concentration is directly quantifiable by the SE emission within a certain energy range.[Reference Schönjahn, Humphreys and Glick65, Reference Kazemian, Mentink, Rodenburg and Humphreys66] The ability to capture multiple doped areas of certain concentrations in one image makes the technique efficient. This approach has been shown to be successful not only in the SEM but also in the HeIM if the electron flood gun is used to control sample charging effects.[Reference Jepson, Inkson, Rodenburg and Bell52, Reference Rodenburg, Jepson, Inkson and Liu53, Reference Jepson, Inkson, Liu, Scipioni and Rodenburg67, Reference O'Connell, Chen, Zhang, Zhou, Fox, Maguire, Wang and Rodenburg68]
While SE micrographs are intuitively understood by the human eye in the presence of edge contrast and shadowing, quantitative analysis of SE images remains a challenge even today. To better understand the make-up of a SE image, SEs have been classified as to the process from which they have emerged[Reference Joy51]: SE1 are the result of the first inelastic interaction of the incident beam, be it He+ or electrons, with the sample electrons. Due to the absence of a cascade of interactions before the SE1 is generated, this is the signal with the highest spatial resolution. SE2 arise from BSE or ions which by following along a cascade of interactions undergo an inelastic scattering event close to the sample surface, but at a distance from the incident beam. All SEs which arise from BSE or BSHe scattering off the instrument, i.e., the chamber or the pole-piece, are classified as SE3. The ratios of said SE categories directly influence the spatial resolution of the SE signal and noise levels, thereby obtaining a pure SE1 signal would be the ideal. However, separation of the different signals to achieve an image more suitable for quantitative analysis is challenging, not least because the relative fractions of the different SEs seem to vary significantly for both in-chamber ETD and in-lens detection between SEM manufacturers and models, as demonstrated in a comparative study by Griffin.[Reference Griffin69] Encouragingly the study did confirm that it is possible for some in-lens detection systems to collect a signal dominated by SE1 based on angular and energy selection, and hence depending on the exact detector design. In the further development of HeIMs and SEMs, this need for a better understanding of the SE signal will require investigations to look beyond total yields and at the SE energy distribution collected by the detector. If the detector is well characterized, instrument parameters such as working distance, beam voltage or incident beam angle can be selected for their influence on the detected SE energy distribution and controlled by the user to reduce instrument variability and select the information that is sought. For example, by selecting low energy SEs, it is possible to exclude the signal arising predominantly from a contamination layer on doped silicon, revealing the dopant contrast underneath.[Reference Rodenburg, Jepson, Bosch and Dapor70]
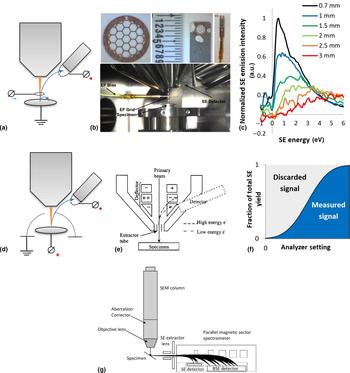
If SE spectroscopy within charged particle microscopes is to be developed as a microanalysis tool, the energy analyzer characteristics must be understood. Figure 1 illustrates currently used and proposed SE analyzer set-ups. Figures 1(a) and 1(d) illustrate high pass analyzers employed in HeIMs in which the voltage difference between the sample and an inserted grid can be varied to only allow SE above a certain energy to reach the Everhart Thornley detector.[Reference Mikhailovskii, Petrov and Vyvenko56, Reference Zhou, Fox, Maguire, O'Connell, Masters, Rodenburg, Wu, Dapor, Chen and Zhang71] Conversely, the Nova and Sirion SEM energy analyzer illustrated in Fig. 1(e) is a low-pass filter, in which a voltage can be applied to electrodes within the pole piece to divert electrons below a threshold energy to an in-lens detector.[Reference Schönjahn, Humphreys and Glick65, Reference Kazemian, Mentink, Rodenburg and Humphreys72] In the in-lens detection system, a suction tube voltage is applied to maximize the yield and angular detection efficiency of SEs, while also excluding SE3.
Energy analyzer set-ups. (a) Schematic of the HeIM set-up used in Zhou et al.[Reference Zhou, Fox, Maguire, O'Connell, Masters, Rodenburg, Wu, Dapor, Chen and Zhang71] first illustrated in this work (b) and first pictured in detail in this work (c) influence of sample-grid separation on spectral shape using the analyzer shown in (a–b) on the example of a highly oriented graphite surface. The different spectra are recorded at 30 keV He+ and are normalized to the dataset (d) Schematic HeIM set-up described by Mikhailovskii et al., adapted by permission from Springer, Journal of Surface Investigation[Reference Mikhailovskii, Petrov and Vyvenko56], Copyright Pleiades Publishing Ltd. 2015 (e) schematic of SEM in-lens energy analyzer as first described in Rodenburg (neé Schönjahn) et al. [Reference Schönjahn, Humphreys and Glick65] and used in this work. Figure reproduced by permission from AIP publishing, Journal of Applied Physics[Reference Schönjahn, Humphreys and Glick65], Copyright American Institute of Physics 2002 (f) Schematic of discarded and collected SEs for an energy scanning analyzer (g) A parallel magnetic sector electron energy analyzer as proposed by Khursheed for use in SE spectroscopy. Figure reproduced with permission from World Scientific Publishing Co. Pte. Ltd. [Reference Khursheed78], Copyright World Scientific Publishing Co. Pte. Ltd. 2011.
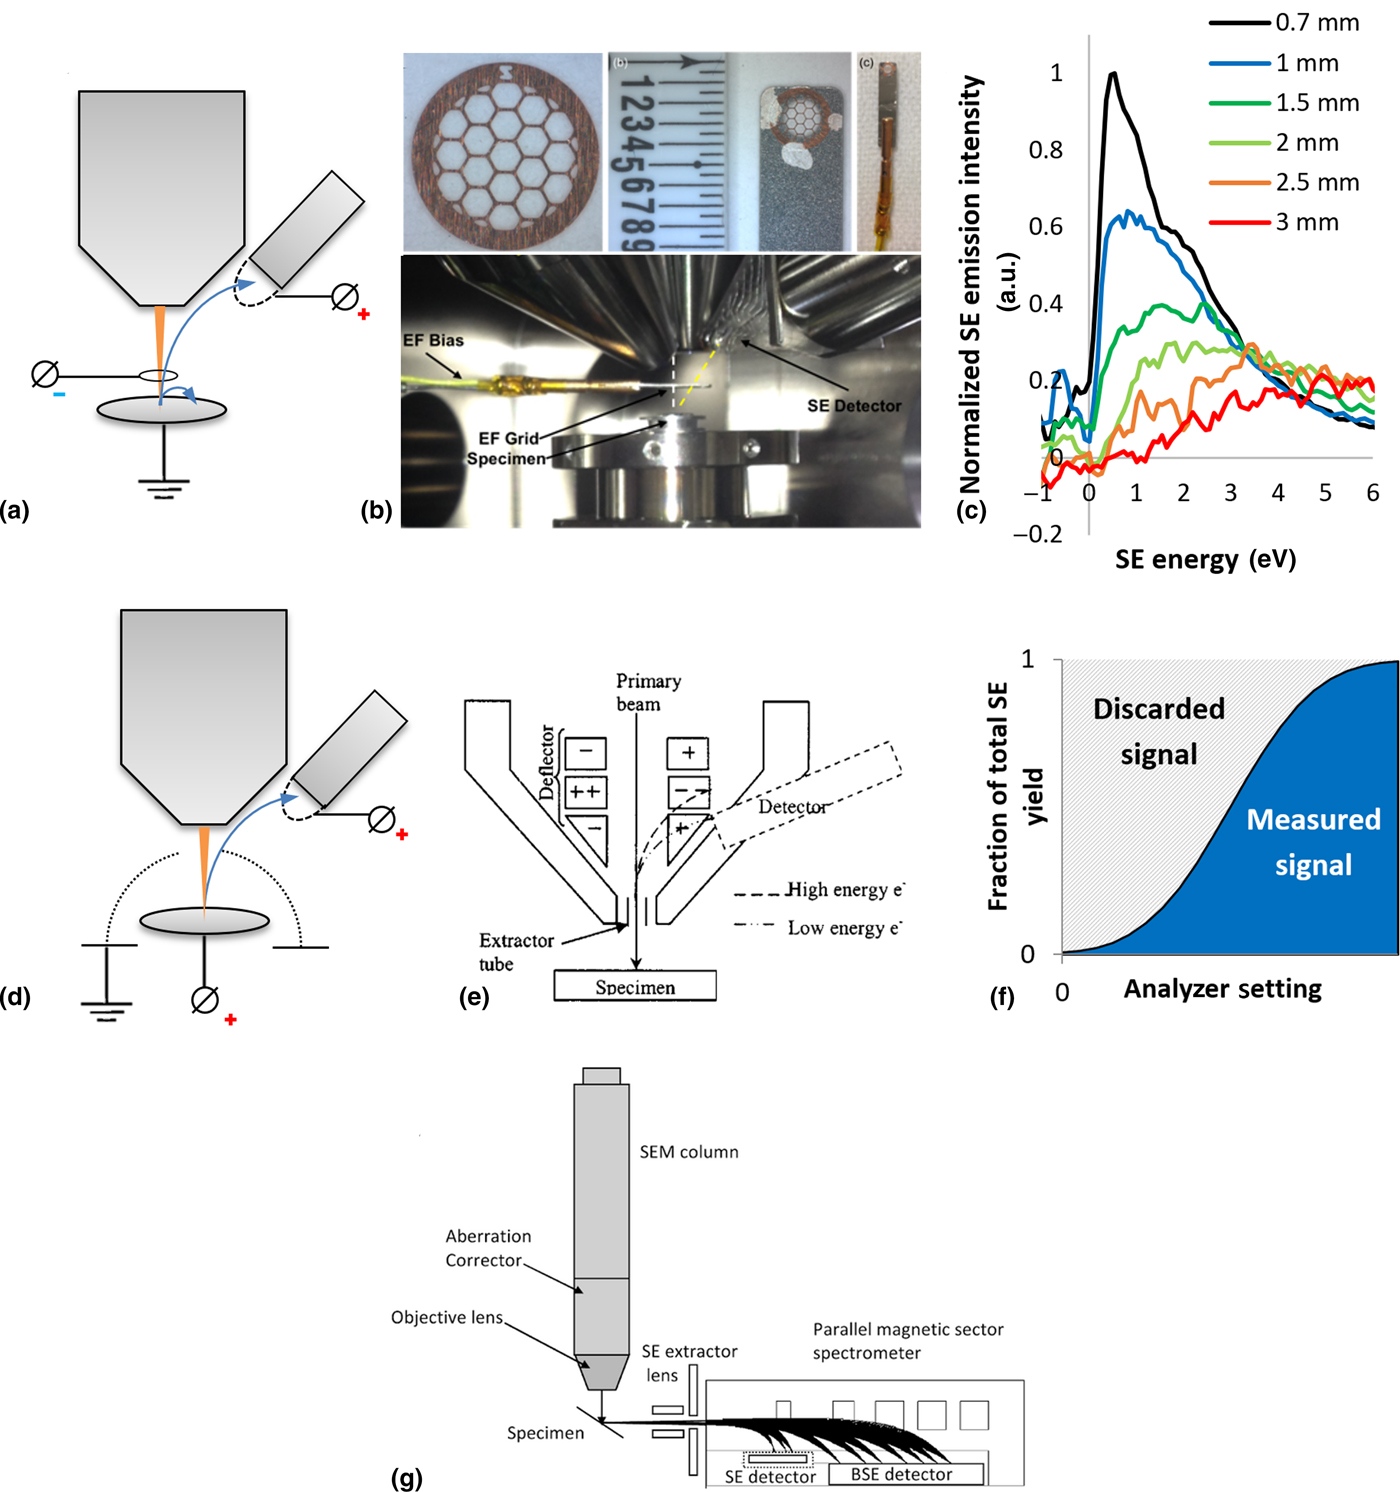
A limitation of current SE analyzers within HeIMs and SEMs is the incomplete understanding of operating parameters which are independent of the sample such as energy resolution, angular collection efficiencies, and energy collection efficiencies. Furthermore, these may change with user-controlled parameters, such as working distance and in the case of the detectors illustrated in Figs. 1(a) and 1(b) the grid-sample separation. As shown in Fig. 1(b) the energy filtering grid is mounted on a nanomanipulator arm, whereby the distance between the grid and pole-piece is kept constant for consistency. While moving the nanomanipulator arm with the grid in x and y to obtain the desired field of view, the distances between the components can be determined by focusing on the grid and sample, respectively, and obtaining the focal length for each at high magnification. The sample stage is translated in z to change the sample-grid separation. It is shown in Fig. 1(c) that the sample-grid separation is a critical parameter for spectral acquisition. This effect has also been observed when altering the sample-pole piece separation in the SEM set-up shown in Fig. 1(e).[Reference Dapor, Masters, Ross, Lidzey, Pearson, Abril, Garcia-Molina, Sharp, Unčovský, Vystavel, Mika and Rodenburg73] However, in the HeIM the sensitivity is much more pronounced in the low-energy SE emissions, and furthermore, distance measurements using the He+ beam can be expected to have a larger uncertainty due to its large depth of focus. It is clear that instrumental and working parameters must be known and controlled, as it would be expected from other electron spectrometers such as those used for photoelectron spectroscopy and Auger spectroscopy. A better understanding of these factors in SE energy analysis in HeIMs and SEMs would ensure easier image and data interpretation and reproducibility of measurements.
A further limitation of the analyzers presented in Figs. 1(a), 1(b) and 1(e) is their high or low-pass SE collection. In a spectral acquisition, the analyzer voltage is scanned to cumulatively collect SEs up to or from an energy threshold. As illustrated schematically in Fig. 1(f), this collection strategy leaves 50% of the SE signal undetected when using a normal distribution as a rough approximation for a SE spectrum. Furthermore, only the image brightness differential contains information about the SE emission at a specific energy, meaning that the fraction of the signal contributing to the measurement per image and thus exposure becomes very small. As a result, the sample is subject to significant beam exposure during a single spectral acquisition, which must be taken into account especially where dose effects such as the He+ beam invasiveness on device structures is of concern,[Reference Livengood, Greenzweig, Liang and Grumski74] or in beam-sensitive biomaterials where high spatial and energy resolution is required for nanoscale analysis.[Reference Wan, Abrams, Masters, Talari, Rehman, Claeyssens, Holland and Rodenburg75] A parallel detection rather than an energy-scanning SE energy analyzer significantly increases the number of SEs contributing to the spectrum for each image and allows the same signal-to-noise ratio of the hyperspectral images at a considerably lower overall beam exposure. The benefit of parallel analyzers over scanning analyzers in the presence of dose effects was recognized by EELS researchers in the 1980s,[Reference Strauss, Naday, Sherman and Zaluzec76] with parallel analyzers now being the industry standard.[Reference Hart, Lang, Leff, Longo, Trevor, Twesten and Taheri77] Even though they have been proposed and built, parallel SE energy analyzers in charged particle microscopes have yet to reach the broader community. Figure 1(g) illustrates an experimental set-up proposed for the SEM by Khursheed,[Reference Khursheed78] whereby this design and others would be equally valid for HeIMs.
The integration of microanalysis tools such as a parallel SE spectrometer poses a practical and design challenge. This was noted by Joy and Griffin with regard to SIMS capabilities in the HeIM.[Reference Joy and Griffin26] However, it has been shown that a SIMS analyzer can be coupled to a HeIM by adding the SIMS analyzer to the existing hardware of the HeIM using a 500 V extraction field.[Reference Dowsett and Wirtz34] The same is conceivable for SE spectroscopy, especially since extraction potentials for SE would be significantly reduced compared with those required to collect secondary ions.
Despite the challenges to be overcome if SE spectroscopy is to be established as a microanalysis tool in HeIMs, it has the potential to augment the analytical tools within the HeIM and allow access to new valuable information and novel experiments.
Applications
Chemical analysis
Microanalysis for biological and insulating materials
SE spectroscopy in the SEM is an opportunity for microanalysis of soft materials where other tools fall short. For soft and insulating materials, such as uncoated polymers and biologic materials the beam sensitivity complicates common analytical tools such as EDX or BSE imaging in the SEM. In the HeIM, EDX is unavailable due to the insufficient velocity of the incident He+ ions,[Reference Joy and Griffin26] and if yields are sufficient the information content and lateral resolution of RBS imaging is limited. In this respect, the HeIM has advantages over the SEM; firstly, as discussed above uncoated insulating specimens are more easily imaged at higher magnification and secondly, the HeIM boasts higher SE yields than SEM enabling lower dose imaging of beam-sensitive materials.
Within HeIMs and SEMs with energy filtering capabilities the SE emission spectrum can be measured for each pixel, although analyzing a group of pixels in the area of interest is more favorable with regard to the signal-to-noise ratio. Thus, differences in the micro and nanostructure can be revealed through the local SE emission spectrum. However, the resulting spectral dataset comes together from tens to hundreds of images and the dose the sample is subject to during a serial acquisition may be prohibitive to the analysis if the overall dose has damaged or otherwise manipulated the sample. By comparing the SE spectra of different material phases, the energy window giving rise to the highest material contrast between the phases can be determined, and subsequently imaged at high resolution but relatively low dose.[Reference Masters, Pearson, Glen, Sasam, Li, Dapor, Donald, Lidzey and Rodenburg79] This approach of SEHI has the advantage of reducing overall beam exposure of the sample while maximizing the desired contrast and resolution in the selected energy window. With the same goal of reducing overall beam exposure, Kazemian et al. have modulated the SE analyzer setting in phase with the line scan duration to perform the desired measurement from a single image.[Reference Kazemian, Mentink, Rodenburg and Humphreys66] Other data collection strategies are conceivable to optimize energy differential SE collection while controlling a dose in SEM and HeIM where suitable user control is given. SEHI has been applied to great success in SEMs on materials of various properties and applications; from inorganic perovskite photovoltaic materials,[Reference Kumar, Schmidt, Schileo, Masters, Wong-Stringer, Sinclair, Reaney, Lidzey and Rodenburg60] over organic photovoltaic blends[Reference Masters, Pearson, Glen, Sasam, Li, Dapor, Donald, Lidzey and Rodenburg79] to fully insulating microporous polypropylene[Reference Abrams, Wan, Stehling, Jiao, Talari, Rehman and Rodenburg80] and silk biopolymer[Reference Wan, Abrams, Masters, Talari, Rehman, Claeyssens, Holland and Rodenburg75] and so SEHI holds great potential for the HeIM as well.
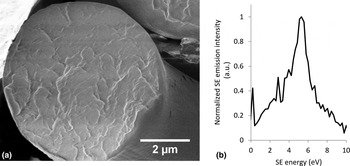
A sample spectrum collected from a cross-section of cryo-snapped Nephila edulis spider dragline silk in an FEI Helios SEM at 700 V accelerating voltage is shown in Fig. 2. There is banding visible in the total yield SE image which is caused by sample charging of the uncoated surface, and which makes obtaining higher resolution hyperspectral images a challenge. Yet in order to understand the nanostructural features of such remarkable biopolymers, higher resolution hyperspectral images are required. This challenge has already been met with slightly larger silkworm silks where nanoscale differences in protein order and disorder within the fiber have been identified,[Reference Wan, Abrams, Masters, Talari, Rehman, Claeyssens, Holland and Rodenburg75] but spider silk remains a challenge. In particular, more work needs to be done to assess the repeatability of spectra from such challenging materials and their response to differences within the material. To this date, no HeIM SE spectra have been reported for biologic and natural structural materials, although charging can be expected to be more manageable. Thus, higher resolution studies utilizing hyperspectral imaging may be more easily realized in the HeIM than the SEM.
(a) SEM image of a cryo-snapped cross section of a Nephila edulis spider dragline silk and (b) accompanying SE emission spectrum recorded in a FEI Helios SEM at 700 V.

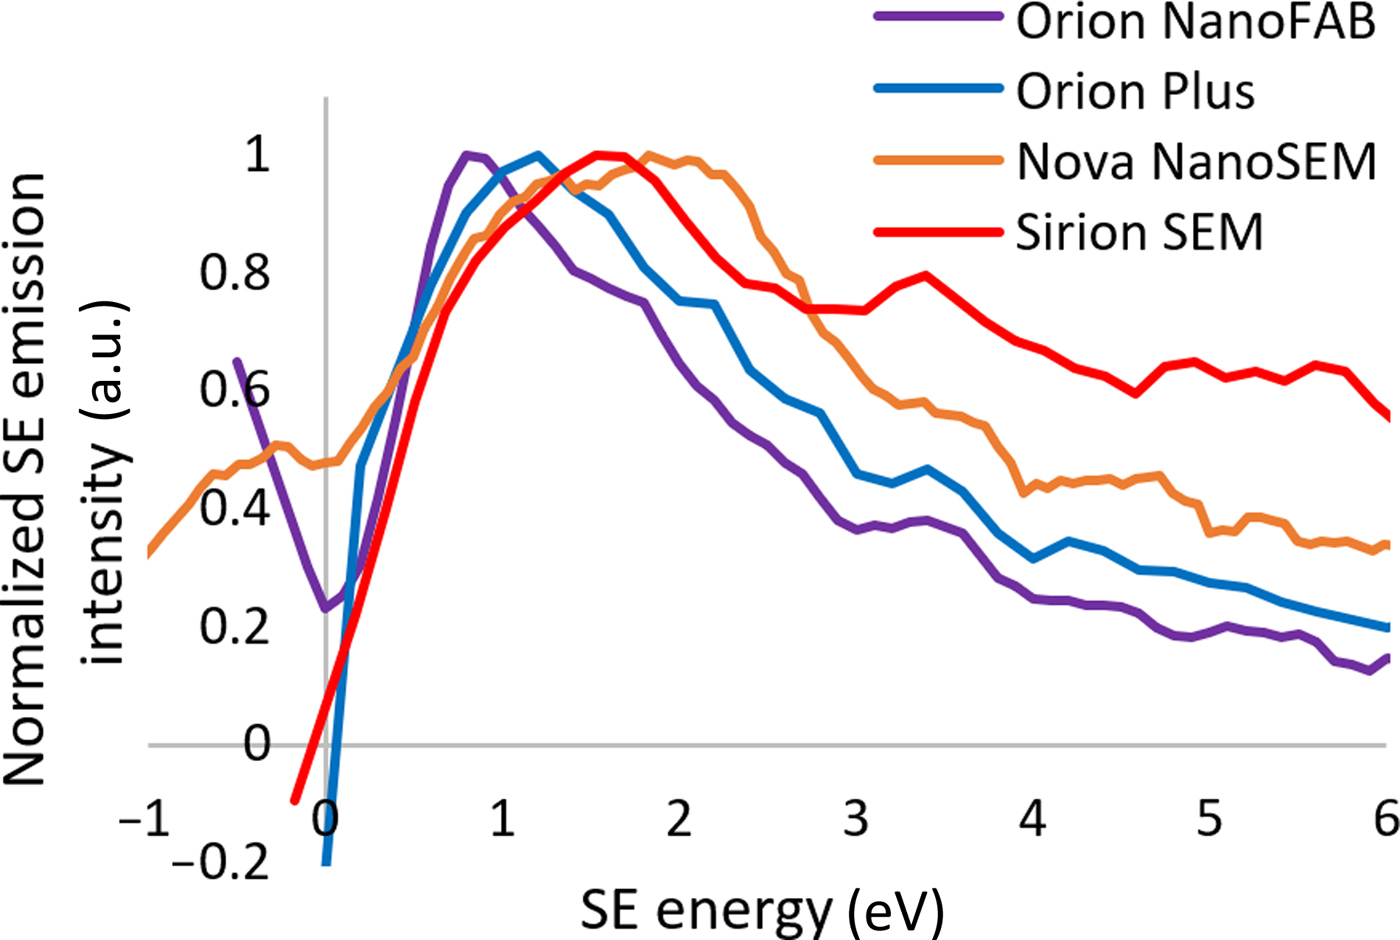
In determining how comparable SE spectra are between different SEM and HeIM instruments, a PffBT4T film was investigated as a polymer used in promising organic photovoltaic blends.[Reference Liu, Zhao, Li, Mu, Ma, Hu, Jiang, Lin, Ade and Yan81] Despite all the differences in energy analyzer design and the charged particle beam, some features of the spectral fine structure align when the onsets are set at 0 eV, notably a peak at 3.4 eV. This peak is reproducible in different instruments and thus there can be confidence that the dominant signal at low energy is due to SE1 emissions characteristic of the material, which has previously been confirmed in SEHI studies in the Nova NanoSEM.[Reference Kumar, Schmidt, Schileo, Masters, Wong-Stringer, Sinclair, Reaney, Lidzey and Rodenburg60] The high stopping power of He+ ions in the interaction volume has been simulated to result in a high SE1 to SE2 ratio in low z materials,[Reference Ramachandra, Griffin and Joy27] whereas the use of the in-lens detector in the SEMs excludes any significant contribution of SE3 within the energy range shown.[Reference Griffin69] The similarities between SEM in-lens and HeIM Everhart-Thornley SE detection shown here have also been observed by Bell in total yield iSE imaging studies of inorganic nano-rods.[Reference Bell82]
The calibration of the SE energy can be performed by the sample-biasing procedure reported elsewhere.[Reference Kazemian, Mentink, Rodenburg and Humphreys72] While the energy scale is straightforward, the location of the onset and thus determining the 0 eV SE energy point is a little more challenging. Onsets may be shifted from the expected 0 eV energy due to unwanted fields such as charging, or by material properties such as changes in the work function.[Reference Hasselkamp, Hasselkamp, Rothard, Groeneveld, Kemmler, Varga and Winter83] In the data presented in Fig. 3 the onset was set as the first local minimum emission value at lower energy than the highest positive gradient—i.e., the base of the steep increase in emission associated with the spectral onset. However, frequently there are artifacts below the onset energy whose origin and significance are not understood, and which can confuse the assignment of the onset.
PffBT4T SE spectra compared between HeIM and SEM instruments. The HeIM spectra were recorded at 30 keV and the SEM spectra at 1 kV.
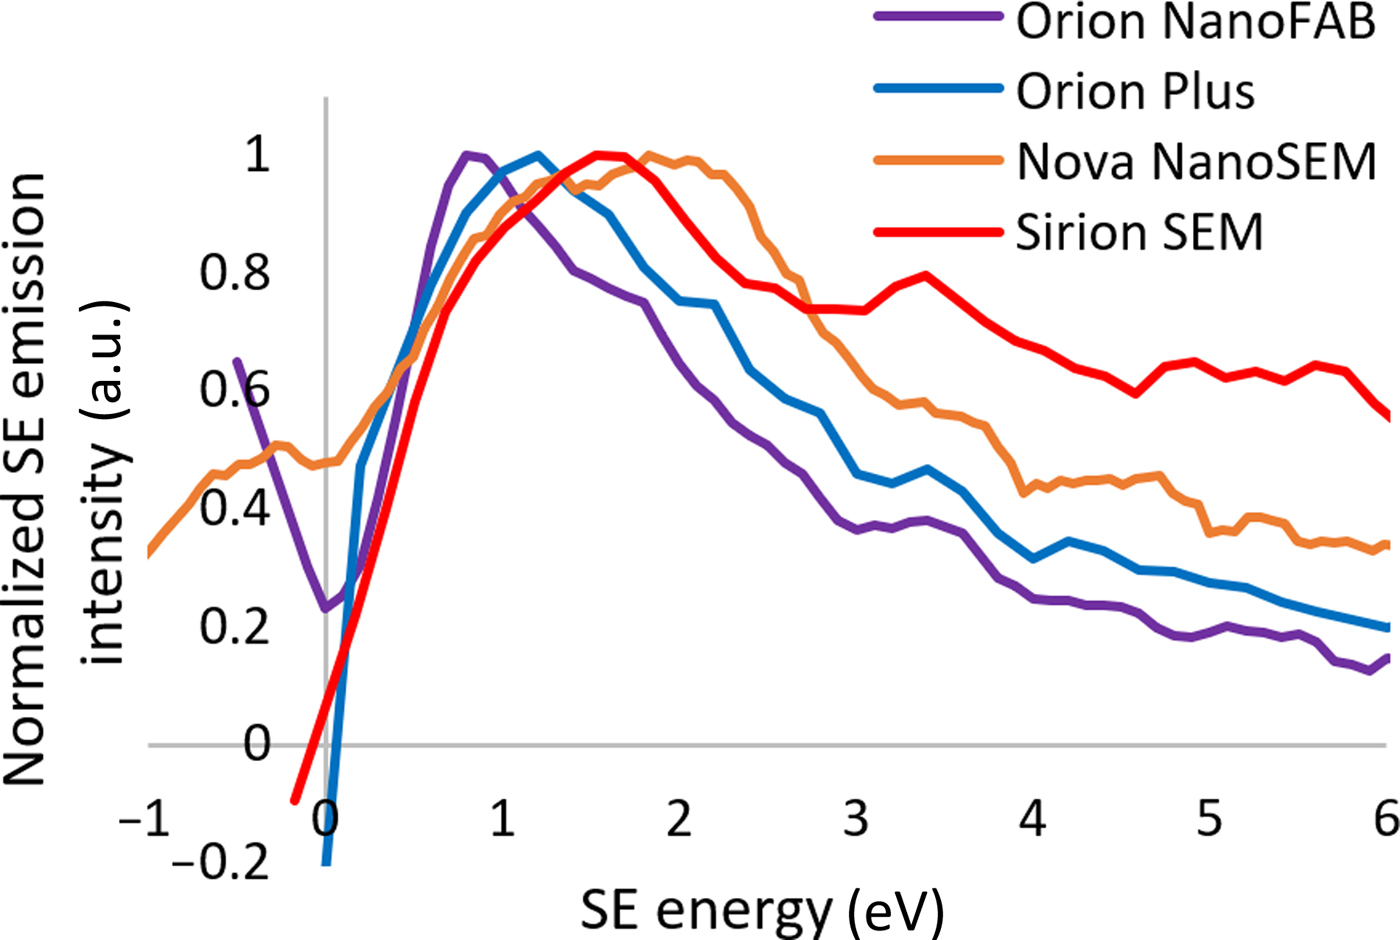
In separate iSE electron energy distribution studies of metals Ohya et al. and Petrov et al. have noted the lower energy maximum and a more rapid emission drop off at energies above the maximum leading to a sharper peak in the HeIM compared with the SEM.[Reference Petrov, Vyvenko and Bondarenko55–Reference Ohya, Yamanaka, Inai and Ishitani58] In principle, this observation is consistent with the data presented; however, no definite differences in the intensities between the iSE and eSE spectra can be described meaningfully if the collection efficiencies of the different SE analyzers are not known.
Despite the challenges in understanding the differences in detector characteristics, Fig. 3 demonstrates that principally the same sample can have spectral features which appear independently of the instrument. This is the basis for comparitive studies and progress in better understanding the significance of SE spectral features with regard to in-situ microanalysis and its potential applications.
Suppression of topography for rough samples
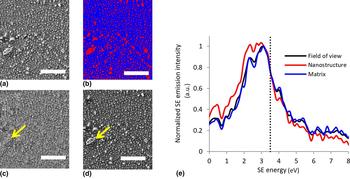
Some materials of scientific and commercial interest are inherently rough. The study of such samples is difficult with regard to SE analysis, as it is widely known that SEs contain topographical information. However, if a high collection efficiency over a wide angular range is given, for example by an in-lens detection using a high suction tube voltage, it may be expected that low energy SE1s arising from highly localized excitation events may contain little topographical information. Figure 4 demonstrates that suppression of topographical information in SEs is indeed possible: Plasma treated cellulosic fibers exhibit surface nanostructure, which is expected to protrude topographically but also is of different composition compared with the matrix. In total yield SE imaging it is not clear whether the enhanced brightness of the nano-features is purely topographical, or whether chemical differences play a role (see Fig. 4(a)). The different dominant contrast mechanisms within different energy windows are clearly shown in Figs. 4(c) and 4(d). When considering how the detected electrons respond to the topographical feature indicated by the arrow it is clear that the main contrast mechanism for the lower energy SEs in Fig. 4(c) is the difference in chemistry, whereas within the higher energy SEs shown in Fig. 4(d) the edge effect and hence topography is by far the dominant contrast mechanism. A similar SE energy cut-off for the separation of chemical and topographical SE information has been reported to map compositional contrast in caterpillar silk and perovskite photovoltaic material and in the same SEM instrument. [Reference Kumar, Schmidt, Schileo, Masters, Wong-Stringer, Sinclair, Reaney, Lidzey and Rodenburg60, Reference Wan, Abrams, Masters, Talari, Rehman, Claeyssens, Holland and Rodenburg75]
Hyperspectral imaging and SE spectroscopy for ramie plant fibre using SEHI recorded in a Nova NanoSEM at 1 kV (a) field of view of the standard SE image, (b) visualization of the thresholding used to separate emissions from the matrix and nanostructure in blue and red, respectively, (c) SEHI image representing the SE emissions in the energy window of 0-3.5 eV showing the suppression of the edge effect to reveal chemical contrast, (d) SEHI image representing the SE emissions in the energy window of 3.5–8 eV showing the edge effect and hence topography as the dominant contrast mechanism, (e) SE spectrum of the surface shown in the images (a–d) showing increased low-energy SE emission of the nanostructure. Scale bars show 1 µm.
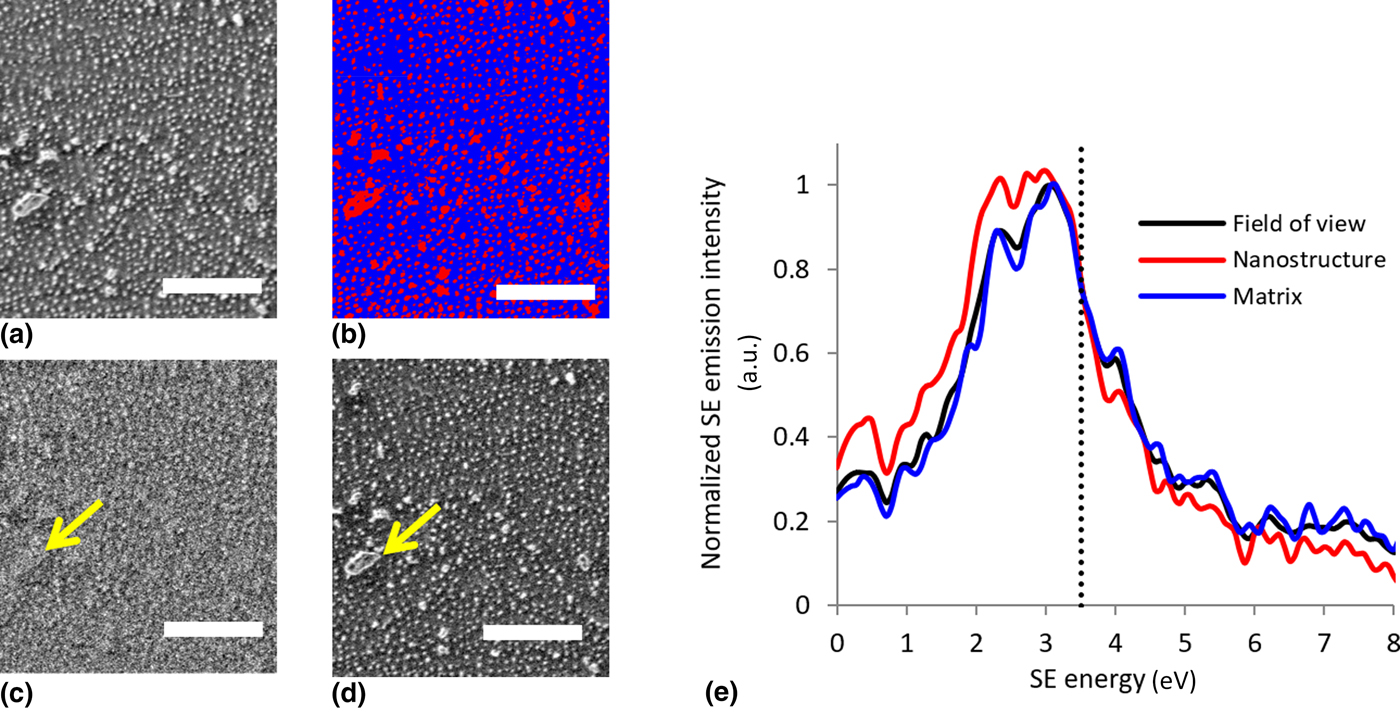
In this analysis, thresholding was used to separate the spectrum of the matrix (blue) from the spectrum of the nanostructure (red) (Fig. 4(b)). Notably, the nano structure emits more SEs than the amorphous matrix in the lower energy region below 3.5 eV, indicated by the dotted line. Thus, the chemical contrast revealed in Fig. 4(c) arises from differences in the SE emission between the nanostructure and matrix in this energy region.
The HeIM has already been shown to deliver superior lateral resolution and image stability for insulating and biologic materials. The realization of topography suppression within the iSE signal in the HeIM has the potential of unlocking new structural analysis tools for soft and rough samples – which include some of nature's most exciting materials.
Process control for chemically complex samples
While many microanalysis tools such as RBS and SIMS are concerned with determining atomic and molecular composition, there are other material properties such as molecular orientation, order, and local variation which govern the success or failure of many modern materials, especially those widely used in electronics or tissue engineering.
P3HT is a conductive polymer with immense significance to the field of organic electronics and the organic photovoltaic (OPV) industry. It is commonly used with fullerenes in a blend to make organic solar cells. The processing parameters of the pure films and the OPV blends have a significant effect on important material parameters, especially molecular and long-range order, which in turn directly affect charge transport.[Reference Noriega, Rivnay, Vandewal, Koch, Stingelin, Smith, Toney and Salleo84] Thus, these processing parameters must be optimized and controlled.
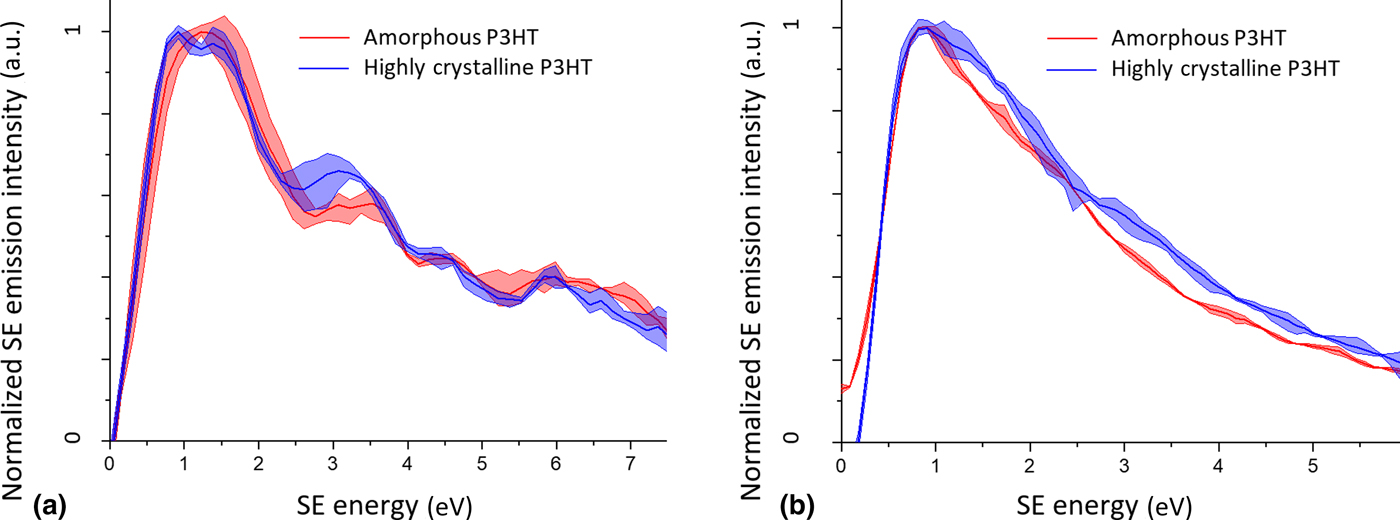
After it was shown that hyperspectral imaging within SE energy windows can dramatically enhance morphological contrast in OPV blends,[Reference Masters, Pearson, Glen, Sasam, Li, Dapor, Donald, Lidzey and Rodenburg79] the underlying SE emission mechanisms were further investigated in the pure polymer system.[Reference Dapor, Masters, Ross, Lidzey, Pearson, Abril, Garcia-Molina, Sharp, Unčovský, Vystavel, Mika and Rodenburg73] Figure 5(a) shows the comparison between amorphous and highly crystalline P3HT spectra in the FEI Sirion SEM. The difference in crystallinity arises from the polymerization conditions and the processing of the P3HT: The highly crystalline sample is made by annealing a regioregular P3HT polymer, whereas the amorphous P3HT is an unannealed regiorandom polymer film. The difference in SE electron distribution due to the order inherent to the polymer is evident, for example in the most intense peak at low energy the SE distribution of the highly crystalline sample exhibits a double peak which manifests as a single broad peak in the amorphous sample. The processing and polymerization conditions are clearly encoded in the SE emission behavior through the presence or absence of order, and thus there is potential for it to be mapped.[Reference Dapor, Masters, Ross, Lidzey, Pearson, Abril, Garcia-Molina, Sharp, Unčovský, Vystavel, Mika and Rodenburg73] Furthermore, the samples exhibit a different variation of certain spectral features: While the lowest energy peak of the highly crystalline sample has a highly conserved peak width, the same peak in the amorphous sample diverges significantly from the average in repeat spectra. It can be proposed that in a favorable sample the variability of spectra reflects inherent property fluctuations, such as order and disorder, and that this could be exploited to explore the multi-scale variability of material properties using SE spectroscopy within charged particle microscopes. The same experiment performed in the HeIM is shown in Fig. 5(b), with markedly less distinct features present in the spectra, potentially because collection parameters are not optimal. However, as in the SEM data, the peak of the highly crystalline P3HT appears as a double peak, and a weak shoulder is present at 3 eV where the SEM spectrum exhibits a more prominent peak. While analysis based on spectral features may be difficult to realize with the spectra presented in Fig. 5(b), the two spectra are very distinct in their surface potentials: consistently within the dataset the amorphous sample was shifted by 0.64 eV to set the spectral onset at 0 eV, whereas the highly crystalline sample was shifted by 0.91 eV. Such shifts in the spectral onset are exciting for mapping regions of high and low crystallinity in a semi-crystalline sample, as phase contrast can be enhanced dramatically if an energy window is chosen systematically.[Reference Masters, Pearson, Glen, Sasam, Li, Dapor, Donald, Lidzey and Rodenburg79] Such differences in the surface potential were not observed in the SEM, presumably due to the difference in polarity of the impinging charged particle.
SE spectra of high order annealed regioregular and low order regiorandom P3HT recorded at 1 keV in the SEM (a) and 30 keV in the HeIM (b). The solid line represents the average signal from three different areas, whereas the transparent colored background represents the minimum and maximum range within the three acquisitions.
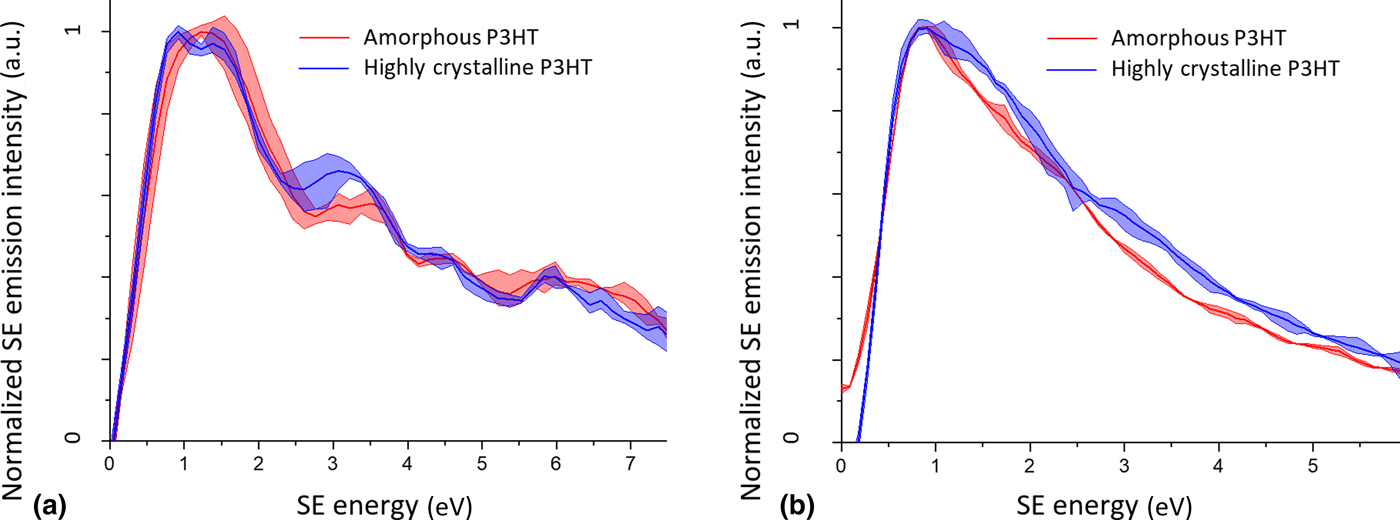
It is noteworthy that the distinction between the two materials in both instruments is best made at low SE energies below 4 eV, which is a SE energy range which is usually poorly resolved in early SE spectroscopy work. Further work in understanding low energy SE emissions promises novel ways of analyzing material surfaces and mapping critical properties.
Nano-engineering applications
Nano-engineering control
In understanding and quantifying the effects of ion beam exposure on various samples, in-situ analysis tools besides the contrast in total yield SE imaging are sought. Fox et al. have reported the controlled manipulation of few-layer MoS2 electrical properties using the HeIM, and have related the dose to semiconductor or metal-like resistivity behavior.[Reference Fox, Zhou, Maguire, O'Neill, Ó’Coileáin, Gatensby, Glushenkov, Tao, Duesberg and Shvets14] In the study, the resistivity had to be measured ex-situ, but as the SE emission signatures are expected to change with the electronic structure there is scope for SE spectroscopy to be developed as a technique to understand the ion beam induced modification of electronic properties live and in-situ. This has been proposed as early as 2004 by Joy et al.[Reference Joy, Prasad and Meyer63] and work by Zhou et al. showcases the feasibility of this approach on graphene.[Reference Zhou, Fox, Maguire, O'Connell, Masters, Rodenburg, Wu, Dapor, Chen and Zhang71]
To save time and raise the efficiency of small-scale but big impact nano-engineering applications, automation is paramount. While Joe et al. demonstrated that automated image processing of the total yield iSE signal can be used to direct a FIB to stop at material interfaces,[Reference Joe, Lee, Jun, Park and Min85] the beam could be set to respond to various sample properties, such as phase composition, if such sample properties are defined in specific SE energy windows. For example, this could ensure selective machining of nanostructured samples in which the different phases respond differently to the beam.
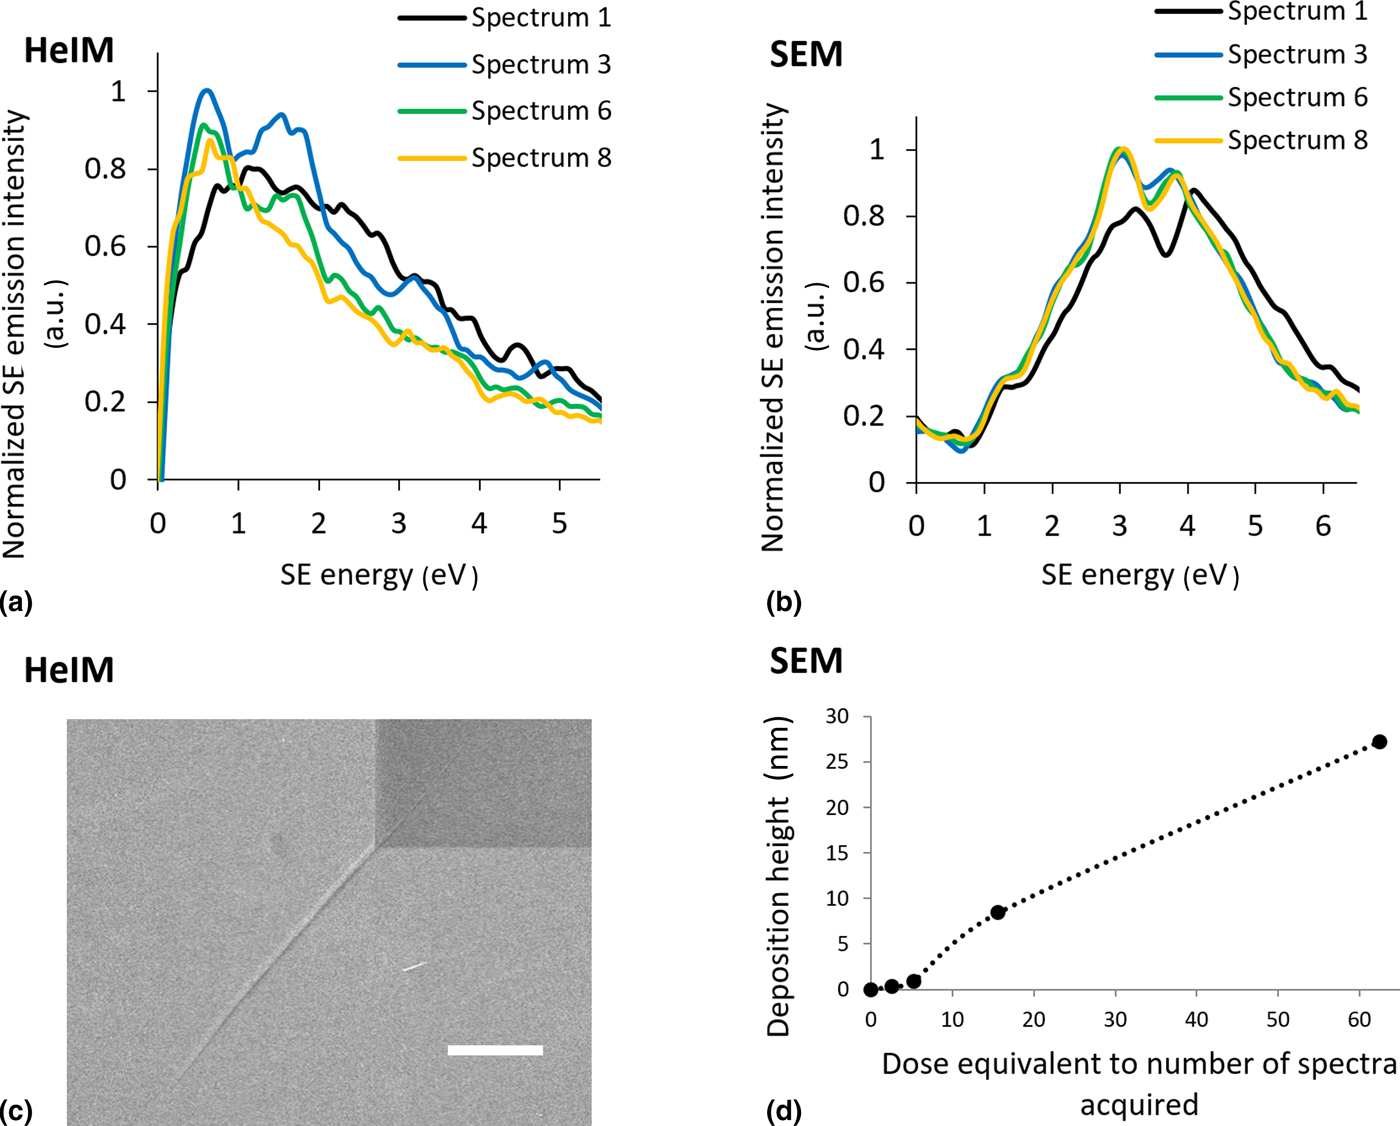
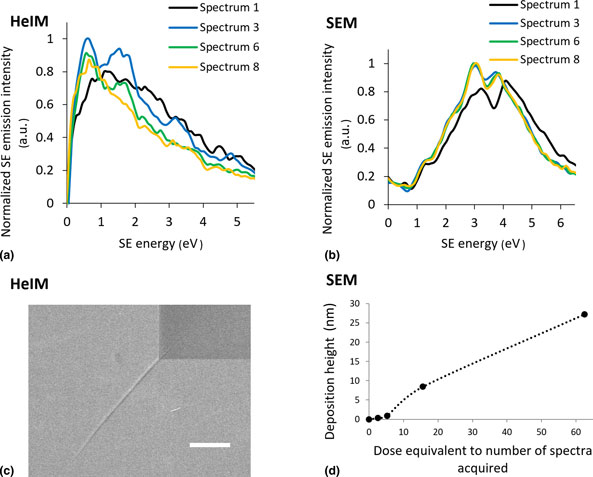
While some nanofabrication methods actively seek the chemical modification of the sample by the beam, it must be minimized for other applications such as the preparation of electron-thin TEM samples. In this work, highly oriented pyrolytic graphite (HOPG) was studied under electron and ion beam irradiation as a suitable model graphite sample. The low angular spread of its graphite sheets leads to a well-defined orientation of the crystal structure relative to the beam and thus its SE emission from various excitation sources have been studied decades ago: The SE emission spectra of HOPG from low voltage He+ beams and ultraviolet excitation have been compared by Ferrón et al., whereby there is a clear change in peak shape with progressing damage of the 5 keV He+ beam to the HOPG surface.[Reference Ferrón, Vidal, Bajales, Cristina and Baragiola86] Thus, the influence of beam exposure on the sample surface is reflected in the SE spectrum and can be followed in situ by a series of spectral acquisitions. In this work the evolution of the spectra with increasing total beam exposure differs between the HeIM and the SEM: In the SEM the SE spectrum of HOPG changes within a single acquisition, and AFM data show that this is due to a rapid formation of electron beam induced deposition (EBID) (Fig. 6(d)). After three spectra the measurement is dominated by the EBID, and it is clear that this poses a limitation to a technique as surface sensitive as SE spectroscopy in a low voltage SEM (LV-SEM).
Evolution of spectra and sample surface with ion or electron dose (a) 30 keV HeIM SE spectra of HOPG imaged consecutively in the same field of view recorded in the Orion NanoFAB (b) 1 kV SEM SE spectra of HOPG imaged consecutively in the same field of view recorded in the FEI Nova NanoSEM (c) cracking at the corner of the spectral field of view (dark square) due to helium implantation after 8 spectral acquisitions in the HeIM, scalebar 2 µm (d) accumulation of electron-beam induced deposition (EBID) in the SEM as measured by AFM.
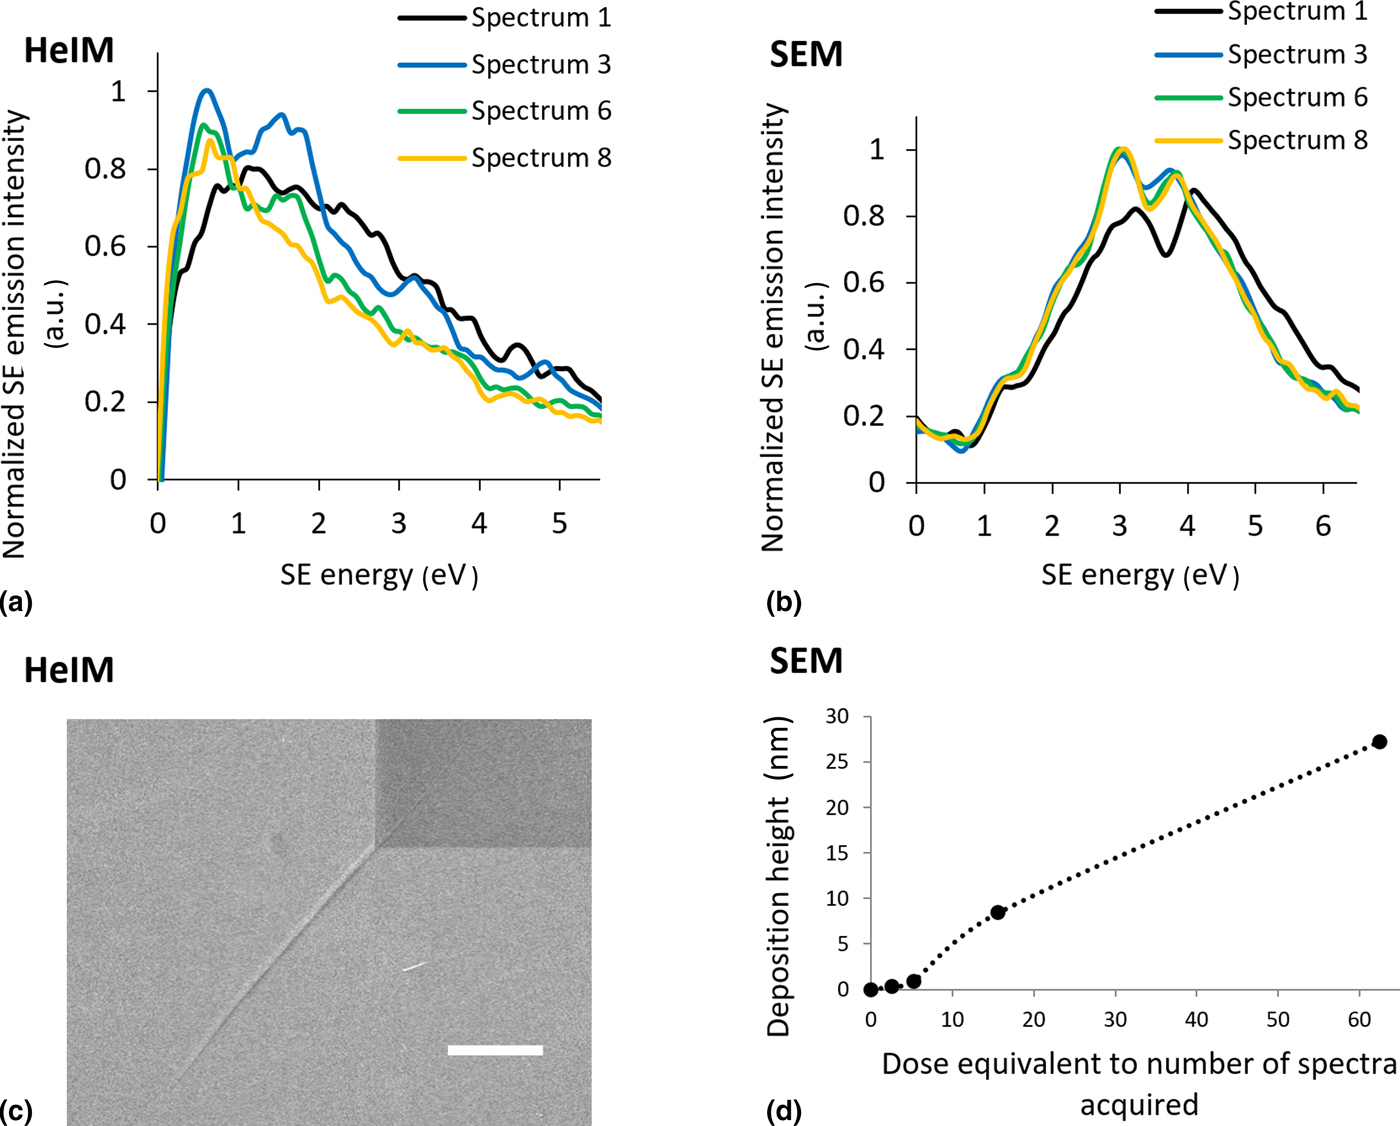
Like LV-SEM, HeIM is very surface sensitive to the point where the SE spectra in this work were affected by the previous use and the cleanliness of the chamber, which must be kept in mind for nanofabrication applications. In the example of HOPG, a chamber in which PffBT4T had been milled prior to SE spectral collection lead to a spectrum dominated by a potential PffBT4T contamination layer as represented in spectrum 1 in Fig. 6(a). With increasing ion dose, spectral fine structure emerges, which is most prominent in spectrum 3. While the origin of this fine structure requires further validation, it may represent the bulk HOPG spectrum if the He+ beam has sputtered the contamination layer. In either case, in both the SEM and the HeIM surface sensitivity can be a complicating factor, however, the HeIM has a clear advantage due to the availability of micromachining He+ and Ne+ beams to polish the surface and access bulk information.
With further He+ beam exposure, the fine structure in spectrum 3 fades again due to continuous He+ damage of the HOPG surface, but the overall spectrum shape differs to that of the contamination dominated spectrum 1. The total yield SE images become progressively darker with each acquisition, but do not capture this multi-stage evolution under beam exposure and could lead to uncertainty as to whether the sample is covered in a contamination layer or has been significantly damaged by He+ ion exposure. Conventionally the acceptable doses would have to be validated ex-situ, for example by Raman spectroscopy.[Reference Fox, Zhou, O'Neill, Kumar, Wang, Coleman, Duesberg, Donegan and Zhang87] Here, SE spectroscopy could be an effective way to monitor both the polishing of the contamination layer and the increasing beam damage in situ, making it possible to seize any window of opportunity between the two processes to obtain bulk information. Monitoring the surface condition in situ by the use of SE spectroscopy or SEHI can allow in-situ optimization of procedures such as He+ polishing for electron-thin TEM samples when mitigation of beam damage is crucial.
The continuous measurement of the same area does not only damage the surface through beam exposure but also leads to He implantation. Figure 6(c) clearly shows the evolution of cracks radiating from the stress-concentrated corners of the spectral field of view due to implantation of He gas, which becomes visible after six spectral acquisitions. This is consistent with accounts of bubble formation of silicon and graphene in literature.[Reference Fox, Chen, Faulkner and Zhang10] In the case of HOPG the layered structure seems to allow bubbles to connect across the exposed area to delaminate the HOPG layers below the surface and result in such cracking at the corner of the spectral field of view.
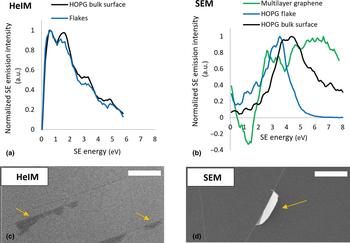
Besides tracking the effect of ion beam irradiation on carbon samples, the ability to distinguish between different carbon species on a surface can be useful in tracking contamination. For example, it may be valuable to track amorphous carbon char caused by unfavorable reactions of a precursor gas under ion beam irradiation, or it may serve to monitor resistance channels caused by contamination when making carbon nanotube devices.[Reference Barnett, Gowenlock, Welsby, Orbaek White and Barron88] The sensitivity of SE spectra to the electronic structure governed by the nature of the carbon–carbon bonding was shown in a study in 1994 using a 1 keV electron gun and an Auger electron energy analyzer.[Reference Hoffman89] In this work, the spectra of features on the surface of the HOPG sample which appeared to be graphene-like (Fig. 7(c)) were compared with the spectra of the bulk surface Figs. 7(a) and 7(b). While the differences between bulk and flakes are present in both instruments, the difference in the HeIM spectra is a lot less pronounced, perhaps because the graphene-like surface flakes are less free-standing compared with the flake analyzed in the SEM, allowing the bulk signal to pass through.
Spectral comparison of graphene and graphite-like surface structures. (a) 30 keV Orion NanoFAB HeIM spectra (b) 1 kV Nova NanoSEM spectra, including multilayer graphene (n>10) (c) images illustrating graphene-like flakes in the HeIM and (d) SEM, scalebars represent 2 µm.
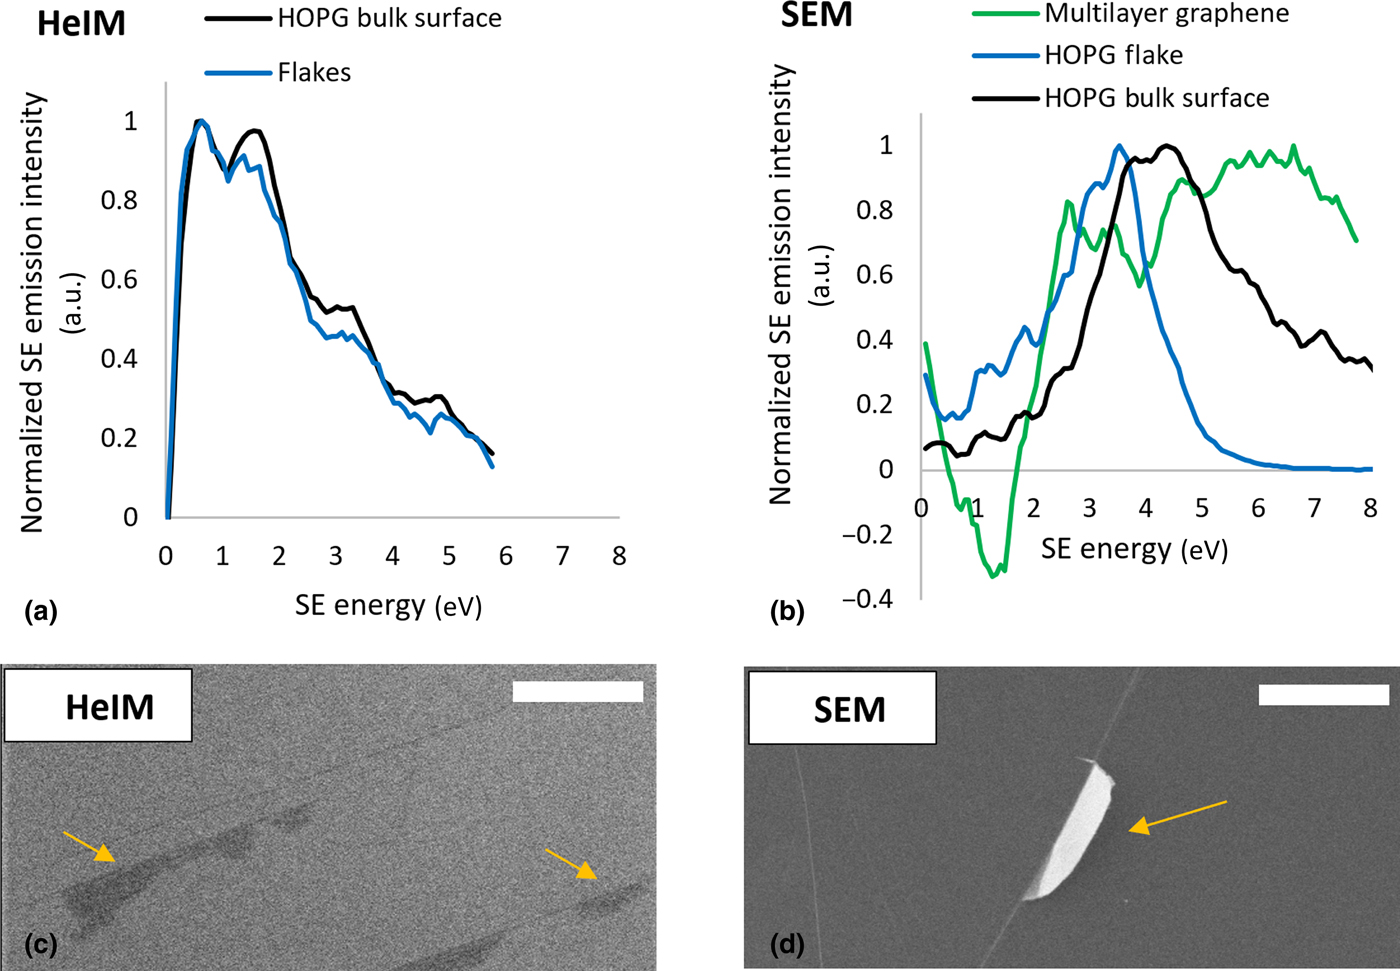
In the Nova NanoSEM data from multilayer graphene is available to demonstrate that with increasing bulk graphite characteristic of the carbon species the dominant peak appears at higher energy. Zhou et al. have used this effect to quantify the number of graphene layers using SE spectra in SEMs and HeIMs[Reference Zhou, Fox, Maguire, O'Connell, Masters, Rodenburg, Wu, Dapor, Chen and Zhang71] and other reference studies to distinguish between different carbon states could be performed.
Understanding and managing damage
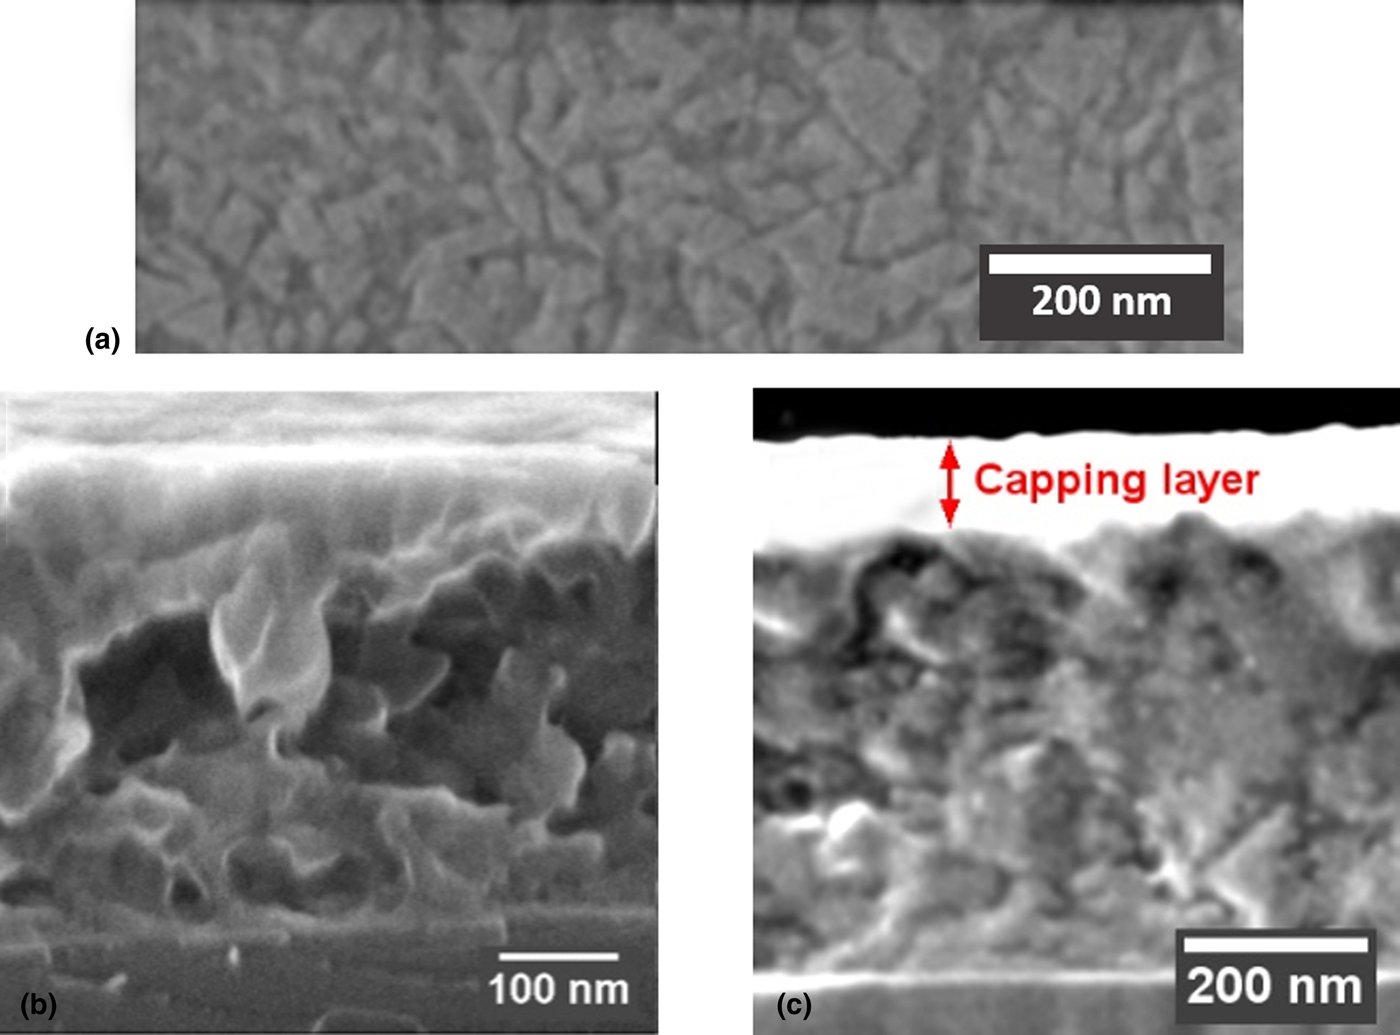
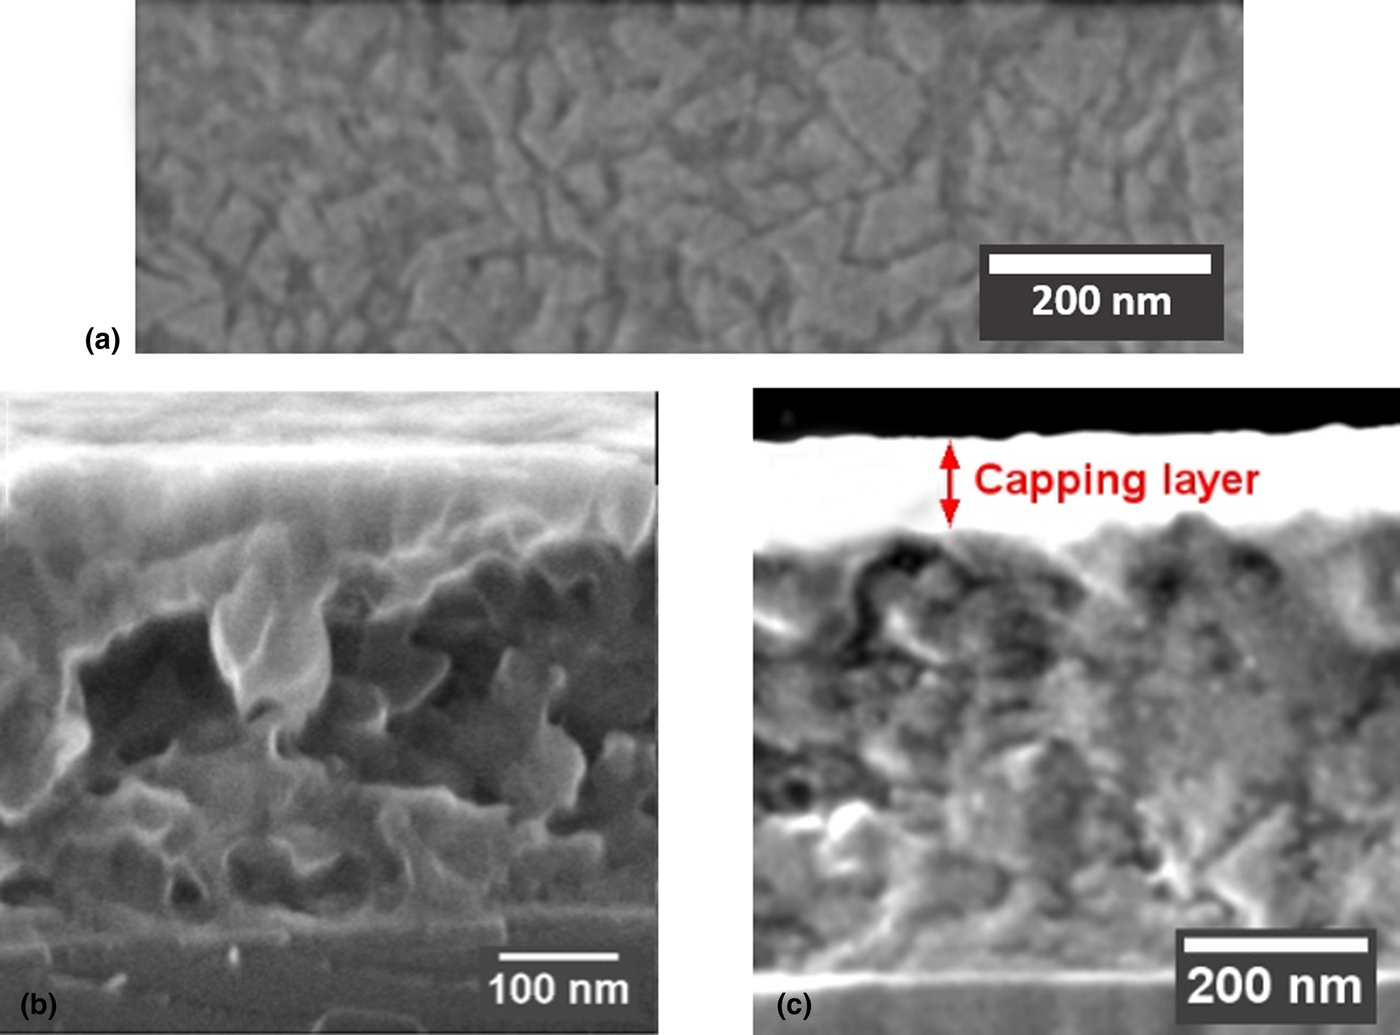
The reduced sputter- and damage rate of He+ ions compared with Ga+ ions is an opportunity for in-situ modification and imaging of beam sensitive materials such as polymers. As mentioned previously, organic photovoltaic blend morphology is important for device performance, and the top-down blend morphology of a PffBT4T-2OD:PC70BM organic photovoltaic blend is shown in Fig. 8(a). However, a top-down image of the phase structure is superficial and may not be representative of the 3D phase structure of such blends. Thus, in an attempt to reveal the transverse phase-structure the blend was cryo-snapped, and the cross-section is shown in Fig. 8(b). Unfortunately, the phase-structure in the cross-section is not as clear as in the top-down view due to cleaving artifacts obscuring the picture. Fig. 8(c) illustrates how a He+ beam at glancing incidence to the cross-section has been used to polish these cleaving artifacts after cryo-fracture. The He+ beam irradiation does result in damage which manifests in a featureless surface, and so in this work, the blend morphology has been recovered by 20 s of O2/Ar plasma treatment analogously to approaches described in literature.[Reference Pearson, Boden, Bagnall, Lidzey and Rodenburg90] Note that the cross-sectional features are protected by a capping layer of PEDOT:PSS polymer to avoid damage towards the top of the cross-section where the polishing He+ beam impinges the sample. The images showcase the versatility of the HeIM as a nanofabrication and imaging tool if damage effects are understood and managed. Future work will lie in the further optimization of such sample preparation protocols by incorporating SE spectroscopy and energy selective imaging as a tool to quantify damage and increase phase contrast.
PffBT4 T-2OD:PC70BM organic photovoltatic blend (a) top-down view showing phase-structure (b) cross-section in the HeIM after cryo-snapping with topographical cleaving artifacts obscuring phase-structure (c) the same blend protected with a PEDOT:PSS capping layer and then subject to He+ polishing of the cross-section at glancing incidence. The damage layer caused by the He+ polishing was removed by a O2/Ar plasma to reveal the blend morphology.
Conclusions & future outlook
The integration of SE spectroscopy has the potential to be a key enabling technology in the HeIM for the development and optimization of nano-engineering processes. Understanding SE contrast beyond the total yield and analyzing SE emission characteristics can reveal chemical and structural information on the nanoscale, and promises an in-situ understanding of cleanliness, beam induced damage, modification, and deposition. To become a reliable technique which can be embedded into nano-engineering workflows, new SE energy detectors must emerge with defined characteristics and parallel SE measurement. Besides increasing the understanding of beam–sample interactions and enhancing process control, a refined low energy SE spectrometer within charged particle microscopes can open doors to nanoscale studies of sensitive and complex samples, such as natural nanocomposites, and will allow novel experiments at unprecedented resolution.
Acknowledgments
The authors would like to thank Fritz Vollrath and Alex Greenhalgh providing the spider silk sample. CR and CH would like to thank the EPSRC for funding (EP/N008065/1 and EP/K005693/1). The authors also thank The Royal Society international exchanges grant number IE140211 and The Leverhulme Trust for the PicoFib network.