Obesity is a global epidemic that increases the risk of morbidity and reduces lifespan(Reference Karamanakos, Kokkinos and Dalamaga1). The consumption of ultra-processed foods is associated with a greater risk of developing obesity and associated diseases(Reference Cordova, Kliemann and Huybrechts2–Reference Konieczna, Morey and Abete5). These products are frequently energy-dense and have excessive amounts of sugars, salt, oils and/or fats. In addition to the obesogenic nutrient profile, the use of cosmetic additives and industrial food processing technologies converts these foods into stable, highly palatable products(Reference Poti, Braga and Qin6,Reference Monteiro, Moubarac and Cannon7) . In this scenario, the use of palm oil (PO), interesterified fats and other synthetic fats in ultra-processed foods is of concern(Reference Monteiro, Moubarac and Cannon7,Reference Lavrador, Afonso and Cintra8) .
Adipose tissue expansion and remodelling in the context of obesity involves immunometabolic and functional changes(Reference Angelidi, Belanger and Kokkinos9). Brown adipose tissue (BAT) is considered a target tissue to attenuate obesity(Reference Parra-Peralbo, Talamillo and Barrio10,Reference Martins, Martins and Teixeira11) since BAT activation increases energy expenditure, reduces adiposity and protects against diet-induced obesity in mice(Reference Feldmann, Golozoubova and Cannon12–Reference Blondin, Nielsen and Kuipers14). The thermogenic capacity of BAT is driven by the activity of uncoupling protein 1 (UCP1), located in the inner mitochondrial membrane of brown adipocytes(Reference Montanari, Pošćić and Colitti15).
In addition to expression of the thermogenic genes, PPAR α (Pparα) and PPAR coactivator-1α (Pgc1α) are highly expressed in BAT, resulting in the uncoupling of ATP production from catabolic pathways of lipids and carbohydrates and, therefore, high energy expenditure(Reference Kuryłowicz and Puzianowska-Kuźnicka16,Reference Gaspar, Pauli and Shulman17) . Obese individuals generally have lower BAT mass, suggesting that obesity may decrease BAT mass and function(Reference Kulterer, Herz and Prager18,Reference Leitner, Huang and Brychta19) .
The process of weight gain induces alterations in adipose tissue, where brown adipocytes can transform into cells resembling white adipocytes, characterised by a reduction or loss of thermogenic activity. This transformation is referred to as the whitening process(Reference Maniyadath, Zhang and Gupta20). Brown adipocytes undergoing whitening exhibit a unilocular organisation of lipid content and begin expressing leptin, a hormone characteristic of white adipocytes. Immunohistochemical analysis reveals that these white-like adipocytes retain weak mitochondrial UCP1 immunoreactivity and show reduced expression of classical brown adipocyte genes(Reference Razzoli, Frontini and Gurney21–Reference Kotzbeck, Giordano and Mondini23), potentially exacerbating the adverse effects of weight gain.
In this context, the current Western dietary pattern, characterised by a predominant or increasing intake of ultra-processed foods, is a key factor contributing to the rise in body mass (BM) and adiposity(Reference Bray, Davidson, Toth and Maki24,Reference Jais and Brüning25) . The use of PO and interesterified palm oil (IPO) in these food products has increased since the implementation of industrial trans-fat regulations. PO is a naturally occurring vegetable oil rich in saturated fat, and the interesterification process modifies the stereospecific distribution of its fatty acids, increasing the occurrence of SFA (palmitic or stearic) in the sn-2 position of the TAG molecules(Reference Berry26,Reference May and Nesaretnam27) . It has been demonstrated that fatty acids located at the sn-2 position exhibit higher bioavailability compared with those at other positions on the glycerol backbone(Reference Mu and Høy28). This could potentially lead to more efficient absorption of saturated fats in IPO compared with PO and different metabolic effects, despite similar fatty acid profiles.
IPO has been shown to have deleterious effects on insulin sensitivity(Reference dos Santos, Miyamoto and Siqueira29), glucose homeostasis(Reference Miyamoto, Reginato and Portovedo30,Reference Martins, Da Silva Ribeiro and Teixeira31) and the fatty acid profile in the brains of adult offspring(Reference Magri, Fernandes and Souza32), as well as to increase intestinal permeability(Reference Menta, Andrade and de Castro33), leading to bacterial translocation and alterations in inflammatory parameters in mice. However, studies investigating the effects of this type of oil on the whitening process of BAT remain scarce. The present study aims to evaluate the impact of PO and IPO consumption on the whitening of BAT in C57BL/6 mice fed a high-fat diet.
Materials and methods
Preparation of interesterified palm oil
PO and IPO were kindly provided by Agropalma® (Limeira). The interesterification was carried out via a chemical process using Interchem Technology. This method employed sodium methoxide (0·1 % w/w) as a catalyst, under controlled conditions of 90–110°C, 30 mbar pressure and moderate agitation for 20 min in a reactor-dryer system. After the reaction, the modified fat underwent clarification and deodorisation steps to complete the refinement process(Reference Norizzah, Nur Azimah and Zaliha34).
Fatty acid profile analysis via GC
The fatty acid composition of the lipid sources used in the diets was determined by GC, following previously established protocols(Reference Christie35). For sample preparation, lipids were dissolved in a solution containing 1 ml of toluene and 2 ml of 1 % sulfuric acid in methanol. This mixture was incubated in sealed tubes at 50°C overnight. After cooling, 1 ml of 5 % sodium chloride was added to the reaction, and the resulting methyl esters were extracted with 2 × 2 ml of hexane using Pasteur pipettes. The hexane layer was separated, and the solvent was evaporated under a nitrogen stream. The resulting fatty acid methyl esters were resuspended in 100 µl of heptane.
GC-MS was performed on a Shimadzu GCMS-QP2010 Plus system equipped with an HP Ultra 2 column (5 % phenyl-methylpolysiloxane; 25 m × 0·20 mm × 0·33 µm; Agilent). The injector temperature was 250°C, and the oven was programmed in stages: from 40°C to 160°C at 30°C/min, from 160°C to 233°C at 1°C/min and from 233°C to 300°C at 30°C/min, with a final hold at 300°C for 10 min. Helium was used as the carrier gas at a linear velocity of 36·0 cm/s. Each sample (1 µl) was injected in split mode. Electron ionisation (70 eV) and a quadrupole mass analyser were used, scanning from 40 to 440 amu. The ion source and interface temperatures were both set at 240°C. Fatty acid identification was performed by matching mass spectra with the NIST05 library, and retention indices were confirmed using the Supelco 37 Component FAME Mix (Sigma-Aldrich). Results were expressed as relative percentages.
TAG composition
The TAG profile of the lipid samples was analysed according to the AOCS Ce 5–86 method (American Oil Chemists’ Society, 2009). Analyses were conducted using an Agilent 6850 Series GC System fitted with a DB-17 HT capillary column (Agilent; 50 % phenyl-ethylpolysiloxane; 10 m length, 0·25 mm ID, 0·15 µm film thickness). The GC was operated under the following conditions: column flow rate of 1·0 ml/min, linear velocity of 40 cm/s, injector at 360°C and detector at 375°C. The oven was programmed to heat from 250°C to 350°C at 5°C/min, followed by a 20-min hold at 350°C. Helium served as the carrier gas. A sample volume of 1·0 µl was injected using a split ratio of 1:100, with the oil samples prepared at 10 mg/ml in tetrahydrofuran. TAG were identified by comparison with known retention times(Reference Filho, Mendes and Lanças36). The relative proportions of TAG, diacylglycerols, monoacylglycerols and free fatty acids were calculated and presented as percentages.
Regiospecific distribution of fatty acids
To assess the positional distribution of acyl chains within TAG molecules, carbon-13 NMR (13C NMR) spectroscopy was employed. Each sample (250 mg) was dissolved in 0·5 ml of deuterated chloroform (CDCl3) and transferred to 5 mm NMR tubes. Spectra were acquired using a Bruker Advance DPX 300 NMR spectrometer operating at 75·8 MHz, at a constant temperature of 30°C, following procedures adapted from previous literature(Reference Kalo and Kemppinen37).
Diets and animal procedures
The experimental protocol was submitted and approved by the Ethics Committee for Animal Experimentation of Rio de Janeiro State University, Rio de Janeiro, Brazil, under protocol number 016/2022. All experiments were carried out following the National Institutes of Health Guide for the Care and Use of Laboratory Animals (8th edition). The present study was reported in accordance with the ARRIVE 2·0 Essential 10 guidelines (https://arriveguidelines.org). Three-month-old C57BL/6 male mice (n 40) were obtained from the Multidisciplinary Center for Biological Research at the State University of Campinas, São Paulo, Brazil, and maintained in individual cages under a 12 h/12 h light-dark cycle, at a mean temperature of 21 ± 2°C and with free access to food and water. The sample size for each experimental group was determined based on a priori power analysis using G * Power software (version 3.1), considering an effect size (Cohen’s d) of 1·2 (large), a significance level (α) of 0·05 and a statistical power of 80 %. The analysis indicated that a minimum of ten animals per group would be sufficient to detect statistically significant differences among groups(Reference Charan and Kantharia38).
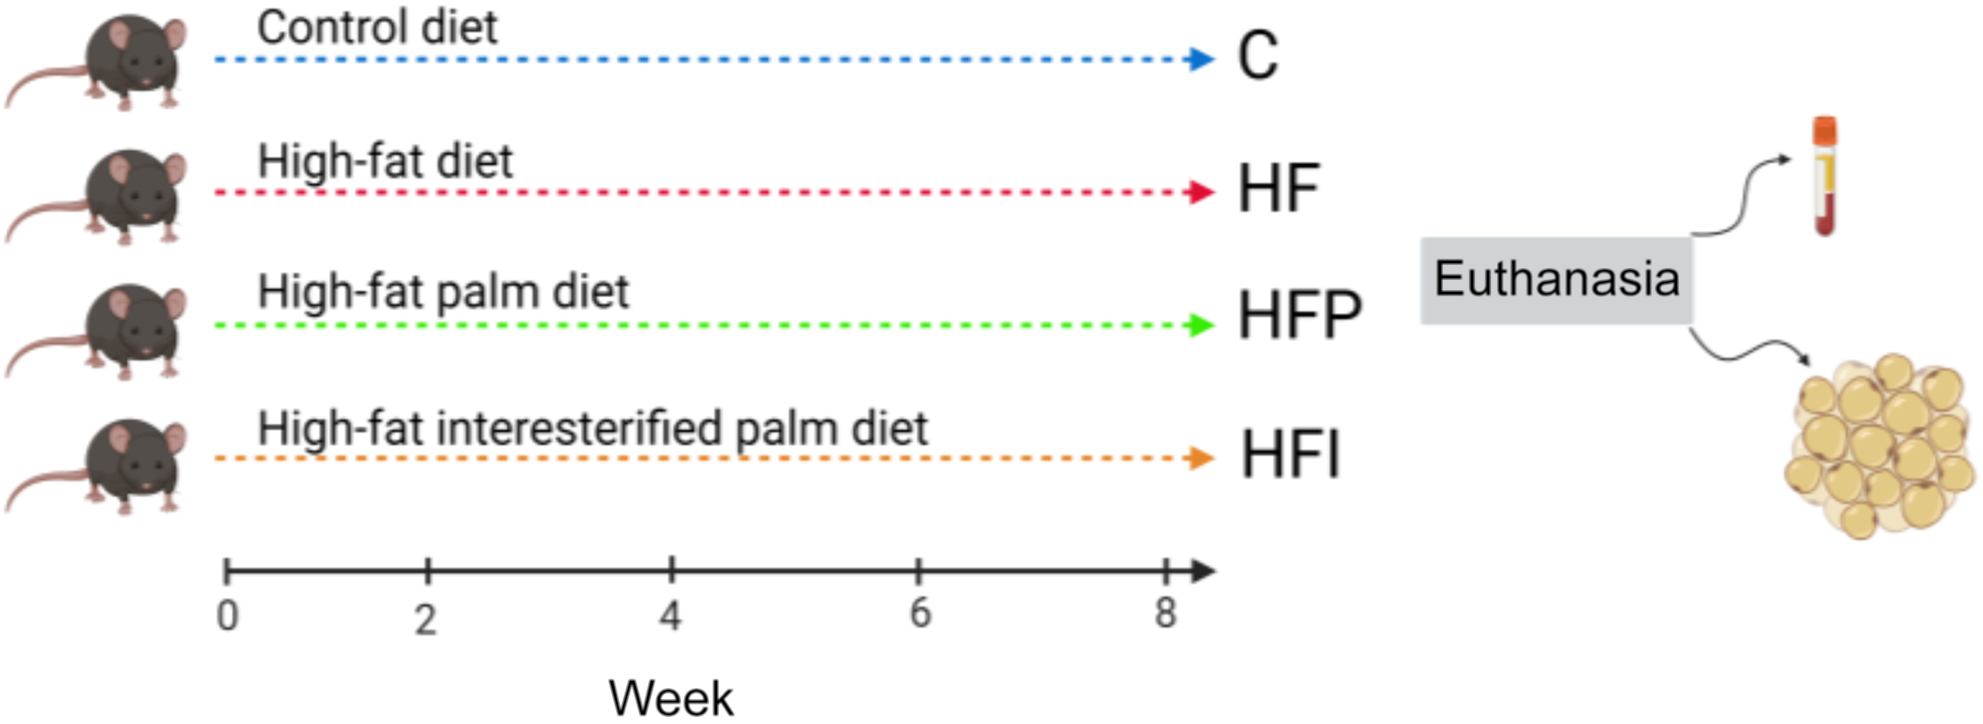
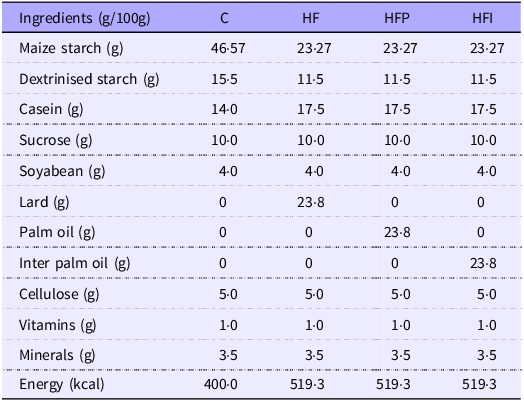
The animals were randomly divided into four groups (n 10/group), according to the primary source and total content of lipids of their experimental diet (Figure 1), given for 8 weeks: control (C, fed a standard AIN-93M diet, 7 % kcal from fat, using soyabean oil (SO)); high-fat (HF, fat mainly from lard); high-fat palm (HFP, fat mainly from PO); and high-fat interesterified palm group (HFI, fat primarily from interesterified palm group). Palm fat and interesterified palm fat were incorporated into the diets at a concentration of 23·8 % (w/w), preserving the SO content (4 % w/w) for essential fatty acid supply. This combination of fat sources resulted in approximately 50 % of total energy intake from lipids, a threshold commonly used to characterise high-fat diets in rodent models of metabolic dysfunction(Reference Buettner, Schölmerich and Bollheimer39,Reference Hariri and Thibault40) (Table 1). PragSoluções Biociências Com. e Serv. Ltda® manufactured the diets (Jau). The unmodified PO and IPO were donated by Agropalma® (Limeira). The IPO was produced using sodium methoxide as a catalyst through the conventional chemical process employed by the oil and fat industry(Reference Peixoto, Quitete and Teixeira41).
Experimental design of the study.

Ingredient composition and energy value of the experimental diets

C, control group; HF, high-fat diet group; HFP, high-fat palm diet group; HFI, high-fat interesterified diet group.
The experimental diets were prepared following recommendations of the American Institute of Nutrition (IN 93 M).
Food consumption, body mass, body composition and thermography
BM was assessed weekly on an analytical scale (Shimadzu UX 4200H). Food intake was monitored three times a week, on alternate days, and consumption was measured by subtracting the remaining amount of food from the supply. Energy intake was calculated as the product of food consumption and dietary energy density. NMR for small living animals was performed for the evaluation of total fat mass. For this, mice were scanned using the Whole-Body Composition Analyzer NMR equipment (Bruker’s Minispec LF90 TD-NMR). Infrared thermographic analysis was performed to assess surface temperature distribution as a non-invasive indicator of physiological or pathological changes. Thermal images were acquired using an infrared camera (FLIR Systems), with a thermal sensitivity of ±0·1°C and an accuracy of ±2 %. The subjects were acclimated to the room temperature (22–24°C) for at least 15 min before image acquisition to minimise the influence of external thermal variations(Reference Martins, Soares and Martins42).
Oral glucose tolerance test and intraperitoneal insulin tolerance test procedures
The oral glucose tolerance test (OGTT) and intraperitoneal insulin tolerance test (IITT) were conducted one week apart prior to euthanasia. For the OGTT, a 25 % glucose solution (1·0 g/kg) was administered via oral gavage after a 6-h fasting period(Reference Andrikopoulos, Blair and Deluca43), and blood glucose levels were measured using an Accu-Chek glucometer (Roche®) at 0 (baseline), 15, 30, 60 and 120 min post-administration(Reference Martins, Soares and Martins42). For the IITT, mice were fasted for 2 h, followed by an intraperitoneal injection of insulin (0·5 U/kg). Tail blood glucose levels were then measured at 0, 15, 30 and 60 min using an Accu-Chek Active® glucometer (Roche)(Reference Nagy and Einwallner44).
Euthanasia and tissue collection
At the end of the 8th week of dietary intervention, the animals were fasted overnight and subsequently euthanised with intraperitoneal thiopental anaesthetic (200 mg/kg). Blood samples were collected through cardiac puncture with heparinised needles, and the plasma was separated by centrifugation (180 g at 4°C/15 min), then stored at −80°C until analysis. Interscapular brown adipose tissue (iBAT), along with the white adipose tissue (WAT) depots (mesenteric, retroperitoneal, epididymal and subcutaneous), was carefully dissected and weighed using an analytical scale (Shimadzu (R) UX 4200H) and fixed in Millonig formalin (1·27 mol of formaldehyde in 0·1 M phosphate buffer, pH 7·2) for future histological sectioning or frozen at −80°C for molecular analysis.
Plasma biochemical analyses
Leptin (#900-K76K, Invitrogen), adiponectin (#KMP0041, Invitrogen), IL1-β (#88–7013–22, Invitrogen), IL-6 (#BMS603–2, Invitrogen) and TNF-α (#88–7324–88, Invitrogen) were measured using the ELISA test, following the manufacturer’s instructions.
Histological and stereological analyses of interscapular brown adipose tissue
Formalin-fixed iBAT tissues were included in Paraplast Plus (Sigma–Aldrich) and then sliced into 5-μm-thick sections. The slides were stained with haematoxylin–eosin, and digital images of random and non-consecutive microscopic fields were obtained using an Olympus BX51 microscope coupled to a camera (Infinity 15c, Lumenera Co.). Five animals per group with ten images per animal were analysed for stereology using Image-Pro Plus software (version 7.0 – Media Cybernetics). The QA [nuclei] was performed as previously described(Reference Rangel-Azevedo, Santana-Oliveira and Miranda45) to estimate the numerical density of nuclear profiles per area of iBAT tissue. Images were analysed using STEPanizer (www.stepanizer.com), and the number of nuclear profiles within the test area that did not touch the forbidden lines was counted and divided by the area in μm2 (Reference Tschanz, Burri and Weibel46).
Immunohistochemistry of uncoupling protein 1, vascular endothelial growth factor A, perilipin-A and F4/80 in interscapular brown adipose tissue
Sections of iBAT (5µm) were subjected to antigen retrieval (citrate buffer, pH 6·0 at 60°C for 20 min) and endogenous peroxidase blocking (0·3 % hydrogen peroxide) and incubated with primary antibody overnight (F4/80 monoclonal antibody, sc-377009, Santa Cruz Biotechnology, 1:125 dilution). Afterwards, the sections were incubated with a biotinylated secondary antibody conjugated to the streptavidin-peroxidase system (Universal LSAB+ kit, peroxidase, cat. no. K0679; DakoCytomation), revealed with diaminobenzidine (DAB substrate kit, Vector Labs SK-4100) and contrasted with haematoxylin. For immunodensity quantification, ImageJ software (National Institutes of Health) was used.
Alternatively, immunofluorescence was performed. After antigen retrieval and blocking of non-specific bindings (5 % bovine serum albumin, 2 % glycine), the sections were incubated with primary antibodies overnight (anti-UCP1, PA025554ESR2HU, Cusabio, 1:50 dilution; anti-PLIN-1, PA1-1051, Invitrogen, 1:50 dilution; anti-VEGF-A, MA5-32038, Invitrogen, 1:50 dilution). Afterwards, the sections were incubated with secondary antibodies conjugated to fluorophores (Alexa Fluor 488 and 546, Invitrogen, 1:100 dilution), counterstained with 4,6-diamidino-2-phenylindole, dihydrochloride (DAPI; Sigma-Aldrich), and slides were mounted on ProLong Gold Antifade (Invitrogen, Molecular Probes). Digital images were obtained using a fluorescence microscope (AMG, model EVOSfl; Advanced Microscopy Group, Inc.).
Quantitative RT-PCR
Total mRNA was extracted from the iBAT following the manufacturer’s instructions (Trizol, Sigma-Aldrich). The RNA concentration was determined by spectrometry using BioDropμLITE (BioDrop). The conversion of RNA into complementary DNA was performed using an RT enzyme kit (Applied Biosystems High-Capacity RNA-to-DNA Kit, Life Technologies). The primers used for the complementary DNA replication process were specific for each gene to be analysed (TaqMan Gene Expression Assay, Applied Biosystems). Quantitative PCR analysis was performed using a 7500 Fast Real-Time PCR System (Applied Biosystems), and the mRNA fold change was calculated using the 2(-Delta C(T)) method(Reference Livak and Schmittgen47). The expression of the following genes was evaluated: Il-6 (Mm00446190_m1), Tnf-α (Mm01717107_m1), Pparγ (Mm00440940_m1), Prdm16 (Mm00712556_m1), Pgc-1α (Mm01208835_m1), Ucp-1 (Mm01244861_m1), the β3ar (Mm02601819_g1), Atf4 (Mm00515325_g1), Ddit3/Chop (Mn01135937_g1) and Gadd45b (Mm00435123_m1).
Statistical analysis
The results were expressed as mean (sd). The data obtained were tested for normality of distribution and analysed by one-way ANOVA, followed by Tukey’s post hoc test. All analyses were performed using GraphPad Prism software version 10.2.3. Significant differences were considered when P < 0·05.
Results
Fatty acid composition of oils
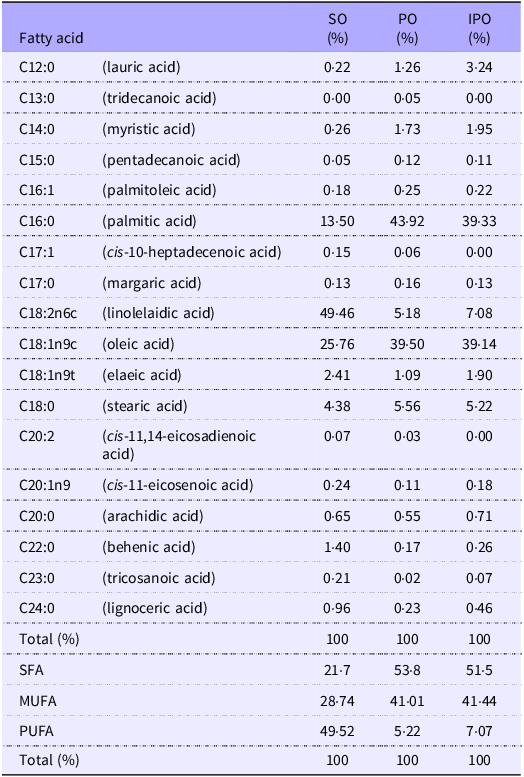
The fatty acid profiles of SO, PO and IPO differ significantly in terms of saturation levels and predominant fatty acids (Table 2). SO contains approximately 22 % SFA, while both PO and IPO exhibit markedly higher SFA content, approximately 52 % (Table 2). Regarding unsaturated fatty acids, PUFA are predominant in SO, accounting for 49 %, whereas MUFA are the main component in PO and IPO, representing about 41 %. While linoleic and oleic acids dominate in SO, the primary fatty acids in PO and IPO are palmitic and oleic acids (Table 2). Notably, the overall fatty acid composition of PO and IPO is quite similar, enabling targeted comparisons of their TAG structures without introducing compositional bias.
Characterisation of the fatty acid composition in soyabean oil (SO), palm oil (PO) and interesterified palm oil (IPO)

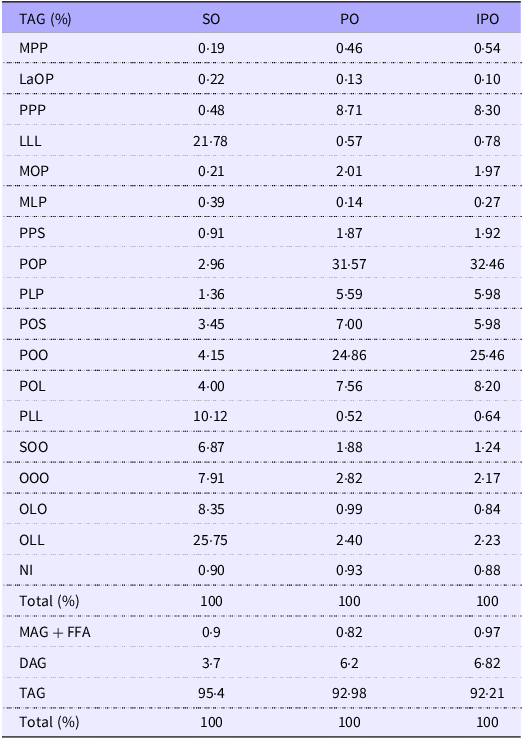
The TAG composition further differentiates these oils. SO is rich in Trilinolein (LLL) (21·78 %) and Oleoyl-dilinoleoyl-glycerol (OLL) (25·75 %), while PO and IPO predominantly contain Palmitoyl-oleoyl-palmitoyl-glycerol (POP) (31·57 and 32·46 %) and Palmitoyl-dioleoyl-glycerol (POO) (24·86 and 25·46 %), respectively. The content of diacylglycerols is higher in PO (6·2 %) and IPO (6·82 %) than in SO (3·7 %). Additionally, the combined content of monoacylglycerols and free fatty acids is slightly elevated in IPO (0·97 %) compared with SO (0·9 %) and PO (0·82 %) (Table 3).
Profile of TAG species and relative proportions of TAG, diacylglycerols, monoacylglycerols and free fatty acids in soyabean oil (SO), palm oil (PO) and interesterified palm oil (IPO)

La, lauric acid (C12:0); M, myristic acid (C14:0); P, palmitic acid (C16:0); S, stearic acid (C18:0); O, oleic acid (C18:1 n-9); L, linoleic acid (C18:2 n-6). TAG species: MPP, myristoyl-dipalmitoyl-glycerol; LaOP, lauroyl-oleoyl-palmitoyl-glycerol; PPP, tripalmitin; LLL, trilinolein; MOP, myristoyl-oleoyl-palmitoyl-glycerol; MLP, myristoyl-linoleoyl-palmitoyl-glycerol; PPS, dipalmitoyl-stearoyl-glycerol; POP, palmitoyl-oleoyl-palmitoyl-glycerol; PLP, palmitoyl-linoleoyl-palmitoyl-glycerol; POS, palmitoyl-oleoyl-stearoyl-glycerol; POO, palmitoyl-dioleoyl-glycerol; POL, palmitoyl-oleoyl-linoleoyl-glycerol; PLL, palmitoyl-dilinoleoyl-glycerol; SOO, stearoyl-dioleoyl-glycerol; OOO, triolein; OLO, oleoyl-linoleoyl-oleoyl-glycerol; OLL, oleoyl-dilinoleoyl-glycerol; NI, not identified.
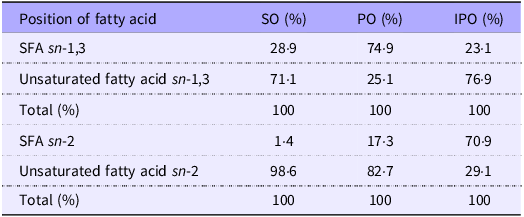
The regiospecific distribution of fatty acids across the TAG molecule shows distinct profiles at the sn-1,3 and sn-2 positions (Table 4). In SO, the sn-1,3 positions contain mainly unsaturated fatty acids (71·1 %), whereas PO predominantly incorporates SFA (74·9 %) at these positions. After the interesterification process, IPO presents a redistribution pattern closer to that of SO, with 76·9 % unsaturated and 23·1 % SFA at the sn-1,3 positions. However, at the sn-2 position, IPO exhibits a notable increase in SFA, reaching 70·9 %, illustrating the structural impact of interesterification on TAG architecture and its potential implications for both physical behaviour and nutritional functionality (Table 4).
Assessment of fatty acid distribution across the sn-1,3 and sn-2 positions within TAG molecules from soyabean oil (SO), palm oil (PO) and interesterified palm oil (IPO)

The consumption of palm oil and interesterified palm oil leads to greater body weight gain, increased fat depot accumulation and impaired glucose tolerance
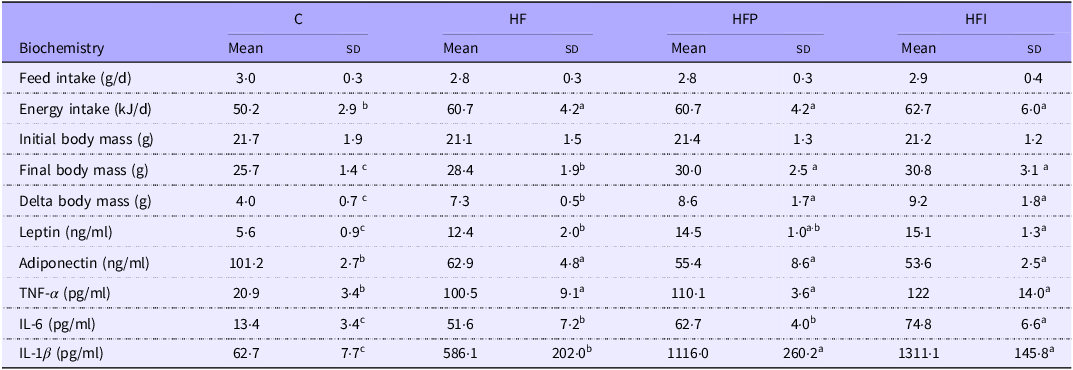
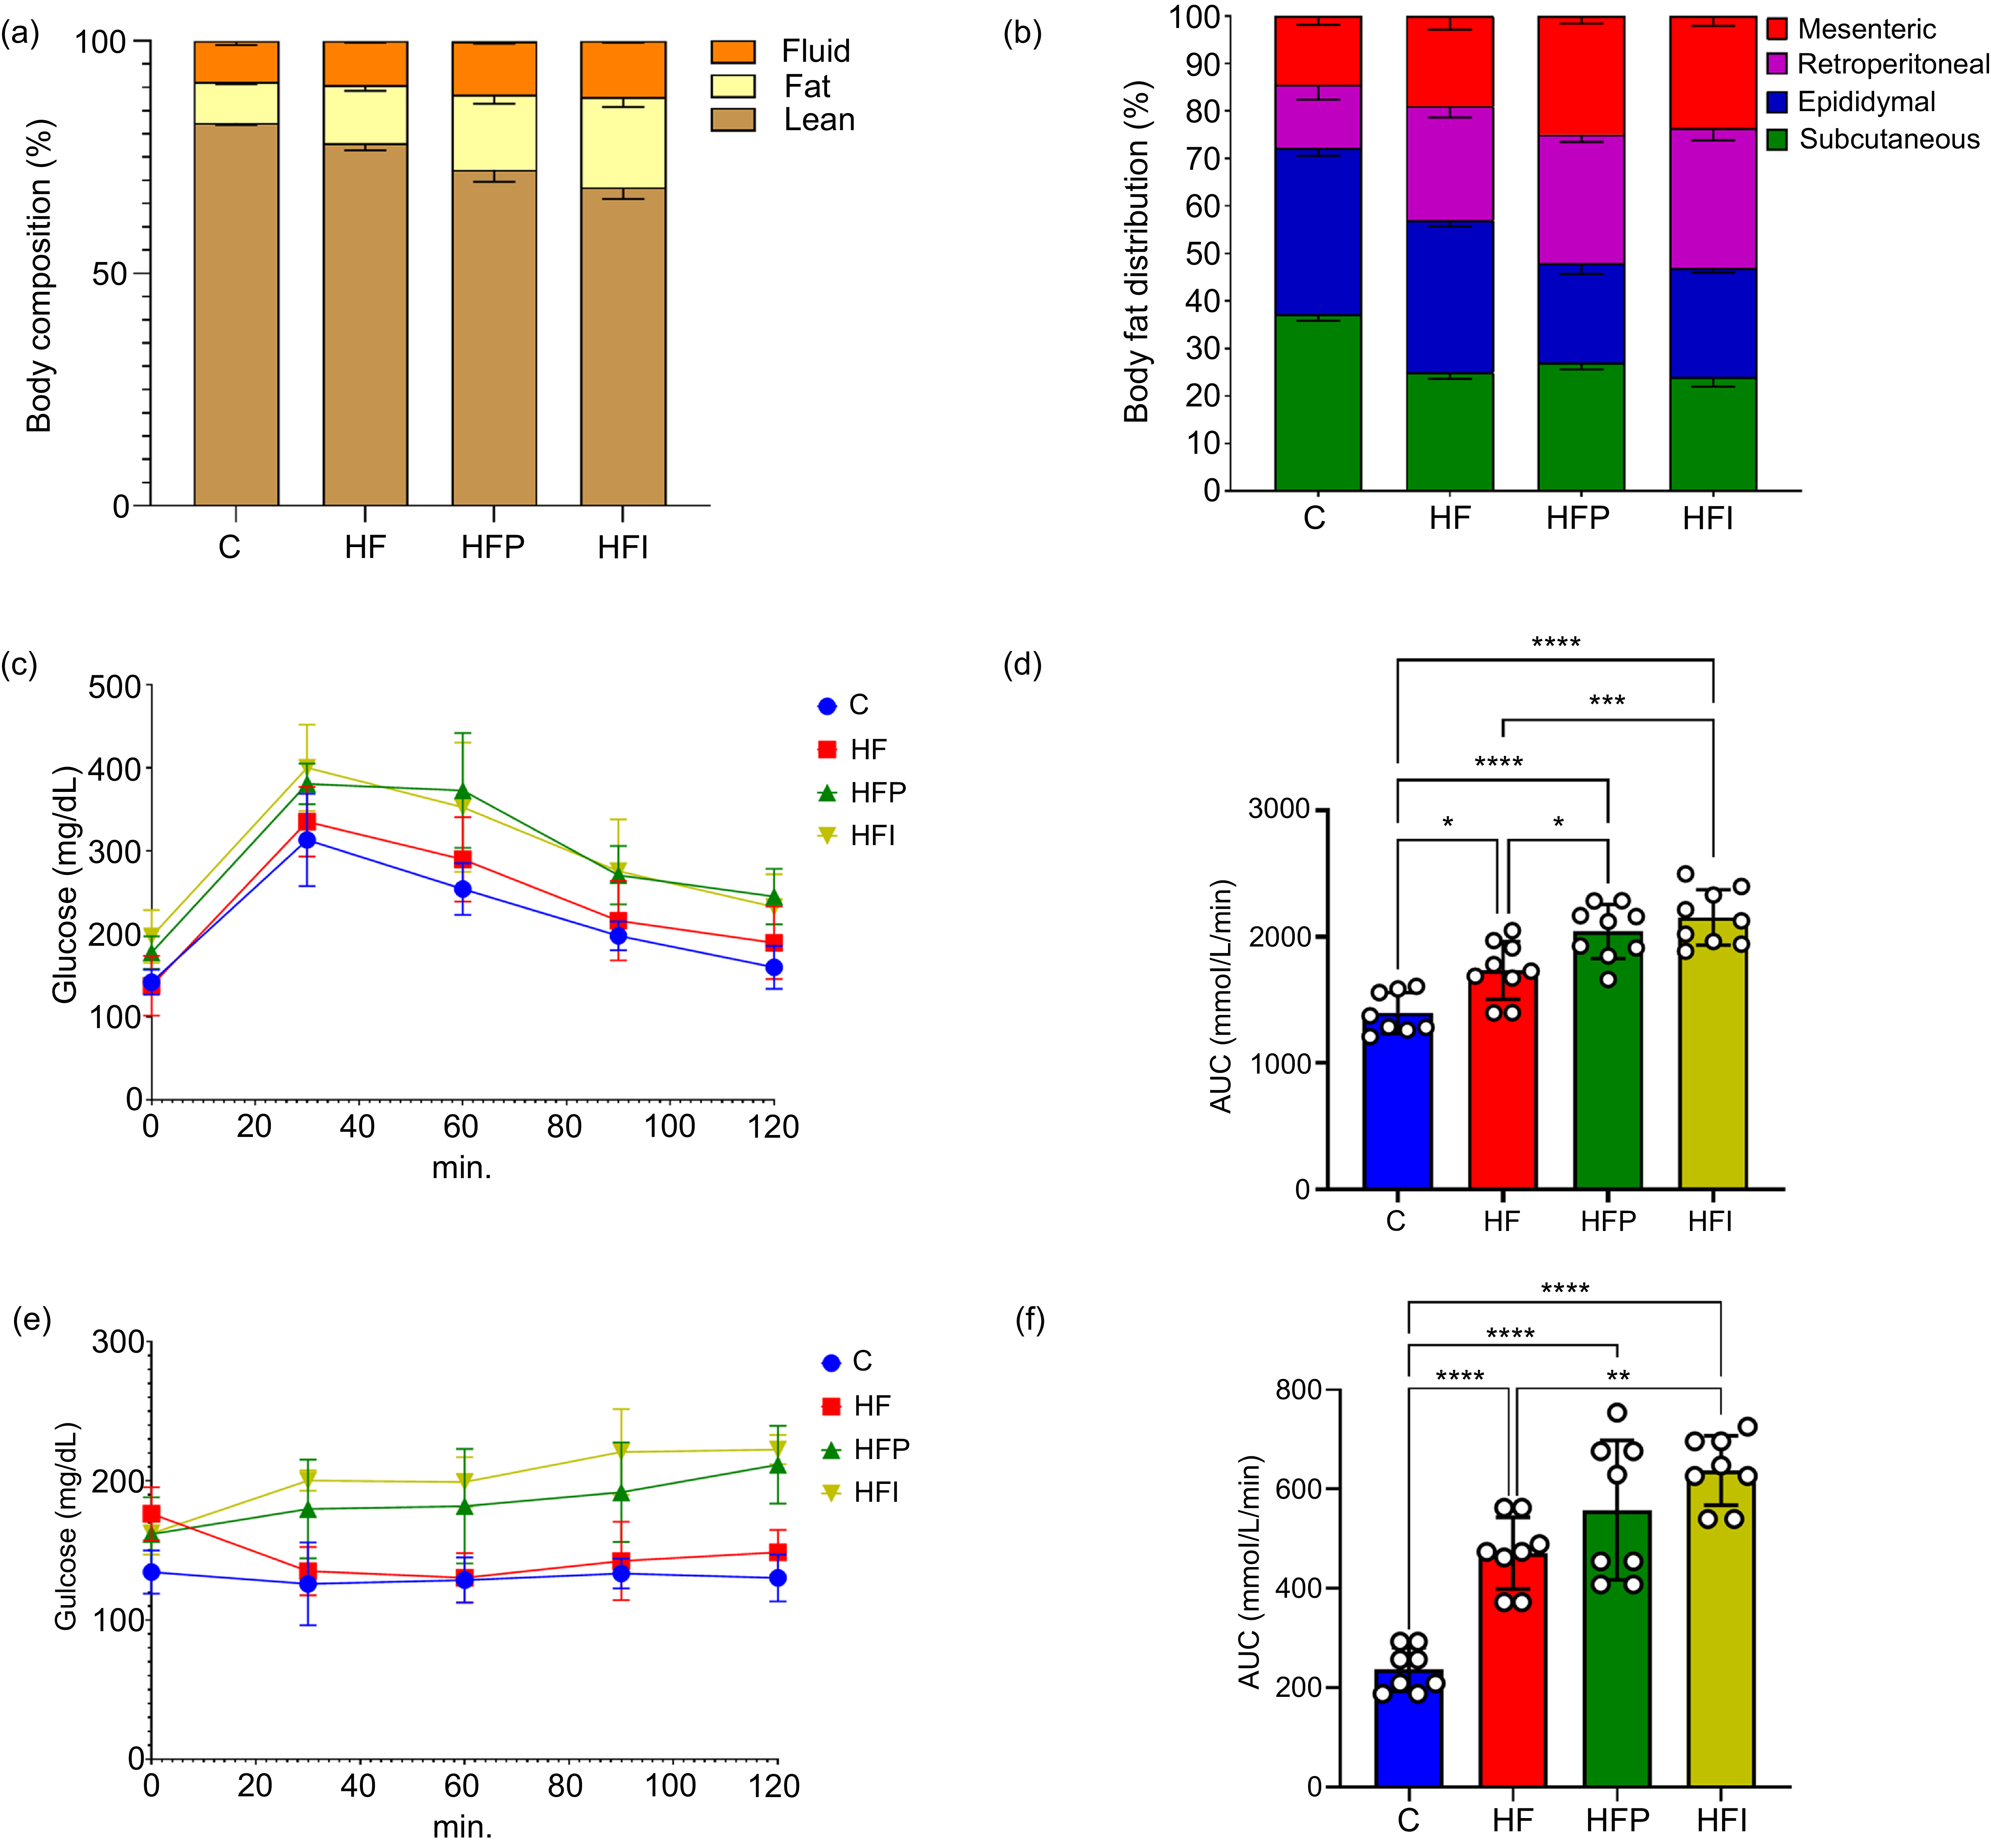
Animals began the experimental protocol with similar BM values among all groups (Table 5). At the end of the eighth week of the experiment, all experimental groups consumed the same average amount of diet in grams; however, the groups fed a high-fat diet exhibited higher energy intake (Table 5). Notably, the HFP and HFI groups showed a significantly greater increase in body weight compared with the HF group (+20 %, P < 0·001 and +26 %, P < 0·0001, respectively; Table 5), which was accompanied by an increase in total fat mass (+4 %, P < 0·001 and +7 %, P < 0·001, respectively; Figure 2(a)), at the expense of lean mass (–6 %, P < 0·001 and –10 %, P < 0·0001, respectively; Figure 2(a)).
Feed intake, body weight and biochemical parameters in mice under the experimental protocol

C, control; HF, high-fat diet; HFP, high-fat diet with palm oil; HFI, high-fat diet with interesterified palm oil.
One-way ANOVA followed by Tukey’s post hoc test (mean (sd), n 10). Different letters indicate a significant difference between the groups (P < 0·05).
Palm oil and interesterified palm oil consumption increases body weight and fat accumulation and impairs glucose tolerance. (a) Body composition; (b) fat distribution; (c) oral TAG tolerance test (TOTG); (d) AUC of TOTG; (e) intraperitoneal insulin tolerance test (IITT); (f) AUC of IITT. Data are presented as mean (sd), n 10. One-way ANOVA followed by Tukey’s post hoc test. Different letters indicate statistically significant differences between groups (P < 0·05). C, control; HF, high-fat diet; HFP, high-fat diet with palm oil; HFI, high-fat diet with interesterified palm oil.

All groups fed a high-fat diet exhibited a reduction in the subcutaneous adipose tissue compartment compared with the control group (HF, –31·4 %, P < 0·001; HFP, –29·8 %, P < 0·001; HFI, –32·1 %, P < 0·001; Figure 2(b)). Conversely, the HFP and HFI groups showed a reduction in epididymal fat compartment compared with the HF group (–34 %, P < 0·001; –31·8 %, P < 0·05, respectively; Figure 2(b)). In contrast, the retroperitoneal and mesenteric fat compartments increased in the HFP group (+12·5 %, P < 0·001 and +31 %, P < 0·001, respectively) and the HFI group (+22·5 %, P < 0·001 and +24 %, P < 0·001, respectively) compared with the HF group (Figure 2(b)).
To assess glucose metabolism, which is influenced by increased adiposity, both OGTT and IITT were performed. In the OGTT, the HFP and HFI groups exhibited elevated glucose levels at all time points, along with a higher glycaemic peak (Figure 2(c)). Moreover, the glycaemic curves for these groups did not return to baseline (time zero) values (Figure 2(c)). The AUC for the HFP and HFI groups was significantly higher than that of the HF group (+23 %, P < 0·001; +26, P < 0·001, respectively) and was similar between the two groups (Figure 2(d)). In the IITT, the HFP and HFI groups showed higher glucose levels at all analysed time points (Figure 2(e)). The HFI group had an increased AUC than HF (+15 %, P < 0·01) and HFP (+ 26 %, P < 0·001). Additionally, HFP was significantly higher than the HF group (+16 %, P < 0·05) (Figure 2(f)).
Adipokine profile and inflammatory response in high-fat diet groups
Serum leptin levels were significantly higher in the HFI group compared with the HF group (+22 %, P < 0·05), with the HFP group displaying intermediate levels. Plasma adiponectin levels remained consistent across all high-fat diet groups. The observed changes in BM and adiposity suggest a shift in the adipose tissue hormonal profile towards a more pro-inflammatory state, prompting an assessment of inflammatory markers. Plasma TNF-α concentrations were comparable among all high-fat diet groups but were significantly higher than those in the control group (C). Regarding serum IL-6, the HFI group exhibited significantly higher levels than both the HFP (+19 %, P < 0·05) and HF (+45 %, P < 0·05) groups, which were similar. IL-1β concentrations were elevated in both the HFP and HFI groups compared with the HF group (+123 %, P < 0·05) (Table 5).
Consumption of palm oil and interesterified palm oil increases lipid infiltration and reduces vascularisation in interscapular brown adipose tissue
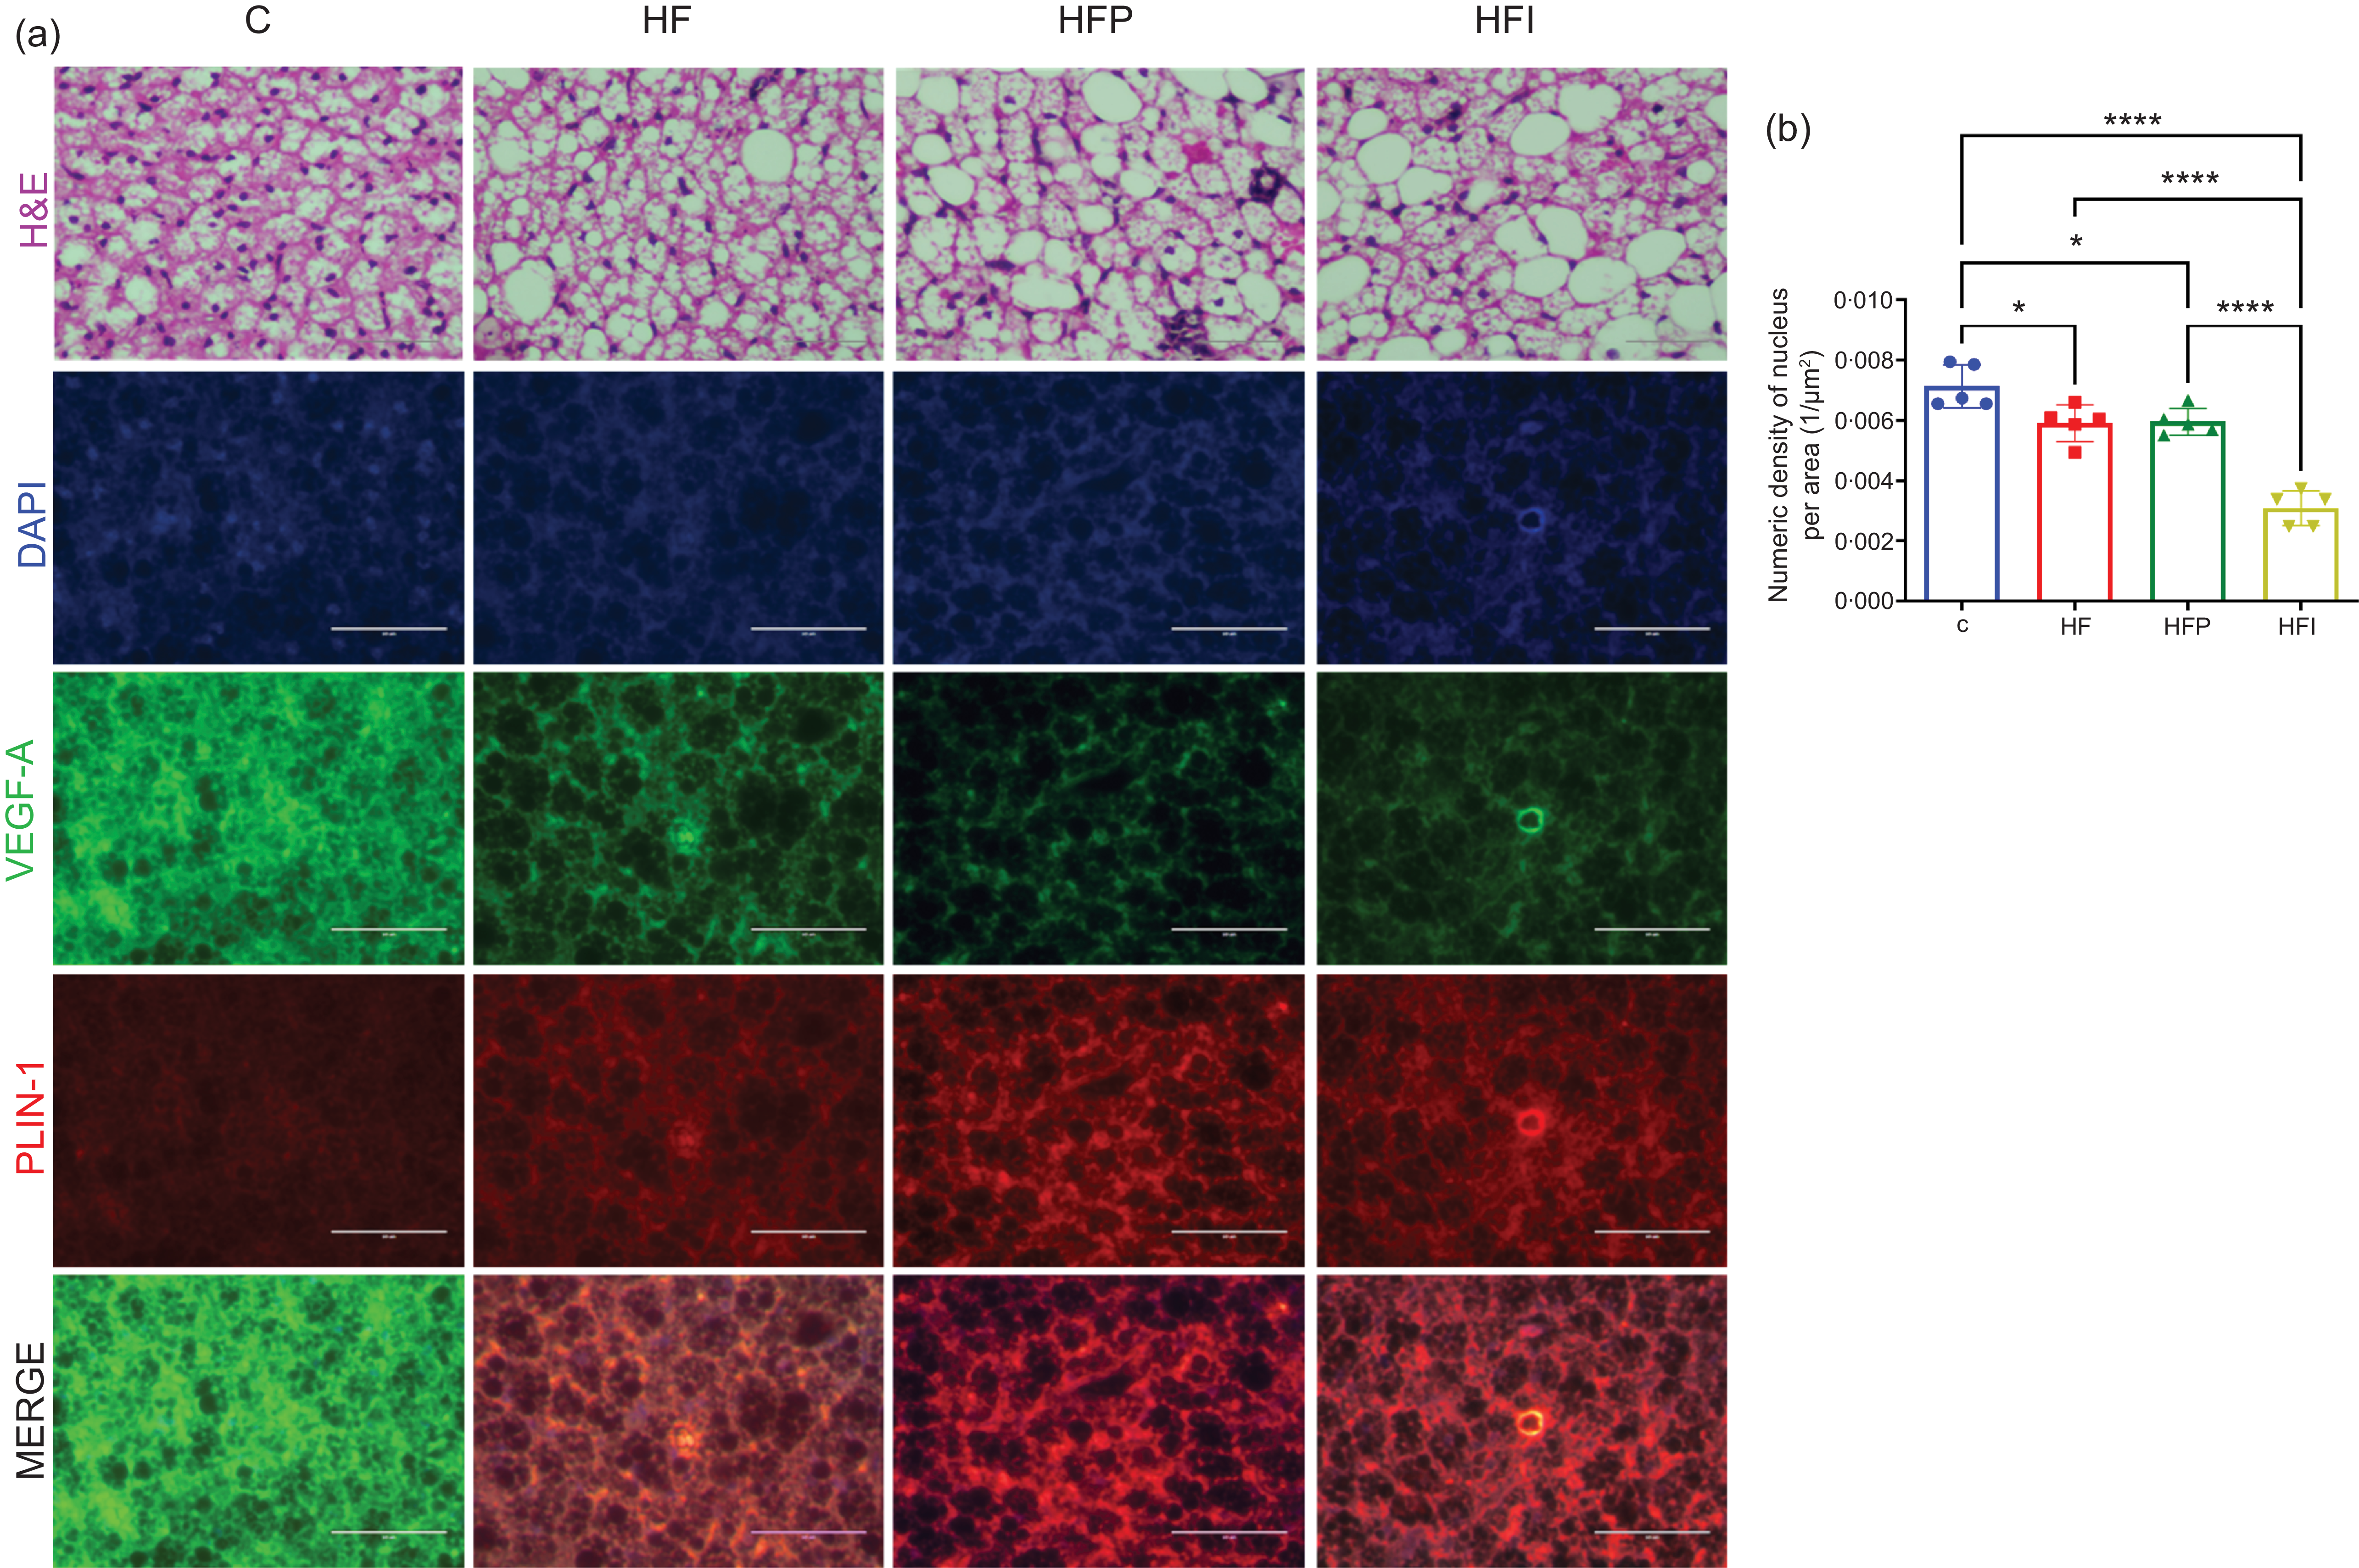
To evaluate the effects of PO and IPO consumption on the morphofunctionality of iBAT, morphological, stereological and protein expression analyses were performed. In the control group (C), iBAT exhibited the typical multilocular structure of brown adipocytes, which was absent in the HF, HFP and HFI groups (Figure 3(a)). The iBAT in these high-fat diet groups displayed altered cytoarchitecture, shifting from multilocular to unilocular fat storage, indicative of the whitening process. This change increased the separation between adipocyte nuclei, leading to a reduction in the QA value (Figure 3(b)). The HFI group had significantly lower QA values compared with the HF and HFP groups (+27 and +26 %, respectively, P < 0·0001) (Figure 3(b)), while the latter two groups showed similar QA values (Figure 3(b)).
Interesterified palm oil increases lipid infiltration in interscapular brown adipose tissue. (a) Representative images of iBAT morphology, DAPI staining, vascular endothelial growth factor A (VEGF-A) and PLIN-1 immunofluorescence and merged images (MERGE); (b) nuclear density per unit area. Data are expressed as mean (sd), n 10. One-way ANOVA followed by Tukey’s post hoc test. Different letters indicate statistically significant differences between groups (P < 0·05). iBAT, interscapular brown adipose tissue; C, control; HF, high-fat diet; HFP, high-fat diet with palm oil; HFI, high-fat diet with interesterified palm oil.

Immunohistochemistry staining was conducted to assess vascularisation markers (vascular endothelial growth factor A (VEGF-A)) and a whitening marker (perilipin-1). VEGF-A expression was reduced in all high-fat diet groups compared with the control group, likely due to lipid infiltration and iBAT hypertrophy, whereas perilipin-1 levels were elevated in these groups (Figure 3(a)).
Palm and interesterified palm oil high-fat diet-induced whitening of brown adipose tissue impairs thermogenesis
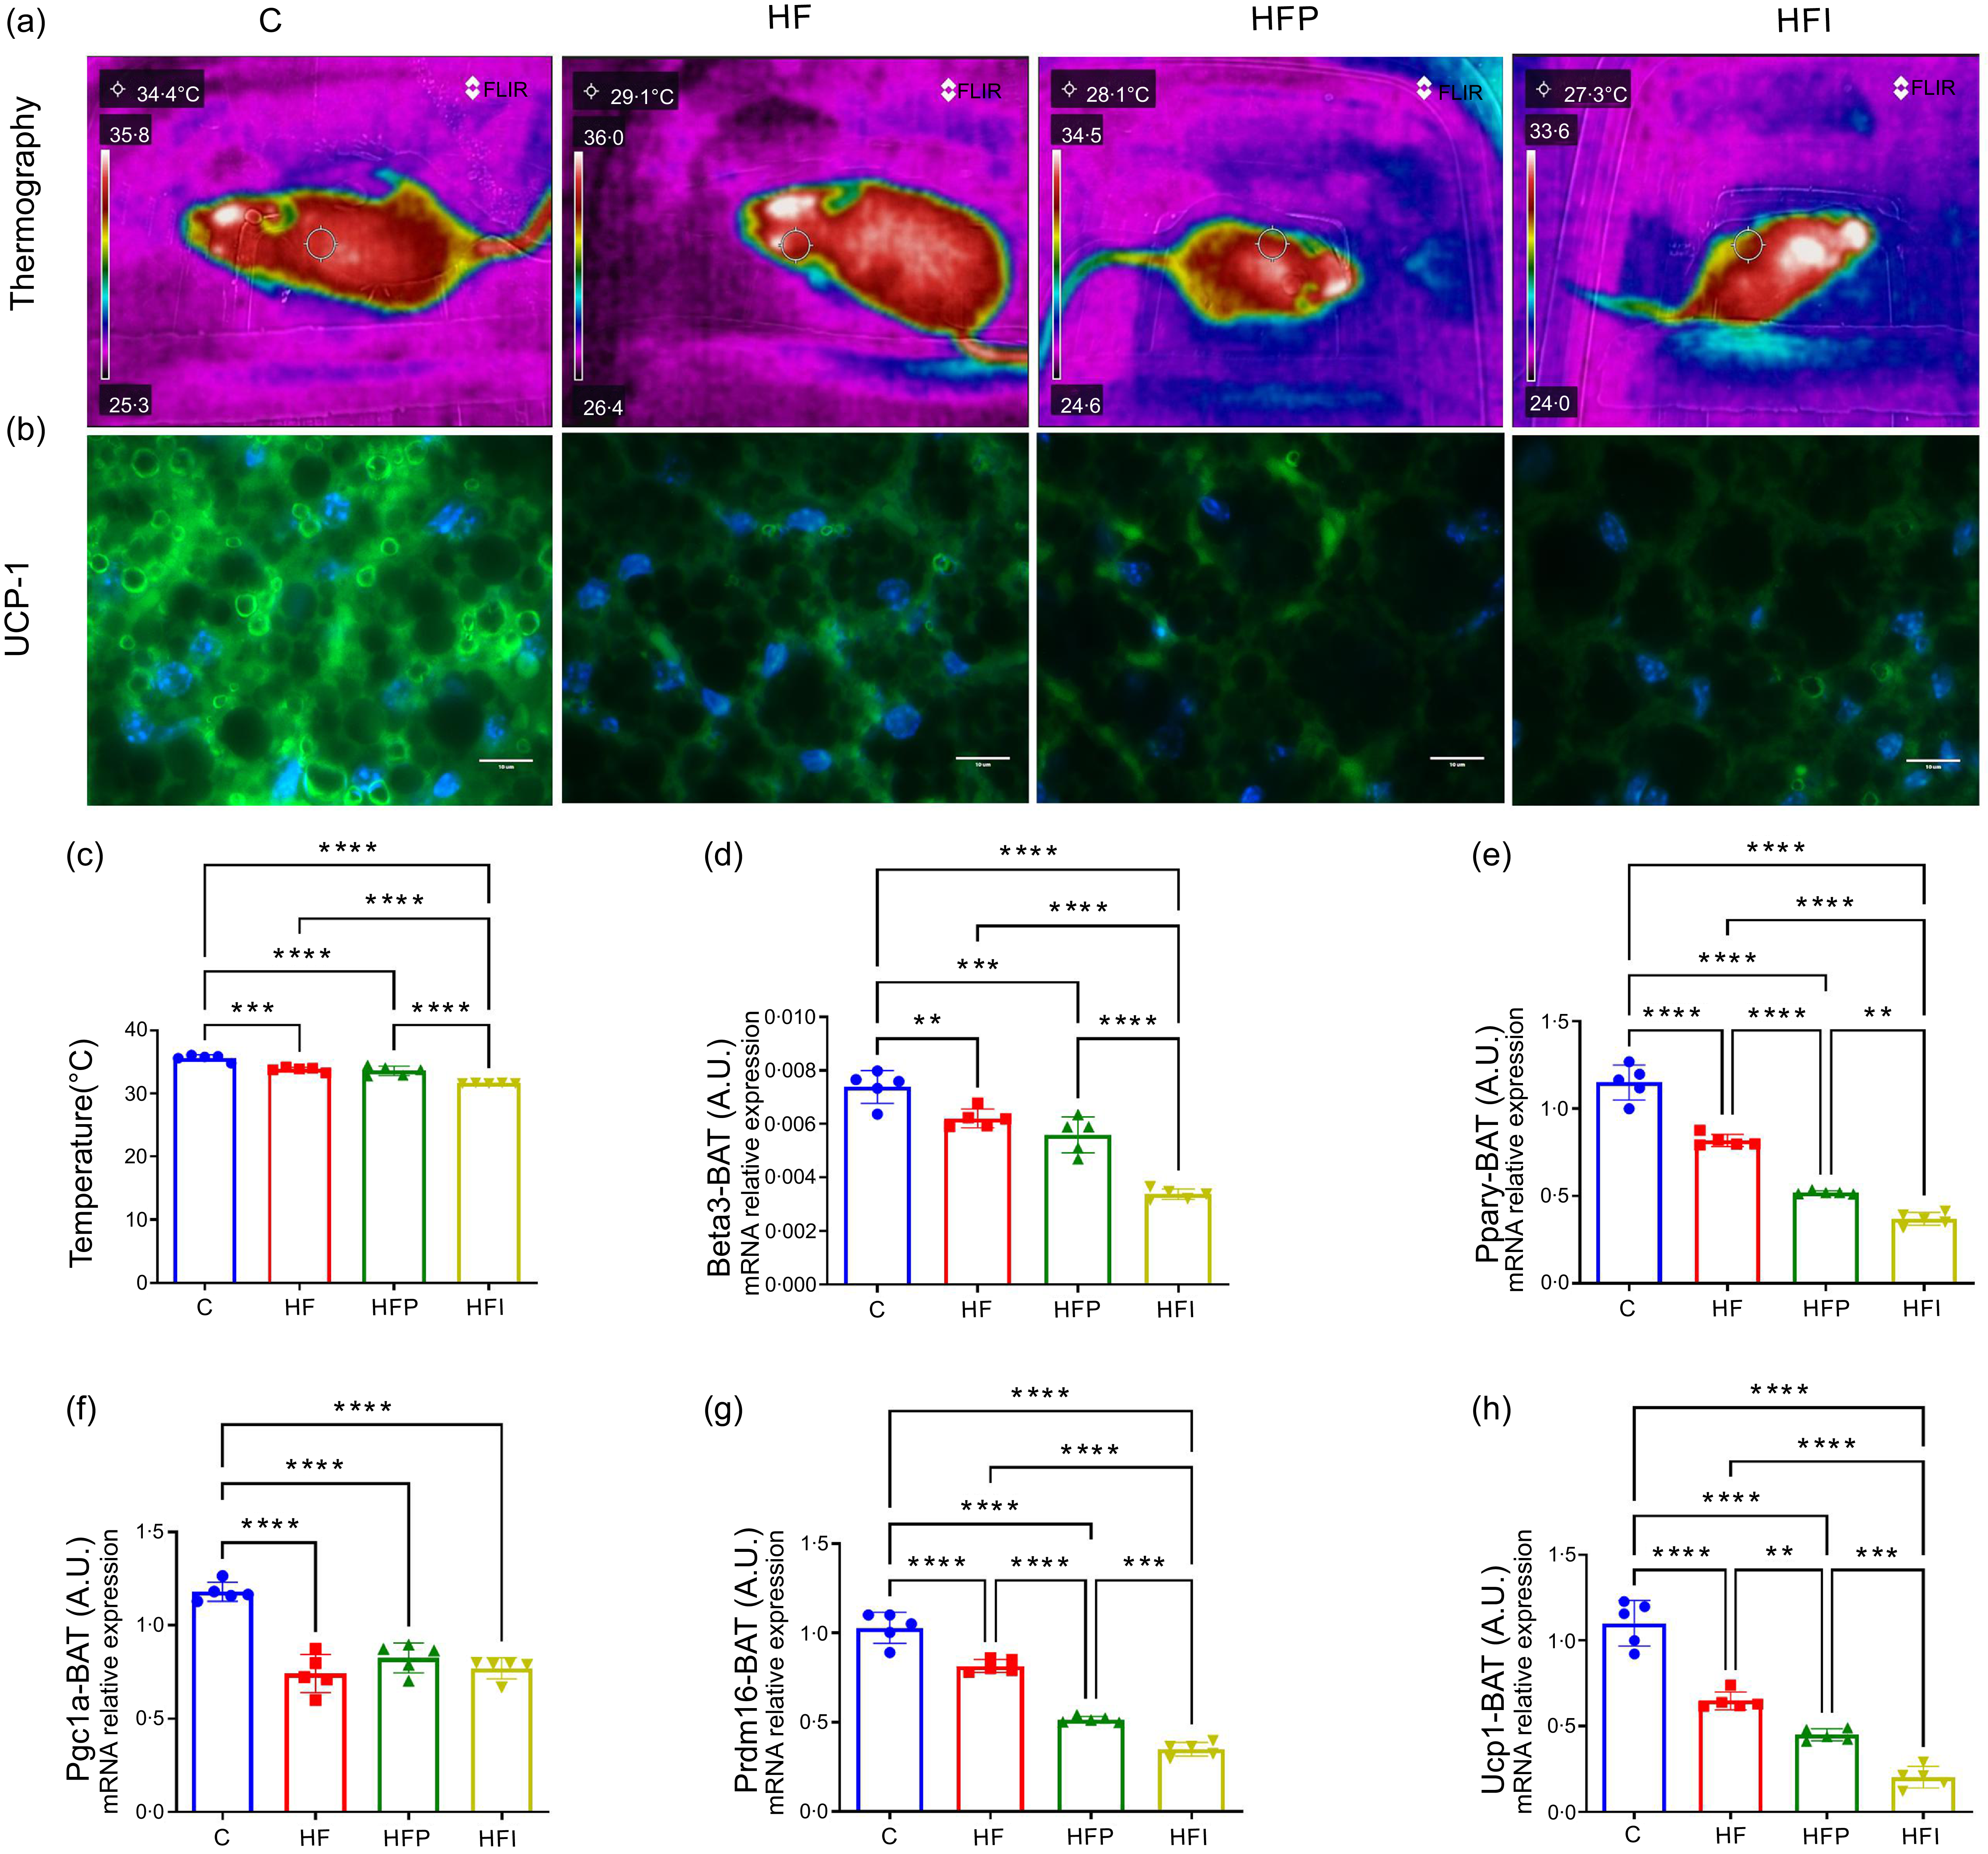
The whitening of iBAT reduces its capacity for non-shivering adaptive thermogenesis, resulting in lower body temperatures in high-fat diet-fed mice, with the HFI group exhibiting the lowest values (–3 % v. HFP and −6 % v. HF, P < 0·05; Figs. 4(a) and (c)). UCP1, a key thermogenic protein that dissipates energy as heat and enhances energy expenditure, displayed similarly reduced immunodensity across all high-fat diet groups (Figure 4(b)). The regulation of thermogenesis and maintenance of the brown adipocyte phenotype is mediated by other genes, which were also assessed.
Thermographic analysis and expression of thermogenic genes in interscapular brown adipose tissue (iBAT). (a) Representative thermographic images; (b) Ucp1 immunofluorescence in iBAT; (c) body surface temperature; (d)–(h) mRNA expression of thermogenic markers: (d) β3-adrenergic receptor (β3ar), (e) PPARγ (Pparg), (f) Pparg coactivator-1α (Pgc1a), (g) PR domain containing 16 (Prdm16) and (h) uncoupling protein 1 (Ucp1). Data are shown as mean (sem). Different letters indicate statistically significant differences between groups (P < 0·05). C, control; HF, high-fat diet; HFP, high-fat diet with palm oil; HFI, high-fat diet with interesterified palm oil.

The gene expression levels of the β3ar (Figure 4(d)) in the HFI group were reduced by 0·5-fold (P < 0·05) and 0·3-fold (P < 0·05) compared with the HF and HFP groups, respectively. Additionally, the expression of Pparg (Figure 4(e)) was drastically downregulated in the HFI group compared with the HF (1·8-fold, P < 0·05) and HFP (1·5-fold, P < 0·05) groups. The expression of Pgc1α (Figure 4(f)) was similarly downregulated among all high-fat diet groups compared with the control, but Prdm16 mRNA expression was significantly downregulated in the HFI group compared with the HF and HFP groups (–1·8-fold, P < 0·0001 and −1·5-fold, P < 0·001, respectively) (Figure 4(g)). Regarding the master thermogenic gene expression, Ucp1 mRNA levels (Figure 4(h)) were significantly downregulated in all high-fat diet groups, with a pronounced reduction observed in the HFP (-1·35-fold, P < 0·05) and HFI (–2·5-fold, P < 0·001) groups compared with the HF group. These results indicate that high-fat diets, particularly those containing PO and IPO, markedly suppress Ucp1 expression in iBAT, potentially contributing to impaired thermogenesis and promoting the whitening phenotype.
Palm oil and interesterified palm oil aggravate inflammation and endoplasmic reticulum stress in brown adipose tissue
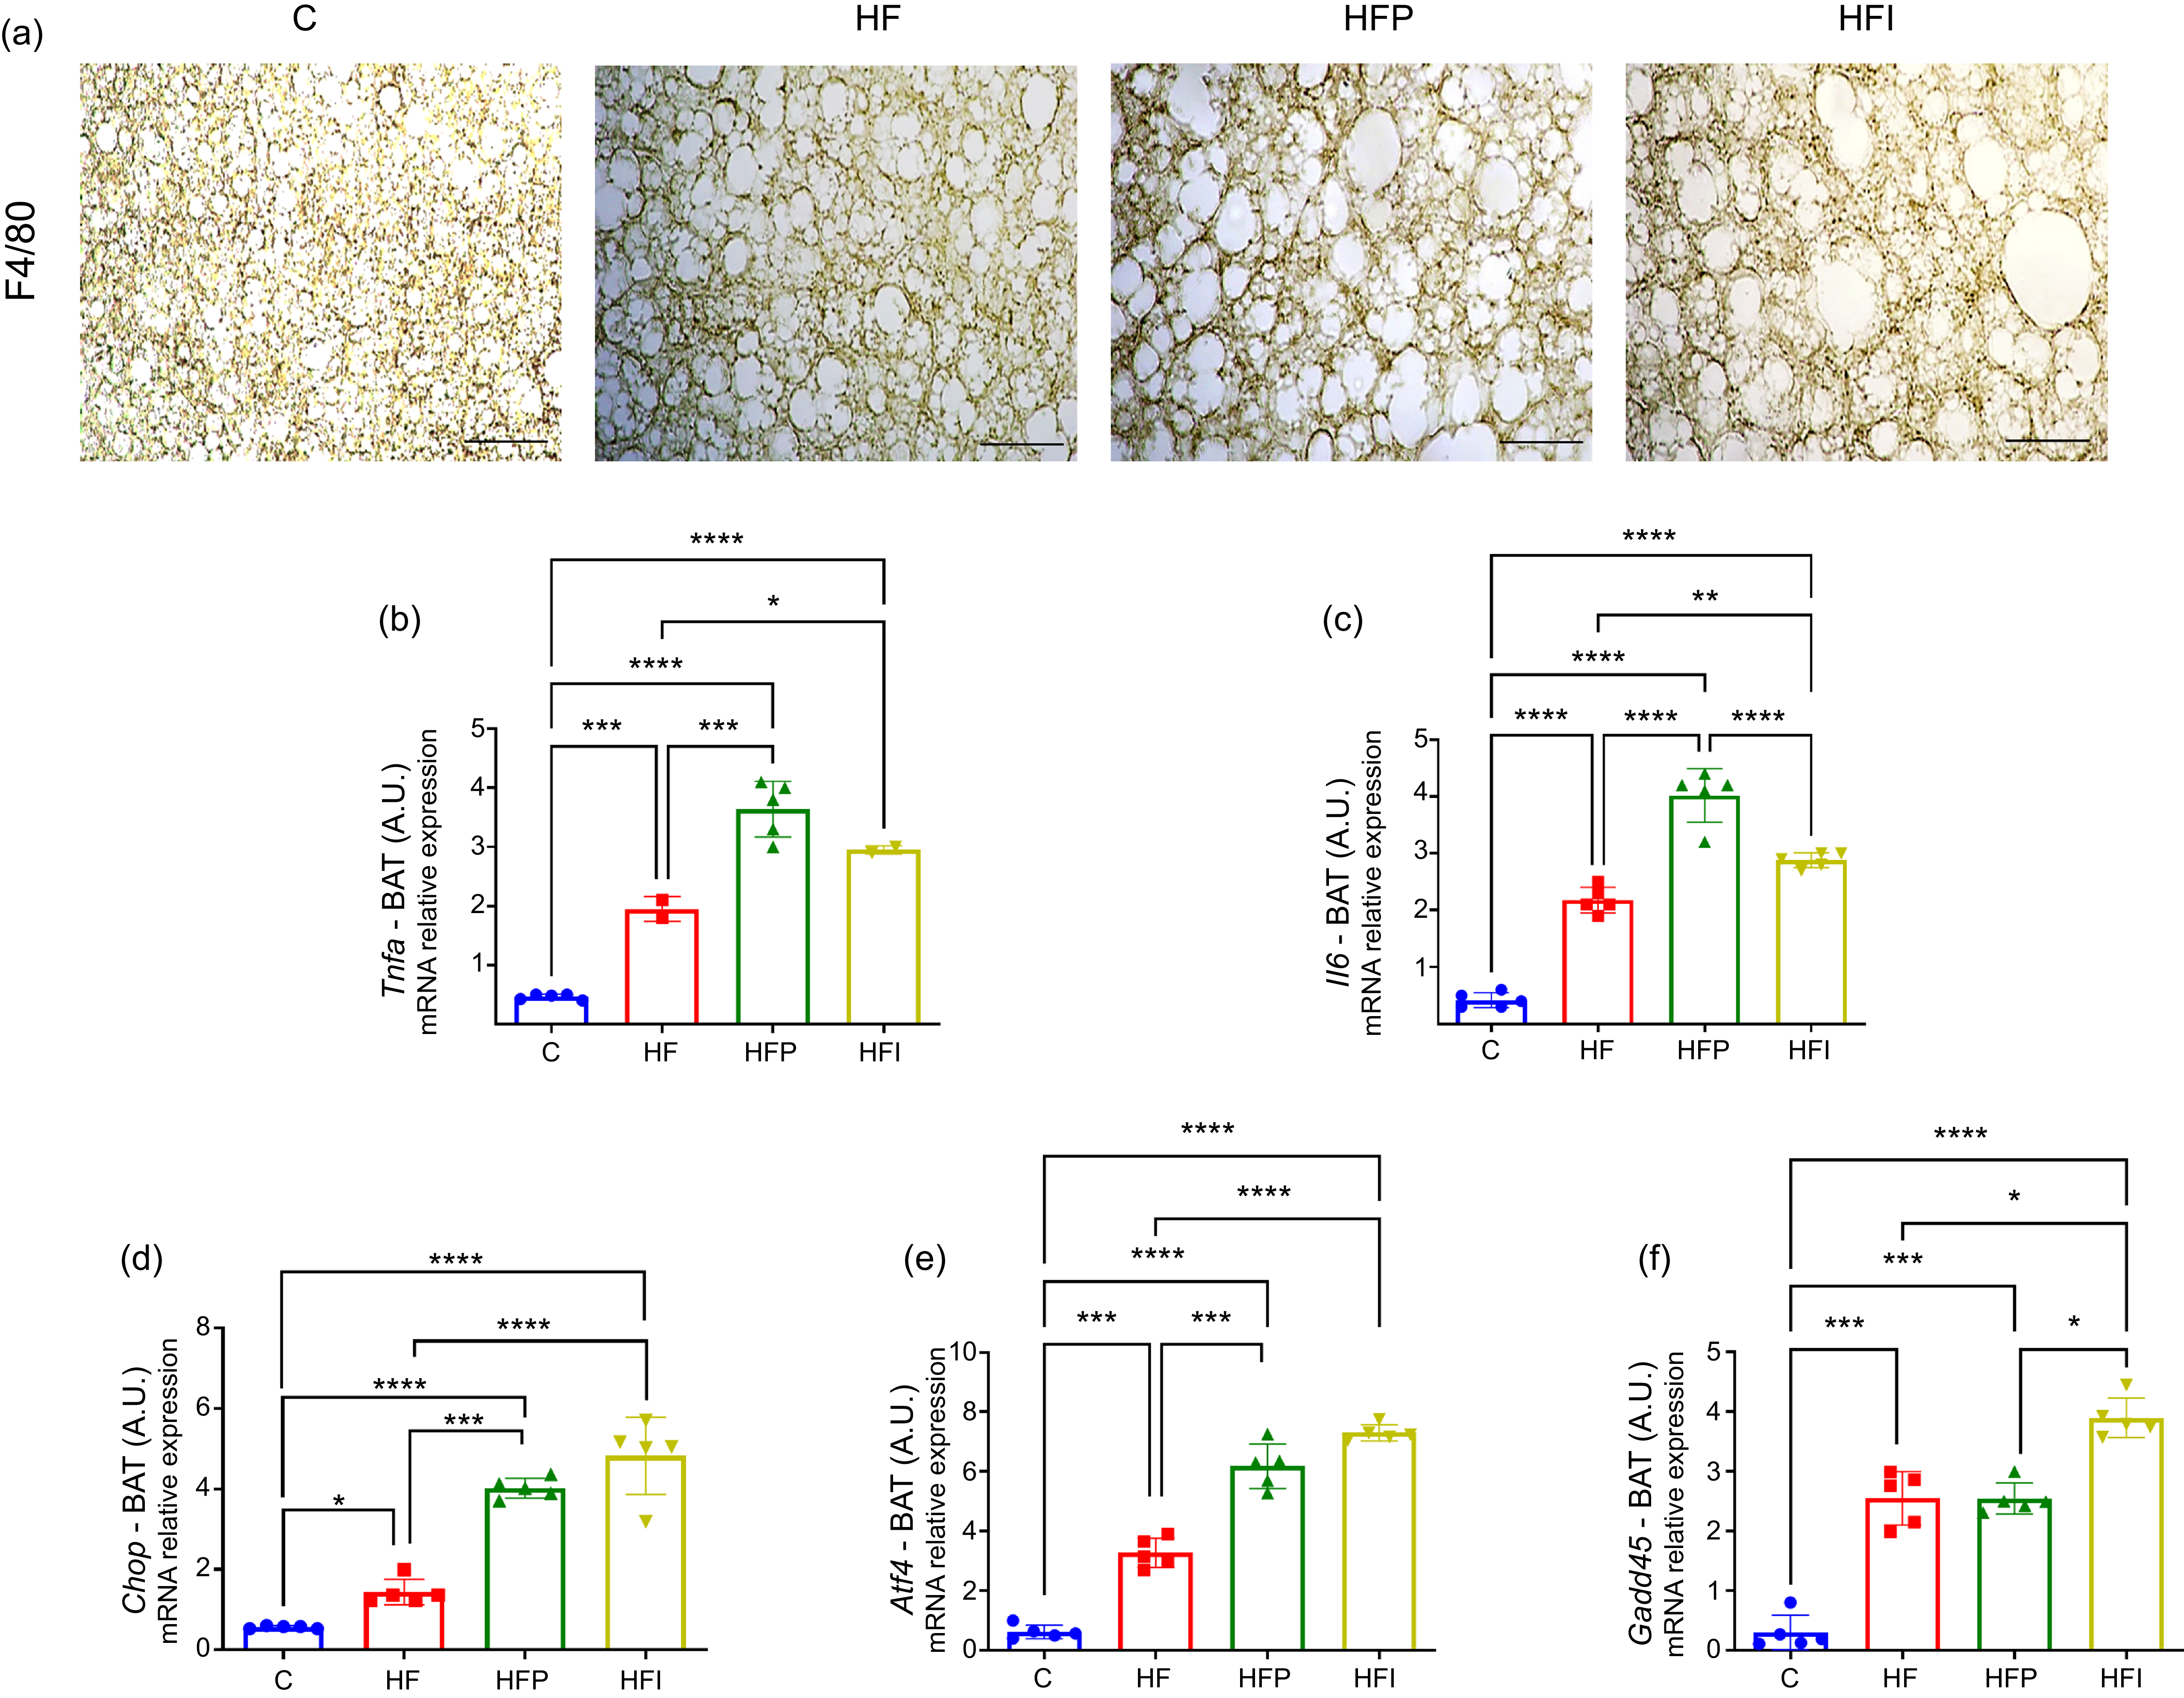
To evaluate inflammation in the iBAT microenvironment, immunohistochemistry staining for F4/80, a macrophage marker, was performed (Figure 5(a)). The immunodensity was more pronounced in the HFI group, indicating a significant inflammatory infiltrate (+23 % v. HFP and +26 % HF, P < 0·05) (Figure 5(b)). Additionally, the expression of Tnfα and Il6 was evaluated in iBAT. Tnfα expression was significantly upregulated in both the HFP (+0·69-fold, P < 0·05) and HFI (+0·87-fold, P < 0·05) groups compared with the HF group (Figure 5(c)). Similarly, Il6 expression was elevated in the HFP (+0·46-fold, P < 0·05) and markedly increased in the HFI group (+2·2-fold, P < 0·001) relative to HF. Notably, Il6 mRNA levels were significantly higher in HFI compared with HF (+0·43-fold, P < 0·05; Figure 5(d)). Given the established link between endoplasmic reticulum (ER) stress, inflammation and adipose tissue whitening, we further assessed the expression of ER stress-related genes. Chop expression was significantly elevated in the HFI group compared with both HF (+3-fold, P < 0·001) and HFP (+0·4-fold, P < 0·05; Figure 5(e)). A similar trend was observed for Atf4, which was upregulated in HFI compared with HF (+2·8-fold, P < 0·001) and HFP (+1·3-fold, P < 0·05; Figure 5(f)). Additionally, Gadd45 expression was highest in the HFI group, with significant increases relative to HFP (+1·8-fold, P < 0·001) and HF (+1·4-fold, P < 0·001), both of which showed comparable expression levels (Figure 5(g)). Collectively, these findings suggest that dietary intake of PO and, more notably, IPO exacerbates inflammation and ER stress in iBAT.
Palm oil and interesterified palm oil induce inflammation and endoplasmic reticulum stress in interscapular brown adipose tissue. (a) F4/80 immunohistochemical staining; (b) quantification of F4/80-positive cells; (c)–(g) mRNA expression of pro-inflammatory and ER stress markers: (c) Tnfa, (d) IL-6, (e) C/EBP homologous protein (Chop), (f) activating transcription factor 4 (Atf4) and (g) growth arrest and DNA damage-inducible α (Gadd45). Data are presented as mean (sd), n 10. One-way ANOVA followed by Tukey’s post hoc test. Different letters indicate statistically significant differences between groups (P < 0·05). C, control; HF, high-fat diet; HFP, high-fat diet with palm oil; HFI, high-fat diet with interesterified palm oil.

Discussion
The role of dietary fat quality in metabolic health is increasingly recognised, with compelling evidence highlighting its impact on chronic disease risk. While excessive fat consumption is strongly linked to obesity and associated co-morbidities, the type and structural properties of dietary fats may play an equally critical role(Reference Martins, Da Silva Ribeiro and Teixeira31). In this study, we investigated the metabolic consequences of consuming unmodified and interesterified PO within the context of a high-fat diet. Our findings provide relevant insights into the deleterious effects of these fats on metabolic homeostasis and brown adipose tissue (BAT) whitening.
The study revealed that the consumption of both unmodified and interesterified PO was associated with significant BM gain and reduced lean mass. Negative effects are not only due to increased BM but also due to a redistribution of adipose tissue compartments that are associated with adverse metabolic outcomes, including insulin resistance, systemic inflammation and alteration. Marked reduction in subcutaneous white adipose tissue, while other fat depots — such as retroperitoneal and visceral adipose tissue – showed an increase. Moreover, histological analyses of BAT demonstrated lipid infiltration and increased adipocyte size, indicative of a phenotypic shift from brown to white-like adipocytes, a process known as ‘whitening’(Reference Carpentier, Blondin and Virtanen48). These changes were coupled with a significant reduction in nuclear density within BAT, reflecting cellular hypertrophy and reduced thermogenic activity(Reference Martins, Soares and Martins42).
It has already been described that BAT has the ability to uncouple the electron transport chain from ATP production(Reference Montanari, Pošćić and Colitti15,Reference Scheele and Wolfrum49) . However, structural and/or molecular changes in BAT can disrupt activation cascades, resulting in BAT functional impairment(Reference Ziqubu, Dludla and Mthembu50,Reference Lopez-Vicchi, De Winne and Ornstein51) . Lower nuclear density of adipocytes in the BAT was observed across all groups fed a high-fat diet. This finding reflects alterations in the cellular structure of the tissue, possibly associated with adipocyte hypertrophy in the groups consuming high-fat diets, with a more pronounced impact in the HFI group. Micrographs obtained from haematoxylin–eosin staining and immunolabelling for VEGF-A and Plin-1 provide a visual representation of the observed changes. Haematoxylin–eosin staining reveals notable differences in cell organisation and size across the groups. In the HFP and HFI groups, there is greater tissue disorganisation and increased adipocyte size, supporting the hypothesis of hypertrophy. Immunolabelling for VEGF-A, a marker associated with angiogenesis, suggests reduced vascularisation in the HF and HFI groups, indicating potential impairment in the supply of nutrients and oxygen to the hypertrophied tissue. Conversely, the expression of Plin-1, a marker of lipolysis, reveals alterations consistent with lipid metabolism dysfunction, particularly in the HFI group. In addition, reduced expression of classic brown adipocyte genes(Reference Ricquier52,Reference Miranda, Silva-Veiga and Martins53) was found, which worsens the effects of weight gain(Reference Kotzbeck, Giordano and Mondini23,Reference Rangel-Azevedo, Santana-Oliveira and Miranda45) .
Evidence suggests that impairment of BAT can contribute to increased BM, particularly in the white adipose tissue compartments. This is observed in the process where high-fat diet consumption induces a whitening effect in BAT, which reduces body temperature. In adaptive thermogenesis, energy is dissipated as heat. UCP1 functions as an alternative proton channel, releasing energy as heat and uncoupling lipid or carbohydrate oxidation from ATP synthesis. This mechanism plays a critical role in enhancing energy expenditure(Reference Spiegelman54,Reference Chouchani, Kazak and Spiegelman55) . The use of lipids as an energy substrate is associated with the maintenance of the brown phenotype and, therefore, with the maintenance of adaptive thermogenesis(Reference Tsai, Qu and Walter56). White Adipose Tissue (WAT) can stimulate adaptive thermogenesis through lipolysis by the generated free fatty acids that activate UCP1(Reference Wang, Wang and Liu57,Reference Guo, Li and Xiao58) . In conditions of overweight and obesity, these pathways may be unbalanced, and free fatty acids from lipolysis do not undergo beta-oxidation, causing ectopic accumulation that causes several deleterious effects. Martins and collaborators evaluated genes involved in beta-oxidation (Ppar alpha, Pcg1-a and Cpt1-a) in a murine model of a high-fat diet with PO and IPO and observed greater accumulation of WAT and decreased beta-oxidation in these animals, suggesting metabolic impairment in both types of adipose tissue.
The Ucp1 gene, an essential thermogenic marker(Reference Martins, Martins and Teixeira11,Reference Morrison59) , exhibited significantly lower levels in the HF, HFP and particularly the HFI groups, indicating impaired heat-generating capacity in BAT. Similarly, the expression of the beta-3 adrenergic receptor gene β3ar, crucial for sympathetic activation of the tissue(Reference Shapira and Seale60), was reduced in these groups, suggesting decreased responsiveness to thermogenic stimulation. Other critical markers, such as Pparg, Prdm16 and Pgc1a, which regulate lipid metabolism, brown adipocyte differentiation and mitochondrial biogenesis(Reference Bertholet and Kirichok61,Reference Fedorenko, Lishko and Kirichok62) , showed a similar trend, with the lowest expression observed in the HFI group.
Supporting these findings, thermographic images clearly illustrate the physiological alterations associated with the diets. The control group maintained higher heat retention, evidenced by regions of high thermal emission, while the HF, HFP and HFI groups exhibited a marked reduction in this capacity, indicating dysfunction in heat generation.
These results suggest that the consumption of PO, particularly in its interesterified form, significantly impairs the functionality of BAT, affecting thermoregulation and the expression of key metabolic genes, contributing to the BAT whitening process. These changes may contribute to an increased risk of metabolic disorders, such as obesity and glucose intolerance(Reference Tabuchi and Sul63).
These observed changes indicate a change in the brown phenotype due to the whitening process caused by BM gain, which is also related to the inflammatory status and reticulum stress. Studies report that white-like BAT demonstrates macrophage recruitment and an increase in pro-inflammatory mediators. The expression of F4/80 was increased in the BAT of mice fed PO and IPO, and the gene expression of Tnfα and Il6 was also higher in these groups, creating a pro-inflammatory microenvironment. Studies suggest that weight gain may contribute to, or result from, the dysregulated ER stress response(Reference Dasgupta, Bandyopadhyay and Ray64). Once ER stress is triggered, a process called the unfolded protein response (UPR) is triggered to either restore ER homeostasis (adaptive UPR) or evoke cell death in the case of prolonged ER stress (maladaptive/uncontrolled UPR)(Reference Almanza, Carlesso and Chintha65).
Atf4 is a branch of the UPR, translocating to the nucleus to upregulate several genes, which govern cellular processes such as induction of autophagy and apoptosis after severe UPR activation. Chop upregulates autophagy-associated genes to induce autophagy and suppress ER stress or modulates apoptosis-associated genes to trigger apoptosis after severe UPR activation(Reference Ajoolabady, Liu and Klionsky66). The increased expression of these markers when PO and IPO were consumed suggests a high rate of apoptosis. In this context, Gadd45 regulates DNA repair, cell cycle, cell survival, apoptosis and cellular senescence under stressful stimuli(Reference Zhang, Xu and Yu67). Gadd45 expression is also associated with fat deposition and brown adipogenesis(Reference You, Xu and Sun68), which supports our findings. In our study, animals fed a high-fat diet, particularly with IPO, exhibited elevated Gadd45 mRNA levels, suggesting increased apoptosis and lipid droplet accumulation.
In addition to the metabolic changes caused by weight gain, inflammation and ER stress culminating in brown adipocyte dysfunction, it was also demonstrated in vascular endothelial growth factor (VEGF)-knockout mice that impaired vascularisation leads to BAT whitening(Reference Shimizu, Aprahamian and Kikuchi69). VEGF-A induces vascularisation and increases blood flow to BAT, increasing UCP1 and thermogenic capacity(Reference Villarroya, Cereijo and Villarroya70). Our results showed that the VEGF-A protein expression was reduced in HFP and HFI animals, suggesting that the consumption of these oils might contribute to BAT whitening and impairment of tissue homeostasis and functionality.
The diet-induced whitening process and the changes it causes in BAT also disrupt glucose metabolism(Reference Czech71,Reference Kimura, Nagoshi and Oi72) . This was demonstrated in the present study by poorer outcomes in the OGTT and IITT in animals that consumed PO and IPO, which were associated with decreased insulin sensitivity and elevated blood glucose levels. Thermogenic activity appears to play a role in the uptake and elimination of glucose by BAT(Reference Giralt and Villarroya73). In addition, glucose and glycolysis may serve as key pathways for dissipating energy in the form of heat(Reference Jeong, Chang and Jo74). Notably, animals fed unmodified or interesterified PO or IPO as part of a normocaloric diet for 10 weeks already exhibited metabolic disturbances compared with the control group. These included a shift from multilocular to unilocular lipid droplet morphology, reduced UCP1 expression and disruption of the typical thermogenic phenotype, even under normocaloric conditions(Reference Peixoto, Quitete and Teixeira41). However, in the present study, when animals were challenged with IPO in the context of a high-fat diet, it became clear that this type of fat can have even more pronounced deleterious effects when consumed in excess.
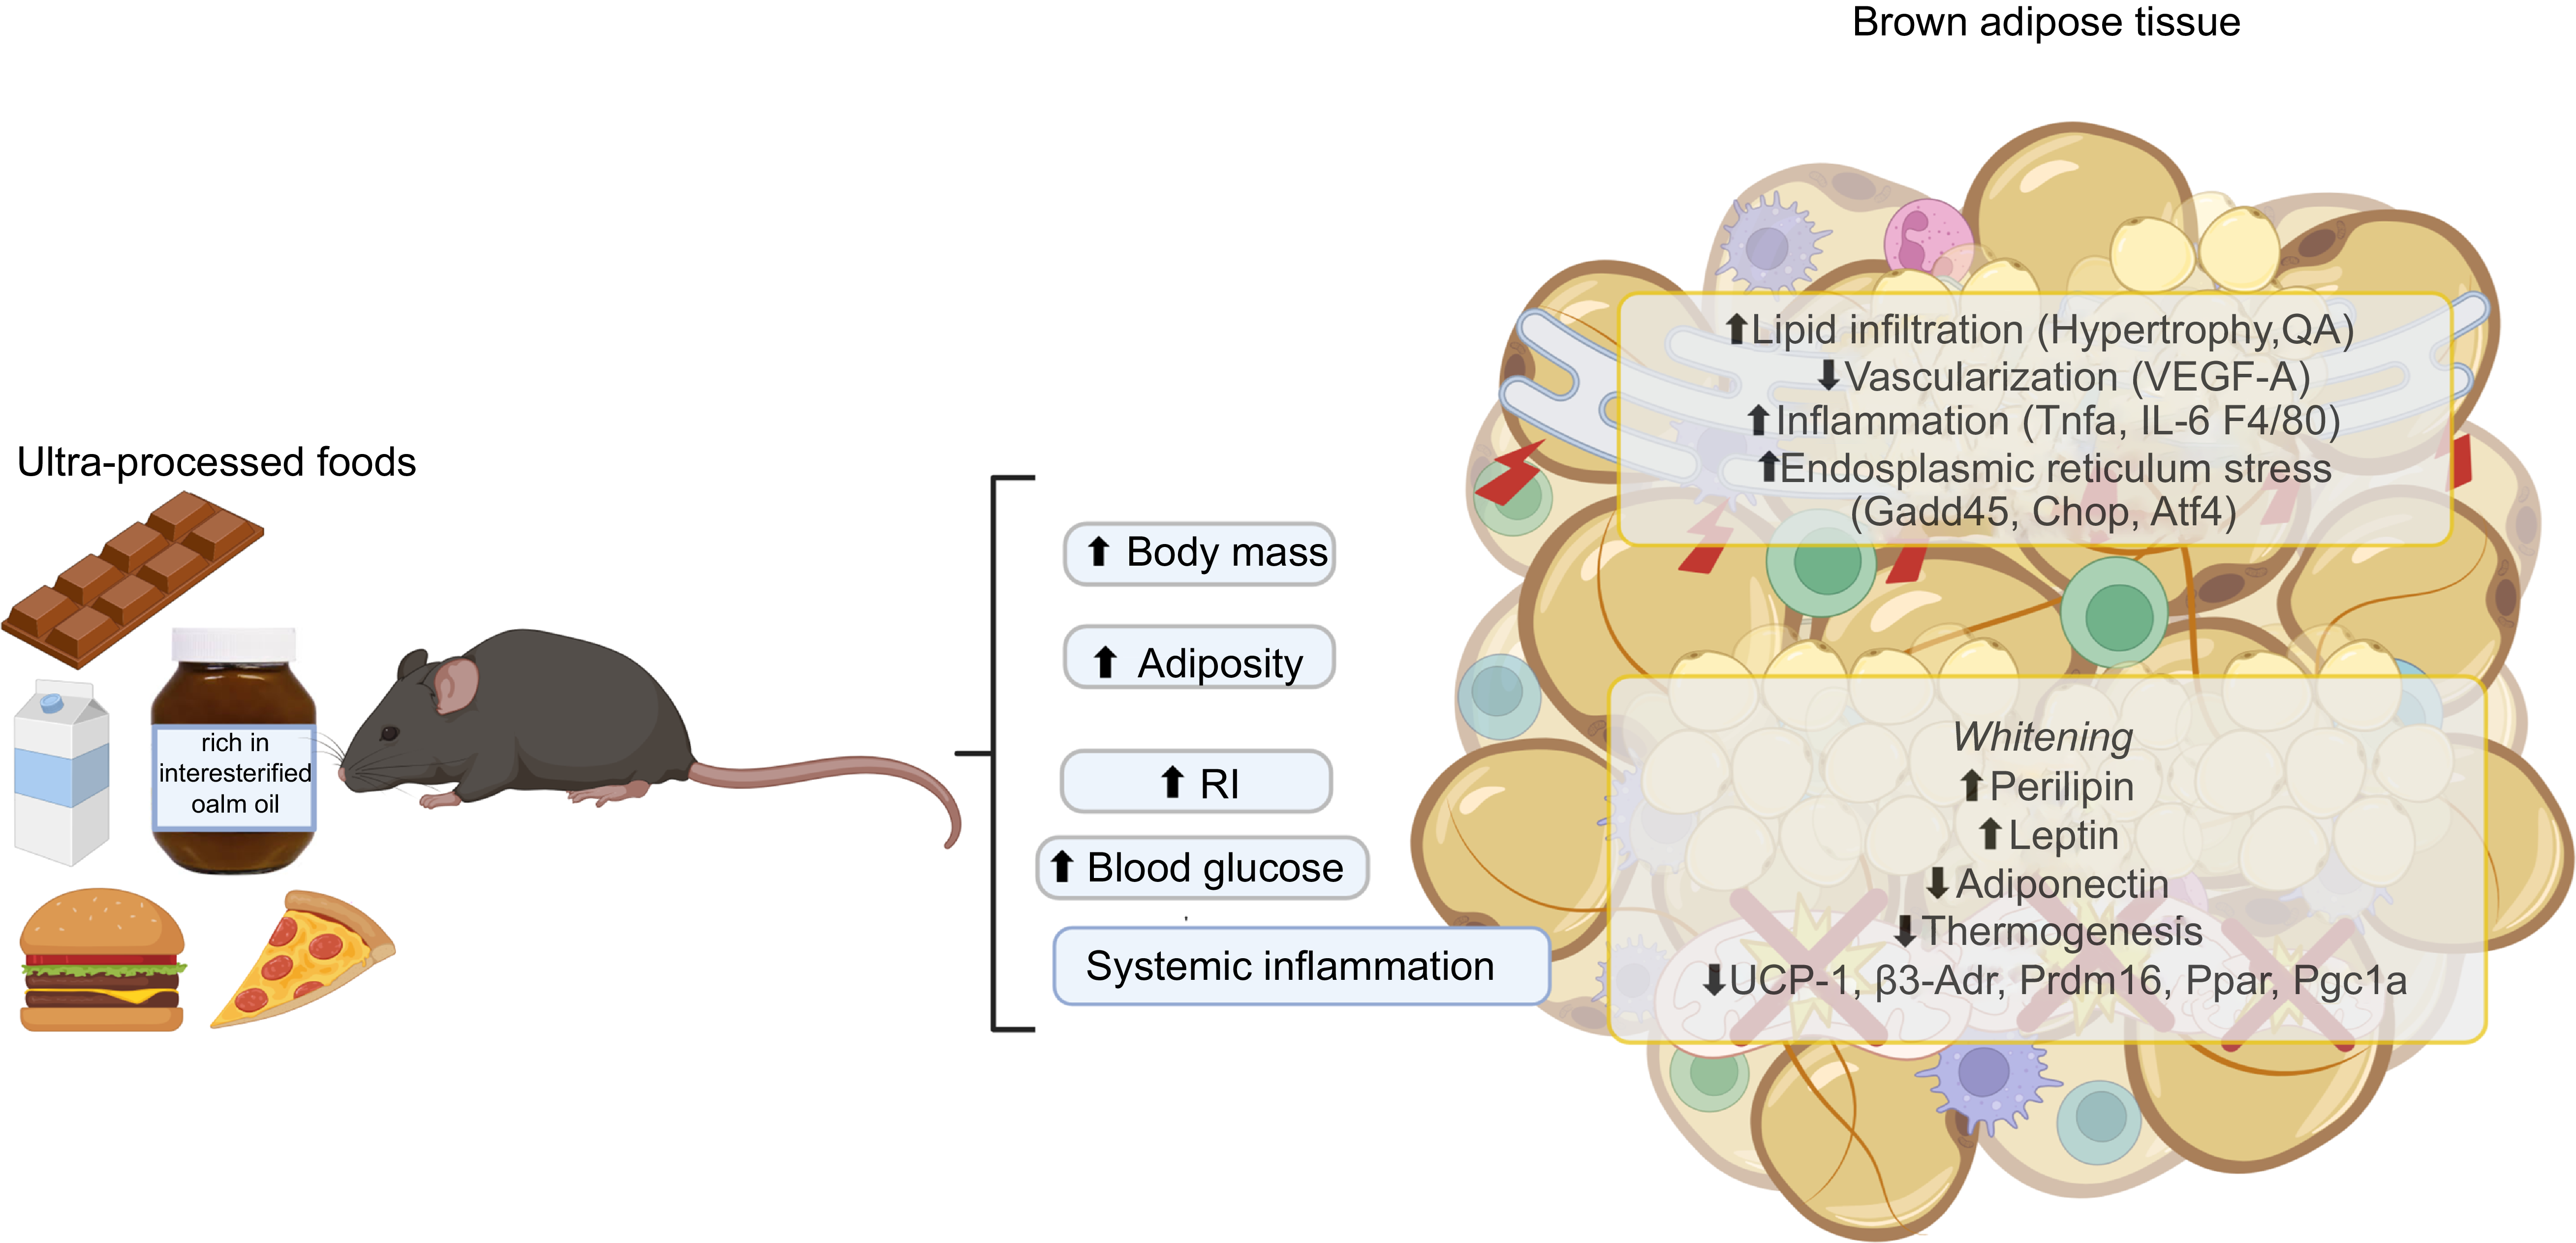
The health impact of consuming PO and IPO remains largely unexplored, despite their widespread use by the food industry. In our study, we observed lipid infiltration in BAT, leading to phenotypic alterations, including impaired thermogenesis, heightened inflammation, reduced vascularisation and increased expression of leptin – hallmarks of the whitening process. These changes adversely affected glucose metabolism, as evidenced by worsened insulin sensitivity and elevated blood glucose levels (Figure 6). Our findings suggest that the consumption of PO or IPO has detrimental effects on the metabolic health of obese mice, highlighting potential risks to human health.
Schematic representation of brown adipose tissue whitening and metabolic dysfunction induced by palm oil and interesterified palm oil in a high-fat diet model. Dietary intake of palm oil and interesterified palm oil within a high-fat diet framework resulted in significant weight gain and increased fat mass. These interventions impaired brown adipose tissue metabolism and exacerbated systemic metabolic dysfunctions such as inflammation, insulin resistance and glucose intolerance. In interscapular brown adipose tissue, lipid infiltration caused adipocyte hypertrophy, a shift from multilocular to unilocular morphology, reduced vascularisation, increased immune cell infiltration and activation of endoplasmic reticulum stress pathways. These alterations led to the whitening of brown adipocytes, characterised by loss of thermogenic features, increased leptin expression and decreased adiponectin secretion, ultimately compromising thermogenic capacity. This phenotypic shift contributes to the progression of obesity and its associated metabolic co-morbidities. QA, numerical density of nuclear profiles; RI, insulin resistance; VEGF-A, vascular endothelial growth factor A; F4/80, macrophage surface marker; GADD45, growth arrest and DNA damage-inducible protein 45; Chop, C/EBP homologous protein; Atf4, activating transcription factor 4; UCP1, uncoupling protein 1; Prdm16, PR domain zinc finger protein 16; Pgc1α, PPAR gamma coactivator-1 alpha.

Acknowledgements
This work was supported by the Fundação Carlos Chagas Filho de Amparo à Pesquisa do Estado do Rio de Janeiro (FAPERJ) E-26/211.193/202, E-26/201.234/2022 and E-26/210.332/2022, granted to Dr. Julio Daleprane; Coordenação de Aperfeiçoamento de Pessoal de Nível Superior – Brasil (CAPES) – Finance Code 001CAPES; and Conselho Nacional de Desenvolvimento Científico e Tecnológico (CNPq) (no. 404446/2021–3).
B. C. M., C. S. M., M. S. R., A. V. S. T. and T. C. P. performed the research and acquired the data. P. C. L., A. C. R., D. B. M., F. F. M., V. S-M. and J. B. D. designed the study, analysed and interpreted the results. D. B. M., F. F. M., V. S-M. and J. B. D. assisted with the main experiments and reviewed the manuscript. All authors were involved in drafting and revising the manuscript.
All the authors declared no competing interests.
All data are available in the main text. Derived research data supporting our conclusion are available from the corresponding author on request.