Introduction
The objectives of this paper are to report normative data for intelligence, height and head circumference for 6- to 15-year-olds in Saudi Arabia, and the correlations between these variables. There have been two previous studies of intelligence in Saudi Arabia in which the Standard Progressive Matrices were administered. These obtained British IQs of 78 and 82 (Abdel-Khalek & Lynn, Reference Abdel-Khalek and Lynn2009; Batterjee, Reference Batterjee2011).
It has long been known that intelligence is positively related to height and head circumference. In the late nineteenth century, the relation between educational attainment (an approximate proxy for intelligence) and height was reported in a study of 33,500 school students by Porter (Reference Porter1892). Since this early report, many studies have found that children who are shorter tend to obtain lower scores in IQ tests (e.g. Wilson et al., Reference Wilson, Hammer and Duncan1986; Walker et al., Reference Walker, Grantham-McGregor, Powell and Chang2000; Gale, Reference Gale2005). These studies have typically shown correlations between height and IQ of around 0.25. For example, in a large sample of 11-year-olds in Scotland the correlations were 0.24 for boys and 0.25 for girls (Deary et al., Reference Deary, Whalley and Starr2009, p. 24).
There does not appear to be a causal relationship between height and IQ. There is no evidence that an increase in height will cause a rise in intelligence. Thus, Wilson et al. (Reference Wilson, Hammer and Duncan1986) reported that among 2177 children studied longitudinally in the National Health Examination Survey of the 1960s, changes in relative height between the ages of 8 and 13 years were not related to changes in scores on tests of intelligence or academic achievement. Furthermore, in a randomized controlled study into the effects of long-term growth hormone therapy in children born small for gestational age, most of the treated children showed a gain in height of 1 SD or more, paralleled by increases in IQ, but the increase in height did not explain the improvement in IQ (Van Pareren et al., Reference Van Pareren, Duivenvoorden, Slijper, Koot and Hokken-Koelega2004).
A number of theories have been advanced to explain the association between intelligence and height. Diet, disease, psychosocial stress and inadequate cognitive stimulation in childhood have all been suggested as factors that might underlie the positive relation between height and IQ. Evidence that nutrition and cognitive stimulation are at least partially responsible comes from a study of growth-retarded children aged 9–24 months in Jamaica. Improvements in both growth and cognitive function were produced after two years of nutritional supplements and cognitive stimulation. Only those children who received both interventions caught up with the non-growth-retarded control group. Cognitive stimulation, but not nutritional supplements, had a long-lasting effect on intelligence, as shown by test results at age 11 years (Walker et al., Reference Walker, Grantham-McGregor, Powell and Chang2000). The absence of a causal relation between height and intelligence is indicated by the results of a study of 9-year-olds born in Britain in 1992 in which height was not significantly related to intelligence, even though height was related to the IQs of their mothers (Gale et al., Reference Gale, O'Callaghan, Godfrey, Law and Martyn2004). This suggests that the association between height and IQ has weakened in more recent birth cohorts in economically developed countries, possibly because as standards of living have increased variations in height between social groups has declined.
An association between intelligence and head circumference has also been reported in numerous studies. This association appears to have been first observed in the nineteenth century by the French physician and neurologist Paul Broca (Reference Broca1873), who measured external and internal skull dimensions and weighed wet brains at autopsy and observed that skilled workers had a larger average brain circumference than the unskilled, and eminent individuals averaged a larger brain than the less eminent. Numerous studies reviewed by Rushton & Ankney (Reference Rushton and Ankney2009) have confirmed this relationship. They summarized the results of 59 studies that reported the relation between external head measures and IQ (total N=63,405), for which the average correlation was 0.20. They also summarized the results of 28 studies that reported the relation between brain circumference measured by brain imaging and IQ (total N=1389), for which the average correlation was 0.40. The reason that the correlation is higher when brain imaging is used to measure brain circumference is that it is more accurate than external head measures.
These studies of the association between intelligence with head circumference and height have nearly all been made on samples in Europe and North America. As far as the authors are aware, there have only been two studies that have examined these associations elsewhere in the world. The first is a study in India of 200 9-year-olds which reported a correlation of 0.15 between intelligence measured by the Standard Progressive Matrices (SPM) and head circumference, and a correlation of 0.16 between intelligence and height (Lynn & Jindal, Reference Lynn and Jindal1993). The second is a study in Sudan, in which a correlation of 0.21 was reported between intelligence measured by the SPM and head circumference in a sample of 240 adults (Khaleefa et al., Reference Khaleefa, Ali and Lynn2012).
Methods
The sample consisted of 636 boys and 917 girls (N=1553) aged between 6.0 and 15.5 years. The sample was drawn from school students at schools in Mecca Province, Saudi Arabia. The province was divided into four quarters, and representative schools were selected in each of the quarters. Participants were randomly selected from both public and private schools. Public schools in Saudi Arabia only teach the curriculum assigned by the Ministry of Education while private schools are allowed to add supplementary material to the mainstream proscribed curriculum. The sample does not include elite private schools. The parents of the sample were given consent forms for the testing and for the collection of demographic information. The forms were collected prior to the day of testing, and were checked for any missing information.
Intelligence was measured by the Standard Progressive Matrices (SPM) (Raven et al., Reference Raven, Raven and Court2000) without a time limit. Head circumference was measured as head circumference at its maximum, just above the ears. Head circumference has been used as an approximate measure of brain size in numerous studies (reviewed by Rushton & Ankney, Reference Rushton and Ankney2009).
To carry out the testing, teams of female researchers were recruited to test female participants while male researchers were recruited to test male participants. Each team had four members and a co-ordinator. Both teams were trained on the procedure for applying the SPM, measuring head circumference and height, selection of the sample and the collection of the demographic data. All team members had a college education.
On the days scheduled for testing, each team conducted the test in the selected schools. The students were tested in groups in a classroom environment. The testing team explained and demonstrated the procedure to the students using the examples in the test manual. At the conclusion of each test session, more information, including participants' head circumference and height, was collected. The data for height and head circumference were recorded on the participants' test answer sheet. The testing began on 24 April 2010 and ended on 23 June of the same year. The data collection teams used computer software to input, correct and tabulate the results for intelligence, head circumference and height.
Results
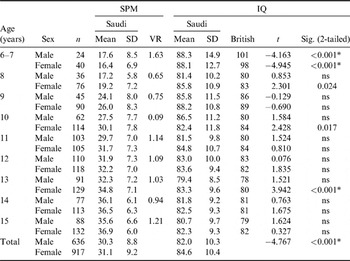
Table 1 gives the mean scores and standard deviations of the sample on the SPM for boys and girls, Saudi mean IQs and British IQ equivalents of the Saudi scores given in the 1979 standardization sample given by Raven (Reference Raven1981) and the t-values for the statistical significance of the differences. It will be noted that boys obtained a higher mean than girls among the 6- to 7-year-olds but this is not statistically significant. Girls obtained higher means than boys in the age groups 8–15 years and in the 10- and 13-year-olds, and these differences are statistically significant when tested by t-test but not after Bonferroni corrections.
Mean scores and standard deviations on the Standard Progressive Matrices, variance ratios (VR), British IQ equivalents, t-values for the differences between 6- to 15-year-old boys and girls, Saudi Arabia, 2010

* Significant after Bonferroni correction.
For the total sample, the mean SPM score of the boys was 30.2 (SD 8.7), and that of the girls was 31.0 (SD 9.1). This is a difference of 0.09 standard deviation units and is equivalent to 1.35 IQ points. Column 6 gives the variance ratios (VR) for the differences in variance of the scores of the boys and of the girls calculated as the square of the standard deviation of the boys divided by the square of the standard deviation of the girls.
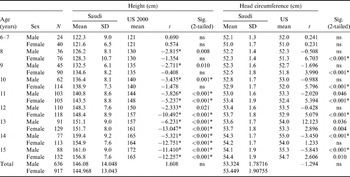
Table 2 gives the means and standard deviations for height and head circumference of the Saudi sample and, for comparison, American norms for height for 2000, as given by the National Center for Health Statistics (2000) and American norms for 2000 given by Nellhaus (Reference Nellhaus2010). The statistical significance of the differences between the heights of the Saudi sample and the American norms is given in the right-hand column. It will be noted that among the 6- to 7-year-olds the Saudi sample had higher average heights than the American norms, but this is not statistical significant. In the age groups 8–15 years the Saudi sample had lower average heights than the American norms, and these differences are statistically significant after Bonferroni corrections for boys aged 10, and for boys and girls aged 11, 12 and 13.
Means and standard deviations of Saudi height and Saudi head circumference, the t-values for US height and head circumference, 6- to 15-year-olds, Saudi Arabia, 2010
* Significant after Bonferroni correction.
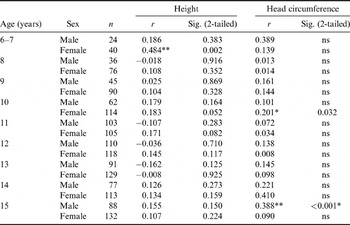
Table 3 gives the correlations for SPM scores by height and head circumference for each age group. For height, fifteen of the eighteen correlations are positive and two are statistically significant. The average of the correlations is 0.126. For head circumference, sixteen of the eighteen correlations are positive and three are statistically significant. The average of the correlations is 0.138.
Pearson correlations (r) IQ scores x height and head circumference, Saudi Arabian 6- to 15-year-olds, 2010

*p<0.05; **p<0.01.
Discussion
The results for the SPM set out in Table 1 show that the Saudi sample obtained a mean British IQ of 82.4 in relation to the 1979 British standardization sample. However, the British IQ for 11-year-olds (the average age of the Saudi sample) on the SPM increased by 6.2 IQ points over the years 1979–2008 (Lynn, Reference Lynn2009). Hence the Saudi IQ in relation to the British IQ of approximately the same year should be reduced by 6.2 IQ points to 76.2. This is close to the British IQ of 78 obtained by the Saudi sample of 4659 8- to 24-year-olds reported by Abdel-Khalek & Lynn (Reference Abdel-Khalek and Lynn2009) and a little lower than the Saudi IQ of 82 reported by Batterjee (Reference Batterjee2011).
The girls obtained a 0.4 IQ point higher IQ than the boys. This should be regarded as negligible and is consistent with the results in the meta-analysis reported by Lynn & Irwing (Reference Lynn and Irwing2004) in which there was no sex difference in the SPM in this age range. The differences between the boys and girls in variability on the SPM are inconsistent. In five of the age groups, the boys had greater variability than the girls, but in the other four age groups, the girls had greater variability than the boys. These inconsistent results are contrary to the frequent assertion that males have greater variability than females. This contention has been advanced since the early years of the twentieth century, e.g. by Ellis (Reference Ellis1904), Thorndike (Reference Thorndike1910) and Terman (Reference Terman1916), and reaffirmed by Eysenck (Reference Eysenck1981, p. 42) and recently by Deary et al. (Reference Deary, Irwing, Der and Bates2007). However, not all studies have found greater variability in males, including a meta-analysis of the performance of college students on the Progressive Matrices by Irwing & Lynn (Reference Irwing and Lynn2005). There have also been a number of recently published studies that have not found greater variability in boys in several countries in the Middle East and North Africa, including Pakistan (Ahmad et al., Reference Ahmad, Khanum, Riaz and Lynn2008), Sudan (Khaleefa et al., Reference Khaleefa, Khatib, Mutwakkil and Lynn2008), the United Arab Emirates (Khaleefa & Lynn, Reference Khaleefa and Lynn2008), Saudi Arabia (Abdel-Khalek & Lynn, Reference Abdel-Khalek and Lynn2009) and Libya (Lynn et al., Reference Lynn, El-Ghmary Abdalla and Al-Shahomee2009). Thus, the present results confirm those of a number of previous studies in finding that greater variability of intelligence in males is not a universal phenomenon.
The results in Table 2 show that boys had significantly greater height than girls at ages 11, 13, 14 and 15 years, and that the heights of the Saudi sample are significantly lower than those of the American norms at the ages of 11–15 years. The existence of a positive correlation between height and intelligence has been found in other countries, e.g. of 0.16 between intelligence and height reported for 9-year-olds in India by Lynn & Jindal (Reference Lynn and Jindal1993) and of 0.24 for boys and 0.25 for girls reported by Deary et al. (Reference Deary, Whalley and Starr2009) for 11-year-olds in Scotland, is not confirmed in this sample. Only one of the eighteen correlations shown in Table 3 is statistically significant and five of the correlations are negative.
All of the eighteen correlations between head circumference and intelligence shown in Table 3 are positive, although only two are statistically significant. These results are consistent with the positive correlations found in other countries, e.g. of 0.15 between intelligence and head circumference reported for 9-year-olds in India by Lynn & Jindal (Reference Lynn and Jindal1993) and 0.20 obtained by Rushton & Ankney (Reference Rushton and Ankney2009) in their review as the average of 59 studies, is confirmed in this sample.
The explanation of the positive correlation between height and intelligence is probably that the quality of nutrition obtained by the fetus and by babies affects the development of both height and the brain, bringing the two into positive correlation. The same explanation may be valid for the positive correlation between head circumference and intelligence, but it has also been proposed that head circumference is an approximate measure of brain size, and a larger brain confers greater intelligence because it contains more neurons and therefore more processing power (Vernon et al., Reference Vernon, Wickett, Bazana, Stelmack and Sternberg2000).
A multiple regression analysis of the data was carried out entering age, height and head circumference as predictors of IQ giving a multiple correlation of 0.21.