

INTRODUCTION
The proportion of the population that does not identify with a religious tradition has more than tripled in the past 25 years, growing from 7% of the total population in 1991 to just under 23% in 2014 (Pew Research Center 2015a). These 56 million “nones” have overtaken Mainline Protestants (14.7%) and Catholics (20.8%) and are now the second largest group in the American religious landscape behind Evangelical Christians (25.4%). This change in the religious makeup of the United States (U.S.) has important implications for party politics; 54% of nones identify with the Democratic Party compared with just 23% who identify with the Republican Party (Pew Research Center 2015b). Their increased presence in the American electorate may point to a potential long-term advantage for the Democratic Party.
The impact of nonreligious voters in the Democratic Party is not assured, however, as nones tend to participate in politics less than religious people (Pew Research Center 2015b). Religion has a well-documented positive impact on political participation through the development of civic skills and direct mobilization by religious leaders and organizations (Putnam and Campbell Reference Putnam and Campbell2010; Verba, Schlozman, and Brady Reference Verba, Schlozman, Brady and Brady1995; Djupe and Gilbert Reference Djupe and Gilbert2006; Reference Djupe and Gilbert2008; Smith Reference Smith2005; Campbell Reference Campbell2004; Guth et al. Reference Guth, Green, Kellstedt and Smidt1995; Djupe and Grant Reference Djupe and Grant2001). However, nonreligious Americans do not typically attend church or participate in civics-oriented activities associated with organized religious traditions, which may limit their ability to develop civic skills and become involved in politics (Hout and Fischer Reference Hout and Fischer2002, 14; Putnam and Campbell Reference Putnam and Campbell2010).
I argue the key to the political participation and incorporation of nones within the Democratic Party lies in an underexplored subset of the nonreligious population called secularists. Secularists in the U.S. are not just nones, they also hold positive nonspiritual belief systems (Layman et al. Reference Layman, Campbell, Green and Sumaktoyo2017; Campbell et al. Reference Campbell, Layman and GreenN.d). Secularists' beliefs go beyond de-identification with a religious tradition (Beard et al. Reference Beard, Ekelund, Ford, Gaskins and Tollison2013); they believe that human logic, such as expressed through science and mathematics, gives meaning to their lives and describes the way the world works better than religion (Baker Reference Baker2012; Cimino and Smith Reference Cimino and Smith2014; Reference Cimino and Smith2007). Secularists also reject the role of religion in influencing the public sphere. Today, “active” secularist makeup 8% of the population and one-third of all nones (Layman et al. Reference Layman, Campbell, Green and Sumaktoyo2017; Campbell et al. Reference Campbell, Layman and GreenN.d; Bolce and De Maio Reference Bolce and De Maio2002).Footnote 1 Active seculars are now as large a portion of the population as the entire nonreligious population in the early 1990s, which is a signal of the rising presence of seculars in the general public. But just as not all people who believe in God are devout religious adherents, not all seculars are equally dedicated to their secular worldview. A relatively small but growing portion of secularists in the U.S. join groups and organizations structured on secular beliefs (Cimino and Smith Reference Cimino and Smith2014).Footnote 2 I find that these committed seculars are active in politics and that their political participation and activism has a strong partisan dimension. I examine the causes of committed secularists' political participation and find that committed secularists are driven to participate by their ideological extremity and perceived distance in relation to the Democratic Party. These findings point to their potential influence in the Democratic Party and a prospective path toward mobilization.
Previous efforts to capture the influence of nones in American politics focus on national survey data, which tend to “lump” secularists and nones together, or ask only about atheism and agnosticism, missing committed secularism within the “none” category limiting analysis of heterogeneity among nones (e.g., Hout and Fischer Reference Hout and Fischer2002, 14; Putnam and Campbell Reference Putnam and Campbell2010; Hansen Reference Hansen2011; Beard et al. Reference Beard, Ekelund, Ford, Gaskins and Tollison2013; Lim, MacGregor, and Putnam Reference Lim, MacGregor and Putnam2010; Bolce and De Maio Reference Bolce and De Maio2002). To find a group of committed secularists I turn to a unique survey of members of a secular organization, the American Humanist Association (AHA). The AHA's goal is to promote “nontheistic” morality demonstrated by their slogan, “Good Without God.” As a non-political organization, they are an ideal group to establish the potential factors that drive secularist's political participation independent of political influence. In addition to the AHA survey, I utilize data from two nationally representative surveys to compare political participation patterns between committed seculars in the AHA and nones in the general population. Investigation of the motivating factors behind committed secular's political participation is an important early look into a burgeoning segment of the population, which may provide insight into the process of political incorporation of new groups.
NONES IN AMERICAN POLITICS
For most of the 20th century, the U.S. stood out among western industrialized countries for its high levels of identification with religious organizations and practices (Weber and Owen Reference Weber and Owen1919; Norris and Inglehart Reference Norris and Inglehart2004; Gorski Reference Gorski2000; Hughey Reference Hughey1979; Chaves Reference Chaves1994). American's tendencies toward religion began to shift in the 1990s and have become steadily less religious since then, leading to nearly 25% of the population not identifying with a religious tradition (Hout and Fischer Reference Hout and Fischer2002, 14; Putnam and Campbell Reference Putnam and Campbell2010; Cimino and Smith Reference Cimino and Smith2007, 11; Reference Cimino and Smith2014). Most of the losses come from Mainline Protestant and white Catholic denominations, but even Evangelical Christians have seen their share of the religious marketplace slightly decrease.
Some scholars suggest generational replacement drives decreasing levels of religiosity in the U.S.; younger Americans are simply less religious than previous generations (Claassen Reference Claassen2015). However, this description does not explain the timing of the rise of the nones, only one potential long-term process. Evidence from Hout and Fischer (Reference Hout and Fischer2002) and Putnam and Campbell (Reference Putnam and Campbell2010) suggests that the timing of the rise in nones is an important factor in understanding its cause — nones became more prevalent as religious people became more active in politics, especially in the Republican Party (Cimino and Smith Reference Cimino and Smith2014). Religious individuals who are also politically liberal perceive the involvement of the religious right in conservative politics and de-identify with their religious tradition (Hout and Fischer Reference Hout and Fischer2014). Bolce and De Maio (Reference Bolce and De Maio2002) point to the partisan nature of this trend and show seculars identify more strongly with the Democratic Party. The increase in individuals in the general population who identify as nones combined with their dislike of the Republican Party may point to a mobilizing dimension for the Democratic Party. In many ways, this process has already begun. Nearly all of the increase in nones comes from political liberals and moderates (Hout and Fischer Reference Hout and Fischer2002, 14). This pattern has created a “God gap” between nones in the Democratic Party and religious people in the Republican Party (Campbell, Green, and Layman Reference Campbell, Green and Layman2011; Campbell Reference Campbell2006; Wilcox and Robinson Reference Wilcox and Robinson2010; Olson and Green Reference Olson and Green2006; Smidt et al. Reference Smidt, den Dulk, Froehle, Penning, Monsma and Koopman2010; but see Sullivan Reference Sullivan2008).
The emergence of this religious divide in American politics has led to divisions between the two political parties on cultural issues such as abortion and gay marriage and the “God gap” is an important factor in shaping the polarization of the electorate along these cultural issue dimensions (Hunter Reference Hunter1991; Campbell, Green, and Layman Reference Campbell, Green and Layman2011; Layman Reference Layman2001). Layman and Green (Reference Layman and Green2006) find that the culture wars separation that divides the parties along cultural issues is best understood as a division between orthodox and progressive members of all religious traditions. Nones are the least orthodox group in American politics, thus the impact of the cultural divide ought to be most evident in the division between orthodox Republicans and progressive nones in the Democratic Party. The increase in nones in the Democratic Party and the importance of the orthodox/progressive divide in American politics would seem to suggest that progressive nones might be an important part of the Democratic Party coalition.
The impact of nones in the Democratic Party, however, may be limited by their lower rates of participation and the persistence of religious groups in the Democratic Party coalition. Nones may lack many of the important civic skills that motivate political participation. Because many Americans develop civic skills in church, nones who do not attend organized church services, participate in church groups, or establish church-based networks may simply be “non-joiners,” thus less likely to participate in politics (Putnam and Campbell Reference Putnam and Campbell2010; Verba, Schlozman, and Brady Reference Verba, Schlozman, Brady and Brady1995; Djupe and Gilbert Reference Djupe and Gilbert2006; Reference Djupe and Gilbert2008; Campbell Reference Campbell2004; Guth et al. Reference Guth, Green, Kellstedt and Smidt1995). Nones' lack of religious affiliation itself may be driven by the downtrend in civic participation in the U.S. (Putnam Reference Putnam2001). Second, the Democratic Party is still mostly made of religious people, with 70% coming from Catholic, Evangelical, and Mainline Christian faiths (Sullivan Reference Sullivan2008; Pew Research Center 2015a). A majority of Democrats attend church regularly, believe in God, and pray frequently. Moreover, two religiously devout groups, Black Protestants and Hispanic Catholics, are important groups in the Democratic Party coalition (Sullivan Reference Sullivan2008; McDaniel Reference McDaniel2008; Kelly and Kelly Reference Kelly and Kelly2005; Kelly and Morgan Reference Kelly and Morgan2007).These two factors call into question nones' potential to be mobilized in the Democratic Party without alienating religious groups within the Party.
Lastly, not all nones are Democratic. The proportion of the Republican Party that does not identify with a religious tradition grew from 10% in 2007 to 14% in 2010 (Pew Research Center 2015a). Nones in the Republican Party tend to adopt a Libertarian philosophy and make of a quarter of all Libertarians, according to the American Values Survey (Cox, Navarro-Rivera, and Jones Reference Cox, Navarro-Rivera and Jones2013). The growth of libertarian nones may have significant influence within the Republican Party given the increasing importance of libertarian ideology in the Party (Iyer et al. Reference Iyer, Koleva, Graham, Ditto and Haidt2012). Republicans who are nones may counteract the importance of nones in the Democratic Party, especially if they adhere to libertarian ideologies already prominent in the Republican Party.
But many in the Democratic Party who do not identify with a religious tradition are not just nones, they hold an active secular beliefs (Layman and Weaver Reference Layman and Weaver2016; Cimino and Smith Reference Cimino and Smith2014; Reference Cimino and Smith2007, 11; Hansen Reference Hansen2011). During the 2012 Democratic National Convention, the Party had not included the word “God” in the party platform, despite its inclusion in the 2008 party platform. In fact, the Party platform had included multiple mentions of the word God since 1992, the last year the word God was not included in the official party platform.Footnote 3 In 2012, when the chairperson asked the crowd for an auditory vote for inclusion of the God language (a two-thirds vote is needed to change the platform), the response from the crowd was decidedly mixed with “yays” and “nays.” The confused chairperson asked again, three times, and then “determined” the vote had passed, with many booing in reaction.Footnote 4 Why the sharp divide in the Democratic Party on the bare mention of a religious theme? The events at the convention demonstrate that, among politically active Democrats, an active secular identity that rejects the role of religion in the public sphere is alive and well. Layman and Weaver (Reference Layman and Weaver2016) strengthen this evidence for the role of active seculars in the Democratic Party and find that secular convention delegates take more extreme issue positions than their religious counterparts, which reinforce patterns of polarization between parties and the division between religious and secular Democrats.
COMMITTED SECULARS IN PARTY POLITICS
The vocal secular movement in Democratic Party activists highlights the distinction between nones, who simply do not affiliate with a religious tradition, and seculars, who adhere to secular beliefs defined in part by rejection of religion in the public sphere. A proportionally smaller but growing segment of secularists positively identify as “atheists,” “agnostics,” “secularists,” “humanists,” and other terms (Cimino and Smith Reference Cimino and Smith2014; Reference Cimino and Smith2007, 11; Pigliucci Reference Pigliucci2013; Hunsberger and Altemeyer Reference Hunsberger and Altemeyer2006; Audette and Weaver Reference Audette and Weaver2015).Footnote 5 These patterns of secular association and identification motivate many secularists to join secular organizations to express secular worldviews and engage with other secularists. These committed seculars are radically different than nones, and these differences may influence committed secular's rates of political participation as well as their mobilization potential within the Democratic Party. If seculars are driven from religion in part by their perception of the conservative religious right, then the most committed seculars, who continually affirm their secular beliefs through participation in secular organizations, may also be active and committed party members. If true, reasons for committed secular political participation may reveal potential motivations for secular American's political participation.
Despite being a subset of nones in the general population, committed seculars conceivably may influence Democratic Party issues platforms and candidate positions. Evidence for the potential of a committed subset of a larger population to influence party politics can be seen in the impact of committed Evangelical Christians in the Republican Party. Members of Evangelical groups such as the Christian Coalition were instrumental in establishing a link with the Republican Party centered on morality politics (Wilcox Reference Wilcox1988; Reference Wilcox1992; Green and Guth Reference Green and Guth1988; Wilcox, Rozell, and Gunn Reference Wilcox, Rozell and Gunn1996). The most committed Evangelical Christians thus became the most committed Republicans, which served as strong evidence for the potential for party mobilization of religious identities. Republicans then leveraged this potential by reaching out to Evangelicals and adopting morally conservative policy positions (Rozell and Wilcox Reference Rozell and Wilcox1995, 6; Albertson Reference Albertson2015; Barker, Hurwitz, and Nelson Reference Barker, Hurwitz and Nelson2008). As demonstrated at the 2012 convention, there seems to be an expression of a secular identity within the Democratic Party that has not yet been explicitly tapped by Democratic Party leaders as a mobilization dimension in the same way Republicans tapped the religious right. Like committed Evangelicals, committed seculars may act as a bridge between the Democratic Party and the larger secular population, especially if committed seculars prove to be active in party politics.
SECULAR BELIEFS AND POLITICAL IDEOLOGY
Just as Evangelical Christians saw themselves as more conservative on cultural issues than the average Republican, committed secularists may also perceive themselves to be more liberal than the Democratic Party. Secular convention delegates for example are the most liberal Party members, and see themselves as more ideologically liberal than the median Democrat (Layman and Weaver Reference Layman and Weaver2016).Footnote 6 Secular delegates also hold much stronger secular beliefs than nones in the general population. This research finds that secularists are more likely than other Democrats to be motivated by ideological goals rather than party goals. Perception of ideological extremity may also drive political participation for committed seculars in the general population. Like secular delegates, committed seculars may seek to express their political views through active participation in the Party, and influence the Party to take more extreme issue positions. This pattern is especially likely given the lack of mobilization by the Democratic Party. Because the Democratic Party has not explicitly associated itself with seculars, despite the presence of secular activists, committed seculars will be more likely to participate in the Democratic Party if they perceive they are more ideologically extreme than the Democratic Party. In keeping with Aldrich (Reference Aldrich1983), individuals with more extreme policy positions in relation to the most proximate party are more likely to participate in party support behavior than moderate individuals. In this way, ideological extremity, rather than ideological proximity motivates party participation. Political party participants are not vote maximizers; activists are able to achieve policy-based equilibrium among themselves and use their position to exert influence over Party leadership and elected officials (Aldrich Reference Aldrich1995). Because the Republican Party is visibly highly religious, committed seculars have no other option but to participate with the Democratic Party to promote their issue positions. Evangelical Christians, driven by ideological extremity on moral issues in relation to the Republican Party, became involved in party politics in order to shape the platform of the Republican Party toward conservative moral positions. I predict a similar dynamic is occurring between committed seculars and the Democratic Party. Committed seculars may perceive that the Democratic Party is doing little to counteract the role of religious individuals in the Republican Party and respond by participating in Democratic Party politics. In this scenario, the most ideologically extreme seculars, who see the Democratic Party as too moderate, will be the most likely to participate.
H1a:
Committed seculars' political participation will be driven by their ideological extremity.
H1b:
Committed seculars' political participation will be driven by their perceptions of ideological extremity in relation to the Democratic Party.
By comparing the Democratic Party loyalty and patterns of participation of these committed seculars to those of the general population of nones, I can test the mobilization potential of committed secular Americans. Also, by establishing the factors that promote committed secular's participation, I can ascertain how the Democratic Party may most effectively mobilize this group, and the potential impacts of that mobilization on the party platform and candidate issue positions.
However, determining the mobilization potential of committed seculars in the general public is limited by a lack of data that captures a population of committed seculars. Efforts to capture the role of seculars beyond the definition of “none” rely on “lumping” nones in with atheists and agnostics, or identifying secular traits such as a lack of religious beliefs, or the rejection of religion in politics. Lack of specificity in identifying committed seculars limits analysis of the actual or potential impact of seculars in American politics. Current efforts are unable to capture a group of likely political party participants among the nones, let alone determine what factors may influence their political participation. Committed secularists attend rallies, adhere to public figures representing the movement, and form and join groups organized on secular principles (Cimino and Smith Reference Cimino and Smith2007; Reference Cimino and Smith2011; Reference Cimino and Smith2014; Pigliucci Reference Pigliucci2013; Hunsberger and Altemeyer Reference Hunsberger and Altemeyer2006). These features of secularists paint a much different picture than the stereotypical disaffected none, atheist, or agnostic. I examine a group of committed seculars to determine the impact of committed secular's beliefs and political orientations on political participation and potential mobilization in the Democratic Party.
Members of the AHA are the ideal group in which to find committed seculars. The AHA is organized around secular beliefs defined by human and logical sources of morality and rejection of religious influence in the public sphere. Importantly, the AHA is not a political organization. According to Djupe and Olsen (Reference Djupe and Olson2014) current membership in the AHA is likely around 50,000 people. Although they do engage in some advocacy, they do not organize themselves around a political ideology or advocate for a political party. Secularists in the AHA hold strong attachments to non-religious scientific beliefs, hold Humanist weddings and funerals, attend regular conventions, and identify actively as secular, atheist, or humanist. Just as a religious organization such as the Southern Baptist Convention is an explicitly religious organization, the AHA is an explicitly active secular organization whose primary aim is the promotion and support of the secular worldview. The group may not perfectly mimic the activities of a religious tradition but members are certainly not inactive participants in their secular worldview. Unlike the Christian Coalition, which was an explicitly political organization aimed at the direct inclusion of religious values in politics, the AHA is first and foremost a secular organization, more akin to an organization such as the Southern Baptist Convention. The AHA is also decidedly less politically motivated and involved than other secular organizations like Americans United for Separation of Church and State. Since the secular political movement is in its embryonic stages, the AHA, unlike a secular political organization, provides an opportunity to study a population in the earliest stages of political activism independent of overt political influences. My examination of committed seculars in this secular organization allows me to test the mobilization potential of committed seculars and determine the necessary conditions for their integration into the Democratic Party. I suggest their political involvement will go further than simple Democratic Party identification. Compared with nones, committed secularists ought to have high rates of political participation including voting, contributing to campaigns, and involvement in political campaigns.
DATA AND METHODS
I use a unique survey of the American Humanist Association conducted in 2011 to determine the motivations of committed secular's political participation (Campbell Reference Campbell and Layman2011b). The survey was sent to a random sample of individuals on the member list of the AHA. Responses were gathered from 755 members.Footnote 7 The main inclusion constraint, membership in the AHA, shapes the results of this study. But members' status as the most fervent secularists may also prove to be revealing. Recalling earlier studies of the Christian Right (Wilcox Reference Wilcox1988; Reference Wilcox1992; Green and Guth Reference Green and Guth1988; Rozell and Wilcox Reference Rozell and Wilcox1996; Green et al. Reference Green, Guth, Smidt and Kellstedt1996), this strategy allows examination of a group of committed seculars that may prove to be important in the current political context. Table 1 displays descriptive statistics of respondents to the AHA member survey. AHA members are much older, more educated, and have higher incomes than national averages. Members are also mostly male and white, all factors that may significantly shape survey responses.
Descriptive statistics of AHA members

Supporting data for comparison purposes was gathered from two additional sources. First, I use a nationally representative sample of the American population with an oversample of nones (those that do not identify with a religious tradition) called the Secular America Survey (SAS). The SAS is a four-wave online panel study of the American population conducted by Knowledge Networks. I utilize the second wave of the panel of 1,909 respondents, which was conducted in 2011 (Campbell Reference Campbell and Layman2011a).Footnote 8 The primary advantage of the SAS is that it contains a battery of questions on secular beliefs that exactly mirror questions in the AHA Member Survey. The oversample of nones also allows comparison between AHA members and nones in the general population on secular belief dimensions. Many questions are mimicked across both surveys allowing accurate comparisons. Next I use a sample of the 2010 CCES (Cooperative Congressional Election Survey; Ansolabehere Reference Ansolabehere2012) that has been statistically matched with demographic characteristics in the AHA sample. Because the selection constraint involved in the AHA data skews the underlying demographic makeup of the AHA sample, direct comparisons with nationally representative data are unreliable as differences may be attributed to demographic differences. The large-N make-up of the CCES allows me to use a matching strategy that finds respondents in the CCES who exactly fit the demographic profile of the AHA data allowing for better controlled, albeit not perfect, comparisons (Ho Reference Ho, Imai, King and Stuart2007).Footnote 9 The CCES general public matched sample creates a group that is demographically comparable to the AHA sample, which allows for comparisons independent of the effects of demographic differences.
In drawing comparisons between the four groups — committed secularists in the AHA, nones in the general population, the matched sample, and the population as a whole — I use means comparisons to analyze the various features of each group in relation to each other. While statistical matching and survey similarity technically make more mathematically rigorous strategies possible, means-based analysis allows for easy interpretation and fewer statistical and theoretical “leaps” in handling the data. More rigorous regression-based strategies are used when examining the AHA sample itself.
POLITICS OF COMMITTED SECULARISTS
Committed seculars are significantly older, better educated, financially well-off, and male when compared to the general population. On face, these demographic characteristics would seem to suggest a slight lean toward the Republican Party. While statistical controls used within the AHA survey may be useful in determining effects independent of these demographics, comparisons with the general population will be especially useful in describing the existence and character of political ideology and participation in the sample of committed seculars. To this end I provide two sets of comparisons between means, one using the matched 2010 CCES and another using the nationally representative SAS. These comparisons will demonstrate the unique nature of committed seculars, but also their potential to be mobilized as well as the application of that mobilization potential to seculars in the Democratic Party.
COMPARING THE POLITICS OF COMMITTED SECULARS
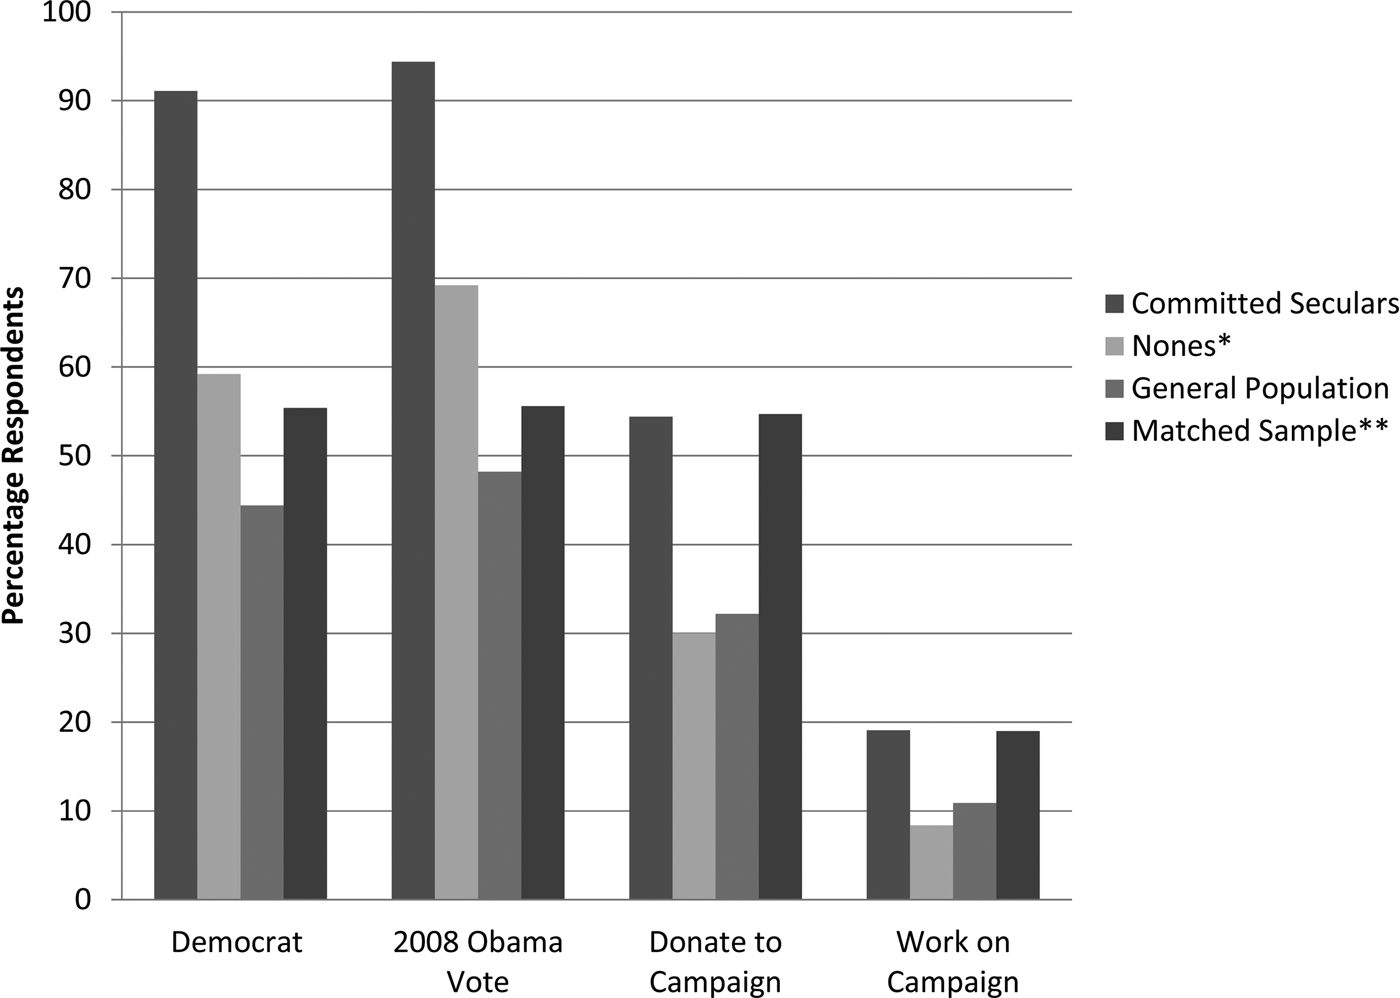
That committed seculars are more likely to be Democrats than the general population is not surprising, but the magnitude of that difference is staggering. Figure 1 shows individuals who identify as leaning, weak, or strong Democrats. Nearly every individual in the committed secular sample (91.1%) identifies with the Democratic Party compared with only 47.4% in the matched data.Footnote 10 The pattern is even more striking when it comes to the 2008 presidential vote with only a handful of committed seculars not voting for Barack Obama. This initial comparative glance offers good evidence for the idea that committed seculars are strong ideologues on the left.
Comparison of committed seculars' party ID, vote choice, and participation. Democratic identification included all respondents answering “lean,” “weak,” or “strong” Democrat. Obama vote for all committed secular respondents is compared with Obama vote for only CCES respondents who say they voted. This creates a more conservative representation of committed secular Obama vote comparison. Participation was measured by “within the past year” responses to donate to and work for campaign questions. Figures represent percentages for each group. *Nones were taken from the general CCES 2010 data. Respondents who answered “atheist,” “agnostic,” or “nothing in particular” to the question about religious tradition were pooled. **Data were matched with 2010 CCES responses using MatchIt package in R statistical environment. The matching algorithm used was nearest neighbor matching without replacement, which produced perfect balanced indicating exact match for each member of the AHA was found in the CCES Data. Matched N = 576. Source: 2011 AHA Member Survey, 2010 CCES.

The differences in committed seculars are also striking when compared to nones in the general population. Committed seculars are far more likely than nones to identify with the Democratic Party or vote for Obama. Nones themselves are more liberal, especially in voting patterns, than the general population but lack the homogenization of committed seculars. This hints at the possibility that something about being a committed secular drives committed seculars far to the left of “mainstream” nones. This pattern is reinforced by committed secular's rates of campaign involvement. Many more committed seculars had contributed to or worked for a campaign than nones and the general population. But this difference washes out when compared with the matched data likely due to their similar education and economic status.
But committed seculars are also much more likely to identify as independent “leaners,” or those who identify initially as independent and then lean toward the Democratic Party when prompted by the survey. This tendency toward “leaning” shows some committed seculars may still see themselves as slightly apart from the Democratic Party. The data in Figure 1 also underscore the potential for mobilization in both committed seculars and nones in general. While committed seculars are strong partisan voters and identifiers, they do not contribute or participate over and above what their demographic profile would suggest. The reason may be their perception of Democratic Party mobilization efforts. Less than 40% of committed seculars think that Democratic Party reaches out to nonreligious people — a low finding considering committed seculars' homogenous party identification and propensity to join organizations like the AHA.Footnote 11 Determining what motivates those members who do participate is the main aim of the AHA-specific multivariate analysis presented later.
Beyond the differences between committed seculars and the general public, the data also divulge the potential for nones to be mobilized in the Democratic Party. Figure 1 shows nones in the general population are more likely to vote Democratic but not at the rates of committed seculars. More importantly, nones are significantly less likely to donate to and work on campaigns than committed seculars or the matched sample. Like committed seculars, the answer may lie in differences in party perceptions. Nones are much less likely than committed seculars to perceive the influence of religion in the Republican Party. This may prove to be a potential mobilizing dimension for the Democratic Party for nones in the general population.
SECULAR BELIEFS
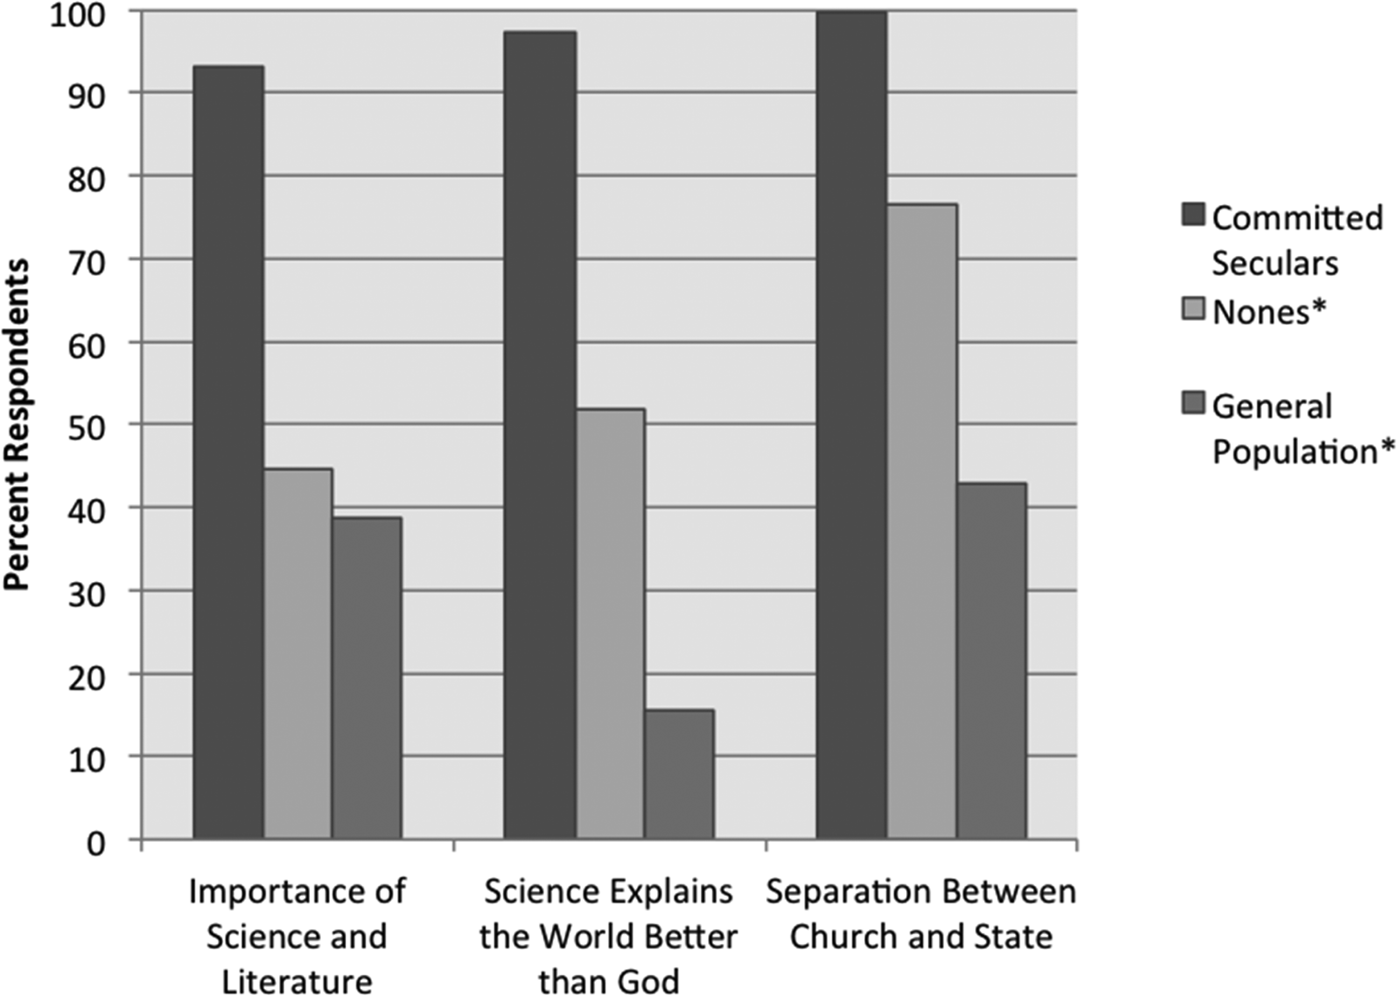
The uniqueness of committed seculars goes beyond party identification and vote choice; as members of a secular organization, committed seculars also have distinct beliefs as to the role of religion in their personal lives and the public sphere. Figure 2 outlines a range of secular beliefs and compares adherence to those beliefs for committed seculars, nones, and the general public. As expected, committed seculars hold strong preferences for scientific explanations of existence and derive meaning in their lives from scientific, nonreligious sources rather than religious sources. Also, nearly every respondent in the AHA Member Survey responded that “there should be a high wall of separation between church and state” rather than that “the government should take special steps to protect America's religious heritage.”Footnote 12 In each case, committed seculars hold much stronger secular beliefs than nones and the general public.
Comparing secular beliefs. Question wording is identical across surveys. Exact wording is available in the online appendix. *Data was drawn from the first wave of a nationally-representative panel began in 2010. General population data is weighted to account for an oversample of nones. Source: 2011 AHA Member Survey, 2011 Secular America Survey.

The extremity of committed seculars' beliefs may particularly important to their political participation, especially as they apply to the role of religion in the public sphere. If committed seculars are nearly uniformly against the involvement of religion in the public sphere, and they associate the Republican Party as being influenced by religion, then that association will push committed seculars to participate in the Democratic Party. The partisan-religious divide in American party politics provides a venue for committed seculars to reject the role of religion in government by rejecting the religious Republican Party and participating in the Democratic Party.
COMMITTED SECULARS AND THE DEMOCRATIC PARTY
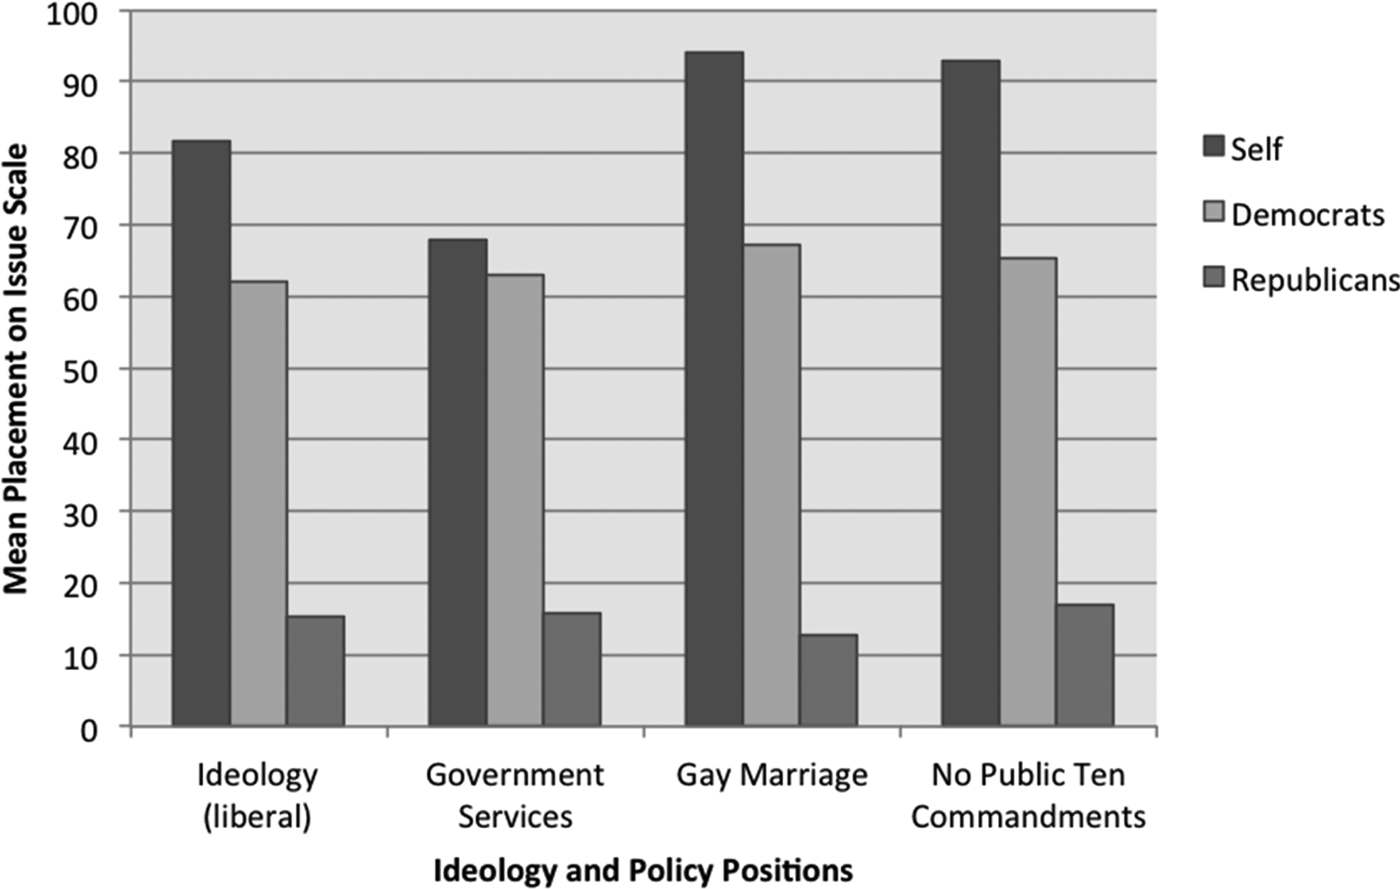
Are committed seculars simply the most educated and well-off nones? Even that finding may be important to their impact and party participation, but I suggest the strength of committed seculars' perceptions of their absolute ideological extremity, and extremity in relation to the Democratic Party drives their political participation in the Democratic Party. As indicated above, many of the committed seculars' basic demographic characteristics — income, education, and age — would traditionally push them toward the Republican Party. Why do members largely eschew these pressures and adhere to the opposite party? If committed seculars are the most fervent secularists, and their secular attitudes are driven in part by political perceptions, committed seculars ought to have an extreme view of their ideological position in relation to both parties. As with the Christian right movement in the 1980s, strong views may explain how nones and secularists are not fully integrated into the Democratic Party, despite being strong identifiers and voters. To determine patterns of ideological perceptions, respondents in the AHA survey were asked to place themselves, the Democratic Party, and the Republican Party on 100-point scales on four questions: conservative/liberal ideology, government provided services, gay marriage, and displaying the Ten Commandments in public buildings.
Figure 3 shows that, in every category, committed seculars see themselves as more liberal than the Democratic Party and much more liberal than the Republican Party. Severe differences in ideology and particular issues likely drive committed seculars away from the Republican Party. But committed seculars' extremity may also shape their relationship with the Democratic Party; committed seculars may participate in campaigns because they see themselves as apart from the Democratic Party and desire to move the Party toward their preferred issue positions.
Committed seculars' self and party placement on 100-point issue scales. Respondents were asked to place themselves, the Republican Party, and the Democratic Party on 100-point scale in the four areas. Higher values indicate more liberal positions. Figure values are mean responses committed seculars gave for themselves, Democrats, and Republicans. Source: 2011 AHA Member Survey.

Comparisons between the committed seculars, nones, and the general public are telling but they do not fully examine how nones and secularists in general may be mobilized within the Democratic Party. Because committed seculars have not been motivated to participate beyond demographic characteristics — despite their heavy identification with the Democratic Party — the motivations of those who do participate deserve more scrutiny. The examination of committed seculars who are mobilized will reveal important dynamics for secular mobilization in general. If Democrats can activate secularists in the general public with ideologies similar to committed seculars, it may create a powerful new alignment dimension for the Democratic Party.
COMMITTED SECULAR POLITICAL PARTICIPATION
To test my argument that committed seculars are motivated to participate in politics by their perceived ideological position relative to the Democratic Party, I estimate binomial logistic regression models of committed secular's political activity. I model two measures of political participation, whether or not the respondent has donated to a political campaign and whether the respondent has volunteered for a campaign.Footnote 13 The measures do not ask about which party the respondent participated in, making determining the exact party the respondent donated to or volunteered for impossible. To overcome this limitation, I subset the data to include only respondents who identified as Democrat or who voted for Barack Obama in the 2008 election (N = 710). Even if respondents who participated in previous elections did so for non-Democratic parties or candidates, their current identification with the Democratic Party makes them likely to participate in the Democratic Party in the future.Footnote 14
To examine the effect of ideological extremity on participation I use the respondent's self-placement on a 100-point ideological scale in which 100 signifies the most liberal position. To measure the link between the respondent's self-placement and relative ideological distance from the Democratic and Republican Parties I subtract the respondent's placement of the two Parties on the same scale from the respondent's self-placement. This provides a measure of liberal ideological extremity in relation to the two Parties. Higher values indicate the respondent perceives herself as more liberal than the Party and negative values indicate the respondent perceives herself as less liberal than the Party. Survey response values range from -100 to 100.
I also include the measure of perception of religious involvement in the Republican Party to test the impact of out-party perceptions on committed secular's political participation. If there is a relationship between this variable and committed secular's political participation, then the same factors that pushed seculars away from religion will push them toward participation in the Democratic Party. The model also includes a direct measure of perceived Democratic Party mobilization, “The Democratic Party often reaches out to people who are not religious,” to assess whether those who perceive the Democratic Party is reaching out to them are mobilized to participate. If the models demonstrate a relationship, it would be evidence of the potential effectiveness of direct mobilization efforts.
To capture variation in secular beliefs, identification, and behaviors I utilize an array of questions designed to tap a wide range of secular orientations within AHA members. I include a measure of humanist service attendance, and whether the respondent was ever religious to establish the effect of ideological extremity above a general tendency to participate. Secular identification is measured by an additive scale of respondent's identification with a set of terms that apply to nonreligious individuals.Footnote 15 Private secular beliefs are measured by a question that asks respondents whether nonreligious activities rather than religious activities give meaning to the respondent's life. I also include measures of belief in God and religious guidance to control for traditional religious beliefs. Public secular beliefs are captured by an additive scale of four questions that ask about the appropriateness of public support for religion by the President of the U.S. These include the President praying in public, speaking about her personal faith, endorsing religion in general, and invoking God with the Oath of Office.Footnote 16 Finally, the model includes demographic controls for gender, age, education, and income.
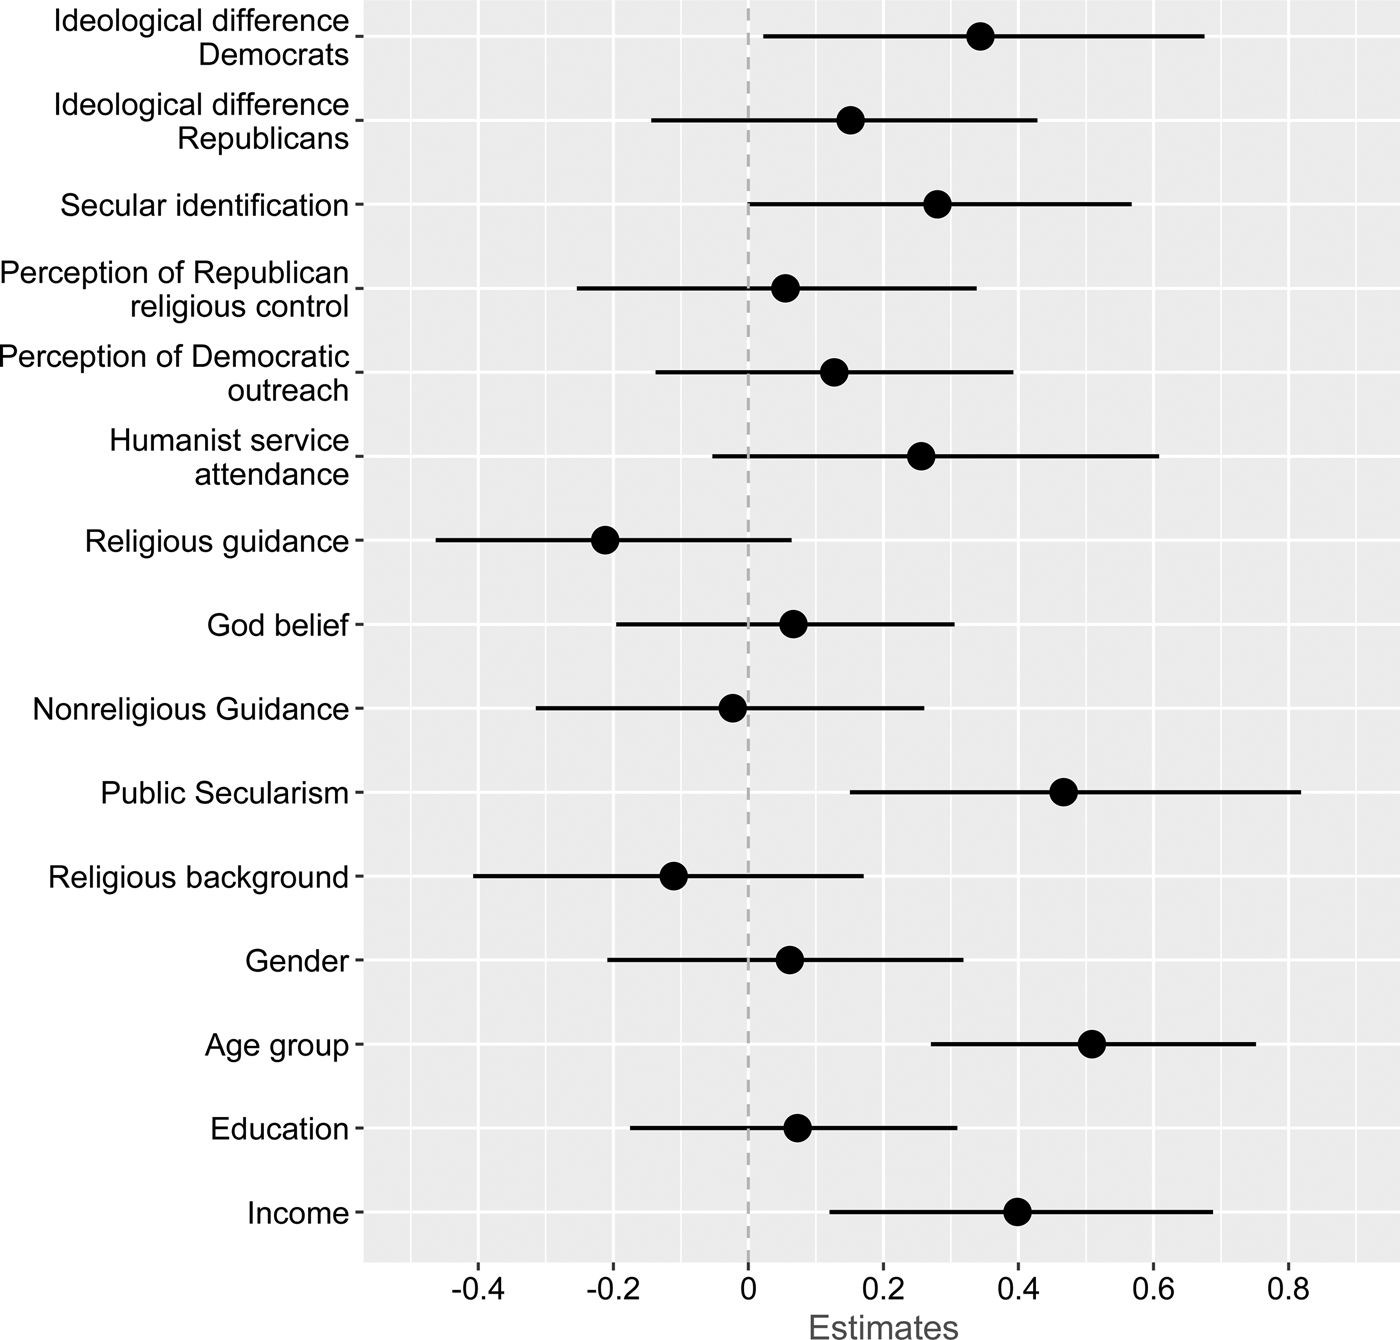
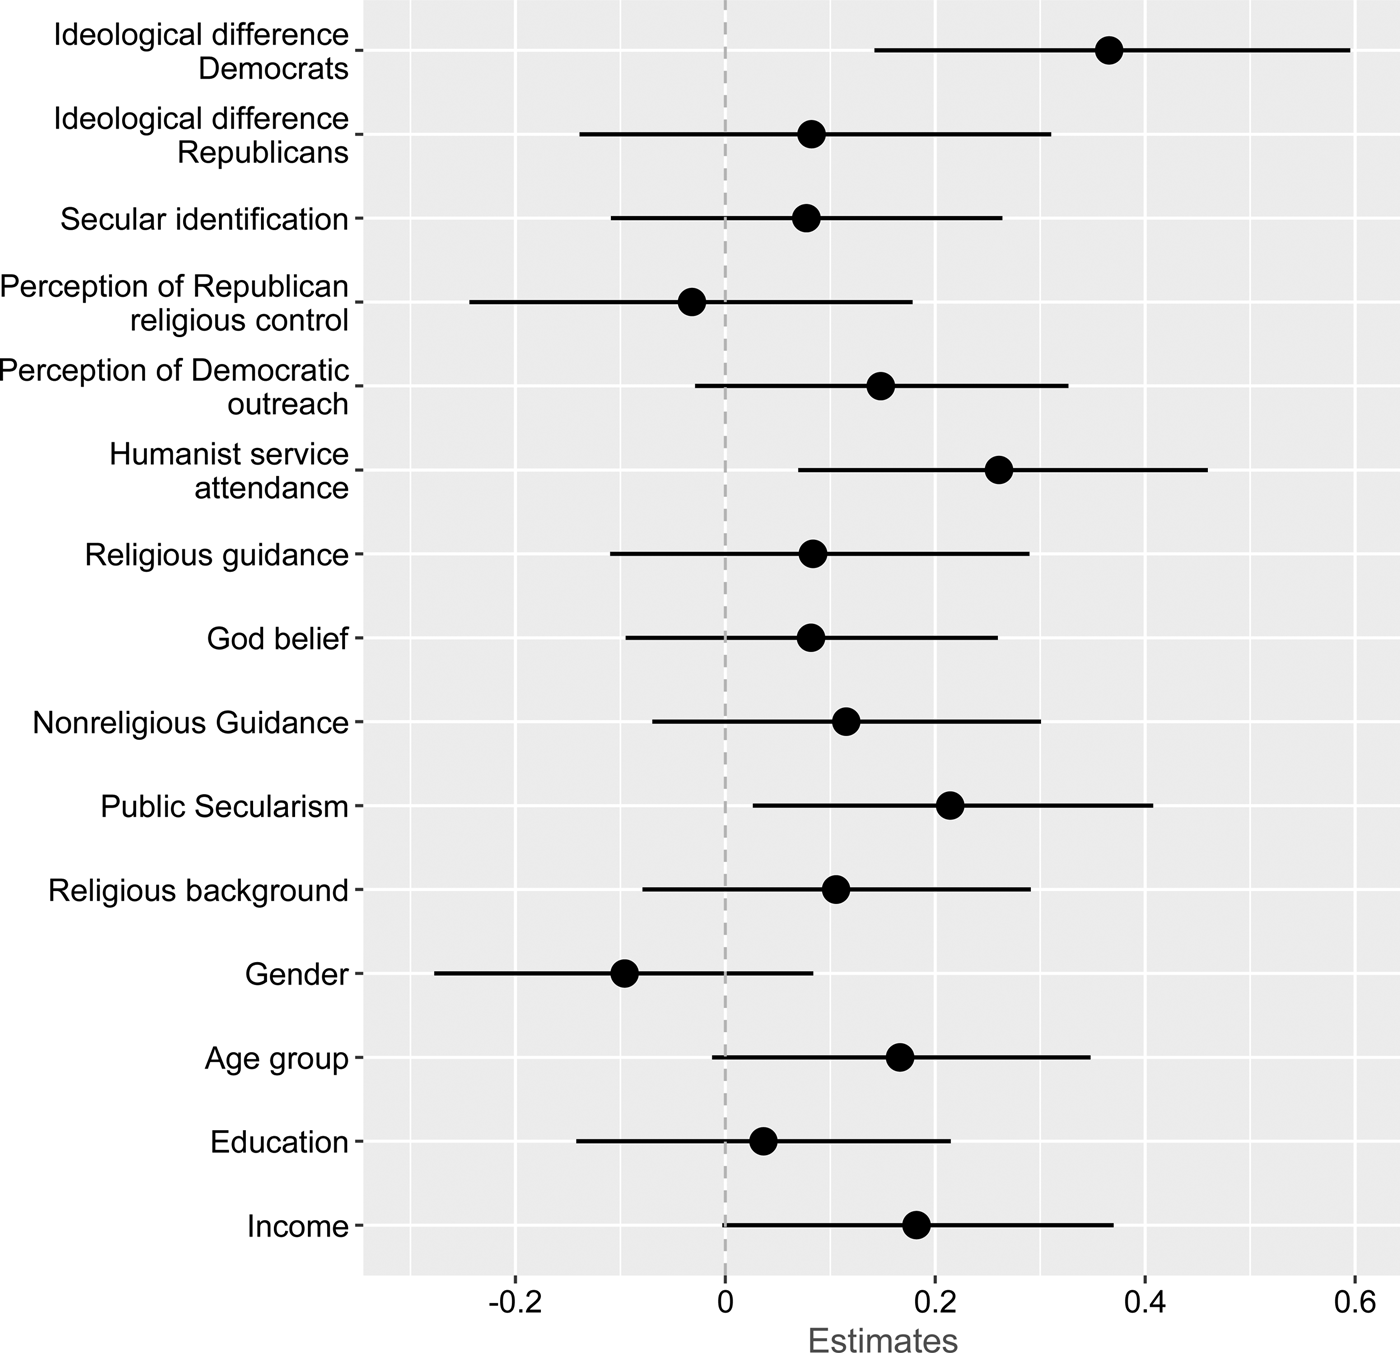
Figure 4 and Figure 5 present the standardized estimates of the logit models of committed secular's political participation. In the models that track the effect of the Democrat ideological difference measure on donating to a campaign and working on a campaign, the coefficient for the ideological difference measure is statistically significant and positive indicating that committed seculars' political participation is driven by their perceived distance from the Democratic Party.Footnote 17 Both models include controls for ideological distance from the Republican Party, which suggests participation is not driven by perception of ideological distance from the Republican Party. These results support my hypotheses regarding the role of ideological extremity in motivating political participation among AHA members. As stated above, committed seculars are not unique in this respect. Evangelical Republicans and political party activists are driven to participate in politics by ideological extremity relative to the most proximate party. The results displayed here confirm this trend among committed seculars. In other words, committed seculars are committed and ideologically extreme party members. This is an important finding among a group that is not explicitly political and has not been directly mobilized by the Democratic Party.
Standardized logit estimates of committed secular political participation: campaign donation. Figure displays the standardized coefficients of the binomial logit model for donating to a political campaign with 95% confidence intervals. Tjur (2010) r-squared is 0.106. See online Appendix for full model N = 572. Source: 2011 AHA Member Survey.

Standardized logit estimates of committed secular political participation: campaign participation. Figure displays the standardized coefficients of the binomial logit model for working on a political campaign with 95% confidence intervals. Tjur (2010) r-squared is 0.08. See online Appendix for full model N = 572. Source: 2011 AHA Member Survey.

The role of ideological distance in motivating participation has two immediate implications for committed seculars' mobilization potential. First, the Democratic Party may have to adopt more liberal policy positions to attract seculars into the Party. To underscore this point, the measure of direct mobilization perception is not related to political participation for committed seculars. The Democratic Party may not be able to mobilize seculars through direct outreach; Democrats may have to change their party platform and candidate issue positions to be more liberal. Second, committed seculars may change the ideological makeup of the party. If seculars are a growing proportion of the Democratic Party base, they may use their numbers to shift the ideological position of the Party more liberal. Since previous examinations of secular's role in party politics are limited, this process may have already begun, especially considering the high rates of committed secular participation.
The null result for the variable for perception of Republican religious control displayed in Figure 4 and Figure 5 suggests committed seculars are not motivated to participate in politics by their desire to counter-balance the religious right. One possible explanation for the null result is that ideological difference and perceptions of the religious right in the Republican Party are endogenous, which negates the effect of the variable in the model. However, eliminating the measure of ideological difference from the models has no effect on the perception of religious control variable. This result demonstrates that the factors that drove seculars away from religion are not the same factors that will motivate them to participate in party politics.
The results from the models of committed secular's political participation also reveal the nature and impact of secular beliefs on political involvement. Committed seculars who value public secularism, as measured by rejection of public displays of religious themes by the president, are also more likely to participate in politics in each of the six models. This result is similar to findings in Bolce and De Maio (Reference Bolce and De Maio2002) that demonstrate secularism motivates participation in the Democratic Party. However, the other measures of secular beliefs that entail support for scientific worldviews, (dis)belief in God, secular identification, and secular service attendance exhibit mixed results. Those that are more likely to identify with secular terminology are more likely to donate to campaigns whereas those that attend Humanist services are more likely to volunteer for campaigns. These patterns likely reveal underlying propensities to identify with groups and join organizations respectively. The effect of ideological extremity over and above this disposition is strong evidence of my hypothesis.Footnote 18 These results are strong evidence for hypotheses 1a and 1b and indicate that, like secular delegates, committed seculars may see participation as a tool to move the Democratic Party closer to their preferred ideological position.
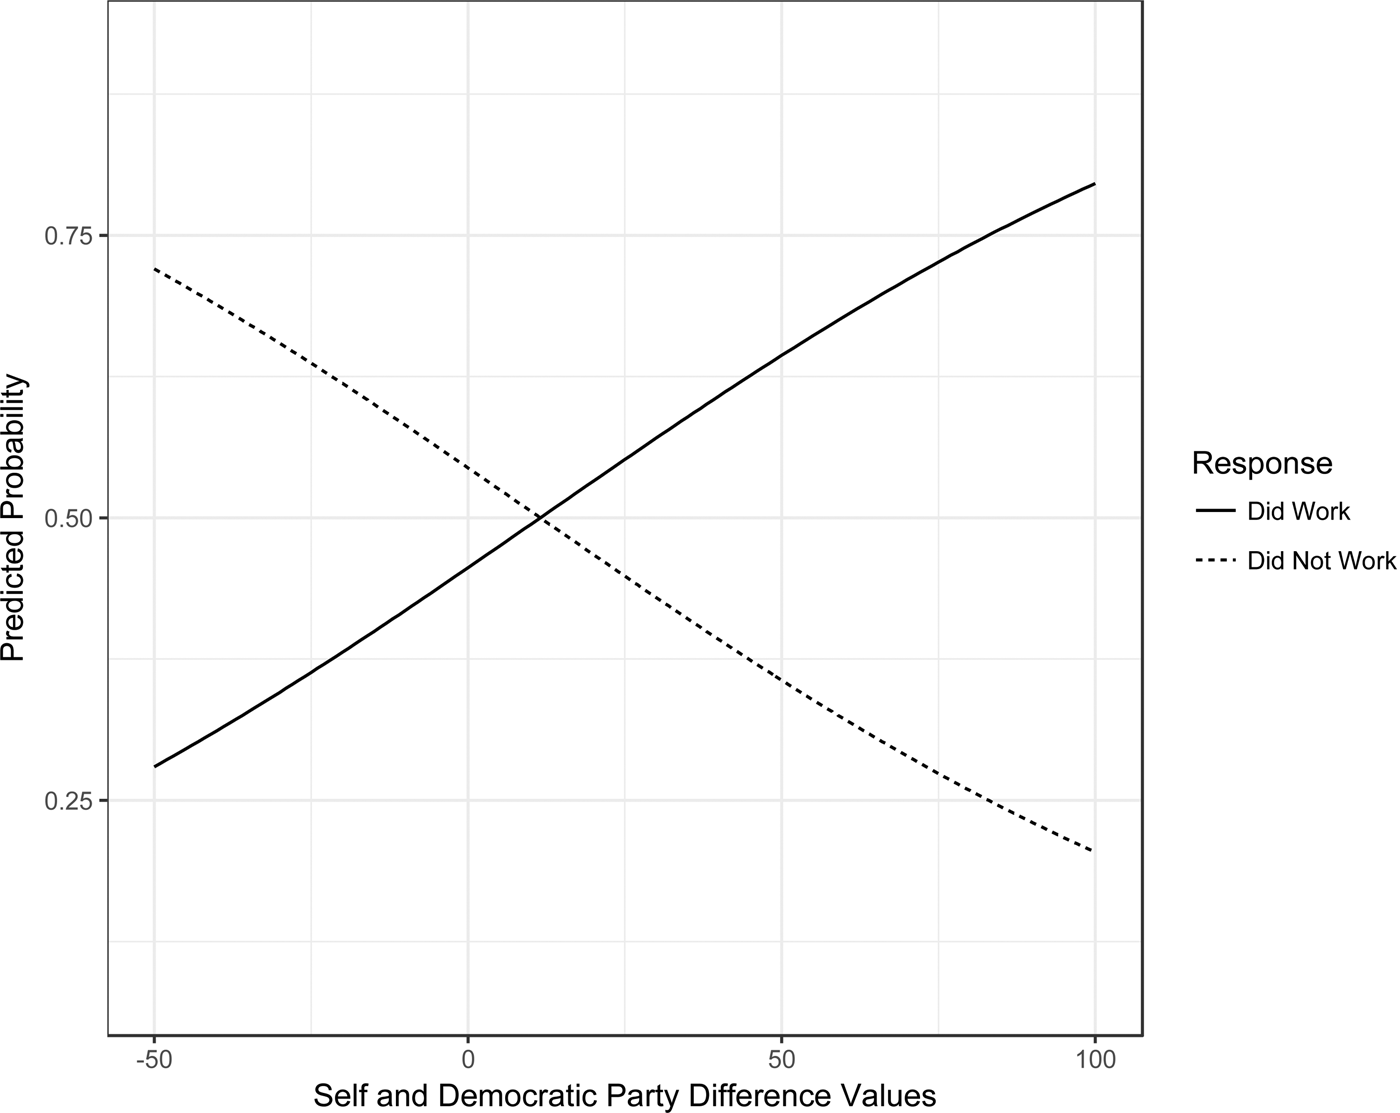
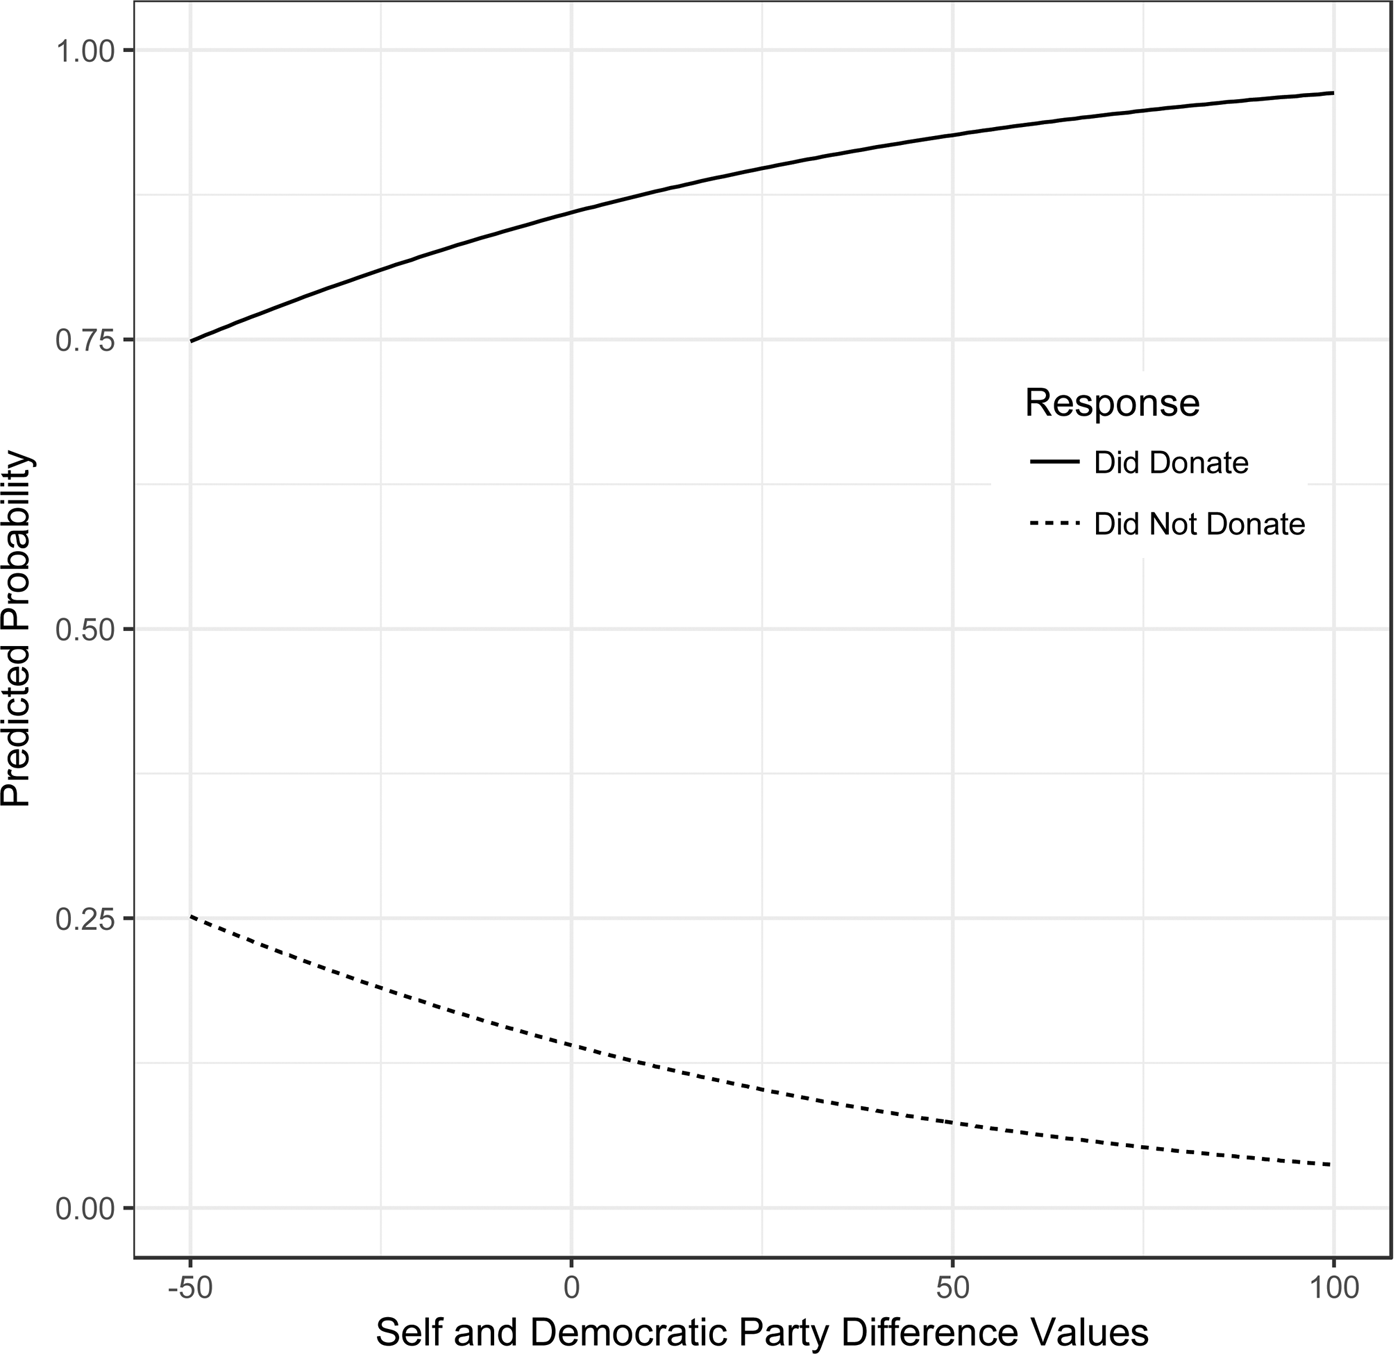
Because logit coefficients are difficult to interpret past sign and significance, Figure 6 and Figure 7 display predicted probabilities of campaign donating and volunteering across the ideological difference variable in both models.Footnote 19 The effects for the model predicting volunteering on a political campaign are strong and positive. Respondents who see themselves as more ideologically liberal than the Democratic Party are much more likely to participate than those that see themselves ideologically closer to or less liberal than the Democratic Party. The results from the model predicted donating to a campaign are less pronounced, as most members reported donating to a campaign in the past. However, the statistically significant upward trend still suggests ideological difference has an impact on campaign donating. Taken together, the predicted probabilities suggest a large effect of ideological difference with the Democratic Party for committed seculars.
Probability of campaign volunteering across perceptions of Democratic Party difference.

Probability of campaign donation across perceptions of Democratic Party difference.

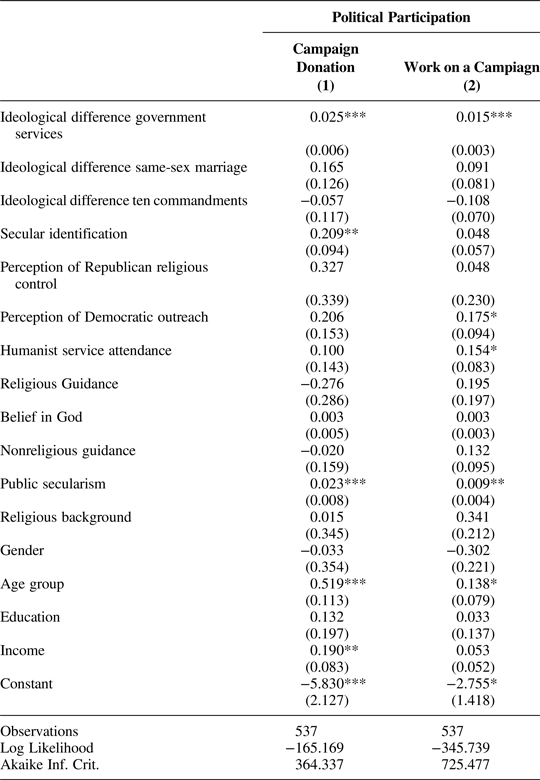
The results displayed above are instructive in demonstrating the impact of ideological difference on political participation for committed seculars but they do not reveal what aspects of committed secular's ideological leanings drive participation. To dig deeper into the ideological motivations of committed secular's political participation, I use 100-point difference scales of three issues: increase governmental services and spending, same-sex marriage, and allowing the Ten Commandments in public buildings.Footnote 20 For each scale, higher responses indicate more liberal attitudes in relation to the Democratic Party. As with the ideological scale above, respondents placed themselves and the two parties on the scale and the difference was calculated by subtracting their placement of the Democratic Party from their own issue position.
The logit estimates of my two measures of political participation using the three issue position difference measures are displayed in Table 2. In both models, perception of difference for the government services variable drives political participation.Footnote 21 This result is surprising given that the religious right is most vocal on cultural issues such as same-sex marriage. But as demonstrated in the model displayed in Table 1, perception of religious involvement in the Republican Party does not drive committed secular's political participation. One possible explanation is that committed seculars, who reject the role of religion in politics in general, think that these types of issues should not influence their political activity, instead favoring non-cultural issues like welfare policy. Another possible explanation is that liberal welfare policies are in line with committed seculars' beliefs that human logic and reasoning ought to be the source of moral judgment. If committed seculars place a high value on human-based morality, it is likely they would value social welfare spending that supports human life.
Logit Estimates of Committed Secular Participation and Issue Position

Note: *p < 0.1; **p < 0.05; ***p < 0.01.
Whatever the cause for the relationship between committed seculars' perception of ideological difference based on social welfare and their political participation, the pattern demonstrated in Table 2 has important implications for committed seculars' mobilization potential in the Democratic Party. As explained above, the Democratic Party is divided between religious and nonreligious members. If, however, the Democratic Party can become more liberal on social welfare policies, and remain less liberal on cultural issues, the Party may be able to mobilize seculars to participate while still maintaining their religious base. Because committed seculars are not mobilized to participate based on cultural issue differences, the Democratic Party could maintain their position on these issues and still mobilize seculars by adopting liberal social welfare positions, which may be in line with the views of many progressive religious individuals in the Democratic Party. This pattern in committed seculars points to a potential long-term advantage and new activist base for the Democratic Party.
CONCLUSION
The changing religious landscape in the U.S. has a partisan dimension and consequences for party politics. Because nones and seculars are at the heart of this change, determining what factors lead to their political participation, and the eventual outcomes of that participation, is crucial. Using an examination of the most active and ideological distinct nones I call committed secularists I have demonstrated that they are one of the most partisan groups in U.S. politics. Furthermore, committed seculars are highly participatory when compared to nones in the general population and their participation is driven by a perception of ideological difference in relation to the Democratic Party. These findings suggest a much different motivation of political participation than is demonstrated by the literature connecting religious adherence to political involvement. Seculars, who lack religious affiliations, may be motivated to participate by extreme ideologies, rather than participation in collective activities.
Just as Green and Guth's (Reference Green and Guth1988) examination of donors to Pat Robertson's campaign predicted the rise of the Christian right in the Republican Party by determining Christian cultural issue preferences were not at odds with mainstream Republican views, the results displayed above suggest that secular Democrats and religious Democrats may be united by more liberal social welfare policy positions. Anecdotal evidence for this pattern exists in the candidacy of Bernie Sanders in 2016, and the rise of a “progressive” narrative with the Democratic Party. This merging of religious and secular Democrats is especially likely given that an important cultural issue, same-sex marriage, has been settled by the Supreme Court, and will likely lose salience as an issue for religious Democrats. This may allow the Democrat Party to aggressively tap secular members to be donors and volunteers for Party candidates and campaigns. These results are the first look into an important potential activist base for the Democratic Party.
SUPPLEMENTARY MATERIALS
To view supplementary material for this article, please visit https://doi.org/10.1017/S175504831700061X.