1 Introduction
Defined contribution (DC) retirement plans are rapidly replacing defined benefit (DB) retirement plans around the world, especially in private sectors but also in some government-sponsored retirement plans. Chile has been in the forefront of DC retirement plans, with a mandatory government-DC plan introduced in 1981 intended to gradually reduce the government's reliance on DB retirement plans. Initially there was only one fund for participants but in 2000 Chile offered two funds and in 2002 it began offering a choice of five funds differing in the percentage of equity in the fund and thus in risk. At the same time, Chile provided what is essentially a life-cycle default plan that moves the assets of passive participants from risky funds to less risky funds as the participants age (Arenas de Mesa et al., Reference Arenas de Mesa, Bravo, Behrman, Mitchell and Todd2006; Rozinka and Tapia, Reference Rozinka and Tapia2007; Berstein et al., Reference Berstein, Fuentes and Torrealba2010; Berstein et al., Reference Berstein, Fuentes and Villatoro2013). This paper contributes to the research on DC retirement plans by examining financial knowledge and demographic variables that influenced the choice of passive or active management in Chile's pension plan in 2009. For those who chose to actively manage their funds, it further examines how financial knowledge, risk taking and demographic variables affected the choice of fund. The variables of particular interest include basic financial knowledge, willingness to take risks, gender, age, marital status, education, income and accumulated retirement savings in the fund. We also include unemployment status as it affects income.
Our study adds to the small number of studies that examine the factors that affect choice of active investment versus a default fund in a DC retirement plan, and we believe that ours is the only one that uses a direct measure of financial knowledge to examine the effect of financial knowledge on the choice of active or passive investment. We find that slightly over one-third of Chilean participants hold the default assets. In the descriptive data, younger people are more likely to hold the default assets. In contrast to most studies, we find that men are more likely to hold default assets than women. When controlling for other variables in a probit analysis, younger people, men, those with low incomes and those with less financial knowledge are more likely to hold default assets. Next we used the ordered probit analysis on the more than two-thirds of participants who actively managed their retirement assets; our findings indicate that older people, married women and those with pension savings in middle categories are less likely to invest in risky assets, whereas single women, married men and participants with higher income are more likely to invest in risky assets. Participants with greater financial knowledge and greater risk tolerance are also more likely to invest in risky assets, but in contrast to most other studies we find that adding financial knowledge and risk tolerance to the analysis has little effect on the gender coefficient or the coefficients of other variables.
In the next section of this paper, we review the literature on default portfolios in retirement plans and the literature with respect to the effect of variables such as gender, age, marital status, education, income, wealth, financial knowledge and willingness to take risks on investment decisions. Following that we introduce the Chilean Pension Fund System. In the Data and methodology section, we describe the data and models that we use. We end with the findings and then a conclusion.
2 Literature review
Rational economic theory argues that participants in DC retirement plans will choose the savings rates and asset allocations that will maximize their life-time utility. However, research in behavioral economics suggests that participants’ decisions are often not optimal for a multitude of reasons (see Tapia and Yermo, Reference Tapia and Yermo2007 for a good review of the behavioral economic literature and the impact on pension funds). As a result, economists such as Thaler and Sunstein (Reference Thaler and Sunstein2003) have argued for ‘libertarian paternalism,’ which allows for choice but provides defaults that encourage participants to choose what is likely to be in their best interest.
Default portfolios are now common in DC retirement plans. There is disagreement in the literature as to whether retirement assets should have constant equity shares or should be life-cycle or target-date funds that reduce the percentage of equity assets as a participant approaches retirement age (see, for example, Booth and Yakoubov, Reference Booth and Yakoubov2000 versus Gomes et al., Reference Gomes, Kotlikoff and Viceira2008). Despite different academic views on optimal portfolios in academic studies, life-cycle or target-date funds are now mandated in some countries. Latin American countries, including Chile, require the default investments to have a life-cycle strategy (Tapia and Yermo, Reference Tapia and Yermo2007; Berstein et al., Reference Berstein, Fuentes and Villatoro2013) as do the UK (Byrne et al., Reference Byrne, Blake, Cairns and Down2007) and Sweden (Dahlquist et al., Reference Dahlquist, Martinez and Söderlind2012).
The share of participants choosing default portfolios appears to vary considerably across countries and over time. When the Swedish government first began offering DC plans in 2000, it actively encouraged choice and about two-thirds of initial participants chose their own portfolios (Sundén, Reference Sundén2006); however, by 2003 92% of new enrollees chose the default portfolio (Cronqvist and Thaler, Reference Cronqvist and Thaler2004). Gallery and Gallery (Reference Gallery and Gallery2005) reported that only about 10% of Australians exercised investment choice in their DC investment portfolios. DC participants in the USA seem to be gradually shifting to more reliance on default plans (Mitchell et al., Reference Mitchell, Mottola, Utkus and Yamaguchi2008). In Chile, when the choice of five funds was first offered in 2002, only 14% made active choices (Tapia and Yermo, Reference Tapia and Yermo2007). In contrast, Tapia and Yermo (Reference Tapia and Yermo2007) reported that participants in Central and Eastern Europe and Hong Kong were far more active.
We found only two studies that analyzed the characteristics of participants who invested in a default plan for their DC retirements funds but several other studies that examined investors in life-cycle and target-date funds. These studies may provide insight into the characteristics of investors in Chile's life-cycle default plan. Madrian and Shea (Reference Madrian and Shea2001) found that gender, age and income affected the choice of the default plan by participants in the DC plan of a large US corporation. Cronqvist (Reference Cronqvist2006) considered how gender, age, income and funds to invest influenced the choice of the default plan in Swedish DC funds when they were first offered in 2000. Mitchell et al. (Reference Mitchell, Mottola, Utkus and Yamaguchi2008, Reference Mitchell, Mottola, Utkus and Yamaguchi2009) and Mitchell and Utkus (Reference Mitchell and Utkus2012) also used gender, age, income and 401(k)Footnote 1 balances to predict who chose life-cycle or target-date funds. Two experimental studies found that individuals with low financial knowledge were more likely to choose default funds (Agnew and Szykman, Reference Agnew and Szykman2005) or target-date funds (Morrin et al., Reference Morrin, Broniarczyk and Inman2012).
Given these very limited studies, we hypothesize that those with lower incomes will be more likely to choose the default in Chile's pension plan. Based on the two experimental studies, we predict that those with less financial knowledge will also choose the default. Three of the studies above found women and younger people were more likely to choose the default but Cronqvist (Reference Cronqvist2006) found the opposite; therefore, we consider gender and age without making a prediction.Footnote 2 The literature review also suggests that a high percentage of Chile's participants will probably choose the default funds.
Since our study also looks at how active investors choose among funds of varying risk, we briefly review the portfolio choice literature; some of this literature, however, is on investment in voluntary savings rather than in DC retirement plans.Footnote 3 A number of studies have indicated that women are more risk averse than men in many aspects of their lives, including financial decisions. (See Eckel and Grossman, Reference Eckel and Grossman2008 and Croson and Gneezy, Reference Croson and Gneezy2009 for reviews of this literature.) Especially when not controlling for financial knowledge and willingness to take risks, studies have found that women are likely to hold smaller shares of equity in their portfolios (Barber and Odean, Reference Barber and Odean2001; Agnew et al., Reference Agnew, Balduzzi and Sundén2003; Van Rooij et al., Reference Van Rooij, Lusardi and Alessie2011; Halko et al., Reference Halko, Kaustia and Alanko2012). However, Säve-Söderbergh (Reference Säve-Söderbergh2012) observed that the overall gender difference in risky investments for her Swedish sample was small.
Marital status and interaction of marital status and gender have sometimes been found to influence investment decisions, but the findings are not consistent (Papke, Reference Papke1998; Sundén and Surette, Reference Sundén and Surette1998; Bernasek and Shwiff, Reference Bernasek and Shwiff2001; Agnew et al., Reference Agnew, Balduzzi and Sundén2003; Gerrans and Clark-Murphy, Reference Gerrans and Clark-Murphy2004; Arano et al., Reference Arano, Parker and Terry2010; Van Rooij et al., Reference Van Rooij, Lusardi and Alessie2011; Halko et al., Reference Halko, Kaustia and Alanko2012). On the other hand, marital status was not significant in studies of Swedish (Säve-Söderbergh, Reference Säve-Söderbergh2012), Dutch (Van Rooij et al., Reference Van Rooij, Lusardi and Alessie2011), Chilean (Barrientos and Ruiz, Reference Barrientos and Ruiz2011) and Finnish investors (Halko et al., Reference Halko, Kaustia and Alanko2012).
The effect of age on investment in equity has varied in studies. In some cases, it appeared that the older people followed a life-cycle investment strategy and invested less in equity as they aged (Dwyer et al., Reference Dwyer, Gilkeson and List2002; Agnew et al., Reference Agnew, Balduzzi and Sundén2003; Calvet et al., Reference Calvet, Campbell and Sodini2007). Säve-Söderbergh (Reference Säve-Söderbergh2012) found age had a nonlinear effect on the decisions of Swedish investors when DC retirement plans were introduced in 2000. Other studies have found that age was not a significant factor in explaining equity investment (Sundén and Surette, Reference Sundén and Surette1998; Bernasek and Shwiff, Reference Bernasek and Shwiff2001; Van Rooij et al., Reference Van Rooij, Lusardi and Alessie2011; Almenberg and Dreber, Reference Almenberg and Dreber2012; Halko et al., Reference Halko, Kaustia and Alanko2012).
Education has been found to increase the willingness of investors to choose equity in some studies (Dwyer et al., Reference Dwyer, Gilkeson and List2002; Calvet et al., Reference Calvet, Campbell and Sodini2009; Van Rooij et al., Reference Van Rooij, Lusardi and Alessie2011; Almenberg and Dreber, Reference Almenberg and Dreber2012; Halko et al., Reference Halko, Kaustia and Alanko2012), but in others education has not been significant (Sundén and Surette, Reference Sundén and Surette1998; Agnew et al., Reference Agnew, Balduzzi and Sundén2003). Income and/or accumulated wealth appeared to positively affect equity investments (Dwyer et al., Reference Dwyer, Gilkeson and List2002; Calvet et al., Reference Calvet, Campbell and Sodini2007; Iyengar and Kamenica, Reference Iyengar and Kamenica2010; Van Rooij et al., Reference Van Rooij, Lusardi and Alessie2011; Almenberg and Dreber, Reference Almenberg and Dreber2012; Halko et al., Reference Halko, Kaustia and Alanko2012; Säve-Söderbergh, Reference Säve-Söderbergh2012), but Halko et al. (Reference Halko, Kaustia and Alanko2012) also found a negative effect for income after controlling for attitudes toward risk. In a very detailed study of Swedish twins, Calvet and Sodini (Reference Calvet and Sodini2014) found that investment in risky assets was an increasing function of liquid financial wealth (excluding retirement assets and real estate). In addition, they developed a human capital variable based on the present value of future income and found it had a significant positive effect on investment in risky assets.
A number of studies looked at the effect of financial knowledge on willingness to invest in equity and share of equity. (A good review of many of these studies can be found in Van Rooij et al., Reference Van Rooij, Lusardi and Alessie2011.) These studies have generally found that more financial knowledge encourages investors to take more risks in their portfolios. Landerretche and Martínez (Reference Landerretche and Martínez2013) found that people with greater knowledge of Chile's pension plan were also more likely to have additional financial savings outside of their pension plan. Many studies have argued that on average women, younger and older people (as opposed to middle-aged people), less educated people and people with low incomes and little wealth have less financial knowledge (Agnew and Szykman, Reference Agnew and Szykman2005; Almenberg and Säve-Söderbergh, Reference Almenberg and Säve-Söderbergh2011; Van Rooij et al., Reference Van Rooij, Lusardi and Alessie2011; Atkinson and Messy, Reference Atkinson and Messy2012; Lusardi, Reference Lusardi2012) and are thus less likely to invest in risky assets.
Studies have tried to control for financial knowledge in a number of ways. Some studies used very basic measures of numeracy, compound interest, inflation and risk diversification to measure financial knowledge (Lusardi and Mitchell, Reference Lusardi and Mitchell2007b , Reference Lusardi and Mitchell2008; Lusardi, Reference Lusardi2012), while other studies used measures of advanced financial knowledge or both basic and advanced financial knowledge. A number of studies have found that when they controlled for financial knowledge, gender differences in risk taking were reduced or disappeared (Dwyer et al., Reference Dwyer, Gilkeson and List2002; Van Rooij et al., Reference Van Rooij, Lusardi and Alessie2011; Almenberg and Dreber, Reference Almenberg and Dreber2012; Halko et al., Reference Halko, Kaustia and Alanko2012).
Finally, several studies have used measures of willingness to take risks to explain investment in equity assets. When this measure was included in the empirical analysis, it generally reduced or eliminated any gender effects (Barrientos and Ruiz, Reference Barrientos and Ruiz2011; Almenberg and Dreber, Reference Almenberg and Dreber2012; Halko et al., Reference Halko, Kaustia and Alanko2012).
Based on this literature review, we tentatively hypothesize that, among the active investors, women and older people will invest in less risky assets. It is likely that those with more education, more income and more savings will invest in riskier assets. Greater financial knowledge and willingness to take risks should lead to investment in riskier assets, and the inclusion of these two variables in the analysis should reduce or eliminate the gender effect. We do not predict what effect marital status is likely to have as the effects of marital status in previous studies have been so varied; however, we include marital status and gender/marital status interaction variables as some studies found differences by marital status.
3 The Chilean Pension Fund System
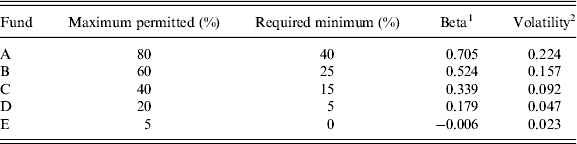
The Chilean Pension Fund System was radically changed in 1981 when a system based on individual capital accounts was introduced. The new system required all workers to save 10% of their monthly salaries in their individual accounts, which are administered by private agents called Pension Fund Administrators (AFPs). Initially there were 15 AFPs but because of mergers there are now only six (Raddatz and Schmukler, Reference Raddatz and Schmukler2011). The salary contribution is deducted by the employers, who must make the payment to the AFP. Since the end of 2002, workers have had the opportunity to choose among five funds characterized by the amount of equity in the portfolio and therefore risk; these are funds A, B, C, D and E, with Fund A having the greatest risk and Fund E having the least. Appendix 1 shows the restrictions of risk for each fund, as well as the estimated beta and volatility for each fund. All the AFPs must offer Funds B, C, D and E, while Fund A is voluntary; however, all the AFPs offer a Fund A. The AFPs must publish the contents of their investment portfolios each month and must send all participants a report with the details of the individual accounts every quarter. In 2009 it was not mandatory that self-employed people contribute to the pension but it will be as of 2015.
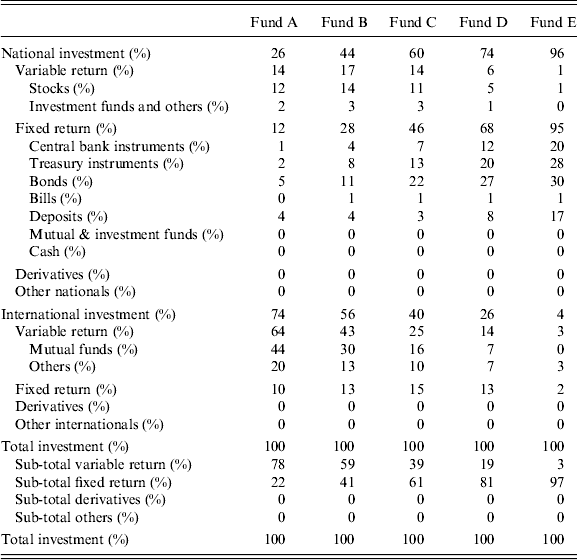
Members can change funds within an AFP whenever they wish without a transaction fee; they can also hold assets in two funds. The only restrictions are with respect to age and retirement status; men over 56 and women over 51 cannot hold their assets in Fund A, whereas those who are retired can only choose among Funds C, D and E. If new members do not choose a fund when they enter the system, they are assigned to a default fund, which depends on their age and genderFootnote 4 . The default fund for persons 35 or younger is Fund B, whereas the fund for women between 36 and 50 and for men between 36 and 55 is Fund C. For women over 50 and older and men over 55, the default is Fund D. The change in the default fund takes place over 5 years, with 20% of the portfolio transferred each year. (For more information on the default plan, see Berstein et al., Reference Berstein, Fuentes and Villatoro2013 in this journal.) Participants can also contribute more than required to their pension funds or hold separate voluntary savings accounts (APVs) in their AFP (Landerretche and Martínez, Reference Landerretche and Martínez2013). Table 1 shows the investment in the pension funds disaggregated by markets and instruments. Fund A holds 78% in variable return, very close to the limit upper limit, whereas Fund E holds 97% in fixed returns.
Pension fund investment disaggregation by markets and instruments (December 2013)

4 Data and methodology
The data used in this study were obtained from the Survey of Social Protection (SSP) 2009 (Sub-secretariat of Social Prevision of Chile, 2009), based on a survey of more than 14,000 persons; however, only 9,840 were in the AFPs (the others belonged to the old pension system), and only 5,543 answered that they were contributing as of the time of the survey. Of the 4,297 people who were not contributing, 1,400 were not required to contribute, 880 were retired and the rest had different reasons or they were not working in the formal sector. The 2009 data included general background information on the participants including gender, age, marital status, unemployment status, income for the last month, education level, financial knowledge, willingness to take risks, savings in the AFP, the AFP fund selected and many other statistics about the family, home, property and retirement status.
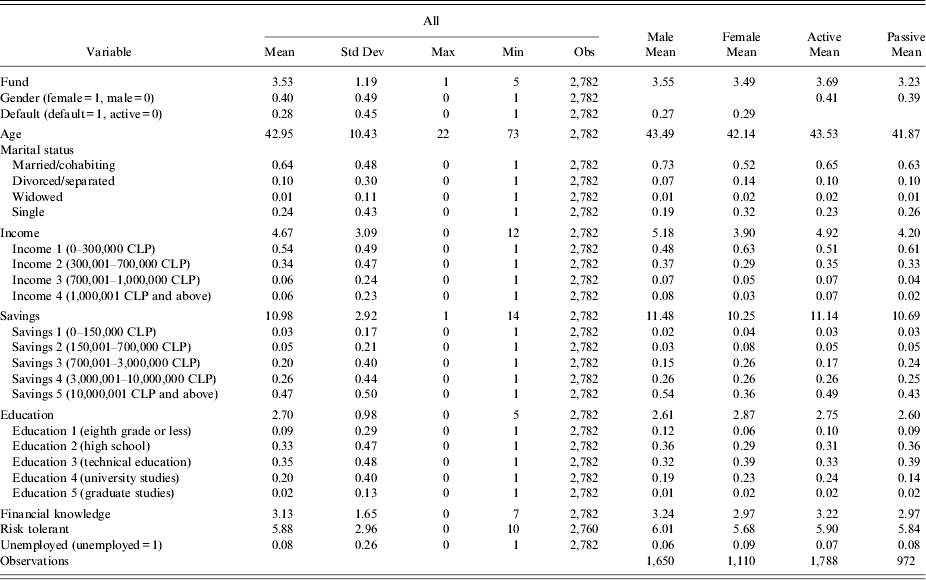
Our analysis is based on those surveyed who were not retired and who answered most of the questions, particularly the question on which fund their pension money was in; unfortunately only about one half knew their pension fund. Our final sample includes 2,782 persons (and slightly fewer in the probit analysis because of other missing data). The mean values of the variables are shown in Table 2; mean values are also shown by gender and by active and passive management of funds. In this sample 60% were men and 40% were women. The mean age of the men was 43 and of the women, 42, a statistically significant difference.Footnote 5 The mean value of the fund was lower for women than for men but the difference was not statistically significant. Marital status was significantly different for men and women; the women were less likely to be married/cohabiting than the men and were more likely to be divorced, separated or widowedFootnote 6 . Income is referred to as net monthly salary, expressed in Chilean pesos (CLP), and tabulated according to the 12 ranges used by the Sub-secretariat.Footnote 7 Men had significantly higher salaries than the women. The accumulated savings in the individual accounts were measured as of the time of the survey, and were classified into 14 categories according to the system of the Sub-secretary.Footnote 8 On average the men had more savings than the women; this was consistent with the salary differences since the amount they must save is proportional to salary.
Descriptive statistics

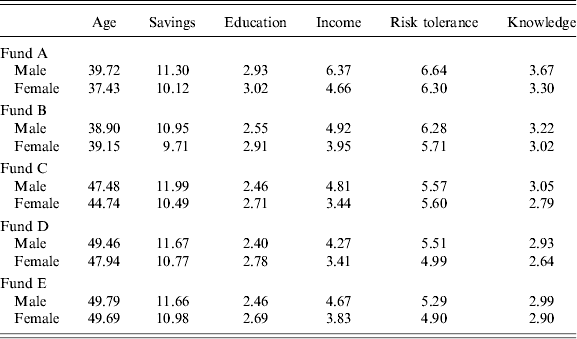
The educational level was classified in five categories: 1 no education through eighth grade; 2 high school education; 3 technical education; 4 university studies; and 5 graduate studies. The women surveyed had a significantly higher level of education than the men. The 2009 survey also asked respondents to answer several questions measuring their financial literacy (devised by Lusardi and Mitchell, Reference Lusardi and Mitchell2007a , Reference Lusardi and Mitchell b ; and used by Hastings and Tejeda-Ashton, Reference Hastings and Tejeda-Ashton2008 and Hastings et al., Reference Hastings, Mitchell, Chyn, Mitchell and Lusardi2011). Financial knowledge was measured by the number of correct answers to the survey questions. Since there were a number of questions, we selected only those seven that are related to financial knowledge. The questions used can be found in Appendix 3. These questions measure numeracy and an understanding of compound interest, inflation and diversification of risk as described in the literature review. Since the questions are relatively basic, we assume that the direction of causality is from financial knowledge to portfolio choice. The mean for the sample studied is 3.13 and, as expected, the mean financial knowledge of the women was significantly lower than that of the men. Following the general risk measure of Dohmen et al. (Reference Dohmen, Falk, Huffman, Sunde, Schupp and Wagner2011), the survey asked the following question (translated from Spanish): ‘On a scale of 0 to 10 where 0 signifies you are not disposed to assume risk and 10 signifies you are very disposed to take risk, how do you describe yourself on this scale?’ The average score was 5.88 and in accordance with the literature, women were significantly less willing to take risks than the men. About eight percent of the sample were unemployed; women were significantly more likely to be unemployed than men. Additional analysis of the variables by fund can be found in Appendix 2. According to the SSP 2009, 91% of the sample of participants in the pension funds held their savings in only one fund. The remaining 9% were those who chose to hold two funds and those in default funds whose funds were being shifted to a less risky fund because of their age. This 9% were assigned to the fund in which they held the greater amount of assets.
The models we analyzed are based on the investment decisions by Chilean workers. We focused on the decision as to the type of fund and not on the AFP selected because herding behavior of AFPs leads them to mimic each other (Raddatz and Schmukler, Reference Raddatz and Schmukler2011); thus the risk characteristics of the various funds are nearly identical regardless the AFP.
We first developed a probit model to analyze what variables determine whether the participant is actively managing his or her retirement funds or is in a default fund. Then we used an ordered probit model to determine what variables predict the fund choices of those participants not in the default fund.
5 Analyses of results
5.1 Active or passive management
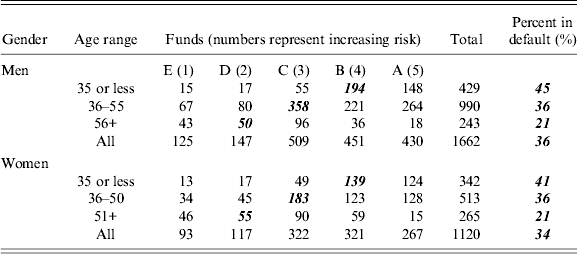
In Table 3, we show the number of participants holding the five funds by age category and gender. Those holding the default funds are shown in bold italics. The table indicates that 36% of the men and 34% of the women held the default funds. This is a much smaller percentage than was true when the five funds were first introduced and 86% held default funds (Tapia and Yermo, Reference Tapia and Yermo2007). The percentage holding default funds decreased with age as predicted, but relatively more young men (35 or under) held default funds than young women.
Investment in funds by gender and default age categories (Defaults are in bold italics)

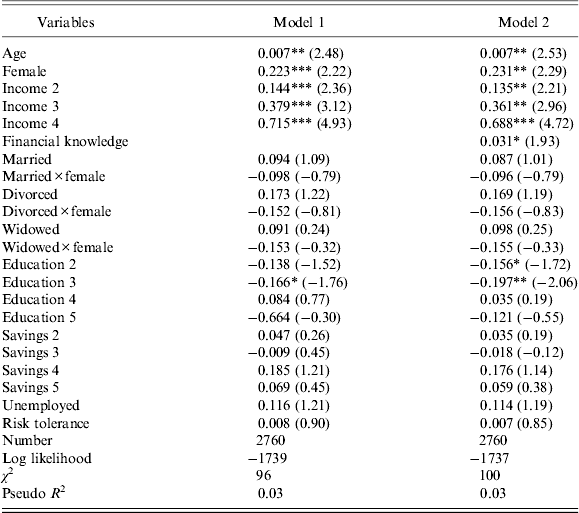
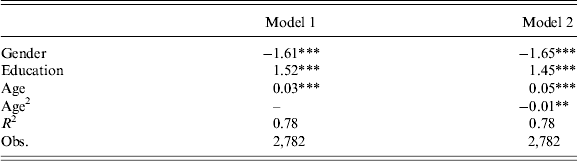
Next we used probit analysis to explain the choice of active management over the default. Our explanatory variables from the literature review on choice of default and/or life-cycle funds included age, gender, income and financial knowledge. We also added marital status, gender/marital status interaction, education, accumulated assets in the plan, unemployment and willingness to take risks; these additional variables (except unemploymentFootnote 9 ) were ones that we identified as potentially affecting the choices of active investors and we included them to see if they also might have affected the choice of active or passive management (see Table 4). In model 1, we included all the variables except financial knowledge. We postponed adding financial knowledge to model 2 because we were interested in seeing how financial knowledge might affect the gender and other coefficients. The results of model 1 indicate that older people and women were significantly more likely to actively manage their pension funds. Also, the higher the income category, the more likely participants were to manage their own investments. Except for technical education, none of the other variables in the analysis is statistically significant. In model 2, the coefficient for financial knowledge is positive and statistically significant, but adding it did not reduce the gender coefficient or have much effect on the other variables (except that now high school education is also significant). Since regression analysis indicated that the income categories were a very significant function of gender, age and education categories (see Appendix 4), we ran additional analysis excluding the income categories, but doing so had almost no effect on the other coefficients. The only changes were in education where the coefficient for university education was positive and significant and the high school and technical education variables were no longer significant.
Probit estimates of active investment versus default investment

***, ** and * indicate significance at the 1%, 5% and 10% confidence levels, respectively. Dependent Variable is 1 if Active Management or 0 if Passive.
Some of our findings were consistent with our hypotheses and some are not. Our prediction that most participants would choose the default was not supported. Far fewer participants chose the default funds in 2009 compared to when they were first offered. As predicted we found that people with lower incomes and people with less financial knowledge were more likely to hold default funds. Like most of the studies except that of Cronqvist (Reference Cronqvist2006), we found that older people were more likely to actively manage their portfolios. However, like Cronqvist and in contrast to the other studies, we found women were more likely to actively manage their portfolios than men. Based on the literature review, we also predicted that adding financial knowledge would reduce the size and significance of the gender coefficient, but it did not. Except for two of the education variables, none of the additional variables that we hypothesized would affect the choices of active investors were significant in predicting active versus passive management. Our literature review found in some studies that accumulated funds were positively correlated with active management. However, in this study accumulated funds were primarily a function of age and income and thus we correctly did not expect them to have an independent effect on active management. When we ran additional analysis leaving out the insignificant variables, there was little effect on the significant coefficients.
5.2 Fund choice for active managers
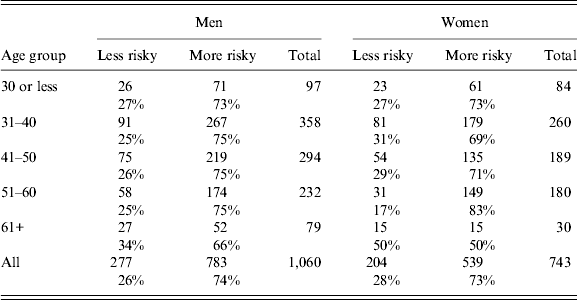
Next we looked at active managers to determine what factors affected their choice of funds. Table 5 shows the number of participants who chose more risky funds and less risky funds than the default funds by gender and age groups. This table indicates that overall 74% of the men and 73% of the women preferred more risky funds than the defaults. For men and women 30 and under the percentage choosing riskier funds was almost the same. In the age groups from 31 to 50, the percentage of men investing in riskier assets was a few percentage points higher than for women. In the age group 50–60, more women appeared to want risky funds but this may only be because the default fund for women 51–55 was the less risky Fund D while for men it was the more risky Fund C. For those 61 and older, the majority of the men still chose more risky funds but the small number of women was evenly divided between risky and less risky funds.
Active investors who invest in less risky and more risky funds than the default fund by age group

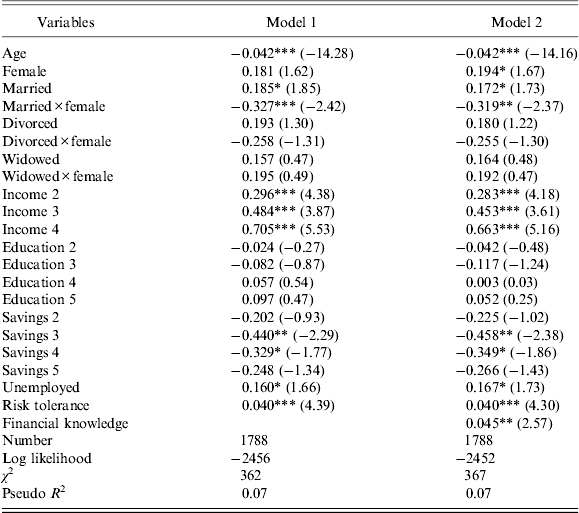
We used ordered probit analysis to explain the choice of funds for those who actively managed their pension funds. Our results are shown in Table 6. Based on our literature review, in model 1 we included age, gender (female), several measures of marital status (married/cohabiting, divorced, widowed), marital status/gender interaction variables, income categories, education categories, accumulated savings categories, a dummy variable for unemployment and a measure of willingness to take risk. In model 2, we added our measure of basic financial knowledge.
Ordered probit analysis of active investors

***, ** and * indicate significance at the 1%, 5% and 10% confidence levels, respectively. Ordered Probit estimation results. Dependent Variable Fund Lowest Risk = 1 to Fund Highest Risk = 5.
Since adding financial knowledge had little effect on the other coefficients, we discuss the results of the two models together. The age coefficient is negative and significant, indicating that older members tended to invest in less risky assets. The coefficient for gender (female) is positive in both models and significant in model 2. The married coefficient is positive and significant. The married by gender coefficient is negative and significant. The divorced and widowed variables and their interactions with gender are not significant. Thus we concluded that married women tended to invest in less risky assets than single men and married men. While the single women were more likely to invest in risky assets than the single men, the married men tended to invest in more risky assets than the single men. The coefficients for income categories are positive and significant and increase with the income category, showing that the higher a member's income, the more likely he or she was to invest in risky assets. None of the education variables is statistically significant. The coefficients for accumulated saving suggest that members with savings between 700,001 and 10 million CLP tended to invest in less risky assets than those with smaller or larger savings. The unemployment coefficient was positive and significant; we believe this variable might be capturing the effect of a temporary fall in income when a person was unemployed. The coefficient of the risk tolerance variable is positive and significant, indicating that investors with higher risk tolerance invested in riskier assets. The coefficient of the financial knowledge variable added in model 2 is also significant and positive and predicts that members with more basic financial knowledge invested in riskier funds. The addition of this variable had little effect on the size and significance of the coefficients, including the gender coefficients.
In addition to models 1 and 2 we ran some other analyses which we briefly summarize. We included age squared to test for a nonlinear relationship between age and investment choice; however, age squared was not significant. Adding risk tolerance separately had no significant effect on the other coefficients. Because income was so closely related to gender, age and education, we excluded the income variables from the analysis. When we did this, the coefficients for university studies and graduate studies were positive and significant, indicating that people with higher levels of education were more willing to invest in risky assets. The coefficient for financial knowledge was also larger. The gender coefficient was still positive but no longer significant. The coefficients for being married and the married female interaction variables actually increased slightly in magnitude and statistical significance. The unemployment coefficient decreased considerably and was no longer significant. We also ran ordinary multiple regression analysis on the variables, using three different measures of the dependent variable: the funds (as we did for the ordered probit analysis); the betas of the five funds; and the volatility of the five funds. Although the coefficients of the explanatory variables differed in magnitude, their signs and statistical significance were the same as those in the ordered probit analysis. These results are available from the authors.
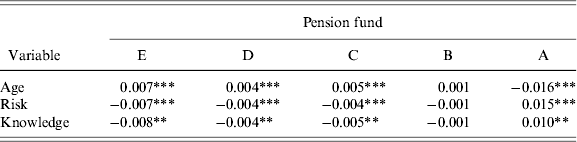
In the analysis of the marginal effects on the choice of fund (shown in Table 7), we see that the greater the age the higher the probability of remaining in Fund E, while each unit of greater financial knowledge or risk tolerance increases the probability of changing to a higher risk fund. The same happens in the case of Funds D and C, but the marginal effects of each variable are almost half the magnitude of those for Fund E. In the case of Fund B, the marginal effects of those variables are not significant, implying that the people in this fund changed for other reasons. Finally, in the case of Fund A the marginal effects are reversed, implying that at an older age the people that are found in Fund A tended to change to a fund of less risk, while reaffirming their choice if they had greater risk tolerance or greater financial knowledge.
Marginal effects analysis for fund selection model

*** and ** indicate significance at the 1% and 5% confidence levels.
Our findings on active investment support some of our hypotheses but not others. Consistent with most of the literature review, we found that investing in risky assets generally decreased with age. However, it should be noted that part of the age effect might be due to the fact that people within 10 years of the normal retirement age could not invest in the most risky fund (Fund A). As we hypothesized, risk taking increased with income, financial knowledge and risk tolerance. On the other hand, higher levels of savings did not increase risk taking, even when income was excluded; this finding differs from several studies in the literature on voluntary liquid financial assets including that of Calvet and Sodini (Reference Calvet and Sodini2014). Education had a positive impact on risk taking only when income was excluded.
The gender results were more complicated than predicted. Young and single women seemed to be more willing to invest in risky assets than young and single men. This contradicts the general findings of the literature. It appeared that being married has opposite effects on men and women. Married men tended to invest in more risky assets and married women tended to invest in less risky assets than the rest of the sample. These results did not change when we controlled for financial knowledge and/or for risk tolerance.
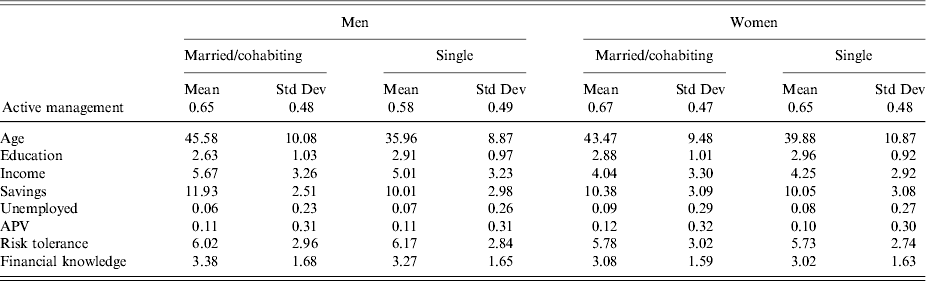
Since these gender and marital interaction results were somewhat surprising, we looked more closely at the average values of the explanatory variables for married and single men and women, as shown in Table 8. This table shows the fraction of married and single men and women who actively managed their retirement funds and then the average values of the explanatory variables for those who were active managers. The income and savings variables were the original categories rather than the collapsed categories used in the probit analysis. The results showed that about equal percentages of married women and men actively managed their retirement assets (67% versus 65%) but single women were more likely to manage their portfolios than single men (65% versus 58%). Single women who managed their portfolios were also older on average than single men (39 versus 36) and we know that active management increased with age. Single women were on average younger than married women and they had less accumulated savings; otherwise there were no significant differences. The married men had more income and slightly more financial knowledge than single men, which might explain more risky investment; on the other hand, they were older, less risk tolerant and less educated and had more savings than single men, which would suggest less risky investment.
Mean values of the explanatory variables for married versus single men and women who are active managers

6 Conclusions
One finding of our study was that about two-thirds of the participants in Chile's DC pension plan included in our sample were actively managing their pension funds in 2009. We had expected a much lower percentage; however, Tapia and Yermo (Reference Tapia and Yermo2007) did mention that active management in Chile had increased since 2002. There are two caveats to this conclusion and they are likely to have opposite effects. One is that the survey data did not specifically indicate which participants were in the default plan. Thus we assumed anyone holding a default fund was not actively managing his or her plan, but it is likely that some of those participants were active managers. On the other hand, only half of the participants surveyed knew in what fund their assets were invested. It is possible that those who did not know were more likely to be default participants. Since our analysis includes only those who knew their funds, we may have underestimated the percentage choosing the default. As predicted, we found that older people and people with more income and more financial knowledge were more likely to manage their retirement funds. However, in contrast to most of the studies, we found that more women, especially young women, were actively managing their portfolios paragraph.
When we looked at the investment decisions of active investors we found the following expected results: risk-taking decreased with age and increased with income, risk tolerance and financial knowledge. Although we looked only at income in 2009 rather than the present value of future income as Calvet and Sodini (Reference Calvet and Sodini2014) used in their twin study, both studies show the strong positive effect of income on risk taking. In additional analysis available from the authors, we also found that participants were more likely to hold separate voluntary savings (APVs) within the pension fund the higher their income and their financial knowledge.
We predicted that accumulated savings would positively affect risk taking, but the coefficients for savings were all negative and only a couple were statistically significant even when income was excluded. Thus increased total savings appeared to lead to less risk-taking, even though we controlled for age. The literature review found mixed results for savings but the twin study of Calvet and Sodini (Reference Calvet and Sodini2014) found a strong relation between risk taking and total voluntary financial assets. Our study was unable to control for all the factors that Calvet and Sodini were able to control for, but it does suggest that greater savings in a pension fund did not lead to greater risk taking. If there was greater risk taking with wealth, it was likely to be in voluntary savings. A few education coefficients had the predicted positive coefficients but were only significant when income was excluded. Thus education seemed to have its main effect through its impact on income.
Our gender and married interaction results were somewhat surprising although a few of the studies we reviewed found being married had different effects on men and women. It did appear that young women, especially single women, were as willing to invest in risky funds as men. It will be interesting to see whether that continues as the cohort ages, or whether the women become more risk averse than men as they age. Other things being equal, married men invested in more risky assets and married women invested in less risky assets than their single counterparts.
Financial knowledge and risk tolerance both had significant positive coefficients, indicating that higher values of both led to greater risk taking. Landerretche and Martínez (Reference Landerretche and Martínez2013) also found that greater financial knowledge led to greater investment outside of the pension fund. What was unusual about our results was that adding financial knowledge or risk taking separately or together had little effect on the other coefficients in the analysis. Most of the studies we reviewed in the literature section found that adding these variables to the analysis reduced the size and significance of other coefficients, particularly the gender coefficients. Our study found that Chilean women on average had less financial knowledge and less risk tolerance than Chilean men, yet controlling for these variables did not reduce the size of the gender coefficient and had little effect on the other coefficients.
Another complication of this study is that it took place in 2009, the first full year of the global financial crisis when there were negative returns and high volatility in the Chilean equity markets as well as in equity markets around the world. In additional analysis, we performed on the 236 participants who reported that they had changed funds one or more times since 2006 and whom we could match between 2006 and 2009, we found that 41% had moved to a less risky fund by 2009 while only 17% had moved to a more risky fund (42% must have made offsetting changes since they were in the same funds in 2006 and 2009). We hope that the Sub-secretary of Social Protection will conduct the same survey in a more stable financial period, so that investment behaviors can be compared.
Acknowledgements
The authors would like to thank the editors and several anonymous reviewers for their very helpful comments on earlier versions of this paper. We would also like to thank Universidad Técnica Federico Santa María and its Departamento de Industrias for funding Dr. Kristjanpoller's visit to the University of Pittsburgh in 2012–2013, during which we began this research.
Appendix
Variable return investment limits by fund and their betas and volatilities

Descriptive statistics by gender and fund

Appendix 3. Questions Related to Financial Knowledge
-
1. If there exists a 10% probability, how many of 1,000 persons will contract a disease?
-
2. Five people win a prize of two million. How much will each one receive?
-
3. You have US$100 in a savings account with a 2% annual interest rate. How much will you have at the end of 5 years?
-
4. You have US$200 in a savings account. The account accumulates 10%. How much will you have in the account at the end of 2 years?
-
5. If the AFP ‘A’ had a profitability of 15% the past year and the AFP ‘B’ had a profitability of 20%, which AFP will have the greater profitability next year?
-
6. You possess a savings account that delivers interest of 1% annually and you know that the rate of inflation is 2% annually. After 1 year you will be able to buy….?
-
7. To buy shares of one company is less risky than to use the same amount of money to buy various shares of different companies. True or False.
Regression estimation results; 12 income categories explained by gender, education and age