Implications
This study identified quantitative trait loci (QTLs) associated with six osteochondrosis traits. In contrast with previous studies, this study investigated QTLs segregating within a commercial pig breed and used a large number of pigs. The number of detected QTLs exceeding a stringent significance threshold was large compared with previous studies, and an investigation of collocation of the detected QTLs for the different traits provided a better understanding of how these six traits are associated. Along with other work on the relationship between osteochondrosis and growth rate and health effects, this study is therefore important in that it provides the commercial pig industry with information about the possibility of using DNA-based selection against osteochondrosis.
Introduction
Osteochondrosis is a non-infectious, degenerative condition of the cartilage with secondary changes in the bone (Ytrehus et al., Reference Ytrehus, Ekman, Carlson, Teige and Reinholt2004). It is seen in growing animals, and for pigs the highest prevalences of articular lesions are seen in the joints of the stifle and elbow (Reiland, Reference Reiland1978). The elbow has the highest prevalence of the severest forms of osteochondrosis, including osteochondrosis dissecans (OCD) (Jørgensen et al., Reference Jørgensen, Arnbjerg and Aaslyng1995). Genetic factors, growth rate, lean meat percentage and mechanical stress are all thought to play a role in the development of osteochondrosis (Nakano and Aherne, Reference Nakano and Aherne1988; Stern et al., Reference Stern, Lundeheim, Johansson and Andersson1995; Kadarmideen et al., Reference Kadarmideen, Schwörer, Ilahi, Malek and Hofer2004). Osteochondrosis is likely to have some impact on the prevalence of lameness in growing pigs and on longevity in adult animals, both of which are traits of interest to the pig industry.
Osteochondrosis lesions may only be recorded either after the animals have been slaughtered or using X-ray techniques on live animals (Jørgensen and Andersen, Reference Jørgensen and Andersen2000), which are labour-intensive and time-consuming procedures. Consequently, osteochondrosis would be difficult to select against using traditional breeding methods, and it is therefore of interest to use marker-assisted selection, where selection is performed against individuals carrying a certain haplotype without the need to measure the trait on that particular individual. A quantitative trait locus (QTL) is a chromosomal region containing genes affecting a given trait. Lee et al. (Reference Lee, Archibald, Garth, Law, Nicholsen, Barr and Haley2003) detected two QTLs for osteochondrosis lesions on pig chromosome (Sus scrofa chromosome, SSC) 7 and SSC 16 using 308 F2 pigs from a crossbred Large White × Meishan population, but neither of the QTLs was significant at a 5% chromosome-wide level. Andersson-Eklund et al. (Reference Andersson-Eklund, Uhlhorn, Lundeheim and Dalin2000) studied 195 F2 pigs from a crossbred wild boar × Large White population and found QTLs on SSC 5, SSC 13 and SSC 15 for an osteochondrosis index made by principal component analysis on four recordings on the left knee and elbow. The only QTL that was significant at a 5% genome-wide level was the one on SSC 5, which was located in a region homologous to a region on human chromosome 12, where a potential candidate gene, cartilage homeoprotein 1 (Cart 1), was located (Andersson-Eklund et al., Reference Andersson-Eklund, Uhlhorn, Lundeheim and Dalin2000). The two above-mentioned studies both used a limited number of animals and only identified QTLs that explained between-breed variation.
In joints with osteochondrosis, the following macroscopically visible lesions are typical findings: focal thickening of epiphyseal cartilage, irregular cartilage surfaces, fissures between cartilage and subchondral bone, OCD and lesions in subchondral bone (Reiland, Reference Reiland1978; Hill et al., Reference Hill, Ruth, Hilley and Hansen1984). However, the diagnosis of osteochondrosis presupposes a histopathological examination, and it is not entirely clear and well defined, which macroscopically visible joint abnormalities are parts of the osteochondrosis complex. In the elbow, all of the above-mentioned lesions can be found. In addition, depression of the proximal edge of the radius and an irregular sagittal central groove of the condylus humeri may also be part of the osteochondrosis complex.
The aims of this study were twofold: (i) to identify QTLs segregating within the Danish Duroc breed for six osteochondrosis traits (thickening of the cartilage, lesion in the subchondral bone, irregular cartilage surface, fissure under the cartilage, an irregular sagittal central groove, and depression of the proximal edge of the radius) measured in the elbow of finishing pigs, (ii) to investigate whether the six traits share the same QTLs. In contrast with previous studies, this study used a large number (7172) of animals.
Material and methods
Study design
The study comprised 7172 pigs (castrates and female pigs) from 875 litters in three commercial production herds during the years 2000 to 2001. The pigs were produced under conditions typical of intensive commercial pig production systems in Denmark, that is, high stocking density, no or only little straw and fully or partially slatted floors in the pens. It was assumed that this would result in more osteochondrosis cases than if the pigs had been produced in less intensive systems where the pigs’ joints would probably have been subjected to less mechanical stress. All pigs were offspring of 12 purebred Duroc boars from DanBred. Boars were selected from among Danish Duroc AI-boars based on the highest selection index (the commercial index used in DanBred’s nucleus breeding programme) and minor pedigree relationships with each other. Thus, no full-sib and half-sib boars were selected, and only three boars had one grandparent in common. Sows were crosses between Danish Landrace and Danish Large White. Litters originated from 600 sows, of which 380, 165 and 55 had one, two and three litters, respectively. Littermates were kept together from birth to slaughter so that they shared the same environment. When the largest pig in a litter reached 110 kg, all litter mates were slaughtered on the same day. Further details about the study design can be found in the paper by Jørgensen and Nielsen (Reference Jørgensen and Nielsen2005), which was based on the same osteochondrosis data.
On the day of slaughter, tissue samples from muscle (tenderloin) were taken and later used for purification of DNA.
Recordings of joint lesions
After slaughter, each left elbow joint was examined for osteochondrosis by one of three scorers (veterinarians), according to Jørgensen et al. (Reference Jørgensen, Arnbjerg and Aaslyng1995). As osteochondrosis lesions are usually bilaterally symmetrical (Reiland, Reference Reiland1978; Hill et al., Reference Hill, Ruth, Hilley and Hansen1984), it was decided to examine the left elbow joint only. First, lesions visible on the surface of the articular cartilage were recorded. Afterwards, the condylus humeri was cut through the typical location for osteochondrosis with a band saw, and further recordings were made. The cut was perpendicular to the surface of the cartilage and to the axis of the joint. Due to a low frequency of observed lesions on the lateral part of the condyle, only lesions on the medial part of the condyle were investigated in this study.
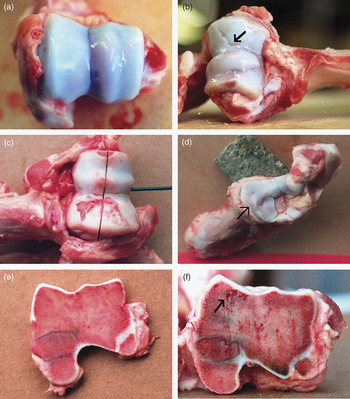
Table 1 contains a description of the osteochondrosis traits that were used in the subsequent data analysis. It was assumed that all six traits in Table 1 were part of the osteochondrosis complex (see Introduction). Examples of some types of lesions are shown in Figure 1. All traits were scored on a scale from 1 (normal) to 5 (severe lesions), except for fissure between cartilage and bone (FISS), which was scored as a presence/absence of the trait. For irregular joint surface (SURF), a score of 1 to 4 represented increasing severity of irregularity/invagination of the cartilage, whereas score 5 was used for OCD only. The traits and the definitions used in this study are identical to those used in Jørgensen and Nielsen (Reference Jørgensen and Nielsen2005).
Osteochondrosis traits used for the data analysis

The traits THICK, BONE and FISS describe lesions that were visible only after cutting through the condylus humeri. The traits are described further in Jørgensen et al. (Reference Jørgensen, Arnbjerg and Aaslyng1995).
Examples of osteochondrosis lesions. (a) normal regular surface (score 1) of the condylus humeri with the sagittal central groove (score 1) in the middle. (b) Condylus humeri with invagination of the cartilage (arrow; score 3) and an irregular central groove (score 3). (c) Osteochondrosis dissecans on the medial part of the condylus humeri (score 5) and an irregular central groove (score 2; the condyle has been cut through). (d) depression of the proximal edge of the radius (cranio-medially; score 4). The edge is not sharp but rounded, and thus the joint surface of the radius does not form a well-defined socket for the condylus humeri. (e) cross-section through the condylus humeri. Normal cartilage and bone (scores 1). (f) cross-section through the condylus humeri with thickening of cartilage (score 3) and lesion in sub-chondral bone (arrow; score 4).

The single nucleotide polymorphism (SNP) markers and the genetic map
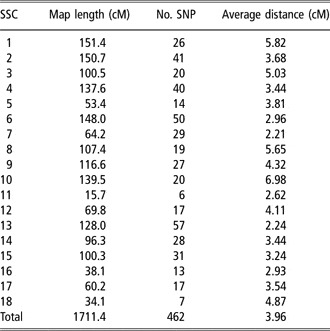
The marker data and the genetic maps consisted of 462 SNP markers positioned on 18 autosomes with an average distance of 3.96 centiMorgan (cM) between the markers. The maps were constructed using CRIMAP v. 2.50, an improved version of CRIMAP v. 2.4 (Green et al., Reference Green, Falls and Crooks1990) developed by Jill Maddox and Ian Evans (Jill Maddox, University of Melbourne, personal communication). The number of markers on each chromosome ranged from 6 to 57 (see Table 2), and the genetic maps covered a total of about 80% of the genetic sequence on the 18 autosomes. SNP markers were used in the study as high-throughput genotyping of SNPs is fast and cost-efficient (Evans and Cardon, Reference Evans and Cardon2004). The SNPs were identified in sequence alignments of amplicons containing coding regions of genes derived from expressed sequence tags and genomic shotgun sequences. Re-sequencing of the 12 Duroc boars was performed to ensure segregation of each SNP within at least one of the families. For the 12 boars, an average of 42% of the SNPs were informative. Genotyping was carried out either by TaqMan oligo-displacement assay (Array-by-Design) or SNPlex Genotyping System (PE, Applied Biosystems, Foster City, CA, USA). The use of genic SNPs provided the opportunity to use the human-pig comparative map as a guideline for verification of the SNP order while constructing the genetic maps. Marker data were available for the 12 boars and for the 7172 pigs examined for osteochondrosis lesions. Further details about the genotyping, markers and genetic maps can be found in Vingborg et al. (Reference Vingborg, Gregersen, Zhan, Panitz, Høj, Sørensen, Madsen, Larsen, Hornshøj, Wang and Bendixen2009). For each chromosome, the markers were phased into pairs of haplotypes using the software GDQTL (Guldbrandtsen and Labouriau, Reference Guldbrandtsen and Labouriau2006).
Overview of the genetic SNP maps

SSC = Sus scrofa chromosome; SNP = single nucleotide polymorphism.
For each chromosome, the total length of the map, the number of SNP markers and the average distance between marker positions are given.
Statistical analysis
The QTLs were identified using mixed model methodology (Fernando and Grossman, Reference Fernando and Grossman1989). The mixed model contained gender, finishing unit within herd, and scorer as fixed class effects, weight at slaughter as a fixed regression effect, and boar, sow, month and litter within sow as random effects. For all traits in Table 1, a linear scale was assumed. The random effects were assumed to be independent and normally distributed with mean zero. For each locus θ on a given chromosome, a putative QTL was investigated by extending the model with two additive random effects corresponding to the two alleles. These random effects were assumed to be normally distributed with mean zero, common variance σ 2QTL, and an identical by descent (IBD) correlation matrix. The IBD correlation matrix was constructed from IBD probabilities based on the marker and pedigree data using the IBD programme (described in Sørensen et al., Reference Sørensen, Lund, Guldbrandtsen, Jensen and Sorensen2003). Inference in the model was performed using the software DMU (Madsen and Jensen, Reference Madsen and Jensen2008).
The likelihood ratios for no QTL effect, that is σ 2QTL = 0, were computed for loci θ at every 2 cM on a given chromosome. Evidence of a QTL was visualised graphically by plotting the positions on the chromosome and the corresponding log-likelihood ratios, with the peak of the curve representing the most likely position of the QTL. Significance thresholds were computed using the method by Piepho (Reference Piepho2001). The 5% chromosome-wide thresholds were computed using a threshold formula that takes into account that the log-likelihood ratios along the chromosome are positively correlated. The 5% genome-wide thresholds were computed using the same threshold formula, but with a Bonferroni type of correction for multiple testing where the significance level was 0.05 × lc, with lc equal to the relative length of the chromosome. Reported 95% confidence intervals of the QTL position were computed using a χ 2(1) approximation of minus two times the log-likelihood ratio. For a given QTL, the percentage of phenotypic variation explained by the QTL was computed as 2σ 2QTL divided by the total variance.
Given a QTL on a chromosome, a second QTL on that chromosome was searched for by fixing the first locus, θ0 and using the model with both the two additive random effects at locus θ0 and two additive random effects at another locus θ. Likelihood ratio tests were computed to determine whether a second QTL was significant given that one QTL already existed.
Results
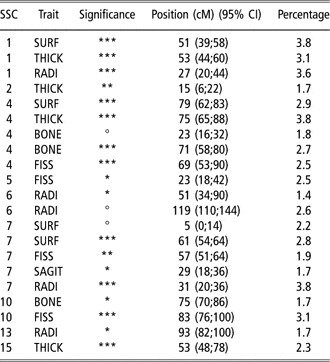
The genome scan revealed 18 pairs of traits and SSCs where a QTL exceeded the 5% genome-wide threshold (see Table 3). Thirteen and 11 of these also exceeded the 1% and 0.1% genome-wide thresholds, respectively. In addition, there were three cases where a second QTL exceeded a 5% chromosome-wide threshold, given an already existing first QTL on the chromosome. The estimated positions of the QTLs with associated 95% confidence intervals are shown in Table 3. In addition to the QTLs exceeding the 5% genome-wide threshold, 25 QTLs exceeded the 5% chromosome-wide threshold (see supplementary online information).
List of QTLs exceeding the 5% genome-wide threshold

QTL = quantitative trait locus; SSC = Sus scrofa chromosome; CI = confidence interval.
The QTL positions (cM) correspond to the peaks of the log-likelihood ratio curves. Percentages of phenotypic variation explained by the QTLs are also shown.
*** Exceeding the 0.1% genome-wide threshold.
** Exceeding the 1% genome-wide threshold.
° Second QTL exceeding the 5% chromosome-wide threshold conditional on the first QTL.
* Exceeding the 5% genome-wide threshold.
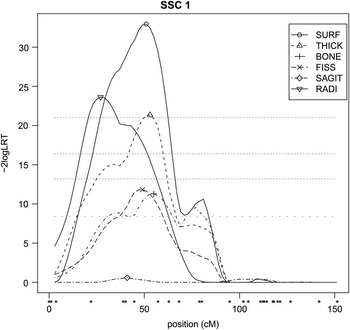
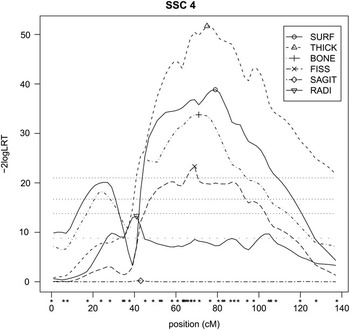
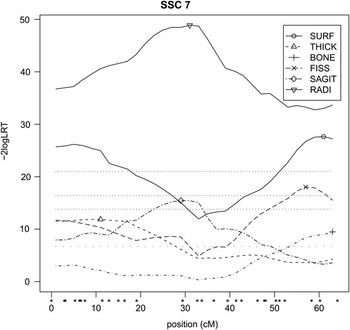
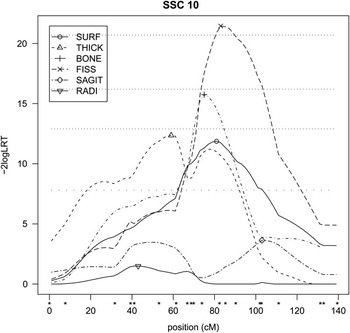
As seen in Table 3, SSCs one, four, seven and 10 had multiple QTLs for different traits. These chromosomes were therefore chosen for a closer examination of the results. Figures 2 to 5 show the log-likelihood ratio curves for all six osteochondrosis traits on these four chromosomes, respectively.
The log-likelihood ratio curves on Sus scrofa chromosome 1 for the six osteochondrosis traits. The marker positions are indicated by ‘*’. The peaks of the curves are marked by symbols, and the horizontal dotted lines indicate the 0.1%, 1% and 5% genome-wide and 5% chromosome-wide thresholds.

The log-likelihood ratio curves on Sus scrofa chromosome 4 for the six osteochondrosis traits. The marker positions are indicated by ‘*’. The peaks of the curves are marked by symbols, and the horizontal dotted lines indicate the 0.1%, 1% and 5% genome-wide and 5% chromosome-wide thresholds.

The log-likelihood ratio curves on Sus scrofa chromosome 7 for the six osteochondrosis traits. The marker positions are indicated by ‘*’. The peaks of the curves are marked by symbols, and the dotted horizontal lines indicate the 0.1%, 1% and 5% genome-wide and 5% chromosome-wide thresholds.

The log-likelihood ratio curves on Sus scrofa chromosome 10 for the six osteochondrosis traits. The marker positions are indicated by ‘*’. The peaks of the curves are marked by symbols, and the dotted horizontal lines indicate the 0.1%, 1% and 5% genome-wide and 5% chromosome-wide thresholds.

On SSC 1, the genome-wide 0.1% threshold was exceeded for SURF, THICK and RADI (Table 3), and the 5% chromosome-wide threshold was exceeded for BONE and FISS (Figure 2). The four traits SURF, THICK, BONE and FISS had nearly the same peak positions, whereas the peak position for RADI was in the same region but 25 cM away. Our interpretation is that a QTL at about 50 cM affects the four main osteochondrosis traits SURF, THICK, BONE and FISS, and another QTL at about 25 cM affects RADI.
On SSC 4, the 0.1% genome-wide threshold was exceeded for SURF, THICK, BONE and FISS, with peak positions being nearly identical (Table 3). In addition, a second QTL was found for BONE (Table 3), and the 5% chromosome-wide threshold was exceeded for RADI (Figure 3). Our interpretation is that a QTL at about 75 cM affects SURF, THICK, BONE and FISS, perhaps a second QTL at about 25 cM affects BONE, and perhaps a QTL at about 40 cM affects RADI.
On SSC 7, the 5% genome-wide threshold was exceeded for SURF, FISS, SAGIT and RADI (Table 3), the 5% chromosome-wide threshold was exceeded for THICK and BONE (Figure 4), and a second QTL was detected for SURF (Table 3). The peak positions support a QTL at about 10 cM affecting both SURF and THICK, a QTL at about 30 cM affecting both RADI and SAGIT and a QTL at about 60 cM affecting SURF, BONE and FISS.
On SSC 10, the 5% genome-wide threshold was exceeded for BONE and FISS (Table 3), the 5% chromosome-wide threshold was exceeded for SURF and THICK (Figure 5). In Figure 5, the log-likelihood curves for SURF, BONE and FISS are seen to have well-defined peaks at about 80 cM, which is interpreted as a QTL at that position.
Discussion
In this study, the detected number of QTLs exceeding a stringent significance threshold was large compared with previous studies (Andersson-Eklund et al., Reference Andersson-Eklund, Uhlhorn, Lundeheim and Dalin2000; Lee et al., Reference Lee, Archibald, Garth, Law, Nicholsen, Barr and Haley2003), probably because a much larger number of animals were used here. Our results show that many QTLs affect osteochondrosis (Table 3), which is consistent with the prevailing view that many factors play a role in the development of osteochondrosis (Nakano et al., Reference Nakano, Brennan and Aherne1987; Ytrehus et al., Reference Ytrehus, Carlson and Ekman2008). After publication of this study, the detected QTLs will be submitted to the QTLdb database, thus making them available to the scientific community. In addition to being directly relevant to osteochondrosis in pigs, our results may also provide insight into the biology of osteochondrosis, osteoarthrosis and cartilage degradation in humans and other species. Osteochondrosis is also considered to be a problem in, for example, horses and dogs.
Most of the QTLs associated with the four condylus humeri traits (SURF, THICK, BONE and FISS) were found at common locations (Table 3), although the QTLs found for BONE were fewer in number and less significant. This indicates that the genetic factors influencing these four traits are generally the same, which is also in accordance with the biological understanding of the disease process. Osteochondrosis is probably the result of ischaemic necrosis of growth cartilage caused by premature destruction of the cartilage canal vessels (Kincaid et al., Reference Kincaid, Allhands and Pijanowski1985; Ytrehus et al., Reference Ytrehus, Ekman, Carlson, Teige and Reinholt2004). This primary condition can lead to sequelae such as failure of endochondral ossification, persistence of necrotic cartilage and formation of fissures in overlying cartilage. For the elbow joint, that hypothesis is in accordance with the typical finding of the four types of lesions at the same location on the condylus, that is the bone lesions and fissures are located directly beneath irregular and thickened cartilage, and therefore they all seem to be a result of the same disease process. Consequently, our results support the conclusion by Jørgensen and Nielsen (Reference Jørgensen and Nielsen2005) that the SURF trait seems to be a good proxy for the traits THICK, BONE and FISS, which are only visible after cutting through the condylus humeri. Hence, SURF could be used as a trait for selection against osteochondrosis in the elbow joint. In addition, it explains why Jørgensen and Nielsen (Reference Jørgensen and Nielsen2005) in an animal model based on the same study have shown high genetic correlations (ranging between 0.75 and 0.97) between these traits.
The QTLs associated with RADI were not found at the same locations as the four condylus humeri traits discussed above, although they were generally detected on the same chromosomes (Table 3). This could explain the weak-to-moderate genetic correlations (ranging between 0.05 and 0.52) between RADI and the four condylus humeri traits observed by Jørgensen and Nielsen (Reference Jørgensen and Nielsen2005). Only one QTL associated with SAGIT was detected. This explains why the genetic variance for SAGIT has been found to be lower than for the other traits in the osteochondrosis complex (Jørgensen and Nielsen, Reference Jørgensen and Nielsen2005).
The edge of the radius and the sagittal groove are located separately from the position of the first-mentioned four condylus humeri lesions. Thus, it would be expected that depression of the edge of the radius and irregular sagittal groove were less closely associated with the other four lesions than these were with each other. With the exception of the studies by Jørgensen and co-authors (Jørgensen, Reference Jørgensen1995; Jørgensen et al., Reference Jørgensen, Arnbjerg and Aaslyng1995; Jørgensen and Nielsen, Reference Jørgensen and Nielsen2005), other studies of osteochondrosis in the elbow generally do not describe the degree of the depression of the proximal edge of the radius or the degree of irregularity of the sagittal central groove. Consequently, the significance of these lesions in the osteochondrosis complex has been less well established. Our results provide some insight into how these two lesions are related to the four condylus humeri lesions. The deviation in positions between QTLs for RADI and QTLs for the four condylus humeri traits suggests that the genetic factors affecting RADI are different from those affecting the four condylus humeri traits, and RADI should therefore be considered a separate trait. As the only QTL associated with SAGIT was a QTL also associated with RADI, the conclusion is that SAGIT is not a trait of great importance to measure.
The QTL associated with FISS on SSC 5 is located near the QTL on SSC 5 reported by Andersson-Eklund et al. (Reference Andersson-Eklund, Uhlhorn, Lundeheim and Dalin2000). This may suggest that the QTL explaining variation in osteochondrosis status between wild boar and Large White is polymorphic within the Duroc population. However, the QTL detected by Andersson-Eklund et al. (Reference Andersson-Eklund, Uhlhorn, Lundeheim and Dalin2000) is associated with general osteochondrosis status in the knee and elbow, whereas the QTL detected here is associated with FISS only. Another important factor may be the size and age of the animals. In Andersson-Eklund et al. (Reference Andersson-Eklund, Uhlhorn, Lundeheim and Dalin2000), the F2 animals were slaughtered at a live weight of at least 80 kg and a maximum age of 190 days. Although this seems to be roughly comparable with the age and size of the animals used in this study, such a comparison of size and age with an F2 cross involving wild boar may be questioned. For comparison with future QTL studies, it is important to note that the size and age of the animals may affect both the prevalence of osteochondrosis and the detected QTLs.
For each of the six osteochondrosis traits, the percentages of phenotypic variation explained by the significant QTLs are shown in the last column of Table 3. By summing these percentages, we get 11.7%, 10.6%, 6.2%, 10.0% and 13.1% for SURF, THICK, BONE, FISS and RADI, respectively. Although these percentages may slightly overestimate the total percentages of variation explained by these QTLs jointly, they account for roughly half of the heritabilities computed in Jørgensen and Nielsen (Reference Jørgensen and Nielsen2005), and hence a large proportion of the genetic variation is explained by the QTLs. A large part of the genetic variation explained by association with SNPs is very promising for marker-assisted selection against osteochondrosis.
Future research on marker-assisted selection against osteochondrosis would use a SNP chip to genotype a large number (50K, or more) of densely-spaced markers. The new paradigm for marker-assisted selection is genomic selection (Meuwissen et al., Reference Meuwissen, Hayes and Goddard2001), where not just QTLs with large effects (exceeding a certain stringent significance threshold) are used but also all QTLs with minor effects (not exceeding any significance threshold). For osteochondrosis to become part of a genomic selection breeding programme in practise, an osteochondrosis study would have to be made in which a relevant subset of the reference population was genotyped and recorded for osteochondrosis traits. However, an additional issue when considering breeding against osteochondrosis is the welfare of the animals. The welfare consequences of osteochondrosis in pigs are not well understood. Only weak associations between the presence of osteochondrosis and clinical signs have been established (Grøndalen, Reference Grøndalen1974; Goedegebuure et al., Reference Goedegebuure, Rothschild, Christian and Ross1988; Jørgensen et al., Reference Jørgensen, Arnbjerg and Aaslyng1995). Severe cases of osteochondrosis in the elbow have been found to be associated with stiff gait and forelegs turned outwards (Jørgensen et al., Reference Jørgensen, Arnbjerg and Aaslyng1995; Jørgensen, Reference Jørgensen2000). The long-term effects of osteochondrosis on the health and longevity of breeding animals have not been clearly established either. It has been stated that severe cases of osteochondrosis can lead to the formation of connective tissue and impaired mobility of the joint (Palmer, Reference Palmer1993; Dewey, Reference Dewey1999), and it seems likely that osteochondrosis in the young pig increases the risk of arthrosis and bone deformation in the adult breeding animal, thereby reducing sow longevity. However, this has not yet been investigated sufficiently for any definitive conclusions to be drawn, but would be a very interesting topic for future research.
Conclusions
In this study, the number of detected QTLs exceeding a stringent significance threshold was large compared with previous studies. The collocation of the detected QTLs for the six different traits also provided a better understanding of how these traits are associated. Along with other work on the relationship between osteochondrosis and growth rate and health effects, this study is therefore important in that it provides the commercial pig industry with information about the possibility of using marker-based selection against osteochondrosis.
Acknowledgements
The work was funded by the Danish Bacon & Meat Council and the Danish Minstry of Food, Agriculture and Fisheries. The authors thank the two anonymous reviewers for their careful reading and inspiring comments. Gorm Christensen is acknowledged for his thorough and time-consuming work on scoring and collecting osteochondrosis data. Bernt Guldbrandtsen, Peter Sørensen and Hauke Thomsen are acknowledged for help with the use of GDQTL and IBD.