Introduction
Due to the population growth and global warming, the need for green and affordable energy is extensively felt. Dye-sensitized solar cells (DSSCs) are known as the third generation of solar cells, which was first reported in 1991 by Grätzel and coworkers [Reference O’regan and Grätzel1]. The advantages of DSSC include the low-cost, simplicity for fabrication, and its relatively good efficiency, which have received considerable attention by many researchers [Reference Gong, Sumathy, Qiao and Zhou2, Reference Kumara, Lim, Lim, Petra and Ekanayake3]. Among the components of the solar cell, the photoanode plays a key role in performance of DSSCs. An ideal photoanode involves the features such as high surface area to improve the dye absorption, good acceptor for electrons, the ability to absorb the wide spectrum of sunlight, the facility of dye’s diffusion, and so on. In early development of DSSCs, titanium dioxide (TiO2) and its various shapes are widely used in photoanode incorporation of DSSCs because of their high band gap and good stability [Reference Ahmad, Pandey and Rahim4, Reference Yu, Zhang, Yang, Zhang and Gao5, Reference Archana, Harish, Kavirajan, Navaneethan, Ponnusamy, Shimomura, Muthamizhchelvan, Ikeda and Hayakawa6]. However, the improvements in the DSSCs properties can be predicted by modifying the photoanode structure. Many studies have been carried out for employing the optimal photoanode to improve the DSSCs photovoltaic properties. The extensive efforts have been made by researchers to modify the photoelectrodes, which can improve the factors such as specific surface area for dye loading and preventing the recombination of carriers. The different photoanode structure was proposed to improve the photoanodes. Jiang et al. studied the interfacial engineering and surface modification of hierarchical porous photocatalysts [Reference Shen, Jiang, Xiang, Xie and Li7]. Another research on the use of various elements as an additive in photovoltaic DSSCs such as TiO2–Sm [Reference Liu, Hou and Qu8], TiO2–ZnO [Reference Yan, Wu, Peng, Zhang, Li, Dou and Li9] and so on has been reported.
Graphene is a two-dimensional carbon nanomaterial in which the carbon atoms are expanded in a honeycomb. High mobility of the electron, excellent electrical conductivity, high stability, and high transparency in the visible range are among the unique features of graphene that introduce the graphene as a suitable candidate for use in DSSCs [Reference Das, Sudhagar, Kang and Choi10, Reference Li, Yu, Wageh, Al-Ghamdi and Xie11]. Other features of graphene include the high specific surface area and ease of mixing with various materials. A good contact of graphene with TiO2 nanoparticles and the presence of intermolecular forces such as charge transfer interactions between graphene and TiO2 [Reference Yang, Zhai, Wang, Chen and Jiang12] are the reasons for the use of graphene for modification of the photoanode’s structure. The combination of TiO2 and graphene is expected to improve the photoelectrochemical properties of TiO2 nanoparticles.
Different methods were reported for the incorporation of TiO2 into graphene lattice such as hydrothermal synthesis [Reference Yin, Zhao, Hu, Ye and Wang13, Reference Ton, Dao, Kato, Ikenaga, Trinh and Taniike14], simple mixture/sonication [Reference Kim, Kim, Kim, Ha, Tien and Kang15], sol–gel processes [Reference Shao, Quan, Liu, Guo and Wang16], and so on. The simple mixture/sonication or chemical method is one of the most known approaches to prepare TiO2/graphene nanocomposite. Zhao et al. used the chemical method for the synthesis of TiO2/graphene nanocomposite. They showed that the photocatalytic activities of DSSC are increased by TiO2–graphene nanocomposites [Reference Sohail, Xue, Jiao, Li, Khan, Wang and Zhao17].
In this study, we synthesized the TiO2–graphene nanocomposites in which the TiO2 nanoparticles are well decorated on the graphene sheet by an efficient and facile chemical technique that subsequently used as the photoanode of DSSC. To investigate the weight ratio effect on the DSSC performance, the TiO2–graphene nanocomposites were synthesized with different concentrations of graphene. Moreover, the characterization and structural properties of TiO2–graphene nanocomposites were compared by FT-IR, Raman analysis, and field-emission scanning electron microscopy (FE-SEM). The impact of graphene concentration on light absorption of TiO2–graphene nanocomposites and the photovoltaic parameters of fabricated DSSCs were explored. We also demonstrated that the presence of graphene in photoanode which considerably enhanced the efficiency of DSSC.
Results and discussion
XRD analyze
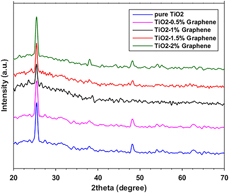
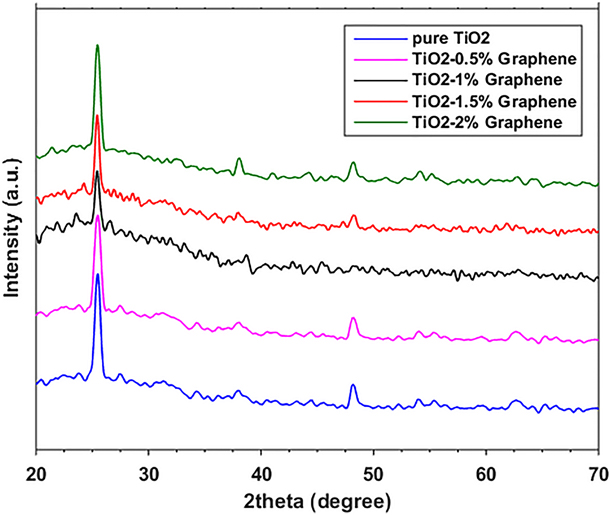
Figure 1 shows the X-ray diffraction (XRD) patterns of pure TiO2 and TiO2–graphene photoanode with six main characteristic peaks. The diffraction peaks centered at 2θ = 25.4, 37.9, 48.2, 53.8, 55.1, and 62.9 in the TiO2 anatase phase due to the attribution of (101), (004), (200), (105), (211), and (204) planes [Reference Zhang, Hou, Sun and Zhao18], respectively. Such diffraction pattern is also seen in the TiO2–graphene photoanodes and indicates that the TiO2 is anatase completely in both photoanodes. Due to low concentration and layered structure of graphene in TiO2–graphene photoanode, the graphene diffraction peak is not seen in the TiO2–graphene pattern. In addition, the graphene peak is very close to the (101) diffraction peak at ∼25°, and thus, the two overlapped peaks. Furthermore, the intensities of the diffraction peaks for the TiO2–graphene nanocomposites showed a slight decrease by increasing of graphene concentration. The crystallite size of the pure TiO2 nanoparticles was around 23.7 nm, which was calculated using the Deby–Scherrer formula while average crystal size for TiO2–graphene nanocomposites was found to be around 22 nm, which indicates the decreases in the anatase crystallite size.
The XRD patterns of the TiO2–graphene photoanode with different concentrations of graphene.
FE-SEM images analyze
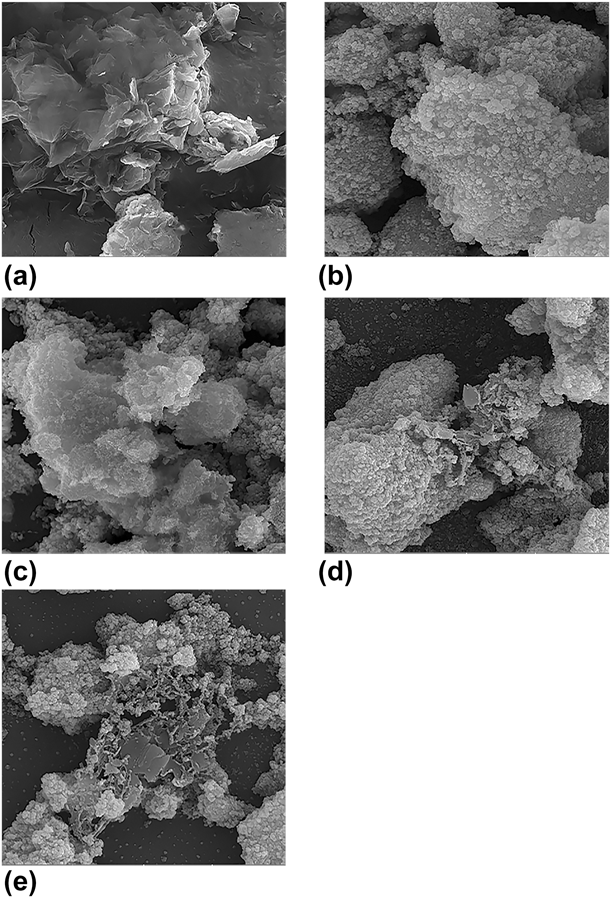
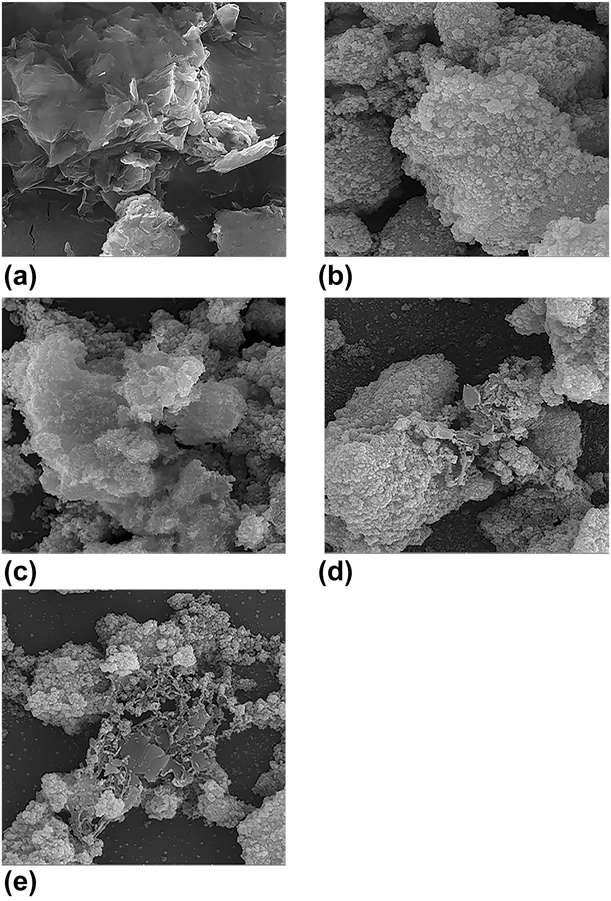
The surface morphology of graphene and also TiO2, TiO2–0.5% graphene, TiO2–1.5% graphene, and TiO2–2% graphene nanofilms is investigated by FE-SEM images. Figure 2(a) shows the graphene nanosheets and Fig. 2(b) shows the formation of agglomerate TiO2 nanoparticles, which are unevenly distributed. Figures 2(c)–2(e) show the good decoration of TiO2 nanoparticles on graphene nanosheets in current synthetic process. In Fig. 2(c), due to the low amount of graphene in the TiO2–0.5% graphene nanofilm, the graphene sheet structure is hardly seen. According to the FE-SEM images of TiO2–graphene nanocomposites, it can be expected that the TiO2 nanoparticles in TiO2–graphene nanocomposites have more uniformity in distribution and homogeneity than pure TiO2. Furthermore, Figs. 2(c)–2(e) show that by introducing of graphene, the TiO2 accumulation is significantly disappeared and is expected the specific surface area increments [Reference Kusumawati and Martoprawiro19]. Therefore, the graphene creates the numerous defects and pores, in which more dye is loaded on placeholders, and therefore, the light capture centers increase [Reference Liu, Zeng, Meng, Zhang, Li, Zhang, Yang and Wang20]. Figures S1(a)–S1(e) show FE-SEM images with more magnification than the images shown in Fig. 2.
FE-SEM images of the (a) graphene sheets, (b) pure TiO2, (c) TiO2–0.5% graphene, (d) TiO2–1.5% graphene, and (e) TiO2–2% graphene.
Surface area and porosity measurement
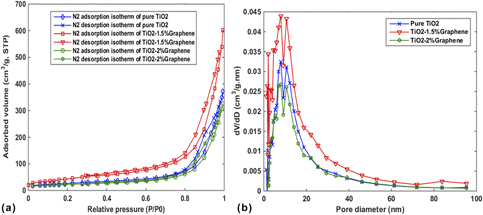
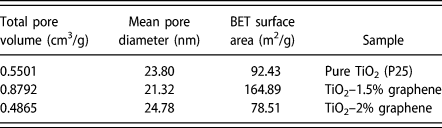
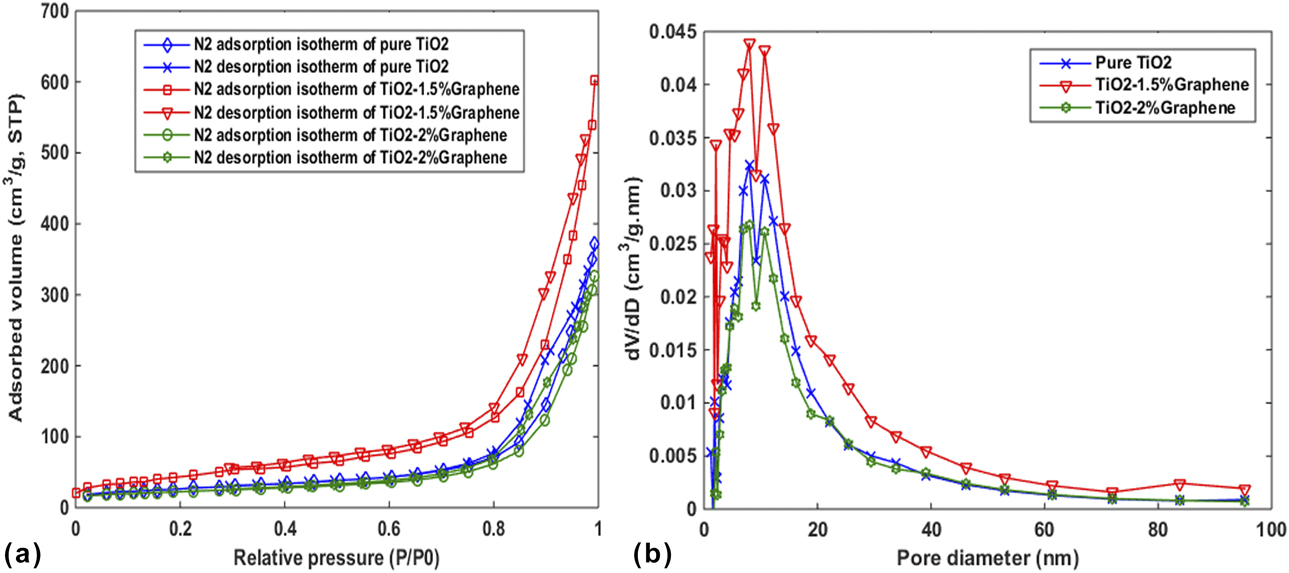
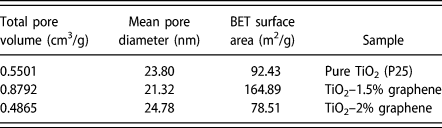
Precise measurements of surface area and porosity are very important in many applications, such as nanostructures. One of the most used methods to determine the porosity is the absorption-based BET method. As noted in section “FE-SEM images analyze”, the surface area and pore volume the TiO2–graphene nanocomposite are very important as it affects the amount of dye absorption and the light capture centers. Figure 3(a) shows nitrogen adsorption–desorption isotherms of the TiO2, TiO2–1.5% graphene, and TiO2–2% graphene nanocomposites carried out at 77 K. The corresponding pore size distribution curves are plotted in Fig. 3(b). The specific surface areas of TiO2, TiO2–1.5% graphene, and TiO2–2% graphene was calculated from the Brunauer–Emmett–Teller (BET), and the pore size distribution was determined from the desorption mechanism and calculated by the Barrett–Joyner–Halenda (BJH) method. As shown in Fig. 3(a), the isotherm curve for all of the samples categorized as a type IV with an H3 hysteresis loop profile at the range from 0.8 to 1.0 P/P 0. The pore size distribution shows that mainly the size of pores was about 8 nm located in the range of 2–50 nm and is indicative of mesoporous materials. Table I shows the summarized structural characteristics of samples. The specific surface area by introducing the graphene has increased significantly compared to pure TiO2. In addition, the total pore volume has increased from 0.5501 cm3/g (for pure TiO2) to 0.8792 cm3/g (for TiO2–1.5% graphene) which is significantly higher than the reported values in some previous research [Reference Zhang, Zhou, Chen, Wang and Lu21, Reference Zhang, Bao, Wang, Hu, Miao, Chaker and Ma22]. These results show the presence of graphene can increase the capacity of dye loading in TiO2–graphene nanocomposites and improve the harvesting of light.
(a) Nitrogen adsorption–desorption isotherms and (b) pore-size distribution curves of pure TiO2, TiO2–1.5% graphene, and TiO2–2% graphene.
BET specific surface area, mean pore diameter, and total pore volume of TiO2, TiO2–1.5% graphene, and TiO2–2% graphene.
FT-IR spectrum
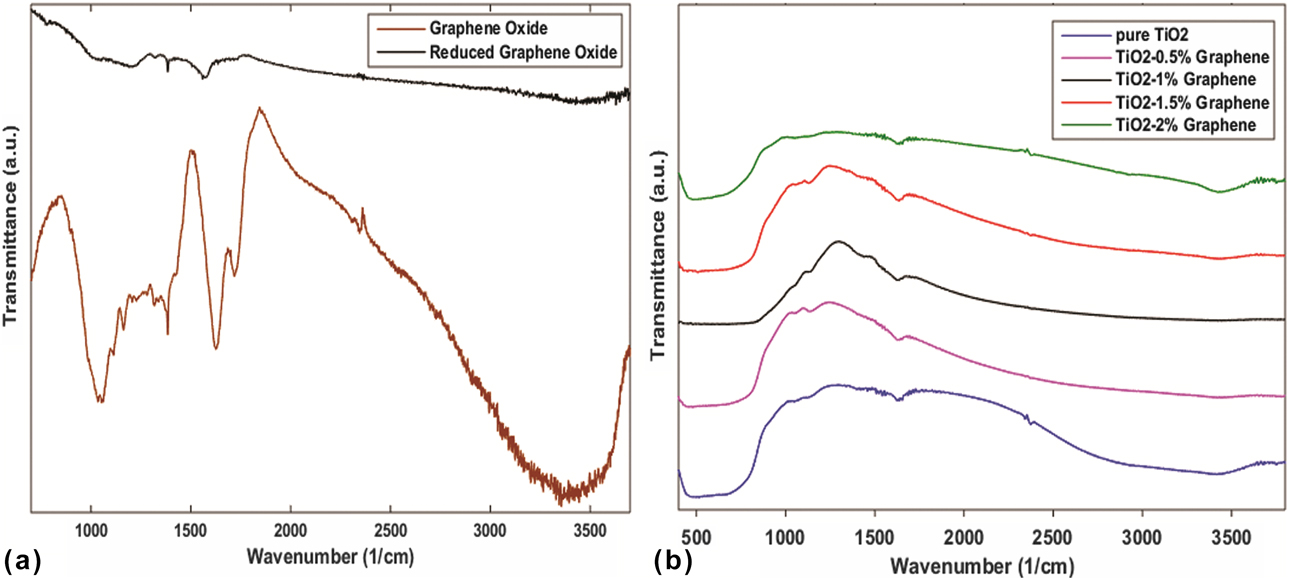
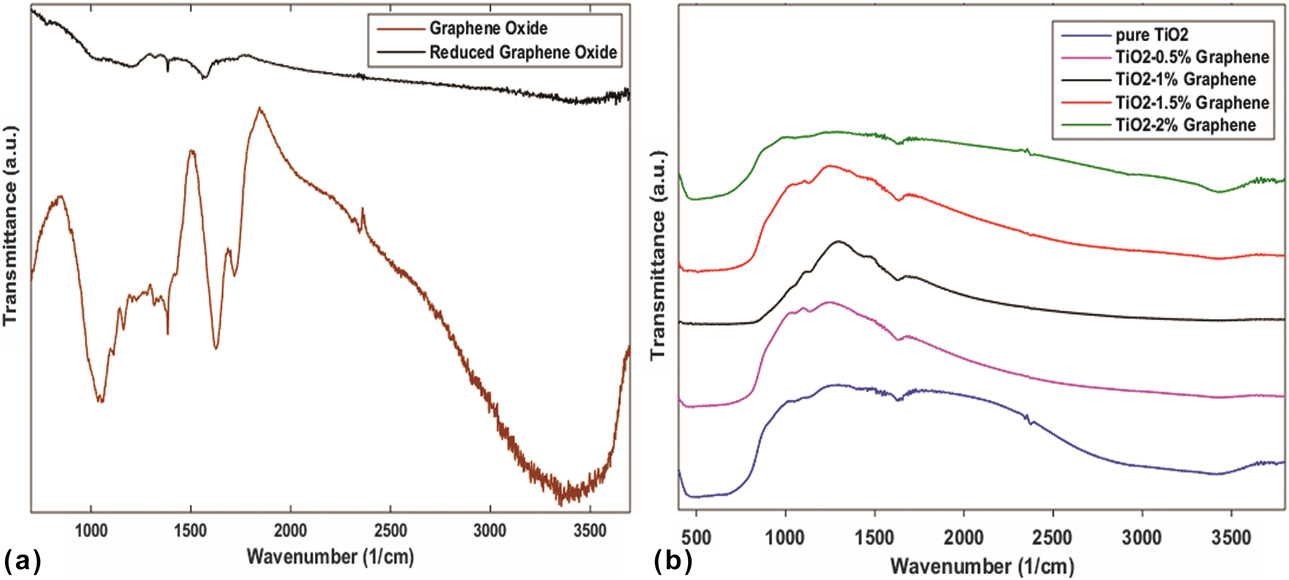
The FT-IR measurement was investigated for the presence of different functional groups in graphene oxide (GO), graphene, and TiO2–graphene structures (Fig. 4). Figure 4(a) shows the absorption characteristic peaks in GO and graphene spectra. The peaks at 3355 cm−1, 1718 cm−1, 1626 cm−1, 1384 cm−1, 1162 cm−1, and 1053 cm−1 correspond to the stretching vibration of O–H in carboxyl (C–OH) and the presence of absorbed water molecules, stretching of C=O, skeletal vibrations (C=C), C–OH stretching in alkoxy group, vibrations stretching of C–O–C, and stretching in carboxylates (C–O), respectively [Reference Tan, Ong, Chai and Mohamed23, Reference Ahmadkhaniha, Izadpanah and Rastkari24, Reference Hu, Yang, Zhao, Chen and Cao25]. In the graphene and TiO2–graphene spectrums, all the intensities of the hydroxyl and carboxyl groups absorption peaks decreased significantly in comparison with the peaks intensity of the GO spectrum and/or even some were disappeared due to the removal of oxygen-containing functional groups in which the result, exfoliation of graphite into small pieces by chemical reduction of GO is performed, correctly. But some of the peaks were not eliminated completely, which indicates that the oxygen-containing functional groups were not completely decomposed. Figure 4(b) displays the bonding characterization of the TiO2 and TiO2–graphene nanocomposites. All samples showed an absorption peak at 3422 cm−1 which are related to the absorption of water molecules. The broad and strong absorption peaks in TiO2 and TiO2–graphene spectrum at the low-frequency region (480 cm−1) were observed which can be attributed to stretching vibrations of Ti–O–Ti bond, and the absorption peak at 1636 cm−1 in the TiO2–graphene spectrum exhibits the skeletal vibrations (C=C) in the nanocomposites. On the other hand, the C–OH absorption peak of graphene spectrum that was assigned in 3355 cm−1 was shifted to 3422 cm−1 in TiO2–graphene spectrum. These results confirm the formation of TiO2 and TiO2–graphene nanocomposites [Reference Rahimi, Zargari, Sadat Shojaei, Seijas, Pilar Vázquez Tato and Lin26].
FT-IR spectra of the (a) GO and reduced GO and (b) pure TiO2, TiO2–0.5% graphene, TiO2–1% graphene, TiO2–1.5% graphene, and TiO2–2% graphene nanocomposites.
Raman spectrum
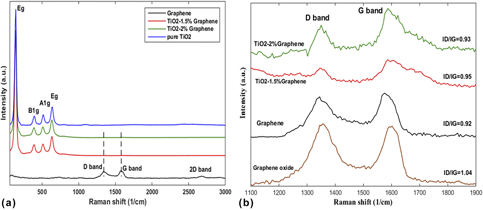
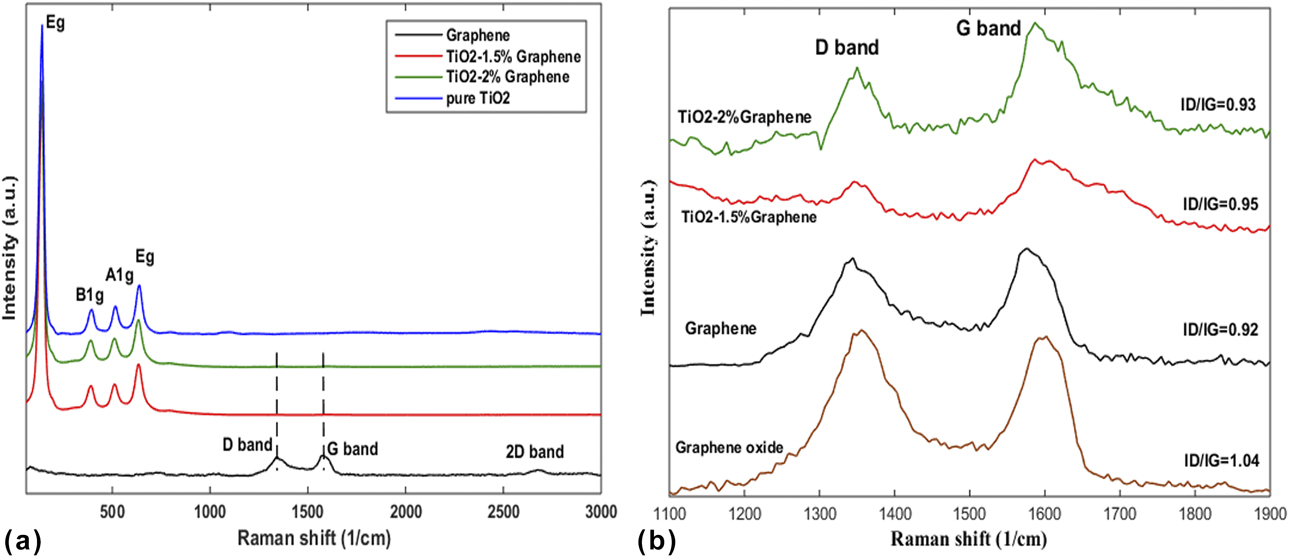
Raman analysis was used to investigate the crystal structure and electronic properties of carbon-based nanomaterials. Figure 5(a) shows the Raman spectra of graphene, TiO2, and TiO2–graphene nanocomposites with different concentrations ranging from 60 to 3000 cm−1 that display the location of vibrational modes in TiO2 and TiO2–graphene nanocomposites, and Fig. 5(b) shows the magnifications captured in the range from 1100 to 1900 cm−1. The anatase TiO2 includes four high-intensity characteristics, which can be attributed to the vibrational modes [Reference Wang and Cho27, Reference Gayathri, Kottaisamy and Ramakrishnan28]. The vibrational modes of Eg, B1g, A1g, and Eg, are centered at 141 cm−1, 392 cm−1, 514 cm−1, and 640 cm−1, respectively. These modes are also observed in TiO2–graphene nanocomposites that indicate the anatase TiO2 nanoparticles. However, these modes shifted slightly in comparison with TiO2 modes, which can be attributed to the interaction between graphene and TiO2 nanoparticles. Figure 5(a) clearly shows the intensity of the TiO2 modes, which suppressed the intensity of the graphene modes. Two feature peaks of carbon materials were observed in Fig. 5(b) that are located around 1345 and 1587 cm−1 due to D band and G band. The D band is assigned for to the presence of disturbances and defects in the sp 2 carbon network and G band originates from the in-plane vibration of sp 2-bonded carbon. The ratio of the intensity of D band to G band indicates the order of defects in graphene and their derivatives [Reference Zhang, Bao, Wang, Hu, Miao, Chaker and Ma22, Reference Chen, Zou, Li and Zheng29]. The I D/I G value of GO, graphene, TiO2–1.5% graphene, and TiO2–2% graphene is 1.04, 0.92, 0.95, and 0.93, respectively. Importantly, after reduction by chemical treatment, the ratio of the intensity I D/I G of graphene in comparison with the intensity I D/I G of GO has decreased significantly, and thus, the oxygen density and defect density are reduced and sp 2-carbon–carbon bonds were greatly reconstructed.
Raman spectra of the TiO2–graphene with different concentrations of graphene in the range of (a) 60 cm−1 to 3000 cm−1, and (b) 1100 cm−1 to 1900 cm−1.
UV-vis absorption spectrum
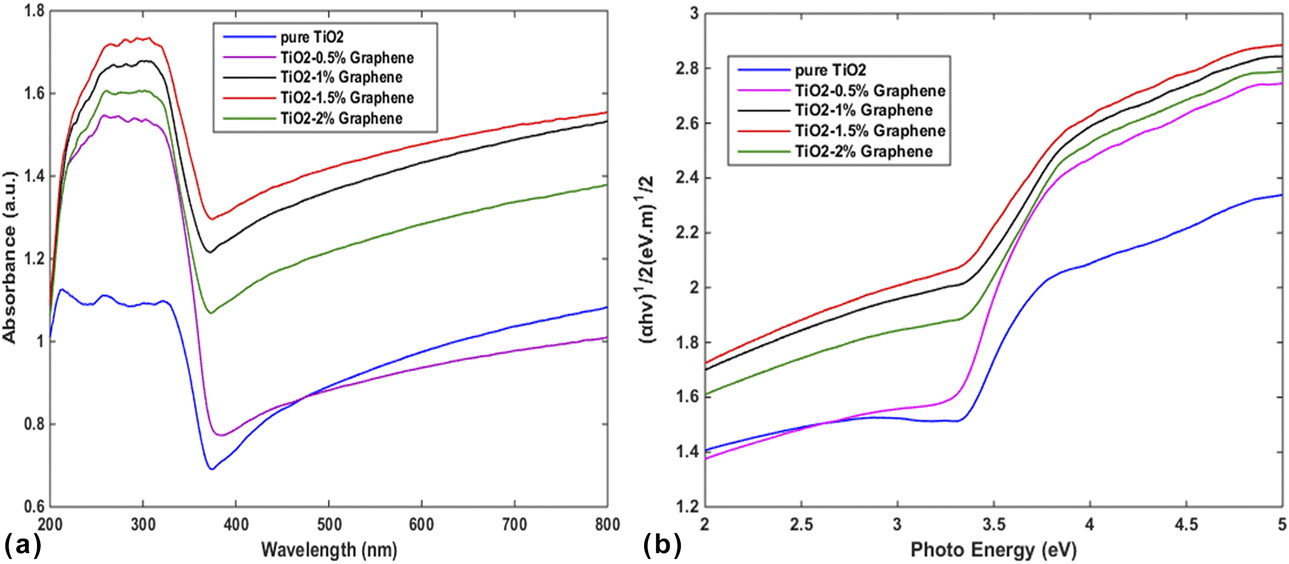
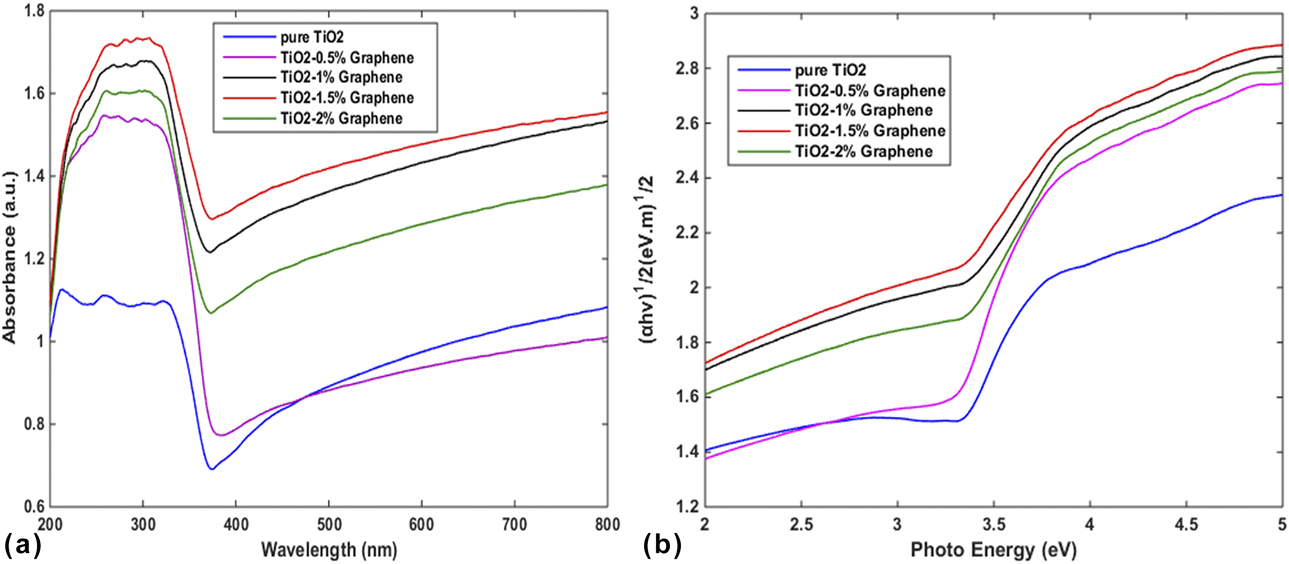
The UV-vis diffuse reflectance spectra of the TiO2 film and TiO2–graphene nanocomposites were also evaluated for the optical characterization (Fig. 6). According to Fig. 6(a), the TiO2 film cannot trap the light significantly in the visible range. However, it was clearly observed that the combination of graphene with different concentrations of P25–TiO2 can lead to enhancement of light absorption (Especially in the visible region) which could be attributed to a narrow of the band gap in TiO2–graphene. In fact, after the addition of graphene to P25–TiO2, because of the formation of the Ti–O–C bonds and their interactions, the energy levels change in TiO2 and thus graphene reduces the band gap energy of the TiO2–graphene nanocomposites [Reference Alamelu, Raja, Shiamala and Jaffar Ali30, Reference Haldorai, Rengaraj, Kwak, Huh and Han31, Reference Liu32]. Thus, the absorption edge of TiO2–graphene was shifted to the visible wavelengths and exhibits a red shift in comparison with the absorption edge of TiO2, which agreed with the color of the samples (white for TiO2, gray for TiO2–graphene). The band gap energies of pure TiO2 and TiO2–graphene nanocomposites were obtained using a Tauc plot of the modified Kubelka–Munk function with a linear extrapolation [Reference Song, Qiang, Zhao, Gu, Song and Liu33]. Figure 6(b) shows the relationship of (αhν)1/2 versus photon energy for TiO2 and TiO2–graphene nanocomposites. The band gap energy is estimated as 3.13 eV, 3.10 eV, 2.50 eV, 2.40 eV, and 2.79 eV for pure TiO2, TiO2–0.5% graphene, TiO2–1% graphene, TiO2–1.5% graphene, and TiO2–2% graphene, receptivity. As can be seen, the band gaps decrease with introducing of graphene, which can be attributed to the chemical bonding between P25 and graphene. This result proves that TiO2–graphene requires the least amount of energy in comparison with the TiO2 to produce the photo-induced electrons and also can absorb the wide region of the light spectrum and promote the DSSC efficiency.
(a) The UV-vis diffuse reflectance spectra of TiO2–graphene nanocomposites with different concentrations of graphene and (b) plot of modified Kubelka–Munk function versus the photo energy for TiO2–graphene nanocomposites with different concentrations of graphene.
J–V characterization
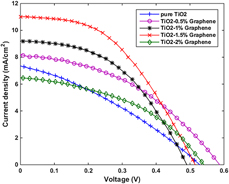
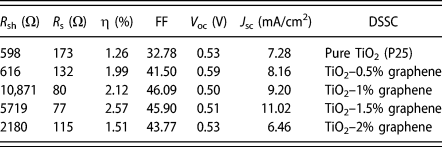
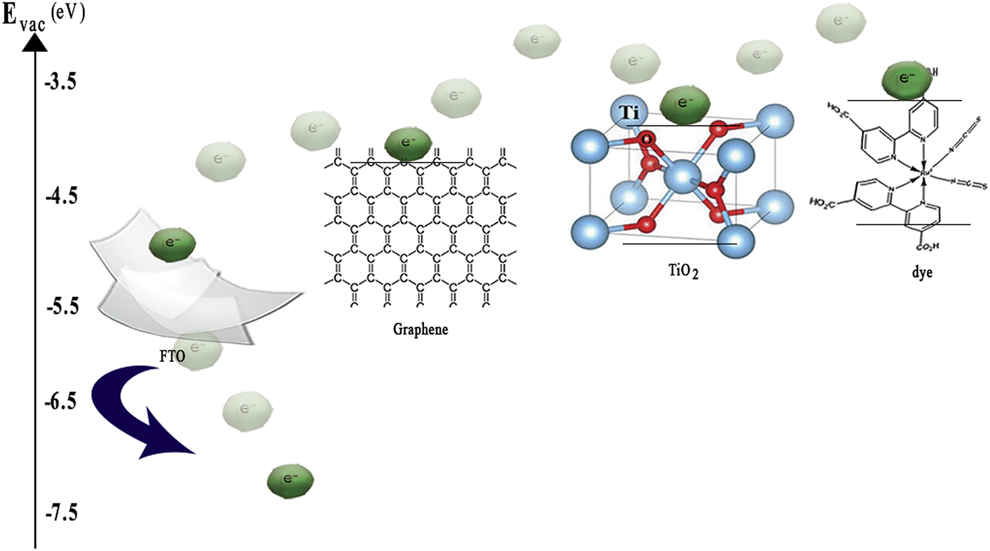
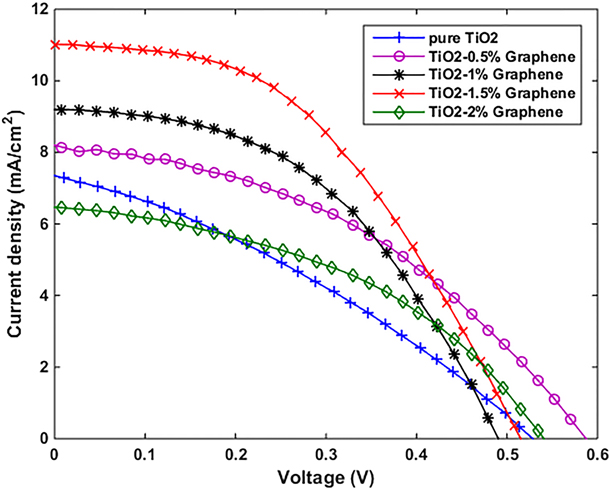
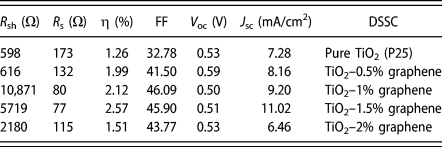
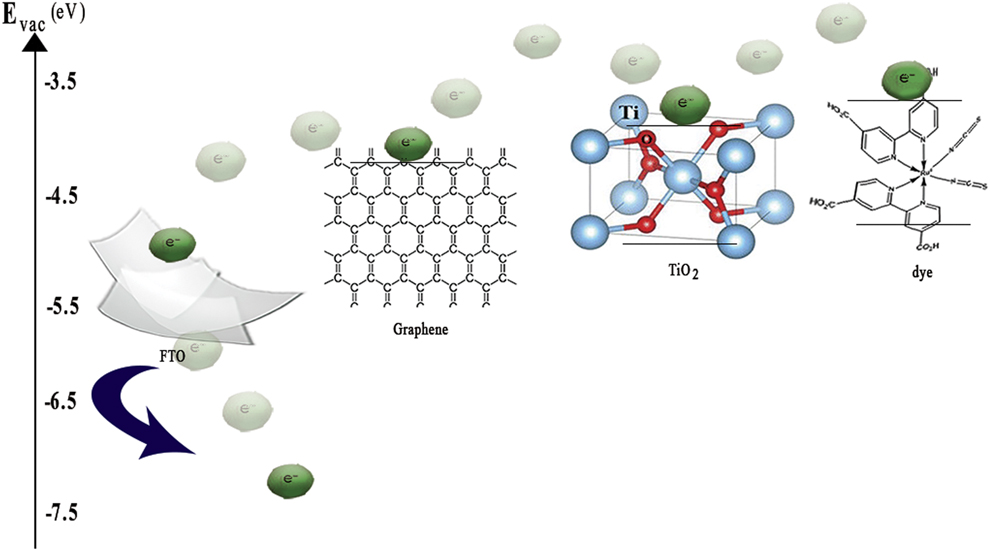
Figure 7 shows the current density–voltage (J–V) characteristics of DSSCs employing TiO2 and TiO2–graphene photoanodes with different graphene contents and photovoltaic parameters of fabricated DSSCs which are depicted in Table II. The results have shown the incorporation of graphene with the TiO2, which significantly improve the photovoltaic properties of the DSSC in comparison with pure TiO2-based DSSC. In fact, the graphene can improve the DSSC performance for two reasons. First, graphene suppresses the recombination of the carriers. Because the graphene energy level (work function = −4.42 eV) lies between the energy level of FTO (work function = −4.70 eV) and energy level of TiO2 (work function = −4.05 eV), the photogenerated electrons in TiO2 move toward the graphene. Due to graphene’s excellent mobility, it acts as a bridge, thus the electrons moved from the TiO2 conduction band toward graphene. Afterward, the collected photogenerated electrons in graphene transferred to the FTO [Reference Chen, Hsu, Chan, Zhang and Huang34, Reference Li, Shen, Ma, Chen and Xie35]. In other words, in graphene, the rapid electron-transfer occurs and carriers have less chance for recombination. Figure 8 displays the graphical schematic of graphene’s role in the charge separation. Second, graphene increases the absorption of light. As the comparison, the absorption spectra of the TiO2 with TiO2–graphene films indicates the addition of graphene to the TiO2 leads to the shift of the absorption edge toward the visible range which means that graphene can absorb the light in a wide wavelength range of 200–800 nm.
The J–V curves of the DSSCs.
Photovoltaic parameters of DSSCs.
The graphical schematic of the electron transfer path in DSSC photoanode. The roles of graphene as the electron acceptor and transferor for charge separation.
As shown in Table II, the highest efficiency was achieved for TiO2–1.5% graphene photoanode, which are more than twice that of TiO2 photoanode efficiency. On the other hand, with increasing the concentrations of graphene, the short-circuit current density (J SC) and efficiency will first increase to a maximum value at a graphene concentration of 1.5% and then decreased at a concentration of 2%. In other words, the fabricated DSSC with photoanode of TiO2–1.5% graphene is the most optimal DSSC. This result is in good agreement with the TiO2–graphene nanofilms absorption spectrum. In fact, by adding graphene more than that of the optimal amount, the transparency may be decreased in the TiO2–2% graphene nanofilm and the amount of light reflection can be increased. Thus, the photovoltaic properties of the TiO2–2% graphene photoanode-based DSSC are reduced. In addition, the excessive graphene can be considered as a center for recombining the carriers instead of the pathway of excited electrons, and thus prolonging the migration length of electrons. Another possibility might be attributed to reducing the effective surface area of TiO2 due to the surrounded TiO2 by graphene and limited of the dye absorption [Reference Ramli, Razali and Ludin36]. These reasons cause the reduction in the short-circuit current density and efficiency of DSSCs. The shunt resistance (R sh) and series resistance (R s) were also calculated. The series resistance in DSSCs is the result of contact resistance between the electrode, and electrolyte, and the electrode and semiconductor material layer as well as the charge transfer resistance in the semiconductor material that concluded for the low R s value. The results in Table II indicate that the least R s is related to TiO2–1.5% graphene-based DSSC. Increase in R s leads to a decrease in the fill factor. In fact, the fill factor depends on the series and shunt resistances of the solar cell. In this study, R s decreases with increasing graphene concentration, but adding the graphene more than that of the optimal amount (1.5%) may increase the charge transfer resistance at the electrolyte/dye/TiO2 interface and therefore reduce the cell efficiency. In addition, excessive R s value may also reduce the short-circuit current density [Reference Song, Qiang, Zhao, Gu, Song and Liu33, Reference Kim, Yang, Lee, Choi, Ahn and Lee37] which can be seen in TiO2–2% graphene-based DSSC. In contrast, the low shunt resistance leads to power loss in DSSC, which is attributed to creation of an alternate current path for the photo-generated current. Thus, R sh should be high. Previous studies report that R sh for an efficient DSSC should be of the 103 order [Reference Mehmood, Ahmed, Hussein and Harrabi38]. The highest resistance obtained in this study is equal to 12,857 Ω, which is related to TiO2–1.5% graphene-based DSSC.
In addition, the normalization photovoltaic parameters change for the fabricated DSSCs with various photoanodes as shown in Fig. S2 (we named these electrodes as electrode TiO2–0.5% graphene (T–0.5% G) and so on). According to Fig. S2, with increasing the graphene concentration in the TiO2–graphene nanocomposite, the short-circuit current density, the open circuit voltage, and the efficiency increase initially and then decrease thus the highest efficiency is related to 1.5% graphene which shows a twice increase respect to the pure TiO2. This performance has significantly increased compared to previous similar reports [Reference Eshaghi and Aghaei39]. Although graphene can improve DSSC performance, but the excess concentration of graphene has a negative effect on DSSC photovoltaic properties. This means that by increasing the amount of graphene more than the optimal value (more than a concentration of 1.5% in TiO2–graphene nanocomposite), DSSC performance is reduced instead of increasing. As shown in Fig. 6(a), this trend agrees with changes in light absorption in photoanodes. As a result, the graphene plays an important role in performance of DSSC involving: (i) graphene reduces the TiO2 nanoparticles accumulation significantly, increases the effective surface area, and creates the numerous defects and pores which performs as a light capture center, (ii) by introducing the graphene in photoanode, the band gap energy level in nanocomposites decreases (compared to the TiO2 band gap energy level) and thus the presence of graphene increases the absorption of a wider range of incident light, and (iii) graphene in photoanode creates a life span or longer transfer distance for electrons and prevents the recombination of electrons–holes extensively, and on the other hand, the graphene enhances the electron transfer process and thus DSSC performance improves.
Although these results can be very promising, but the stability of DSSC is important to the practical application. Enhancing the long-term stability of DSSCs is currently considered to be a challenge. In fact, increasing the stability in DSSC means that DSSC is able to endure 108 turnovers corresponding to generate electricity for at least 20 years without losing their efficiency (life span). The evaluation of the lifetime of DSSCs is a difficult task because it depends on many factors such as material, manufacturing process, design, and so on. Although, increasing the stability of solar cells allows us to use them in working conditions such as different climates, tensile and pressure stresses, unbearable thermal conditions, continuous light illumination, humidity, and so on [Reference Mozaffari, Nateghi and Zarandi40]. For these reasons, owing to graphene’s high thermal stability, mechanical shocks and so on can be an alternative to silicon solar cells that have expensive and difficult manufacturing technology. This could make DSSCs as a good candidate for use in the new generation of the environmental-friendly vehicle, replacing fossil fuels for electricity generation, large area power applications, and so on.
Conclusion
In summary, the FE-SEM images and Raman spectra demonstrated that a good decoration of TiO2 nanoparticles on the graphene sheet that can be achieved using the chemical method. The XRD patterns and Raman spectra indicated that the TiO2 nanoparticles in TiO2–graphene nanocomposites are anatase. The results showed that the presence of graphene in photoanode can increase the electron lifetime, and as a result, the recombination will be minimal and DSSCs performance is significantly increased compared to standard DSSC (without graphene). The photovoltaic characterization of the fabricated DSSCs also showed that excessive graphene contained in the TiO2–graphene nanocomposite exhibits a negative effect on DSSC performance, so the fabricated DSSC by TiO2–1.5% graphene(optimal value) photoanode exhibits the best results by J SC = 11.02 mA/cm2 and an efficiency of 2.56%, which was more than twice that of the efficiency of TiO2 photoanode; however, if the concentration is greater than 1.5% (graphene concentration of 2%), the photovoltaic properties of the DSSC will decrease. The current density of DSSC is improved without sacrificing the V oc. As the photovoltaic parameters showed, the simple method for synthesizing the materials described in this study could be suggested to improve the design of new solar cells.
Experimental method
Synthesis of GO
GO was synthesized by modified Hummers method [Reference Ghayoor, Keshavarz, Soltani Rad and Mashreghi41]. For this propose, 2 g of graphite powder and 1 g of sodium nitrate (NaNO3) were added to 46 mL of sulfuric acid (H2SO4) and slowly stirred. The mixture was immersed in an ice-water bath to reduce the solution temperature to 10 °C. Then 6 g of potassium permanganate (KMnO4) was slowly added while stirring at 20 °C. The solution temperature was kept at 35 °C for 35 min. Subsequently, 95 mL of deionized water and 340 mL of hydrogen peroxide (H2O2) were added, respectively, to the solution, which the solution color was changed to brownish. Finally, the solution was filtered using a suitable filter. The filtered sediment was washed with hydrochloric acid and deionized water to remove the excess of acid in the sediment, and finally, the obtained GO was placed in the oven and dried at 60 °C for 48 h.
Synthesis of reduced GO (graphene)
Graphene was obtained by the reduction of GO. For this propose, 300 mg of GO powder was transferred into a beaker containing 100 mL of deionized water and was sonicated for 6 h to obtain the single-layer GO. To remove the functional groups, then 2 mL of hydrazine solution (N2H5OH) was added to the GO solution. The mixture was heated for 36 h at 100 °C under reflux condition. Afterward, the mixture was centrifuged, and the obtained solid was washed with the deionized water and ethanol. Finally, the reduced GO was dried in an oven at 60 °C for 24 h.
Preparation of TiO2 nanoparticles and TiO2–graphene nanocomposites
TiO2 nanoparticles and TiO2–graphene nanocomposites were synthesized by chemical method. To prepare the different concentrations of the TiO2–graphene nanocomposite, the different amounts of graphene (1 mg, 2 mg, 3 mg, and 4 mg) were added separately to a beaker containing 4 mL of ethanol and was sonicated for 3 h to obtain single-layer graphene. The mixtures were labeled by g1, g2, g3, and g4, accordingly. In the concurrent process, 200 mg of P25 powder was added to 4 mL ethanol and stirred for 6 h. Afterward, 400 mg ethyl cellulose, 2 g α-Terpineol, and 4 mL ethanol were added to the mixture and stirred for 2 h to obtain uniform distribution. To prepare a paste with specific weight ratios of graphene, each of solutions g1 to g4 was added to the mixture and stirred. The nanocomposites were named by TiO2–0.5% graphene, TiO2–1% graphene, TiO2–1.5% graphene, and TiO2–2% graphene, respectively. To prepare the TiO2 paste, the graphene solution was not added to the mixture.
Fabrication of photoanodes
FTO conductive glasses were cleaned in several steps with a detergent solution in an ultrasonic bath, followed by cleaning in deionized water for 6 min, hydrochloric acid for 6 min, acetone for 6 min, and ethanol for 6 min sequentially. To fabricate the photoanodes, the TiO2 and TiO2–graphene pastes were spread by doctor blade method in 0.25 cm2 area. The annealing the photoanodes were performed at 500 °C for 1 h.
Fabrication of the counter electrode
First, the FTO conductive glasses were washed according to the described instructions. Then, a uniform layer of platinum on the glass was created. Annealing the counter electrodes were performed at 450 °C for 15 min. After cooling the counter electrodes, they were immediately used to connect with photoanodes.
Fabrication of DSSCs
To sensitize the photoanodes with different concentrations of graphene, the made films were immersed in a 0.5 mM N719 ethanol solution for 24 h separately. Afterward, the films were washed with ethanol to remove the excess dye on the films and dried. The sensitized photoelectrodes containing TiO2–graphene films and Pt counter electrode were connected with a clamp. The electrolyte solution prepared from LiI, I2, TBAI, and TBPY in acetonitrile was dropped into space between two electrodes.
Characterization
X-ray diffraction (XRD; D8 ADVANCE, Bruker, Germany), field emission scanning electron microscope (FE-SEM; MIRA3, TESCAN, Czechia), FT-IR spectroscopy (Cary 660, Varian, North Carolina), and Raman spectroscopy (Raman Microscopy, P50C0R10, Takram, Iran) were used to confirm the TiO2 nanoparticles, graphene, and TiO2–graphene nanocomposites structures. The ability of light absorption in TiO2 and TiO2–graphene nanocomposites was analyzed by UV-vis spectroscopy (V-670, JASCO, Japan). The photovoltaic characterizations of the DSSCs were measured with a solar simulator under AM 1.5 irradiation. The illumination is simulated with a power density of 100 mW/cm2 and an irradiating area of 0.25 cm2. The measurement of photocurrent–voltage (I–V) (IV-28, IRASOL, Iran) was recorded to determine the photovoltaic properties.
Supplementary material
To view supplementary material for this article, please visit https://doi.org/10.1557/jmr.2019.142.