Introduction
Obesity is a serious global public health problem, affecting more than 890 million adults worldwide. 1 It is a chronic and multifactorial condition influenced by genetic, nutritional, metabolic, and environmental factors, which is characterized by excessive accumulation of adipose tissue, especially visceral white adipose tissue that compromises homeostasis and promotes metabolic and cardiovascular diseases. Reference Abrantes, Lamounier and Colosimo2
Excess adipose tissue promotes a chronic low-grade inflammatory state, with increased production of pro-inflammatory cytokines such as interleukin-6 (IL-6) and tumor necrosis factor-alpha (TNF-α) and reduced anti-inflammatory adipokines as interleukin-10 (IL-10) and adiponectin, leading to insulin resistance and hyperglycemia. Reference Khan, Chan, Revelo and Winer3,Reference Santareno, Cerqueira, Português, Cruz, Ramalho and Guimarães4 These metabolic and inflammatory conditions frequently present in obesity contribute to the development of dyslipidemia, hypertension, type 2 diabetes, cardiovascular disease (CVD), and cancer, and as such is a serious social public problem. Reference Casas, Castro-Barquero, Estruch and Sacanella5–Reference Wouk, Dekker, Queiroz and Barbosa-Dekker7
Among women, obesity impacts on fertility and an increased risk of polyendocrine metabolic ovarian syndrome (PMOS). During pregnancy, obesity increases the likelihood of miscarriage, pre-eclampsia, premature birth, fetal malformations, and macrosomia, in addition to hindering breastfeeding and promoting retention of body weight. Reference Pinheiro, Rocha Soares and Oliveira Lima8,Reference Ramos-Levi, Fernández-Pombo and García-Fontao9 The hyperglycemic and hyperinsulinemic intrauterine environment of the obese mother exposes the fetus to high levels of glucose and fatty acids, increasing the risk of metabolic disorders in adulthood. Reference Lewandowska10,Reference Reichetzeder11
Controlling gestational weight gain is essential to prevent obstetric and metabolic complications. Reference Gaillard, Durmuş, Hofman, Mackenbach, Steegers and Jaddoe12 Non-pharmacological strategies, dietary re-education, and physical activity are priorities. Reference Mcauliffe, Killeen and Jacob13 Drug treatment is generally contraindicated due to safety concerns, with insulin used for the treatment of type 2 diabetes mellitus and gestational diabetes mellitus, and metformin being used only in specific cases. Reference Brown, Martis, Hughes, Rowan and Crowther14
Metabolic imbalance during pregnancy is a determining factor for the development of obesity and metabolic disorders in offspring and is associated with the phenomenon of metabolic programming, an epigenetic process influenced by nutrition, the environment, and maternal stress. Reference De Gusmão Correia, Volpato, Águila and Mandarim-de-Lacerda15
Epigenetics is the main mechanism for transmitting phenotypes between generations, acting through reversible modifications in gene expression without altering the DNA sequence. Reference Gallou-Kabani and Junien16,Reference Heard and Martienssen17 Changes such as DNA methylation and histone acetylation are sensitive to maternal nutritional and metabolic status and can affect fetal growth and predispose them to metabolic diseases in adulthood. Reference Gomes, Bueno and Schamber18,Reference Izquierdo and Crujeiras19
Maternal nutrition plays a central role in this process. Unbalanced diets, obesity, alcohol consumption, and exposure to oxidative stress during pregnancy compromise nutrient and hormone homeostasis, interfering with the development of fetal organs and systems. Reference Fall and Kumaran20,Reference Moreno-Fernandez, Ochoa, Lopez-Frias and Diaz-Castro21 The placenta acts as an essential link in this regulation, and its efficiency in transporting nutrients is directly related to fetal health and growth. Reference Salto, Girón and Manzano22
During the perinatal period, excess glucocorticoids can alter neuroendocrine and metabolic programming, promoting the onset of metabolic syndrome, insulin resistance, and dyslipidemia. Reference Facchi, Lima, Oliveira, Costermani, Miranda and de Oliveira23 These changes may persist during lactation, through changes in breast milk nutrients and circulating hormone levels. Reference Parrela, Borkenhagen and Salmeron24
Breastfeeding plays an important role in the prevention of chronic non-communicable diseases, such as obesity, diabetes mellitus, and CVD. In addition, breast milk has anti-inflammatory properties, attributed to the presence of cytokines and immune cells. Reference Kelishadi and Farajian25–Reference Zambruni, Villalobos and Somasunderam27
It is well known that breast milk is a complex biological fluid responsible for providing nutrition and bioactives compounds that contribute to immune protection, and growth and development of the newborn. Its composition includes proteins, lipids, sugars and molecules capable of promoting the formation and maturation of organs and systems. In addition, its chemical composition can be influenced by several factors, including the stage of lactation, genetic and environmental aspects, as well as maternal nutritional and metabolic status. Reference Grapov, Lemay and Weber28,Reference Wu, Domellöf, Zivkovic, Larsson, Öhman and Nording29
Based on Barker’s studies, the thrifty phenotype hypothesis emerged, forming the basis of the Developmental Origins of Health and Disease (DOHaD) theory, which proposes that an adverse intrauterine environment induces fetal adaptations with lasting metabolic repercussions. Reference Moreno-Fernandez, Ochoa, Lopez-Frias and Diaz-Castro21 The classic example of the “Dutch famine” of 1944 demonstrated a higher incidence of cardiovascular disease and diabetes in adults exposed to intrauterine nutritional restriction.
Currently, both low and high birth weights are recognized to increase the risk of chronic non-communicable diseases. Reference Peral-Sanchez, Hojeij, Ojeda, Steegers-Theunissen and Willaime-Morawek30,Reference De Souza, Bray and Carey31 Therefore, understanding how nutritional interventions and bioactive compounds can positively modulate metabolic programming is essential to prevent metabolic disorders in mothers and their offspring and promoting better health throughout life.
β-Glucans are glucose biopolymers present in the cell walls of fungi, algae, and cereals such as oats and barley, and also occur as exopolysaccharides (EPS) produced by microorganisms and secreted exocellularly during fermentation processes. Reference Peral-Sanchez, Hojeij, Ojeda, Steegers-Theunissen and Willaime-Morawek30,Reference De Souza, Bray and Carey31 These polysaccharides have attracted considerable interest due to their biological properties, including antimicrobial, antioxidant, hypocholesterolemic, antidiabetic, antitumor, and immunomodulatory effects. Reference Dekker, Barbosa-Dekker, Oliveira, Radhouani and Reis32 The structure of β-glucans, composed predominantly of β-(1→3) and β-(1→6) bonds, is fundamental to their biological activities, which include activation of macrophages, T lymphocytes, and natural killer (NK) cells, stimulating the innate and adaptive immune responses. Reference Wouk, Dekker, Queiroz and Barbosa-Dekker7–Reference Yan, Vetvicka and Xia34
Among the β-glucans, botryosphaeran, an exopolysaccharide produced by the fungus Botryosphaeria rhodina MAMB-05 is highlighted because of its demonstrated biological functions. Reference Barbosa, Steluti, Dekker, Cardoso and Corradi da Silva35,Reference Miranda-Nantes, Fonseca and Zaia36 Structurally, botryosphaeran consists of a main chain of β-(1→3) glucosidic linkages with β-(1→6)-linked branch points comprizing glucose and gentiobiose (frequency of branching of 21%), possessing a triple helix conformation that enhances its biological properties. Reference Giese, Dekker, Barbosa and Da Silva37
Studies report that botryosphaeran has anti-hyperglycemic and hypocholesterolemic effects in models of diabetes and dyslipidemia. Reference Miranda-Nantes, Fonseca and Zaia36 In animal models of obesity induced by high-fat and high-sugar diet, botryosphaeran was able to reduce hepatic steatosis, insulin resistance, dyslipidemia, and glucose intolerance. Reference Silva, Costa and Souza38–Reference Fabiane, Silva and Netto40
Additionally, botryosphaeran demonstrated antiproliferative activity on breast cancer cells (MCF-7), promoting cell cycle arrest in the G0/G1 phase, apoptosis, and oxidative stress, and antitumor effects in obese and non-obese animals with Walker-256 tumor, mechanisms associated at least in part by the activation of AMP-activated protein kinase (AMPK) and forkhead transcription factor 3 A (FOXO3a). Reference Queiroz, Fortes, da Cunha, Barbosa, Khaper and Dekker41,Reference Geraldelli, Ribeiro and Medeiros42 These results reinforce its therapeutic potential as a multifunctional biological agent.
Considering that maternal and gestational obesity contributes to metabolic changes and cardiovascular risks for both the mother and her offspring, botryosphaeran emerges as a promising natural compound with possible anti-obesogenic and maternal-fetal protective effects. The study reported herein aims to evaluate the effects of botryosphaeran during pregnancy in an experimental model of obesity, investigating the ability of this (1→3)(1→6)-linked β-D-glucan to improve maternal and neonatal metabolic parameters, as increasing insulin sensitivity, correcting dyslipidemia, and reducing cardiovascular risk, contributing to the understanding of its potential safe therapeutic use in future clinical applications.
Material and methods
Animals and experimental model
Female Wistar rats obtained from the Biotério Central of Federal University of Mato Grosso (UFMT) were used in this study. The groups were organized according to the initial body weight of the rats, maintaining a homogeneous number of individuals per cage equivalent to the average body weight. The rats were kept throughout the experimental period in polypropylene cages, at a temperature of 22°C ± 2°C under a relative humidity of 55% ± 5%, in a regular 12-h light–dark cycle and with water and feed ad libitum.
During the first eight weeks, since the introduction of standard feed ration and high-calorie feed, the animals were divided into two groups: Control Group (n = 9) and Obese Group (n = 9), with 4–5 animals per cage.
The animals in the Control Group were fed standard rodent ration (NUVILAB CR-1, Colombo, Paraná, Brazil; containing 4% lipids) and drinking water. To induce obesity, the animals in the Obese Group received a high-fat diet (containing NUVILAB CR-1 feed powder, processed foods, lard, protein supplement, vitamin and mineral mixture) and water containing sucrose (300 g/l). The dietary model and composition of the diets were established previously. Reference Comiran, Ribeiro and Silva43 The animals received this feed throughout the experimental period, including the gestation and lactation periods described below.
After 8 weeks, since the begin of obesity induction, virgin, female Wistar rats were mated with proven male breeders (2 females per 1 male) at the end of the light cycle (18:00 p.m.). After that, a vaginal smear washed with saline solution (NaCl, 0.9%, w/v) was collected to evaluate the presence of spermatozoa at the beginning of light cycle (between 7:30 a.m. and 8:00 a.m.). The day of conception (day zero of pregnancy) was confirmed by the presence of spermatozoa in a vaginal smear, which was performed with the aid of an optical microscope, as previously reported. Reference Parrela, Borkenhagen and Salmeron24 After pregnancy was confirmed, the females were separated from the males and kept in individual cages during the gestation and lactation periods (Figure 1).
Experimental design for mating and pregnancy detection.

Figure 1. Long description
Panel A: The diagram shows the experimental setup for control and obese groups of mice. Control group (n=9) receives a standard diet and water, while the obese group (n=9) receives a hyperlipidic diet and sucrose water. Panel B: After mating, the control group is split into pregnancy control (PC, n=5) and botryosphaeran pregnancy control (BPC, n=4). The obese group is split into pregnancy obese (PO, n=4) and botryosphaeran pregnancy obese (BPO, n=5). Panel C: Botryosphaeran treatment is administered at 12 mg/kg/day during pregnancy. Panel D: Pups are born and weaned on the 22nd day. Panel E: Intraperitoneal glucose tolerance test (IPGTT) is conducted on the 24th day. Panel F: Euthanization of the offspring and dams occurs on the 25th day.
At conception, female rats were subdivided as follow: pregnant rats did not treat with botryosphaeran [control (PC, n = 5) and obese (PO, n = 4)], and pregnant rats treated with botryosphaeran [botryosphaeran control (BPC, n = 4) and botryosphaeran obese group (BPO, n = 5); Figure 1].
Botryosphaeran treatment was performed by gavage (12 mg/kg body weight (b.w.)/day) during the last two-thirds of the gestation (14 days), while the groups did not treat (PC and PO) received saline solution by gavage (Figure 1). The dose of botryosphaeran given to the rats was based on previous studies and represents the dose at which anti-obesogenic activity was observed in male obese Wistar rats. Reference Silva, Costa and Souza38,Reference Ribeiro, Silva and Giordani39
Rat offspring assessment
At birth, the number of live born, the sex (number of female and male), as well as the birth weight of pups were evaluated. In order to maintain a standard number of animals per lactating mother, the litter size was adjusted to 8 pups per mother, preferably using an equal number of male and female pups. Animals that exceeded the number of 8 per litter were euthanized.
It was necessary to maintain eight pups per rat, as standardizing the number of pups per mother is important. It is known that the greater the number of pups, the more intense the competition among them for nursing; if the number of pups per mother is not adjusted, significant error or bias could be introduced into the study, given that unequal breast milk intake per offspring can impact each pup’s life and overall development.
Milk consumption by the offspring was measured on days 6, 11, and 16 of the animals’ lives, as previously reported. Reference Parrela, Borkenhagen and Salmeron24 To determine milk intake, the pups were fasted for 4 h by separating them from their mothers to this period. After that, the rats were weighed and placed with their mothers for free feeding for 1 h, after which they were weighed again. Therefore, the difference between the post-feeding weight minus the pre-feeding weight was the result of the amount of milk ingested by the offspring.
On the 22nd day of lactation, the animals were weaned and placed in separate cages for male and female offspring.
On the 24th day, glucose tolerance was assessed in the dams and offspring by the intraperitoneal glucose tolerance test (IPGTT; Figure 1).
On the 25th day of life, the offspring and their dams were euthanized by decapitation, and blood samples were collected to evaluate fasting glucose, lipid profile, ferric profile, quantitative C-reactive protein (qCRP) and relative tissue weight.
Body weight gain was also determined during these days, with body weight measured every two days.
Production of botryosphaeran
Botryosphaeran was produced by Botryosphaeria rhodina isolate MAMB-05 by submerged fermentation on nutrient medium containing 6% (w/v) sucrose and was isolated from the cell-free fermentation broth by alcohol precipitation, followed by freeze-drying. Reference Barbosa, Steluti, Dekker, Cardoso and Corradi da Silva35 The lyophilized botryosphaeran powder was dissolved in distilled water at a concentration of 2 g/L, and kept at 50°C for ∼10 h to completely dissolve. After that the solution was autoclaved at 121°C for 20 min and stored at 4°C for later use.
Characterization of obesity
Obesity was characterized by assessing the body weight change of the rats throughout the experimental period, as well as their body weight gain, absolute and relative body weights (g/100 g b.w.) of retroperitoneal and perigonadal adipose tissue, and by the adiposity index (AI) calculated from the following equation:
 ${\rm Adiposity\ Index} = \left[ \matrix{{\rm perigonadal\ adipose\ tissue\ (g)} \cr+ {\rm retroperitoneal\ adipose\ tissue\ (g)}} \over {\rm body\ weight\ (g)} \times 100 \right]$
The term “perigonadal adipose tissue” refers to periovarian adipose tissue in females and periepididimal adipose tissue in males, as reported in the respective tables.
After the animals were euthanized, tissues such as adipose tissue (gonadal and retroperitoneal fat), skeletal muscle (soleus and extensor digitorum longus (EDL)), liver, kidneys, spleen, heart, and hypothalamus were removed to determine absolute weight (g) and relative weight (g/100 g body weight).
Analysis of feed, calories, and water consumption
To determine daily feed consumption, the Control and Obese rats (mothers; from the 1st to the 8th week of obesity induction period, before gestational period) were kept in polypropylene cages (4-5 animals per cage) where 500 g of standard ration was provided for the control group, and 500 g of high-calorie feed for the obese group. After 48 or 72 h (typically on weekends), the remaining feeds were weighed again, and consumption was divided by the number of animals in the cage, and by 2 or 3 days (a value relative of the interval between weighings). The analysis of daily feed and water consumption was performed during the 8-week period of the experiment. The period of induced obesity was to evaluate feed consumption from the beginning of the experiment (1st week) to the last week before pregnancy (8th week).
The same protocol was applied for the analysis of water consumption: 500 mL of water for the control group and 500 mL of water with sucrose (300 g/L) for the obese group. The animals’ consumption expressed in calories was obtained using the following formula:
PC and BPC groups:
 $\eqalign{& [ ( {\rm feed\ consumed/day/rat\ (g)} \times 3.80 {\rm \ (kcal)} ) \\& \,\, + ( {\rm water\ consumed/day/rat\ (mL)} \times 0 {\rm \ (kcal)} ) ] \\& \,\,= {\rm calories\ consumed\ per\ day\ per\ rat\ (kcal)}}$
PO and BPO groups:
 $\eqalign{& [ ( {\rm feed\ consumed/day/rat\ (g)} \times 4.85{\rm \ (kcal)} ) \\& \,\, + ( {\rm water\ consumed/day/rat\ (mL)} \times 1.2{\rm \ (kcal)}) ] \\& \,\, = {\rm calories\ consumed\ per\ day\ per\ rat\ (kcal)}}$
Analysis of biochemical parameters
To evaluate biochemical parameters, the animals were fasted for 12 h, then euthanized, and blood samples were collected in sterile microtubes and kept in a cooler containing ice. The samples were then centrifuged (1107 g/10 min; at room temperature; Eppendorf® Centrifuge 5804-R, Hamburg, Germany). Serum obtained was stored at – 80°C for subsequent biochemical analyses: total cholesterol, high-density lipoprotein cholesterol (HDL-cholesterol), triglycerides, iron, ferritin, and qCRP using commercial kits (Roche Diagnóstica Brasil® Ltda., São Paulo, SP, Brazil). Tests were carried out using a Cobas Pure C303 analytical unit automatic biochemical analyzer.
For low-density lipoprotein cholesterol (LDL-cholesterol) and very low-density lipoprotein cholesterol (VLDL-cholesterol) analysis, the Friedewald equation was applied to obtain the results. Reference Friedewald, Levy and Fredrickson44
The concentration of VLDL-cholesterol was calculated from the formula:
 ${\rm VLDL-cholesterol\ (mg/dL)} = {{\rm Triglycerides\ (mg/dL)} \over 5}$
LDL-cholesterol levels were determined according to the formula:
 $\eqalign{& {\rm LDL-cholesterol\ (mg/dL)} = {\rm total\ cholesterol\ (mg/dL)} \\& \, - {\rm HDL-cholesterol\ (mg/dL)} - {\rm VLDL-cholesterol\ (mg/dL)}}$
To calculate the TyG index, an index used to evaluate insulin resistance, triglyceride, and blood glucose values were used. The formula applied is the natural logarithm (Ln) of the product of triglyceride (TG) values (mg/dL) and fasting blood glucose (FBG) (mg/dL) divided by 2
 ${\rm TyG} = \ln\left({{\rm TG}_{({\rm mg/dL})} \times {\rm FBG}_{({\rm mg/dL})} \over 2}\right)$
The Castelli Index I and Castelli Index II assess cardiovascular risk based on the ratio between cholesterol fractions and were calculated as follows: Castelli Index I = total cholesterol (mg/dL) / HDL-cholesterol (mg/dL); Castelli Index II = LDL-cholesterol (mg/dL) / HDL-cholesterol (mg/dL).
Intraperitoneal glucose tolerance test (IPGTT)
To perform the test, the animals fasted from 10 to 12 h (from 8:00 p.m. to 8:00 a.m.). At the end of the fasting period, a blood sample was collected from the caudal vein through a small incision in the tail region; this corresponded to basal blood glucose (T0). Next, a glucose solution (0.5 g/mL) was administered at a dose of 2.5 g/kg of body weight via intraperitoneal injection. Blood samples were then collected at 10, 20, 30, and 60 min after glucose administration. The glucose concentration was determined using reagent strips and a glucometer (ACCU-CHEK® ACTIVE, Roche Diabetes, Brazil). The result was obtained from the area under the curve, represented by glucose [(mg/dL/min) × 1,000].
Statistical analysis
The data were presented as the mean ± standard deviation and were submitted to the Shapiro–Wilk normality test. The two-way analysis of variance (ANOVA) test, followed by Tukeys multiple comparison test, was used to compare more than two means. Non-parametric data were analyzed using the Kruskal–Wallis test, followed by Dunn’s post-hoc test, and in this case the results were expressed as median and interquartile percentage (25% and 75%). A confidence level of p <0.05 was used. All statistical analyses were performed using GraphPad Prism version 8.0 (Windows GraphPad Prism Software, San Diego/CA, USA).
Results
Food, water, and caloric consumption of the rats
During the 8 weeks prior to the pregnancy period, food, water, and caloric consumption were assessed daily. Animals in the obese group (O, n = 9) showed significantly lower food intake (7.72 ± 1.85 g/day/rat) compared to the control group (C, n = 9) (18.19 ± 1.88 g/day/rat; p < 0.0001). Water consumption was also significantly reduced in the obese group (20.37 ± 2.04 mL/day/rat) relative to controls (28.69 ± 5.37 mL/day/rat; p < 0.0001). Similarly, caloric intake was lower in the obese group (61.89 ± 9.22 Kcal/day/rat) compared to the control group (69.12 ± 7.16 Kcal/day/rat; p < 0.01). Statistical analysis was performed using Student’s t-test, and results are expressed as mean ± standard deviation.
Maternal body weight during gestational period
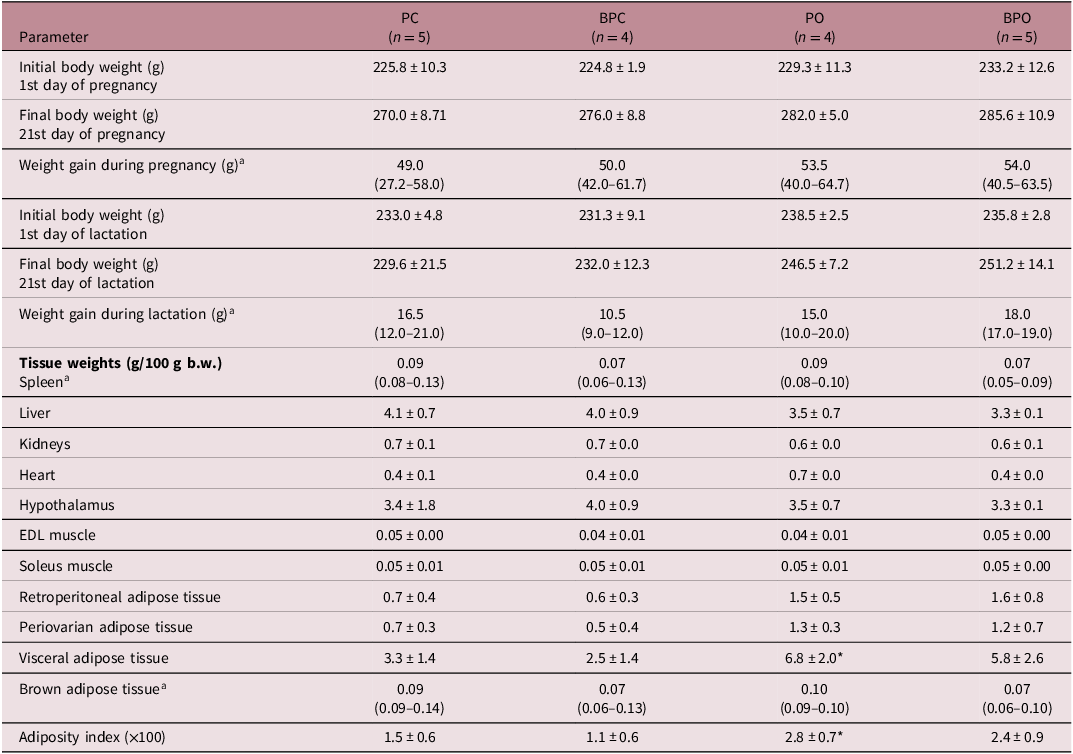
During the gestational period, rats in the PC and BPC groups received standard feed and drinking water, while rats in the PO and BPO groups were fed a high-fat/high-sugar (sucrose) diet. The weight progression of the females throughout gestation showed a progressive increase in body weight in all groups, with no statistically significant differences between them (Table 1).
Maternal biological parameters

Table 1. Long description
A table comparing maternal biological parameters across different groups during pregnancy and lactation. The table has 18 rows and 5 columns. Column headers are Parameter, PC (n = 5), BPC (n = 4), PO (n = 4), and BPO (n = 5). Row labels include Initial body weight (g) 1st day of pregnancy, Final body weight (g) 21st day of pregnancy, Weight gain during pregnancy (g), Initial body weight (g) 1st day of lactation, Final body weight (g) 21st day of lactation, Weight gain during lactation (g), Tissue weights (g/100 g b.w.) Spleen, Liver, Kidneys, Heart, Hypothalamus, EDL muscle, Soleus muscle, Retroperitoneal adipose tissue, Periovarian adipose tissue, Visceral adipose tissue, Brown adipose tissue, and Adiposity index (x100). Each row provides specific values for each group. Notable trends include variations in weight gain during pregnancy and lactation, as well as differences in tissue weights across the groups.
Groups: Pregnancy Control (PC) (n = 5), Botryosphaeran Pregnancy Control (BPC) (n = 4), Pregnancy Obese (PO) (n = 4), and Botryosphaeran Pregnancy Obese (BPO) (n = 5). The results were analyzed by Two-way ANOVA followed by Tukey’s post-hoc test and were presented as the mean ± standard deviation.
a Results analyzed by Kruskal–Wallis test, followed by Dunn’s post-hoc analysis, and values expressed as the median and interquartile range (25%–75%). EDL, extensor digitorum longus. *p < 0.05 vs. PC.
Initial and final body weights as well as body weight gain showed no significant differences between the groups (Table 1).
Maternal biological parameters
The biological parameters of spleen, liver, kidneys, heart, hypothalamus, muscle tissue, brown adipose tissue, and periovarian and retroperitoneal adipose tissue remained similar across all groups. In relation to total visceral fat and adiposity index this was significantly higher in the PO group than the PC group, and botryosphaeran did not alter these parameters, maintaining the value between the control and obese groups (Table 1).
Maternal biochemical parameters and glycemic profile
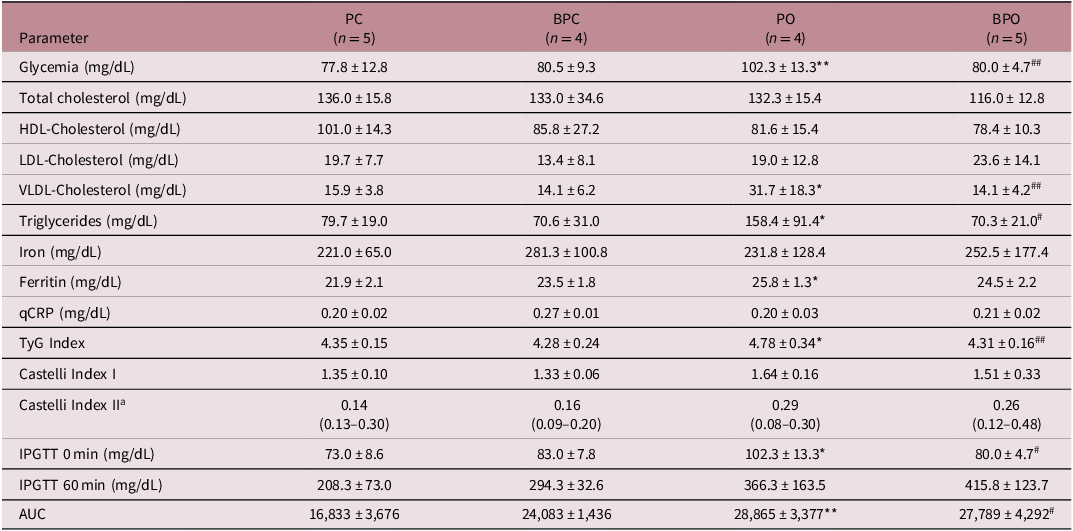
The PO group showed a significant increase in blood glucose, VLDL-cholesterol, triglycerides, and ferritin levels compared to the PC group. The TyG index, used as a marker to evaluate insulin resistance, was also higher in the obese female rats, indicating metabolic impairment. Conversely, treatment with botryosphaeran significantly reduced blood glucose, triglyceride, VLDL-cholesterol concentrations, and the TyG index in the BPO group compared to the PO group, suggesting a beneficial effect on the metabolic profile. Total cholesterol, HDL-cholesterol, and LDL-cholesterol values, as well as iron and CRP levels, did not show significant differences between the groups (Table 2). No statistical differences were observed for the Castelli I and II indices between groups (Table 2).
Maternal biochemical parameters

Table 2. Long description
The table presents maternal biochemical parameters for four groups: PC, BPC, PO, and BPO. It includes measurements for glycemia, total cholesterol, HDL-cholesterol, LDL-cholesterol, VLDL-cholesterol, triglycerides, iron, ferritin, qCRP, TyG index, Castelli index I, Castelli index II, IPGTT 0 min, IPGTT 60 min, and AUC. Each group has a specified number of samples (n). The table lists values for each parameter, with some values marked with asterisks or hashtags indicating statistical significance. The parameters are measured in various units such as mg/dL. The table provides a detailed comparison of these biochemical parameters across the different groups.
Groups: Pregnancy Control (PC) (n = 5), Botryosphaeran Pregnancy Control (BPC) (n = 4), Pregnancy Obese (PO) (n = 4), and Botryosphaeran Pregnancy Obese (BPO) (n = 5). The results were analyzed by Two-way ANOVA followed by Tukey’s post-hoc test and were presented as the mean ± standard deviation. Each sample measured in duplicate or triplicate.
a Results analyzed by Kruskal–Wallis test; values expressed as the median and interquartile range (25%–75%). HDL, high-density lipoprotein; LDL, low-density lipoprotein; VLDL, very low-density lipoprotein; qCRP, quantitative C-reactive protein; TyG, Triglyceride–Glucose Index; IPGTT, Intraperitoneal Glucose Tolerance Test; AUC, Area Under the Glucose Curve. Blood glucose levels measured at baseline (0 min) and 60 min after glucose administration. *p < 0.05 vs. PC; **p < 0.01 vs. PC; # p < 0.05 vs. PO and ## p < 0.01 vs. PO.
Results from the IPGTT showed that the PO group exhibited a significant increase in the glycemic curve compared to the PC group, a difference that persisted throughout the test. The basal glucose level and the area under the curve (AUC) were significantly higher in the PO group compared to the PC group, indicating glucose intolerance in the rats from the PO group. Botryosphaeran was effective in correcting the basal glucose level and the glucose intolerance in the BPO group when compared to the PO group (Table 2).
Weight evolution of the female offspring
The body weight evolution curve showed that on days 16, 18, and 22, the rats in the BPOf (“f” refers to females) group had a significant reduction in body weight compared to the POf group, indicating a positive effect of maternal treatment with botryospheran. On day 22, the offspring in the POf group had a significantly higher body weight than the PCf group, suggesting that maternal obesity contributed to the increase in weight gain in the female offspring (Figure 2).
Data from female offspring. a). Body weight evolution from day 0 to day 22. b–d). Milk intake on the 6th, 11th, and 16th day of lactation. e). Glycemic curve during the intraperitoneal glucose tolerance test (IPGTT). f). AUC – area under the curve of the IPGTT. Groups: pregnancy control female (PCf) (n = 19), botryosphaeran pregnancy control female (BPCf) (n = 14), pregnancy obese female (POf) (n = 13), and botryosphaeran pregnancy obese female (BPOf) (n = 19). The results were analyzed by two-way ANOVA followed by Tukeys post-hoc test and were presented as the mean ± standard deviation. *p < 0.05 vs. PCf; ****p < 0.0001 vs. PCf; # p < 0.05 vs. POf and #### p < 0.0001 vs. POf.

Figure 2. Long description
Panel A: A line graph shows the evolution of body weight from day 0 to day 22. The x-axis represents age in days, and the y-axis represents body weight in grams. Four groups are depicted: PCf, BPCf, POf, and BPOf. Panel B: A bar graph shows milk intake on the 6th day of lactation. The x-axis lists the groups, and the y-axis represents milk intake in milligrams. Panel C: A bar graph shows milk intake on the 11th day of lactation. The x-axis lists the groups, and the y-axis represents milk intake in milligrams. Panel D: A bar graph shows milk intake on the 16th day of lactation. The x-axis lists the groups, and the y-axis represents milk intake in milligrams. Panel E: A line graph shows the glycemic curve during the intraperitoneal glucose tolerance test (IPGTT). The x-axis represents time in minutes, and the y-axis represents glycemia in mg/dL. Four groups are depicted: PCf, BPCf, POf, and BPOf. Panel F: A bar graph shows the area under the curve (AUC) of the IPGTT. The x-axis lists the groups, and the y-axis represents AUC in mg.
Milk intake on the 6th, 11th and 16th day of lactation
According to the female offspring’s milk intake data, on the 6th day of lactation the POf group consumed significantly more milk compared to the offspring of the PCf group (Figure 2b). However, on the 11th and 16th days of lactation, no statistically significant differences were observed among the experimental groups (Figs 2c and 2d, respectively).
Biological parameters of the female offspring
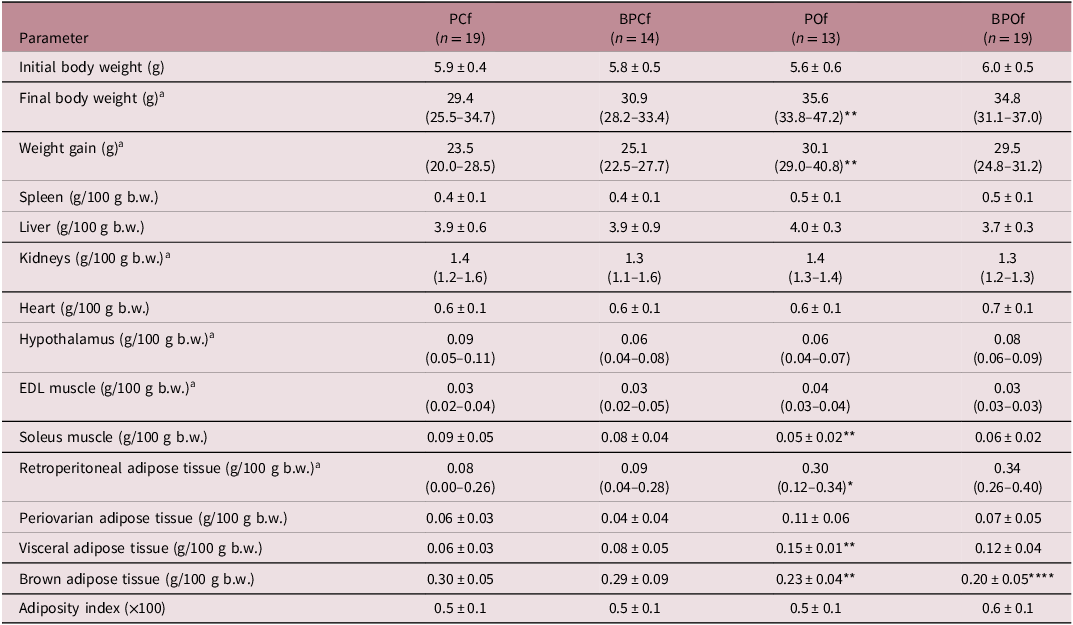
Analysis of the initial body weight of the female offspring on the day of birth showed no statistically significant differences among the groups. However, at the end of the study period, the final body weights and weight gains were significantly higher in the females of the POf group compared to the PCf group, this indicates higher weight gains in the offspring of obese mothers compared to those of eutrophic mothers (Table 3).
Biological parameters of the female pups (offspring)

Table 3. Long description
A table comparing biological parameters of female pups across different groups. The table has 19 rows and 5 columns. Column headers are Parameter, PCf (n = 19), BPCf (n = 14), POf (n = 13), and BPOf (n = 19). Row labels include Initial body weight (g), Final body weight (g), Weight gain (g), Spleen (g/100 g b.w.), Liver (g/100 g b.w.), Kidneys (g/100 g b.w.), Heart (g/100 g b.w.), Hypothalamus (g/100 g b.w.), EDL muscle (g/100 g b.w.), Soleus muscle (g/100 g b.w.), Retroperitoneal adipose tissue (g/100 g b.w.), Periovarian adipose tissue (g/100 g b.w.), Visceral adipose tissue (g/100 g b.w.), Brown adipose tissue (g/100 g b.w.), and Adiposity index (x100). Each row provides specific values for each group. Notable trends include variations in final body weight and weight gain among the groups, with the POf group showing higher values compared to the PCf group.
Groups: Pregnancy Control (PCf) (n = 19), Botryosphaeran Pregnancy Control (BPCf) (n = 14), Pregnancy Obese (POf) (n = 13), and Botryosphaeran Pregnancy Obese (BPOf) (n = 19). The results were analyzed by Two-way ANOVA followed by Tukey’s post-hoc test and were presented as the mean ± standard deviation.
a Results analyzed by Kruskal–Wallis test, followed by Dunn’s post-hoc analysis, and values expressed as the median and interquartile range (25%–75%). EDL, extensor digitorum longus. *p < 0.05 vs. PCf; **p < 0.01 vs. PCf and ****p < 0.0001 vs. PCf.
There were no significant differences in the weights of the spleen, liver, kidneys, heart, hypothalamus, and EDL muscle between groups. On the other hand, the POf group showed a significant reduction in soleus muscle and brown adipose tissue and showed an increase in retroperitoneal fat and total visceral fat when compared to those in the PCf group (Table 3). The adiposity index did not show statistically significant differences in the groups evaluated (Table 3), and botryosphaeran did not alter these parameters.
Biochemical parameters of the female offspring
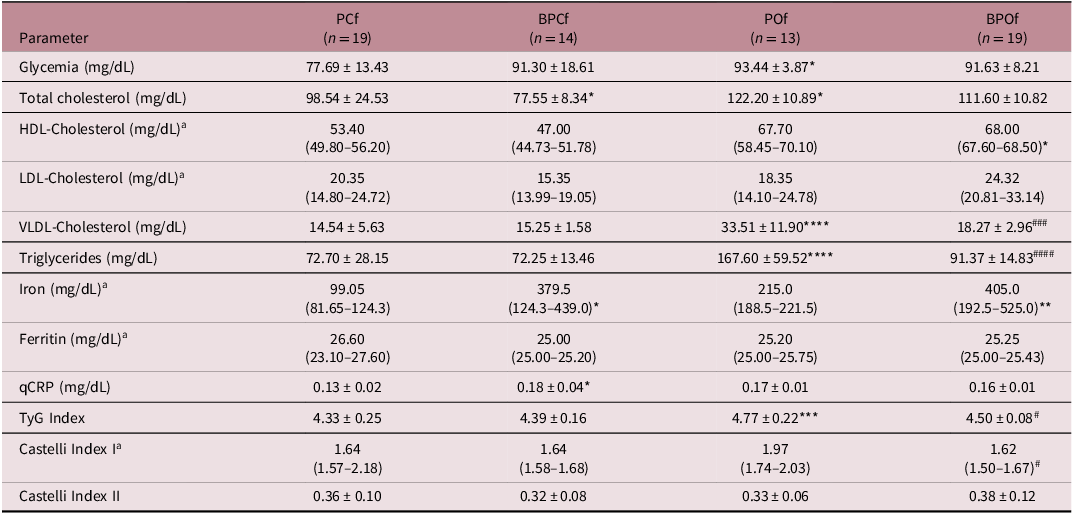
According to the biochemical analyses, the POf group showed significantly higher levels of blood glucose, total cholesterol, VLDL-cholesterol, triglycerides, and TyG index compared to the PCf group (Table 4). Treatment with botryosphaeran was effective in normalizing the levels of triglycerides, VLDL-cholesterol, TyG and Castelli I index within the BPOf group. Serum iron levels were elevated in the BPCf and BPOf groups, being statistically significant when compared to their respective untreated groups. No statistically significant differences were observed in ferritin levels between the groups. The BPCf group had significantly higher qCRP levels compared to the PCf group, with no relevant changes among the other experimental groups (Table 4).
Biochemical parameters of female offspring

Table 4. Long description
The table presents biochemical parameters of female offspring across four groups: PCf, BPCf, POf, and BPOf. It has 19 rows and 5 columns. The columns are labeled as PCf (n=19), BPCf (n=14), POf (n=13), and BPOf (n=19). The rows list various biochemical parameters and their corresponding values. Row 1: Glycemia (mg/dL), 77.69 ± 13.43, 91.30 ± 18.61, 93.44 ± 3.87*, 91.63 ± 8.21. Row 2: Total cholesterol (mg/dL), 98.54 ± 24.53, 77.55 ± 8.34*, 122.20 ± 10.89*, 111.60 ± 10.82. Row 3: HDL-Cholesterol (mg/dL), 53.40 (49.80–56.20), 47.00 (44.73–51.78), 67.70 (58.45–70.10), 68.00 (67.60–68.50)*. Row 4: LDL-Cholesterol (mg/dL), 20.35 (14.80–24.72), 15.35 (13.99–19.05), 18.35 (14.10–24.78), 24.32 (20.81–33.14). Row 5: VLDL-Cholesterol (mg/dL), 14.54 ± 5.63, 15.25 ± 1.58, 33.51 ± 11.90***, 18.27 ± 2.96###. Row 6: Triglycerides (mg/dL), 72.70 ± 28.15, 72.25 ± 13.46, 167.60 ± 59.52****, 91.37 ± 14.83####. Row 7: Iron (mg/dL), 99.05 (81.65–124.3), 379.5 (124.3–439.0)*, 215.0 (188.5–221.5), 405.0 (192.5–525.0)**. Row 8: Ferritin (mg/dL), 26.60 (23.10–27.60), 25.00 (25.00–25.20), 25.20 (25.00–25.75), 25.25 (25.00–25.43). Row 9: qCRP (mg/dL), 0.13 ± 0.02, 0.18 ± 0.04*, 0.17 ± 0.01, 0.16 ± 0.01. Row 10: TyG Index, 4.33 ± 0.25, 4.39 ± 0.16, 4.77 ± 0.22***, 4.50 ± 0.08#. Row 11: Castelli Index I, 1.64 (1.57–2.18), 1.64 (1.58–1.68), 1.97 (1.74–2.03), 1.62 (1.50–1.67)#. Row 12: Castelli Index II, 0.36 ± 0.10, 0.32 ± 0.08, 0.33 ± 0.06, 0.38 ± 0.12.
Groups: Pregnancy Control (PCf) (n = 19), Botryosphaeran Pregnancy Control (BPCf) (n = 14), Pregnancy Obese (POf) (n = 13), and Botryosphaeran Pregnancy Obese (BPOf) (n = 19). The results were analyzed by Two-way ANOVA followed by Tukey’s post-hoc test and were presented as the mean ± standard deviation.
a Results analyzed by Kruskal–Wallis test, followed by Dunn’s post-hoc analysis, and values expressed as the median and interquartile range (25%–75%). Each sample measured in duplicate or triplicate. HDL, high-density lipoprotein; LDL, low-density lipoprotein; VLDL, very low-density lipoprotein; qCRP, quantitative C-reactive protein; TyG, Triglyceride–Glucose Index. *p < 0.05 vs. PCf; **p < 0.01 vs. PCf; ***p < 0.001 vs. PCf; ****p < 0.0001 vs. PCf; # p < 0.05 vs. POf; ### p < 0.001 vs. POf and #### p < 0.0001 vs. POf.
Glycemic profile of the female offspring
The results of the IPGTT tests showed no statistically significant differences among the groups (Figures 2e and 2f, respectively).
Weight evolution of the male offspring
According to the results presented, on the 14th and 16th day of lactation, the male offspring from the BPOm group showed a significant reduction in body weight compared to the offspring from the POm group (Figure 3a).
Data from male offspring. a). Body weight evolution from day 0 to day 22. b–d). Milk intake on the 6th, 11th, and 16th day of lactation. e). Glycemic curve during the intraperitoneal glucose tolerance test (IPGTT). f). AUC – area under the curve of the IPGTT. Groups: pregnancy control male (PCm) (n = 19), botryosphaeran pregnancy control male (BPCm) (n = 16), pregnancy obese male (POm) (n = 11), and botryosphaeran pregnancy obese male (BPOm) (n = 13). The results were analyzed by two-way ANOVA followed by Tukeys post-hoc test and were presented as the mean ± standard deviation. *p < 0.05 vs. PCm; **p < 0.01 vs. PCm and # p < 0.05 vs. POm.

Milk intake on the 6th, 11th, and 16th day of lactation
The analysis of milk consumption by the male offspring showed that on the 6th and 11th days of lactation, there was no statistically significant difference between the groups (Figures 3b and 3c, respectively). However, on the 16th day of lactation, the offspring from the BPCm and BPOm groups showed a significant reduction in milk consumption compared to the offspring from the PCm group (Figure 3d).
Biological parameters of the male offspring
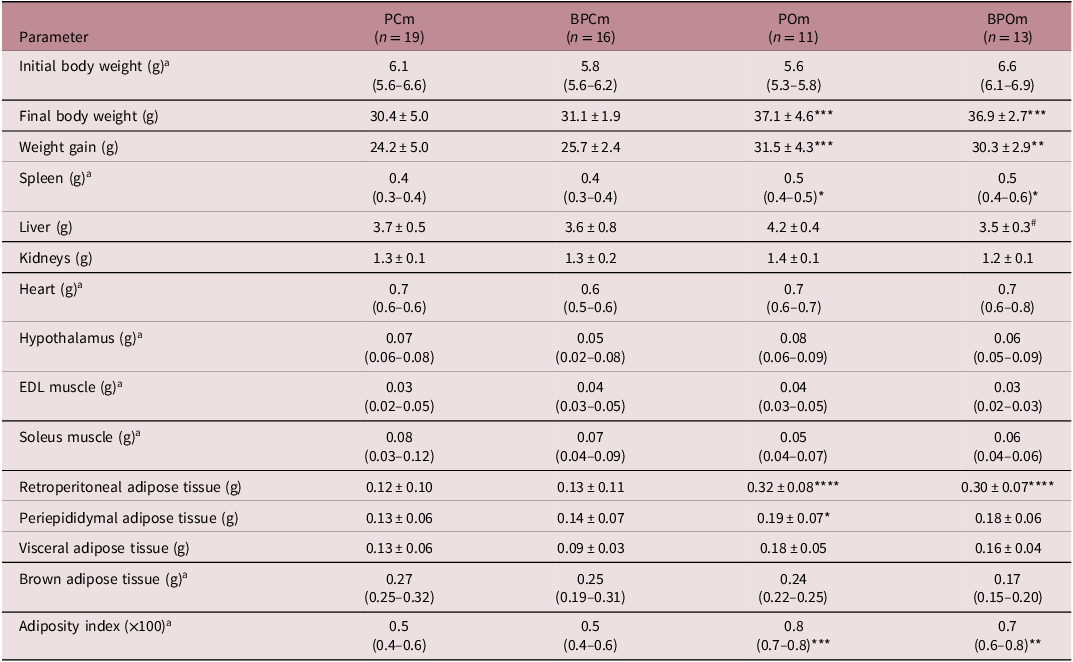
According to the results of the initial birth weight there was no statistically significant difference between the groups, the final body weights and weight gains were statistically higher in the POm and BPOm groups when compared to the PCm group (Table 5).
Biological parameters of male offspring

Table 5. Long description
The table presents biological parameters of male offspring across four groups: PCm, BPCm, POm, and BPOm. It has 19 rows and 5 columns. The columns are labeled Parameter, PCm (n = 19), BPCm (n = 16), POm (n = 11), and BPOm (n = 13). The rows list various biological parameters such as initial body weight, final body weight, weight gain, spleen weight, liver weight, kidneys weight, heart weight, hypothalamus weight, EDL muscle weight, soleus muscle weight, retroperitoneal adipose tissue weight, periepididymal adipose tissue weight, visceral adipose tissue weight, brown adipose tissue weight, and adiposity index. Each cell contains specific values or ranges for each parameter across the different groups.
Groups: Pregnancy Control male (PCm) (n = 19), Botryosphaeran Pregnancy Control (BPCm) (n = 16), Pregnancy Obese (POm) (n = 11), and Botryosphaeran Pregnancy Obese (BPOm) (n = 13). The results were analyzed by Two-way ANOVA followed by Tukey’s post-hoc test and were presented as the mean ± standard deviation.
a Results analyzed by Kruskal–Wallis test, followed by Dunn’s post-hoc analysis, and values expressed as the median and interquartile range (25%–75%). EDL, extensor digitorum longus. *p < 0.05 vs. PCm; **p < 0.01 vs. PCm; ***p < 0.001 vs. PCm; ****p < 0.0001 vs. PCm and # p < 0.05 vs. POm.
The male offspring of the POm and BPOm groups showed a significant increase in spleen weight in relation to the PCm group, whereas liver weights were statistically lower in the BPOm group when compared to the POm group (Table 5).
The weights of the kidneys, heart, hypothalamus, EDL and soleus muscle, and brown adipose tissue were not statistically different between the groups.
The weight of retroperitoneal adipose tissue was significantly higher in the POm and BPOm groups when compared to the PCm group, demonstrating an accumulation of white adipose tissue in male offspring of mothers that were obese (Table 5). Epididymal fat weights were significantly higher in the POm group compared to the PCm group. Similarly, the adiposity index was also significantly higher in the POm and BPOm groups when compared to the PCm group, confirming the presence of an obesity condition in male offspring from obese mothers since the first days of life.
Biochemical parameters of male offspring
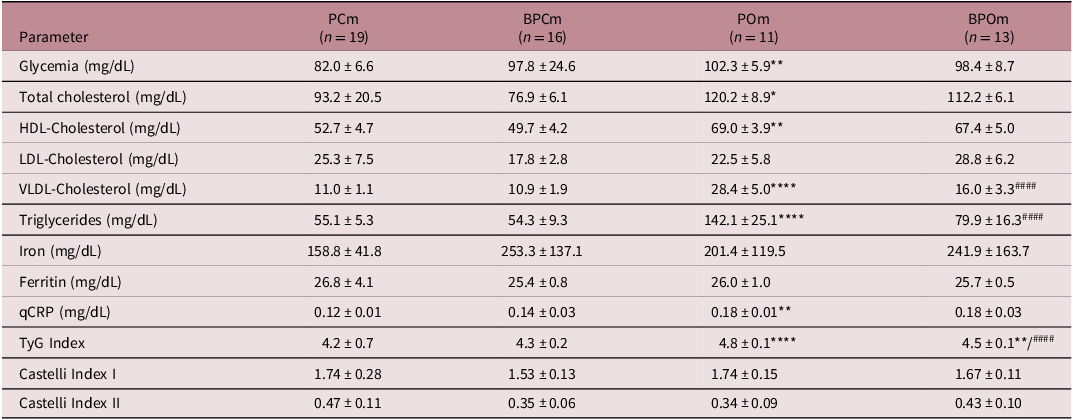
The analysis of the biochemical parameters of the male offspring demonstrated that the POm group had a significant increase in blood glucose, total cholesterol, HDL-cholesterol, VLDL-cholesterol, and triglycerides in relation to the PCm group. Treatment with botryosphaeran proved effective in reducing triglycerides and VLDL-cholesterol concentrations in the BPOm group when compared to the POm group (Table 6). No statistically significant differences were observed in the levels of the parameters LDL-cholesterol, iron, ferritin, and Castelli I and II indices between the groups.
Biochemical parameters of male offspring

Table 6. Long description
The table presents biochemical parameters for four groups of male offspring: PCm, BPCm, POm, and BPOm. It includes measurements for glycemia, total cholesterol, HDL-cholesterol, LDL-cholesterol, VLDL-cholesterol, triglycerides, iron, ferritin, qCRP, TyG Index, Castelli Index I, and Castelli Index II. Each group has a specified number of subjects (n). The table lists the mean values and standard deviations for each parameter. Notable trends include higher levels of glycemia, total cholesterol, HDL-cholesterol, VLDL-cholesterol, and triglycerides in the POm group compared to the PCm group. The BPOm group shows reduced triglycerides and VLDL-cholesterol levels compared to the POm group. No significant differences are observed in LDL-cholesterol, iron, ferritin, and Castelli I and II indices among the groups.
Groups: Pregnancy Control (PCm) (n = 19), Botryosphaeran Pregnancy Control (BPCm) (n = 16), Pregnancy Obese (POm) (n = 11), and Botryosphaeran Pregnancy Obese (BPOm) (n = 13). The results were analyzed by Two-way ANOVA followed by Tukey’s post-hoc test and were presented as the mean ± standard deviation. Each sample measured in duplicate or triplicate. HDL, high-density lipoprotein; LDL, low-density lipoprotein; VLDL, very low-density lipoprotein; qCRP, quantitative C-reactive protein; TyG, Triglyceride–Glucose Index. *p < 0.05 vs. PCm; **p < 0.01 vs. PCm; ****p < 0.0001 vs. PCm and #### p < 0.0001 vs. POm.
The POm group also showed a significant increase in qCRP levels compared to the PCm group (Table 6). The Tyg index was statistically higher in the POm group compared to the PCm group and botryosphaeran was effective in correcting insulin resistance and significantly decreased the Tyg index in the BPOm group when compared to the POm group (Table 6).
Discussion
Our findings demonstrated that pregnant rats submitted to a high-fat diet showed greater accumulation of visceral fat, increased adiposity index, insulin resistance, glucose intolerance, hyperglycemia, and dyslipidemia, both in the mothers and their offspring. We also demonstrated for the first time that botryosphaeran was effective in correcting these parameters thereby improving the metabolic profile of these rats during pregnancy, and in the first day of life of the offspring. These findings confirm the efficiency of the experimental model in inducing the so-called metabolic syndrome and confirmed the beneficial metabolic effects of this (1-3)(1-6)-linked β-D-glucan. Reference Batlle, Martínez de Morentin, San-Cristóbal, Pérez-Díez, Navas-Carretero and Martínez45,Reference Bovolini, Garcia, Andrade and Duarte46
Similarly, studies demonstrating that inducing obesity through a diet rich in lipids and sugar in male and female Wistar rats, contributed significantly to the development of the obesogenic phenotype. Reference Silva, Costa and Souza38,Reference Ribeiro, Silva and Giordani39,Reference Geraldelli, Ribeiro and Medeiros42 This condition was characterized by the accumulation of visceral adipose tissue, reduced muscle mass, greater weight gain compared to the control group, glucose intolerance, insulin resistance, and dyslipidemia, corroborating the efficacy of the experimental model used in the present study.
Overweight and obesity in the pre-pregnancy period substantially increased unfavorable clinical outcomes for both mother and the litters. Excessive maternal weight gain increases the risks of gestational hypertension, gestational diabetes, dyslipidemia, and pre-eclampsia. Reference Stubert, Reister, Hartmann and Janni47 Thus, the condition of hyperglycemia, glucose intolerance, insulin resistance, and dyslipidemia observed in the PO rats group confirms unfavorable clinical outcomes from mothers with obesity.
Observational studies in humans show a direct relationship between maternal obesity and cardiometabolic risk in offspring. Reference Boney, Verma, Tucker and Vohr48 In addition, children of obese mothers are more predisposed to developing childhood obesity and insulin resistance. Reference Hammoud, Visser, van Rossem, Biesma, Wit and de Valk49 In addition, according to studies, gestational obesity is associated with an increased risk of fat accumulation, especially visceral fat in organs such as the liver, heart, and muscle, in addition to a higher probability of occurrence of congenital anomalies. Reference Stothard, Tennant, Bell and Rankin50,Reference Brite, Laughon, Troendle and Mills51
In the present study, when investigating the repercussions of gestational obesity in rats, neonates from obese mothers showed significantly higher growth and adipose tissue accumulation than that observed in the control group. These findings corroborate the observed results, in which maternal obesity promoted, in the female rat offspring, an increase in the weight of visceral adipose tissue and reduced the soleus muscle; while in the male offspring, increases were observed in spleen, retroperitoneal and periepididymal fats, as well as adiposity index.
Obesity can trigger lipotoxicity and lipoapoptosis in the pancreas and insulin-sensitive tissues, contributing to the emergence, or worsening, of type 2 diabetes mellitus and dyslipidemia. Reference Dong, Zheng, Ford, Nathanielsz and Ren52 Insulin, as a fundamental anabolic hormone, participates in the storage of nutrients such as glycogen, triglycerides, and proteins, in addition to stimulating cell proliferation and fat deposition in target organs. Reference Frayn53
The biochemical data obtained in this study demonstrated that mothers with obesity presented a significant increase in levels of blood glucose, VLDL-cholesterol, triglyceride, and TyG index, as well as glucose intolerance, compared to the control group, characterizing a hyperglycemic and dyslipidemic profile. This condition favors greater glucose and lipid transfer across the placenta, contributing to the development of metabolic alterations in neonates. Reference Dube, Gravel and Martin54
The placenta is a fundamental organ that acts as a sensor and mediator of nutrient exchanges, in addition to being responsible for the production of essential hormones during fetal development. Reference Scifres, Chen, Nelson and Sadovsky55 However, when there is an imbalance in this transfer, a metabolic dysfunction is installed that culminates in the release of free fatty acids, insulin, and cholesterol into the umbilical circulation. Reference Diaz, Powell and Jansson56
Placentas of obese women are characterized by higher lipid content and accumulation of macrophages, cells that play a relevant role as pro-inflammatory mediators. The placental transcriptome of these women shows activation of genes associated with lipid metabolism, concomitant with a low-grade systemic inflammatory state, which may contribute to the intensification of insulin resistance. Reference Roberts, Smith, McLea, Heizer, Richardson and Myatt57
Additionally, recent evidence indicates that maternal obesity reduces the activity of the taurine placental transporter, affecting the regulation of cell volume, antioxidant function, and the proper functioning of the nervous, cardiovascular, and muscular systems. Reference Ditchfield, Desforges and Mills58
Corroborating these findings, the biochemical data obtained for the offspring indicate that both females and males from obese mothers showed significant elevations in the levels of glycemia, total cholesterol, VLDL-cholesterol and triglycerides, when compared to the control group. In addition, it was observed that, among the male offspring, HDL-cholesterol and qCRP levels were also increased in relation to the control animals.
Obesity and gestational diabetes exert a significant influence on intrauterine lipid transport. Reference Lassance, Haghiac and Leahy59 In placentas of obese mothers, increased expression of the fatty acid-binding protein FABP-4 and endothelial lipase is observed, resulting in lipid accumulation and reduced FABP-5 concentrations. Consequently, there is less uptake of omega-6 polyunsaturated fatty acids (oleic acid), which compromises fetal metabolism. Reference Brass, Hanson and O’tierney-Ginn60,Reference Saben, Lindsey and Zhong61
The analysis of the effects of botryosphaeran demonstrated that this β-glucan has important and beneficial metabolic effects. β-Glucans have been widely studied due to their hypoglycemic, hypocholesterolemic, antitumor, immunomodulatory, and antimicrobial potential. Reference Wouk, Dekker, Queiroz and Barbosa-Dekker7,Reference Dekker, Queiroz, Cunha, Barbosa-Dekker, Cohen and Merzendorfer33 In line with this, previous studies have shown that botryosphaeran is able to promote improvements in metabolic parameters and redox status in obese animals by increasing the activation of AMPK and FOXO3a in the adipose tissue of rats, modulating essential pathways for cellular energy homeostasis, favoring the uptake and use of glucose and lipids by tissues. Reference Silva, Costa and Souza38
In addition, similarly, observed that botryosphaeran significantly increases the activity of the FOXO3a, an important tumor suppression transcription factor, in the Walker-256 tumor of obese rats treated with this β-glucan, demonstrating a relevant antitumor effect of this exopolyssacharide in obese rats, as well as its role in the regulation of the cellular metabolic process, oxidative stress, and inflammatory response. Reference Geraldelli, Ribeiro and Medeiros42
FOXO proteins (FOXO1, FOXO3a, FOXO4, and FOXO6) play an important role in longevity and tumor suppression by up-regulating target genes associated with stress resistance, metabolism, cell cycle arrest, and apoptosis. Reference Dong, Guo and Li62–Reference Calnan and Brunet64
Obesity is associated with increased oxidative stress, characterized by high production of reactive oxygem species (ROS), and reduced capacity in antioxidant defenses. This redox imbalance compromises cellular homeostasis, promoting changes in metabolic function. It was observed that botryosphaeran exerts significant antioxidant effects on several tissues, evidenced by the reduction of malondialdehyde (MDA) levels and protein carbonylation, in addition to the increase in the concentration of ascorbic acid, results observed in obese female and male rats, in a condiction of tumor or without tumor. Reference Fabiane, Silva and Netto40
In this regard, we highlight that herein we assess the role of botryosphaeran seeking for its benefits against the outcomes of gestational obesity upon the rat offspring body composition and glucose homeostasis. Even though we did not have to measure biomarkers of inflammation and oxidative stress in maternal samples like blood, placenta, and/or milk, which represents one of the fragilities in our study, it is important to bring in light that the body of data showed in our study is suggestive that botryosphaeran offered to obese pregnant mothers can be mitigating inflammation and oxidative stress in its placenta, and it can be one of the central mediators on ameliorating metabolic dyshomeostasis programming effects in the obese rat offspring. Reference Zhang, Candia and Sferruzzi-Perri65
Several biological functions of these polysaccharides are reported to play an active role in reducing cholesterol, triglycerides, and glucose levels, thus contributing to reducing the risk of metabolic and cardiovascular diseases. Reference Wouk, Dekker, Queiroz and Barbosa-Dekker7
In the group of obese mothers treated with botryosphaeran, there was a significant reduction in triglyceride and VLDL-cholesterol levels, reversing the characteristic changes of the obesogenic state. This effect had a positive impact on the lipid profile of the offspring (Tables 4 and 6), correcting dyslipidemia and reducing cardiovascular risk. Although the hypocholesterolemic mechanism of β-glucans is not yet completely elucidated, it is known that β-glucans reduce bile acid absorption. Reference Dos Santos, Cury and Ferraz66 In addition, they may interfere with the dietary absorption of lipids, as well as the enterohepatic recirculation of cholesterol and bile acids. Reference Saben, Lindsey and Zhong61 Another relevant mechanism involves the fermentation of β-glucans by gut bacteria, resulting in the production of short-chain fatty acids (SCFA), which increase fecal excretion of cholesterol. Reference Wouk, Dekker, Queiroz and Barbosa-Dekker7–Reference Korolenko, Bgatova, Ovsyukova, Shintyapina and Vetvicka67
An increase in serum iron levels was observed in both BPCf and BPOf groups, and this increase was statistically significant when compared to the respective PCf and POf groups. In addition, the BPCf group had higher qCRP concentrations compared to the PCf group.
Botryosphaeran, because of its hypoglycemic effect and reduction of glycemic levels, can increase the iron absorption in the treated control and obese puppies. This finding agrees with evidence in the literature suggesting an interaction between glucose homeostasis and iron metabolism. In this context, a study conducted in mice demonstrated that treatment with metformin and dapagliflorzin reduced hepcidin levels and increased serum iron concentrations, indicating that agents used in the treatment of diabetes can modulate iron metabolism, by favoring its intestinal absorption. Reference Hilton, Sabaratnam, Drakesmith and Karpe68
The analysis of the mother’s IPGTT revealed that the group had a significant increase in glycemic levels compared to the control group. Maternal obesity compromised glucose homeostasis; evidence of glucose intolerance and insulin resistance. Although the treated obese group demonstrated a reduction in blood glucose level and improved insulin sensitivity, this response was not sufficient to restore glycemic tolerance, as the area under the curve remained increased in both the obese and in the treated obese groups.
Treatment with botryosphaeran in the obese group demonstrated efficacy in attenuating insulin resistance, improving insulin sensitivity, as described by. Reference Miranda-Nantes, Fonseca and Zaia36–Reference Silva, Costa and Souza38
The maternal metabolic environment exerts a direct influence on the initial growth of the placenta and on the performance of its functions. In this context, one of the potential mechanisms involves the modulation of insulin receptors, which are more expressed at the beginning of pregnancy. Reference Lassance, Haghiac and Leahy59
Regarding the offspring, no statistically significant differences were detected in the IPGTT test of the female offspring rats, suggesting maintenance of pancreatic function in all groups. However, among males, the results of IPGTT test were significantly higher in the POm and BPOm groups compared to the PCm group, which indicates impaired postprandial responsiveness and a state of glucose intolerance indicating β-pancreatic cell dysfunction in these groups.
Scientific evidence indicates that the long-term associations between maternal obesity and neonatal adiposity may be mediated by nutritional signals present in breast milk. Studies have shown that the milk of overweight or obese mothers presents high concentrations of insulin and leptin, as well as lower levels of omega-3 polyunsaturated fatty acids, transforming growth factor β2, and CD-14 protein. Reference Fields and Demerath69,Reference Lemas, Young and Baker70
Regarding milk consumption by the female offspring, it was observed that, on the 6th day of lactation, the POf group had significantly higher intake compared to the PCf group (Figure 2b). This increase may reflect adaptations in the dynamics of breastfeeding resulting from possible changes in the energy composition of the milk of obese mothers, as well as can be associated with the insulin resistance observed in this POf group. On the 11th and 16th days, however, no statistically significant differences were found between the groups (Figures 2c and 2d), suggesting stabilization of energy demand or progressive adaptation of the offspring to the composition of the milk.
For the male rat offspring, there was no significant difference in milk intake between the groups on the 6th and 11th days (Figures 3b and 3c). However, on the 16th day, the BPCm and BPOm groups showed significantly reduced intake compared to the offspring of the control group. This finding suggests the occurrence of changes in the feeding behavior of the offspring after botryosphaeran treatment or potential changes in metabolic status resulting from exposure to breast milk. In addition, such a reduction may reflect changes in the nutritional intake provided by the mother rats treated with botryosphaeran, possibly associated with variations in the biochemical composition of milk and in the metabolic signals present in it.
From the results obtained in this study, both in mothers treated during the gestational period, and in their offspring, are consistent with those previously described in females and male rats. Reference Silva, Costa and Souza38–Reference Fabiane, Silva and Netto40 Although the administration of botryosphaeran did not promote a significant reduction in the accumulation of adipose tissue or weight loss in the mothers, the treatment was effective in attenuating the dyslipidemia and improving insulin sensitivity, indicating beneficial metabolic effects independent of weight loss.
In addition, it is important to mentione that once this study does not have pair-feeding controls, the study still cannot distinguish direct fetal/neonatal effects of botryosphaeran from indirect effects mediated by altered maternal food intake or metabolism induced by botryosphaeran in the mothers, being it as a limitation of this study.
Conclusion
The present study constitutes the first experimental evidence of the effects of a fungal (1→3)(1→6)-β-D-glucan (botryosphaeran) on pregnant obese rats exposed to the treatment during pregnancy and in their exposed offspring, revealing its potential as a modulating agent of maternal and fetal metabolism. The findings confirm previous observations that botryosphaeran have antiobesogenic and hypocholesterolemic properties and hence contribute to the attenuation of metabolic dysfunctions characteristic of gestational obesity, improving the metabolic prolife of mathers and consequently its offspring.
New evidence within the framework of the DOHaD, emphasize that maternal nutritional interventions using β-glucans may modulate fetal metabolic programming and reduce the intergenerational transmission of obesity-related diseases. Further studies are warranted to elucidate the molecular mechanisms underlying these effects, particularly regarding placental nutrient sensing, inflammatory modulation, and offspring metabolic regulation.
Acknowledgements
The authors are grateful to CAPES and CNPQ for scholarships and Universidade Federal de Mato Grosso – UFMT for financial support of the research. The authors gratefully acknowledge the excellent technical assistance of Morenna Alana Giordani, Cleberson Lira and Jeandson Carneiro of UFMT.
Author contribution
Daniel Izidoro Ferreira da Silva: Investigation, Methodology, Formal analysis, Data curation, Writing – original draft; Isabelle Zanata Fabiane, Adriano Andrade Pio, Arthur Michels Avancini and Valentina Rodrigues: Formal analysis, Methodology, Writing – review & editing; Robert F. H. Dekker: Resources, Formal analysis, Data curation, Writing – review & editing; Aneli M. Barbosa-Dekker: Resources, Formal analysis, Writing – review & editing; Pâmela Alegranci: Methodology, Investigation, Data curation, Writing – review & editing; Júlio Cezar de Oliveira: Methodology, Investigation, Data curation, Writing – review & editing; Eveline Aparecida Isquierdo Fonseca de Queiroz: Conceptualization, Methodology, Investigation, Data curation, Supervision, Writing – review & editing.
Financial support
The authors are grateful to CAPES (proc. n°. 23108.008665/2024-44 – Isabelle Fabiane) and CNPQ (proc. n°. 23108.066299/2025-29 Adriano Andrade Pio; proc. n°. 23108.066307/2025-37 Arthur Michels Avancini; proc. n°. 23108.066310/2025-51 Valentina Rodrigues) for scholarships and Universidade Federal de Mato Grosso – UFMT (proc. n° 23108.025396/2024-81 – Eveline Queiroz) for financial support to the research.
Competing interests
None of the authors have a personal or financial conflict of interest.
Ethical standards
The experimental protocols were developed in accordance with the standards of the Ethics Committee for Animal Use and Experimentation of the Federal University of Mato Grosso, approval protocol number 23108.072920/2023-21. The experimental procedures were performed in accordance with the Guide for the Use and Care of Laboratory Animals.
The authors declare the use of artificial intelligence tools, specifically DeepL, Paperpal, Gemini and ChatGPT, exclusively for the purpose of translating the manuscript into English and not for analyzing information or interpreting results. The authors reviewed, edited, and approved of the final version of the text.
Authorship
All authors have read and approved of the final version of the manuscript.